
5
Lake Okeechobee Regulation
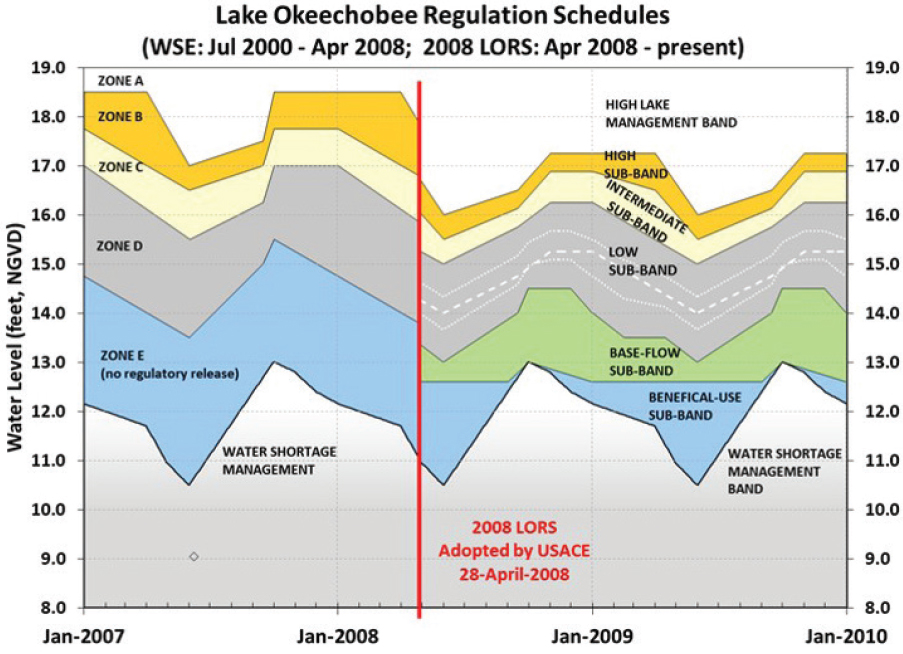
Lake Okeechobee is a shallow impounded lake at the center of the greater Everglades that provides a myriad of services critical to South Florida (Figure 1-2). It is the largest freshwater lake in the southeastern United States, with a surface area of 730 square miles (mi2) and a volume in excess of 4 million acre-feet,1 and it is the largest component of water storage in the South Florida ecosystem (NRC, 2005). The water storage provided by the lake, the quality of that water, and the manner in which it is released to downstream ecosystems, all have implications for the success of the Central Everglades Restoration Plan (CERP). The amount of water stored in Lake Okeechobee during the wet season affects the frequency and magnitude of regulatory discharges to the Northern Estuaries. The high water events and algal blooms of 2016 and 2018 provided recent reminders of the central role of water storage and water quality in Lake Okeechobee on ecological conditions in the Northern Estuaries. Storage in Lake Okeechobee also strongly determines the availability of water in the dry season for Everglades restoration and urban and agricultural water supply. Additionally, storage has implications for habitats and resident biota within the lake, including wading birds, a commercially valuable sport fishery, and the endangered Everglade snail kite.
In the next few years, decisions will be made about the provision of storage by Lake Okeechobee as part of an upcoming Lake Okeechobee Regulation Schedule review, scheduled for 2019-2023 (USACE, 2018b). The lake regulation schedule was lowered in 2007 primarily to reduce the risk of catastrophic failure of the Herbert Hoover Dike while rehabilitation efforts were implemented. As a result, hundreds of thousands of acre-feet of potential storage capacity were lost, with adverse implications to the Northern Estuaries, dry season Everglades flows, and water supply (NASEM, 2016) but positive implications to lake ecology (USACE, 2007b). The upcoming Lake Okeechobee Regulation Schedule revi-
___________________
sion will provide an opportunity to evaluate the feasibility and the benefits and risks of allowing higher water levels in the lake once the Herbert Hoover Dike repairs are complete to recapture some of that storage. Recent reports (Graham et al., 2015; NASEM, 2016) have emphasized the importance of water storage to meet the original Everglades restoration goals and to adapt to possible future changes in precipitation.
All of the major attributes of the regional system are considered when new lake regulation schedules are evaluated, and the end result inevitably involves tradeoffs. Analyses of tradeoffs require that the costs, risks, and benefits of the alternatives are well understood, both within the lake as well as to water supply, the estuaries, and the remnant Everglades ecosystem. This chapter seeks to provide insights into the first portion of the tradeoff equation, by examining the impacts of storing an additional 0.5-1.0 foot of water in Lake Okeechobee on the ecology of the lake. The South Florida Water Management District (SFWMD) specifically requested that the committee evaluate the effects of higher water levels on the biota of Lake Okeechobee to help inform future deliberations on water management. The committee recognizes that changes in lake management must be done in a regional system context, because the lake is only one part of a complex, interconnected, water-management project and regional ecosystem.
In this chapter, the committee summarizes the major factors that affect the lake ecosystem, based on the best available data, and highlights additional monitoring, modeling, and research that could be used to reduce uncertainties related to lake management decisions. The chapter begins with an overview of Lake Okeechobee water quality and an update of the Herbert Hoover Dike rehabilitation project, which have important implications for a new regulation schedule. Next, the committee provides an overview of processes by which lake levels affect lake ecology, including uncertainties and key research needs. The committee recommends an ecological monitoring approach that could help to support operational optimization under any regulation schedule, as well as the use of recently developed modeling tools to support a regulation schedule review. The chapter concludes with a brief discussion about tradeoffs in the regional water system, including lake ecology, storage, the Northern Estuaries, Water Conservation Areas (WCAs), the Everglades, water supply, navigation, and flood management.
WATER QUALITY
The water quality of Lake Okeechobee affects the ecological condition of both the lake and downstream ecosystems. Release of large amounts of water from the lake can contribute nutrients and seed the formation of toxic algae
blooms in the Northern Estuaries (Phlips et al., 2012). The movement of phosphorus-rich water from the lake to the south necessitates more extensive treatment to meet water quality standards before it can be used for Everglades restoration. Phosphorus pollution in Lake Okeechobee is a tremendous challenge in respect to substantive remediation of the South Florida ecosystem (Dunne et al., 2011).
Phosphorus enrichment of the lake dates back to the mid-1900s. Historically, cattle ranching was the main agricultural use of the watershed north of the lake, but from the 1950s to the 1960s, dairy farming increased eight-fold, with a corresponding increase in phosphorus exports from 250 to 2,000 metric tons/year (Flaig and Havens, 1995). When combined with improved drainage throughout the watershed, nutrients were quickly transported from sources to wetlands, rivers, and ultimately Lake Okeechobee. Many of the historic sources have been remediated, and loads at point sources have declined (Julian et al., 2013, 2014, 2015, 2016; Payne and Xue, 2012; Piccone, 2010, 2011). However, a large amount of legacy phosphorus remains throughout the watershed (Dunne et al., 2011), which must be immobilized or allowed to purge from the watershed over time for loads to the lake to decline.
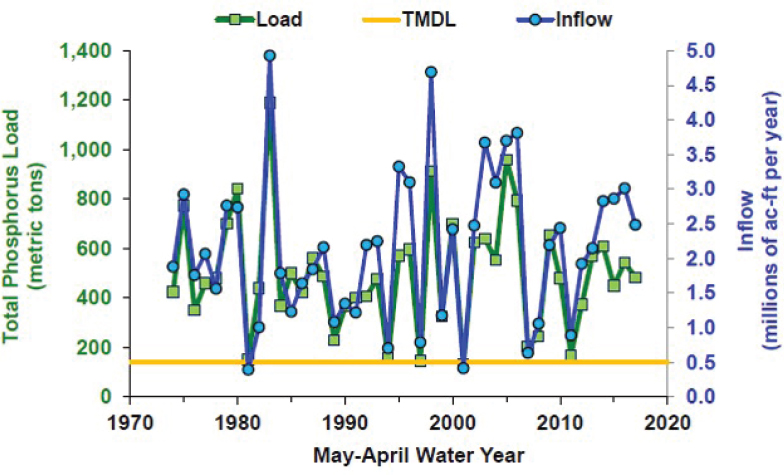
The most recent 5-year (2013-2017) average annual load of total phosphorus to Lake Okeechobee (531 metric tons/year) greatly exceeds the Total Maximum Daily Load (TMDL) for total phosphorus of 140 metric tons/year. The TMDL was established to achieve a lake water concentration of total phosphorus below 40 parts per billion (ppb) and improve the structure and functioning of the ecosystem (FDEP, 2001; Havens and Walker, 2002). There is considerable year-to-year variation in total phosphorus loading to Lake Okeechobee largely because of differences in water inflows associated with meteorological conditions (Figure 5-1). Only in extreme drought years, when little water enters the lake, have loads approached the TMDL.
Total phosphorus loading to the lake has not significantly declined over the 1974-2017 period of record (Figure 5-1), despite a large array of projects that have reduced phosphorous sources (Flaig and Havens, 1995; Julian et al., 2013, 2014, 2015, 2016; Payne and Xue, 2012; Piccone, 2010, 2011). The lack of response of loads at the watershed scale reflects the accumulation of legacy phosphorus in the watershed. This legacy phosphorus, which is slowly migrating downstream through soils, sediments, and wetlands, has a mass of approximately 160,000 metric tons (Dunne et al., 2011). It is estimated that if the remaining contemporary phosphorus sources (e.g., active dairies, cattle ranches, vegetable farms) were eliminated, the legacy phosphorus alone is sufficient to maintain a loading rate near 500 metric tons/year for as long as 50 years (Dunne et al., 2011).
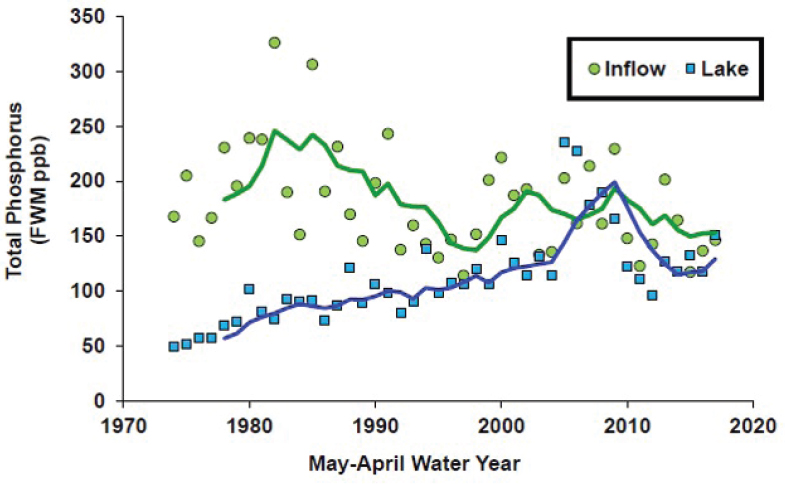
Concentrations of total phosphorus in the open water zone of Lake Okeechobee increased from the period of earliest measurements in the 1970s,
SOURCE: Zhang and Welch, 2018.
reaching a peak of 233 ppb in 2005 (Figure 5-2) following three major hurricane impacts on the lake (Havens et al., 2011). After those hurricane impacts had subsided in 2017 (Ji et al., 2018), the in-lake concentration of total phosphorus was 150 ppb, still far in excess of the goal of 40 ppb. The long-term increases in total phosphorus concentrations in the lake likely are a combined result of the high concentrations in inflowing waters, mobilization of phosphorus from the sediments, and a decreased ability of lake sediments to remove phosphorus from that water (Havens et al., 2007).
Mass balance calculations for total phosphorus conducted since the 1970s show that Lake Okeechobee has been a net sink—more phosphorus enters the lake than leaves it—as phosphorus sorbs to the lake sediment. Net sediment retention of total phosphorus was very high in the early years of monitoring but has slowed considerably since the mid-1990s. The lake continues to display an overall net retention of total phosphorus, but at a lower rate.
Sediment phosphorus retention is a function of inflow, outflow, and water residence time, and it is affected by phosphorus binding in lake sediments. When phosphorus-poor sediments are buried under more recent sediments with
SOURCE: Zhang and Welch, 2018.
a higher phosphorus concentration, those surface sediments have less capacity to sorb phosphorus from the water column. It is common for lakes that have experienced a long history of high phosphorus loading to shift from being a sink to a source of phosphorus (Sas, 1989; Sondergaard et al., 1992). At some point after external loads are greatly reduced and phosphorus-rich sediments are buried with more recent “clean” sediments, this interaction can reverse and the sediments can become a sink for phosphorus. Even with that change, it is estimated that after reaching the phosphorus loads in the TMDL, it could take as long as 40 years for total phosphorus in the water column to appreciably decline (James and Pollman, 2011). As of 2018, a decline in total phosphorus has not even begun, and it will not start until years after the external loads to the lake are reduced.
HERBERT HOOVER DIKE REHABILITATION
In 1930, Congress authorized the Herbert Hoover Dike, which now encircles most of Lake Okeechobee with 143 miles of embankment, five inlets/outlets,
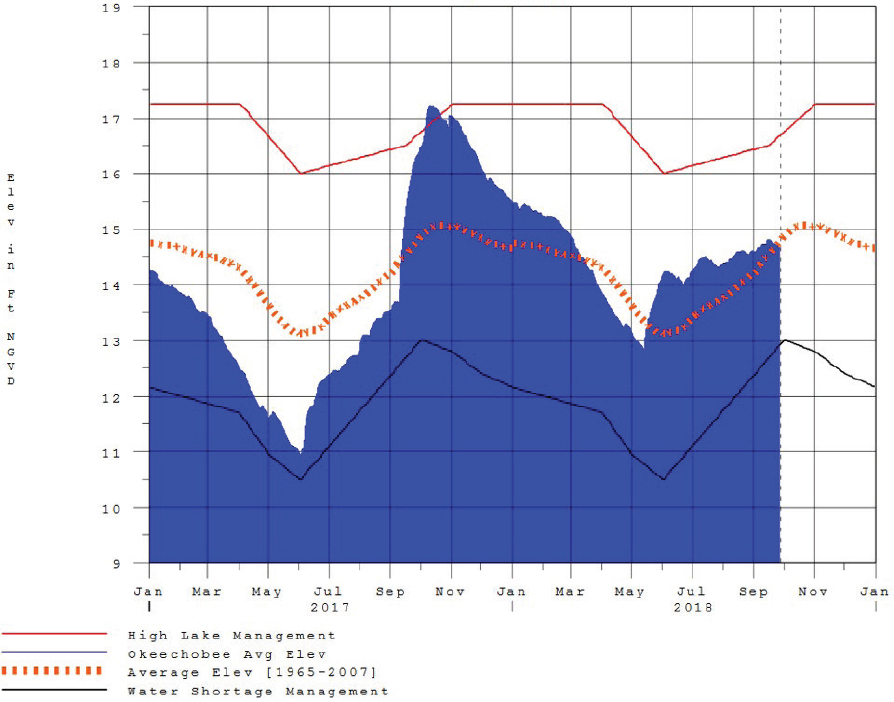
nine navigation locks, and nine pump stations. The capacity of water to flow into the lake greatly exceeds the capacity to flow out, and after large rain events, runoff can result in a rapid increase in lake level. Water levels in the lake are regulated by the U.S. Army Corps of Engineers (USACE) based on a regulation schedule that is a set of seasonally varying rules guiding lake operations. If lake level exceeds an upper boundary set by the regulation schedule, water must be released to reduce the risk of failure of the Herbert Hoover Dike (Figure 5-3).
SOURCE: http://w3.saj.usace.army.mil/h2o/plots/okehp.pdf.
Lake level is allowed to rise prior to the winter dry season to ensure that the amount of water is adequate for downstream agricultural irrigation and for urban uses in South Florida. Lake level is lowered before the summer wet season to provide for maximal storage capacity to accommodate heavy rain events and tropical storms that may occur. Extreme rain events, however, can quickly push the lake level above what is considered safe at a particular time of the year (Figure 5-3). Failure of the embankment would cause massive damage and loss of life. In 2004, the USACE classified the Herbert Hoover Dike as Level 1 (i.e., highest risk) with regard to safety, and a major rehabilitation project has been under way since 2007.
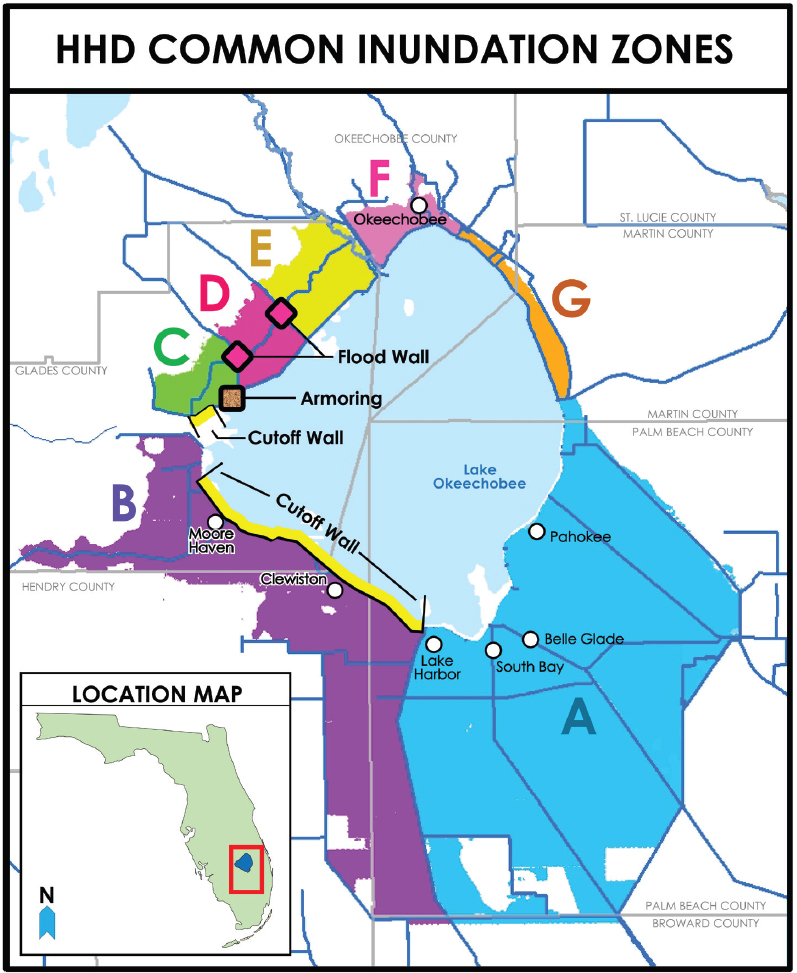
The Herbert Hoover Dike rehabilitation project included a 21.4-mile cutoff wall in the embankment in an area called Zone A (Figure 5-4) that was completed in 2013. An ongoing project to construct an additional 6.6 miles will complete the cutoff wall in Zone A by 2022. In addition, culverts are being replaced around the perimeter of the lake. A USACE dam safety modification report (USACE, 2016d) identified the final measures needed to reduce intolerable risks in the remaining reaches of the Herbert Hoover Dike, based on the current lake regulation schedule. Work in Zones B through D were identified based on the relative probability of failure associated with internal erosion or overtopping of the embankment. Rehabilitation measures proposed include a 24.5-mile cutoff wall in Zone B, a 4.1-mile cutoff wall in Zone C, armoring of bridge abutments in Zone C, and embankment flood walls in Zone D (Figure 5-4). To date, the USACE has invested over $1 billion in the rehabilitation work, which is estimated to cost more than $1.8 billion in total (USACE, 2018g).2 Completion of the project was anticipated by 2025, but in July 2018, the USACE announced $514 million in supplemental funding to expedite the Herbert Hoover Dike rehabilitation (USACE, 2018b). With USACE supplemental funding from the Disaster Relief Requirements Act of 2018, intended to reduce risk from future floods and hurricanes (Public Law 115-123), combined with projected fiscal year (FY)2019 funds and $100 million in state funds, the USACE estimates that the Herbert Hoover Dike rehabilitation project will be completed in 2022.
While the rehabilitation project is under way, Lake Okeechobee is being operated under a protective regulation schedule (Lake Okeechobee Regulation Schedule [LORS] 2008). As with prior schedules, LORS 2008 proactively pushes water out of the lake in advance of the hurricane season, but this schedule lowered the seasonally variable bands that determine when and how much water is to be released (Figure 5-5). On average, the LORS 2008 keeps the lake 1 foot lower than the earlier Water Supply/Environmental (WSE) regulation schedule.
___________________
2 See http://www.saj.usace.army.mil/Missions/Civil-Works/Lake-Okeechobee/Herbert-HooverDike/.
SOURCE: USACE, 2016d.
SOURCE: SFWMD.
The recent management schedule has the potential to remove between 460,000 and 800,000 acre-feet of storage from the regional system at any given time compared to the lake regulation schedule under which the CERP was developed (NASEM, 2016). USACE (2016d) noted that any revisions to LORS 2008 would require an updated Herbert Hoover Dike risk assessment, which could be undertaken concurrently with rehabilitation efforts. Because the storage capacity of Lake Okeechobee affects the amount of storage needed in other parts of the regional system, NASEM (2016) recommended that the process to revise LORS 2008, then scheduled for completion in 2025, begin as soon as possible. The July 2018 Draft Integrated Delivery Schedule (USACE, 2018a) advances this
timeline, with a scheduled start date in 2019 and completion in 2023, 1 year after the scheduled Herbert Hoover Dike completion.
LAKE HYDROLOGY AND ECOLOGY
The upcoming review of the Lake Okeechobee Regulation Schedule will consider many factors including dam safety, environmental benefits and impacts to the Northern Estuaries and the remnant Everglades, effects on water supply, and ecological impacts within the lake. This section provides an overview of the key characteristics of Lake Okeechobee that influence the effects of changing lake levels on lake ecology and discusses potential ecological effects of a deeper lake.
Conditions That Modulate the Effects of Altered Lake Levels
To fully discern how changes in the magnitude, timing, and duration of high and low water affect the ecosystem, it is critical to understand some unique properties of Lake Okeechobee that influence water quality, currents, shearing stress of wind and waves, and horizontal transport of nutrients. Those conditions fall into three general categories addressed below: morphometry of the lake bottom; impoundment of the lake; and lake sediment type, hydrodynamics, and spatial distribution of nutrients. Throughout these discussions, lake level (or stage) refers to the surface elevation of the lake above mean sea level, while depth refers to water depth at a particular location.
Morphometry of the Lake Bottom
When viewed from a satellite image, the lake appears to have just two zones—a western littoral zone with emergent vegetation and a large pelagic zone with a homogeneous open expanse of water. However, five distinct zones occur in the lake, largely controlled by the bottom topography, water column depth, sediment type, and proximity to major inflows (Figure 5-6; Phlips et al., 1993a). The central pelagic zone has a relatively flat bottom and a water column depth that typically is 14 to 16 feet, depending on the surface elevation of the lake. Along the south and west shoreline is a shelf where the water depth is shallower—in the 3- to 5-foot range. In this near-shore zone, tens of thousands of hectares of submerged aquatic vegetation (SAV) can occur, including both vascular plants and benthic macro-algae (Havens et al., 2002; Hwang et al., 1999). The near-shore zone is separated from the central pelagic zone by an ancient limestone reef that sometimes is exposed under low lake conditions. Between
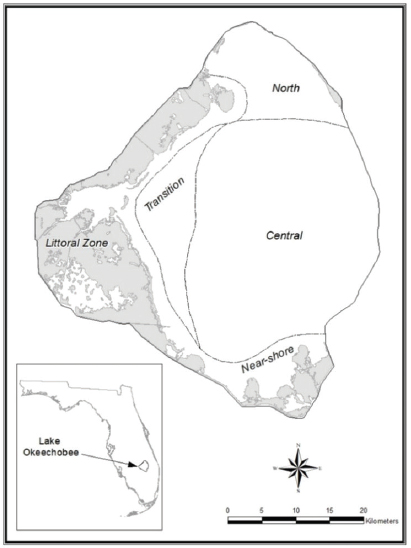
SOURCE: Phlips et al., 1993a.
much of the near-shore zone and the central pelagic zone is a transition zone where underwater irradiance and nutrient conditions are optimal for formation of algal blooms. Westward of the near-shore zone is the littoral zone, with water column depths of 1 to 3 feet and emergent, floating, and SAV. At times, depending on inflow conditions, the north pelagic zone can be quite distinct from the central pelagic, resulting in a fifth zone with high nutrient concentrations and dissolved organic color from riverine inflows.
Historically Lake Okeechobee had no natural impoundment except for some limited areas of organic berm created when the lake level was very high because detritus pushed up onto the land. When periods of heavy rain caused the lake to rise, the lake spread outward to the west and south into the Everglades (McVoy et al., 2011), becoming a deeper but also much larger lake with an expansive littoral zone extending far to the west and south. There always were shallow water areas for fish, wading birds, and other biota that required shallow flooded habitat.
Impoundment of the Lake
When Lake Okeechobee was encircled by the Herbert Hoover Dike, its natural configuration was lost and the lake became a large shallow basin with a steep rim. In the impounded lake, a littoral zone developed in the shallowest area along the western shore. This zone accounts for approximately 35 percent of the lake surface area and has a diverse assemblage of plants, with sawgrass, spikerush, and surface periphyton mats, much like the Everglades. When the lake level rises to 15 feet in the impounded lake, water meets the edge of the dike, and the entire littoral zone has standing water. When the lake rises higher, the littoral zone is flooded with deeper water. Depending on antecedent conditions and the duration of flooding, this can have adverse effects on vegetation, fish, and other biota that are described in detail later in this chapter.
Lake Sediment Type, Hydrodynamics, and Spatial Distribution of Nutrients
Historically most of the area encompassed by the Herbert Hoover Dike had sand sediments, with peat sediments at the southern end of the lake. Because of agricultural activity and the straightening of the Kissimmee River upstream, the central pelagic zone has accumulated nearly 5 million cubic meters of organic mud sediments (Fisher et al., 2001) that are rich in phosphorus and easily entrained into the overlying water column by wind and waves (Havens et al., 2007; Jin and Sun, 2007). As a result, the central pelagic zone often is highly turbid, with low light penetration, light-limited primary production (Aldridge et al., 1995), and total phosphorus concentrations in excess of 100 ppb (Havens et al., 2007).
The near-shore zone, overlying sand and peat, may have considerably greater light penetration, nutrient-limited phytoplankton, total phosphorus in the 30 to 50 ppb range, and widespread SAV (Havens, 2003). Total phosphorus concentrations in the interior region of the littoral zone can fall below 10 ppb.
The spatial heterogeneity in phosphorus concentrations diminishes as lake level rises from 15 to 17 feet or more. When lake level is below 15 feet, circulation is constrained to the central pelagic zone by the southern and western limestone reef, and heterogeneous conditions can occur between the pelagic and near-shore zones. As the lake rises from 15 to 16 feet, the circulation of nutrient and sediment-rich water from the pelagic zone extends across the entire pelagic zone including the near-shore zone, and the lake becomes homogenized, with similar concentrations of total phosphorus and suspended solids, and low light penetration (Havens et al., 2007). When the lake level is at 17 feet, the nutrient- and sediment-rich water is transported into the littoral zone (Aumen and Wetzel, 1995; Jin and Sun, 2007).
Potential Ecological Effects of a Deeper Lake
A revised lake regulation schedule potentially could allow for deeper water in the lake. Predicting how the ecosystem would respond to deeper water is complex, because effects of water depth on critical habitat and biota are related to time of year, duration of the increased depth, rate of change in depth, and antecedent conditions of the biota (robust, recovering, or impacted). There has been considerable research, involving both controlled experiments and long-term assessment, to document the effects of hydrology on the ecology of Lake Okeechobee (Havens, 2002; Havens and Gawlik, 2005; Johnson et al., 2007), and yet uncertainties remain because of the complex influencing factors. The following sections summarize the best available information for each of the major ecological zones, with an identification of uncertainties and research needs, where applicable.
Pelagic Zone
The pelagic zone, including both the central and northern portions, is the largest and deepest part of the lake. This region generally is highly turbid, cannot support SAV, and its water quality is largely determined by wind-driven resuspension of phosphorus-rich sediments. The central pelagic zone occasionally has widespread and intense blue-green algae blooms (Havens et al., 2016), but these are rare with occurrence related to prior high inputs of nutrients during a wet period followed by hot calm conditions. Maintaining a high lake level does not appear to adversely affect the ecology of the pelagic zone.
Near-Shore Zone
The near-shore zone has two different states—a clear-water state with abundant SAV and a turbid, phytoplankton-dominated state without SAV (Aumen and Wetzel, 1995), similar to other shallow eutrophic lakes in the temperate zone (Scheffer, 1989; Scheffer et al., 2001). When nutrients enter the near-shore zone while it has abundant SAV, those plants and their associated periphyton sequester phosphorus at a rapid rate (Hwang et al., 1999), which appears to suppress phytoplankton from forming blooms. When SAV is sparse or absent, nutrient inputs can stimulate blooms of phytoplankton, particularly cyanobacteria, in the near-shore zone (Phlips et al., 1993b). There is a delicate balance between a clear state and a turbid state, depending on factors including high water levels. A catastrophic event such as a major hurricane can shift the near-shore zone of Lake Okeechobee from the clear to turbid state (Havens et al., 2011). Once that
happens, recovery to a clear state may not occur without some counteracting event, such as a drought (Ji et al., 2018).
The near-shore zone of Lake Okeechobee provides a number of ecosystem services. It supports a recreational fishery, is an area for bird watching, and, when it has a high density of plants, is an area that sequesters nutrients from the lake water and prevents near-shore algal blooms (Aumen and Wetzel, 1995). Water level, the seasonality of water level changes, and the rates of change could affect a myriad of plants and animals in this zone (Havens and Gawlik, 2005; Johnson et al., 2007). Research has shown that by assessing the effects on two components of this zone—SAV and bulrush—effects on other biota can be inferred.
Submerged aquatic vegetation. SAV provides critical ecosystem services (Aumen and Wetzel, 1995), stabilizing lake sediments, preventing resuspension, and reducing water column turbidity. The near-shore zone with its SAV is a transitional location for a variety of fish species, as they start life in the littoral zone and subsequently move into the near-shore and then the pelagic zone as they mature (Fry et al., 1999). These fish, in turn, provide a food source for wading birds.
Major factors controlling the spatial extent and growth of SAV in the nearshore zone are sediment type and light availability. The latter is affected both by depth and light-attenuating particles in the water column. Research has quantified the light requirements of different species of SAV in Lake Okeechobee (e.g., Grimshaw et al., 2002), the recovery of SAV from high water stress (Havens et al., 2004; Steinman et al., 2002), and the capacity of the seed bank of the nearshore sediment to provide resilience to SAV after periods of loss (Harwell and Havens, 2003).
Submerged aquatic vegetation modeling efforts in Lake Okeechobee have included both simple (e.g., Harwell and Sharfstein, 2009; Havens et al., 2002) and complex (e.g., Jin and Ji, 2013) approaches. The SFWMD recently documented a strong inverse relationship between the spatial extent of SAV and the minimal lake level between May and August (the growing season) (Figure 5-7). In years when lake level decreased to 12 feet, the spatial extent of total SAV was three times greater than years when the lake depth decreased to only 15 feet. These results suggest that achieving that yearly low water level is important to having widespread SAV in Lake Okeechobee. Although the relationship between spatial extent of total SAV and minimal annual depth was highly significant, for the vascular plant component of the SAV (which is most important as habitat for fish), depth explained just 45 percent of the year-to-year variation. It is not clear what other factors accounted for the remaining 55 percent. Further, little is known about how the SAV will respond to a change in depth at a particular time, because of the aforementioned influence of turbidity, wind energy, and
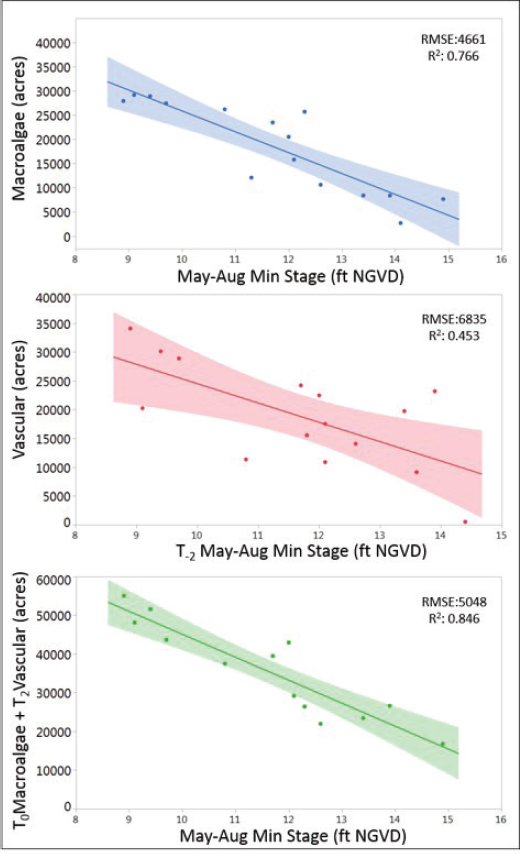
SOURCE: Zach Welch, SFWMD, personal communication, 2018.
antecedent conditions on that response. For example, in a year when the SAV is robust following prior years of drought, the effects of not attaining a low lake level of 12 feet might be minimal compared to a year when the SAV is depleted by prior years of high water. Further research is needed to discern with greater certainty how the SAV in Lake Okeechobee responds to changes in water depth and lake level.
Near-shore emergent plants. Emergent plants including bulrush (Schoenoplectus spp.) occur in bands along the western shoreline of Lake Okeechobee, providing ecosystem services such as serving as a substrate for invertebrates consumed by various species of fish, producing seeds valuable as food for many species of water birds, attenuating wave energy that protects the edge of the littoral zone, and serving as a refuge where SAV can grow on the leeward side of the emergent plants (Aumen and Wetzel, 1995; Coops et al., 1996). In Lake Okeechobee, this emergent plant community is rooted at about 10 feet in elevation, so stems of 6 feet in length or less are fully submerged at a lake level of 16 feet. In many emergent vegetation species such as Schoenoplectus spp., their stems consist of very porous plant tissue that allows for gas transport from the atmosphere to the anoxic soils, where it supplies oxygen to the roots and can detoxify potentially harmful compounds such as hydrogen sulfide. By definition, emergent plants are rooted in the soil, typically with the lower portions of their stems under water and the upper portion of their stems, leaves, and reproductive organs above water. If the plants are fully submerged, the exchange of oxygen and carbon dioxide gasses between the shoots and roots is prevented, eventually leading to plant death. When fully submerged, the stems would be exposed to greater wave energy, which could result in mechanical damage to the plants (Cronk and Fennessy, 2001; Vymazal, 2011). Although the committee was unable to find information on the height of the near-shore vegetation in Lake Okeechobee, the height of S. californicus (giant bulrush) in North America is typically 5-8 feet (USDA, 2003), but the University of Florida Center for Aquatic and Invasive Plants cites heights as tall as 10 feet.3
There is a large literature on how emergent plants respond to flooding, although the studies have addressed smaller variations in depth than that which occurs in Lake Okeechobee. In addition, most of the studies have been of a relatively short duration (months), despite Squires and Van Der Valk (1992) identifying that “three years seems to be the minimum time needed for a definitive water-depth tolerance study.”
Lentz and Dunson (1998) conducted a greenhouse experiment, during which northeastern bulrush (Schoenoplectus ancistrochaetus) was subjected to
___________________
3 See https://plants.ifas.ufl.edu/plant-directory/schoenoplectus-californicus/.
varying water levels from –5 to +10 cm (–2 to + 4 in) of the soil surface and attributes of above- and below-ground biomass were examined. In the 9-month experiment, the ratio of below-ground to above-ground biomass decreased with increasing water level, as did the ratio of live to dead shoot biomass. The authors concluded that “even moderate changes in water level may be an important factor [affecting] growth.”
Sloey et al. (2016) conducted a similar experiment, with mesocosms to create 0, 40, 60, and 100 percent hydroperiods and to evaluate responses of seedling and adult S. acutus and S. californicus (the latter being one of the dominant species in Okeechobee) over a 7-month period. They also compared experimental results with findings from field surveys that examined tolerance to different water depths. In the experimental treatment under the longest hydroperiod, where soil oxidation-reduction potentials were lowest and hydrogen sulfide was detected, the survival of S. acutus adults was reduced and mortality of the seedlings of both species was 100 percent. Adult S. californicus were considerably more tolerant of flooding than S. acutus, both in the experiments and in the field. In the experiments, prolonged flooding negatively affected S. acutus, while S. californicus stems elongated with increased flooding (up to 60 cm or 23.6 in depth). S. californicus also was found at the most deeply flooded field sites, where it was noted that the plants maintained their characteristic stem strength, rendering them more tolerant of wave energy. In regard to S. californicus, the authors concluded that it “is an excellent species for establishment in high energy tidal environments under a variety of flooding regimes.”
Squires and Van Der Valk (1993) identified another factor in addition to shoot morphology that allows S. californicus to tolerate prolonged flooding—the species can survive as below-ground tubers for 1-2 years in areas too deep for the plants to grow. Microtopographic variation of lake sediments, which produces different effects of variation in hydroperiod, is also important in the recovery of lake vegetation including Schoenoplectus sp. (Nishihiro et al., 2006).
Just one experimental study has been conducted to evaluate effects of prolonged flooding on S. californicus collected from Lake Okeechobee, although it too was of short duration (80 days). Smith and Smart (2005) submerged clusters of mature, 3-foot-tall S. californicus at various depths in a pond and then measured changes in above-ground and below-ground biomass and stem density. The researchers concluded that “undisturbed bulrush might persist at 3 feet inundation or less, however inundations of greater than 3 feet appear excessive and prolonged periods of greater inundation might cause bulrush stands to fail.” The possibility of reemergence of plants from tubers during a subsequent low-water period was not investigated.
This is a snapshot of a large literature on flooding of shoreline emergent plants, with a focus on Schoenoplectus, because it has been a focus of SFWMD ecological monitoring in Lake Okeechobee and because its spatial extent is one of the CERP performance measures from the Lake Okeechobee Conceptual Ecosystem Model (Havens and Gawlick, 2005). Research dealing with S. californicus supports the view that these plants are well adapted to high-energy shoreline environments, they can tolerate brief periods of total inundation (80 days), and they have approaches to recover from tubers after periods of prolonged flooding. It remains unclear how prolonged flooding at high lake levels might affect the long-term extent and survival of emergent vegetation in the near-shore zone of Lake Okeechobee, which periodically experiences droughts that could allow the plants to recover, both from tubers and by seed germination. A greater understanding of the extent and distribution of viable tubers and seeds could help in predicting the ability of the community to recover from flooding events.
Given the ecological importance of bulrush and co-occurring near-shore plant species in the lake, long-term experimental studies of inundation and the frequency and distribution of stem lengths could provide valuable information to guide planning and inform real-time operational decisions. For example, knowing the frequency distribution of stem lengths and elevations would allow biologists to tell water managers what percentage of the vegetation would be completely submerged at a particular lake depth. A focused monitoring program could also improve the understanding of the time frame for which the plants can tolerate sustained inundation.
Littoral Zone
The diverse mosaic of native vegetation that historically characterized the littoral zone provided an array of ecosystem services (Aumen and Wetzel, 1995). It provided habitat for fish, reptiles, amphibians, migratory birds, and snail kites. The plant assemblage historically was dominated by spikerush, willow, sawgrass, and floating-leaved plants and, in some places, dense surface mats of periphyton. The littoral zone is the most biologically diverse part of the lake, with an estimated 14 bird species, 40 species of adult fish, 35 species of young fish, and 170 invertebrate species along with 30 distinct groups of plants (Havens et al., 1996; Richardson and Harris, 1995).
High lake levels and associated advection of phosphorus into littoral zone areas that normally are nutrient poor could have a variety of adverse effects on the structure and function of the ecosystem (Havens, 2002). These high water impacts include cattail expansion, erosion of the littoral fringe, and impacts to snail kites and wading birds.
Cattail expansion. When lake level rises from 15 to 17 feet, there is an ever-increasing transport of phosphorus from the pelagic zone to the near-shore zone, and eventually into the littoral zone, through natural inlets and boat cuts (Aumen and Wetzel, 1995). Intrusion of phosphorus-rich water results in conversion of areas of diverse plants into cattail monocultures. As in the WCAs, dense cattail monocultures do not provide suitable habitat for fish and birds, and habitat that changes to cattail because of nutrient pollution does not naturally recover to native plants. Hence, the plants of the littoral zone are much less resilient to effects of high water than are the SAV and near-shore emergent vegetation.
Recent vegetation maps (Figure 5-8) suggest that a large part of the littoral zone has undergone a transition to cattail, possibly because of past high water events and influxes of phosphorus. The SFWMD recently eradicated cattail with large treatments of fire and herbicide (the black areas in the second vegetation map). Additional mapping and surveys of birds, fish, and other biota are needed to discern the extent to which native vegetation and its associated ecosystem services return after the treatments. Furthermore, the lake has experienced a substantial increase in the invasive torpedograss Panicum repens in the past two decades, and any research and management dealing with cattail also needs to consider this species.
Erosion and berm formation along the littoral fringe. During times of sustained high water levels (near 17 feet), there has been considerable erosion of the edge of the littoral zone and accumulation of large amounts of organic debris along the littoral-nearshore fringe, particularly during high wind events (Havens et al., 2002). The presence of a long-lasting organic berm along the littoral-nearshore interface is a concern because many species of fish in Lake Okeechobee migrate from the littoral to the pelagic zone as they mature (Fry et al., 1999). Blocking the interface could affect the fish assemblage of the lake, the economy they support, and the biota that depend on those fish as food resources. Previously, this organic debris has required removal with heavy construction equipment, which was only possible when a drought left the area dry. One uncertainty is the degree to which the berm formation documented by Havens et al. (2002) was a result of high water alone or high water combined with uprooting of SAV and high wave energy from a hurricane.
Everglades snail kites. One of the critical ecosystem services provided by Lake Okeechobee is habitat for the federally endangered Everglades snail kite. Bennetts and Kitchens (1997) found that the littoral zone of Lake Okeechobee provided a critical habitat of “last refuge” during times of regional drought, when other locations including the WCAs and Kissimmee wetlands were dry. Fletcher
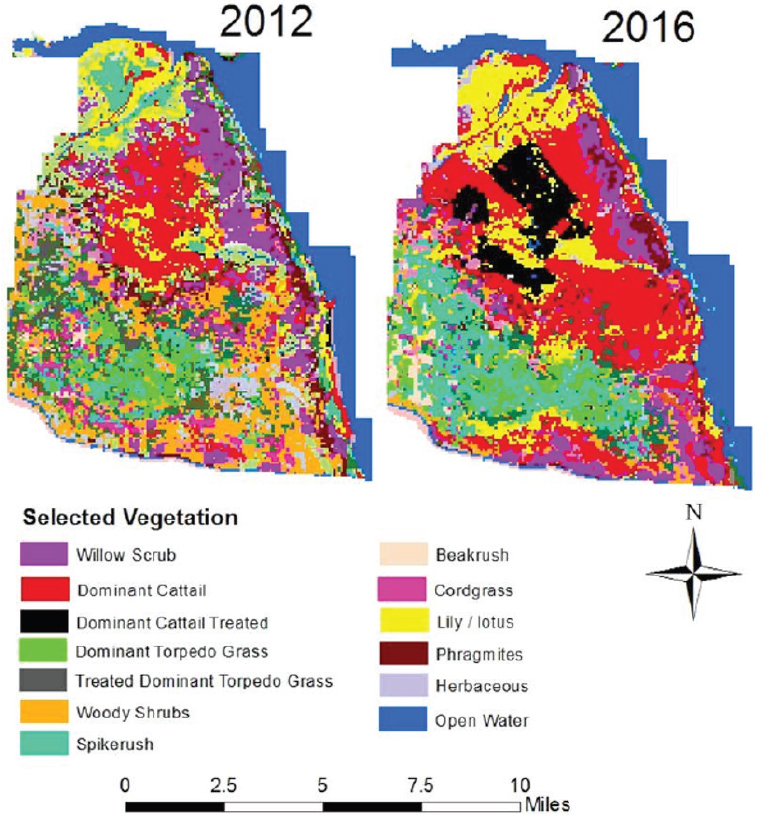
SOURCE: Charles Hanlon, SFWMD, personal communication, 2018.
et al. (2017) noted that from 2010 to 2014, the littoral zone of Lake Okeechobee was one of the three most productive wetlands in South Florida for snail kites, contributing to 40 percent of the range-wide fledgling production. The 2016 nesting season in Lake Okeechobee was extensive, with active nests observed from January to November. From a landscape perspective, the littoral zone of Lake Okeechobee is an important central node in a system of regional habitat “modules” (Riechert et al., 2016), allowing for connectivity between a northern and southern component of the regional population network.
Water levels in Lake Okeechobee affect the vegetation structure and its suitability for kite nesting. The eggs of apple snails (the kite’s only food source) are laid on the stems of emergent plants, and these eggs die if flooded. The same holds true for kite nests. It is not clear that there is a specific lake level of concern in this case, because the major risk factor is a reversal of lake level (periods when the lake level is declining and then suddenly increases) after kites have constructed their nests above the water surface or after apple snails have laid their eggs. This could happen with a reversal from 14 to 15 feet or a reversal from 15 to 16 feet.
Wading birds. The littoral zone of Lake Okeechobee provides one of the major habitats for wading birds in the regional ecosystem, including heron, ibis, egret, spoonbill, and wood storks (Chastant et al., 2017; Smith et al., 1995). Like snail kites, the littoral zone can serve as a habitat of last refuge for wading birds in years when other areas of the regional ecosystem are dry. However, because wading bird density in Lake Okeechobee is partially a function of the condition in wetlands outside the lake, it remains challenging to fully understand how wading birds respond to variations in water level in Lake Okeechobee.
From January 1988 to September 2002, a comprehensive field study was conducted to quantify the foraging habitats of wading birds in the Lake Okeechobee littoral zone (Smith et al. 1995), including colony turnover, nesting success and productivity, and causes of nest failure (Smith and Collopy, 1995). Wading birds nest in late winter to early spring, when adults forage for small fish to feed fledglings. The study documented that nesting success and foraging both are favored by (1) a spring recession; (2) low to moderate water depths (depths not specified by the authors); and (3) a lack of reversals of water level. As with kites, reversals result in the flooding and loss of wading bird nests, as animals place their nests at a height determined by their perception of future water levels. The researchers provided a specific management recommendation: “moderately high winter lake level [15 feet] followed by a moderate-paced, steady and protracted (5-6 month) recession in water level beginning in December or January.” This study led to the development of what has become known as a “spring wading bird window”
that continues to be used to evaluate regional planning alternatives. The wading bird researchers also noted that periodically it could be beneficial to have protracted periods of high lake level (15.0 to 15.5 feet) that could allow prey to concentrate, before a year of spring recession.
Chastant et al. (2017) examined empirical relationships between nesting patterns of wading birds and Lake Okeechobee hydrology from 1977 to 1992. This study found that both hydrology and vegetation structure affect nesting success. In particular, the spatial extent of willow (Salix spp.) is an important determinant of nesting success. The authors found that nesting numbers and fledgling success were highest with spring water levels falling to the 12- to 13-foot range in a predictable manner. The birds could then establish nests that would be safe from flooding, and the receding water would concentrate prey resources (small fish) in water shallow enough for foraging by both long- and short-legged birds.
MONITORING TO GUIDE OPERATIONAL OPTIMIZATION
From the past research, there is a robust understanding of how certain ecological attributes respond to water level in Lake Okeechobee, yet uncertainty about a number of critical responses remains. There is relatively high certainty that water level reversals negatively affect snail kites and wading birds during the nesting season, and that a receding spring water level into the 12- to 13-foot range supports foraging by birds on small fish. There is relatively high certainty that water levels rising from 15 to 17 feet lead to increasing transport of phosphorus from mid-lake to the near shore and then into the littoral zone, and that the phosphorus can cause cattail expansion. There is also relatively high certainty that multiple years of high water, without intervening lows, lead to reduced spatial extent of SAV. Uncertainties exist regarding the duration of flooding tolerated by the SAV because, as noted earlier, responses depend on the antecedent condition of the plants and the other factors associated with high water.
A comprehensive water quality and ecological monitoring program exists for Lake Okeechobee, but there may be opportunities to modify it in ways that increase the value of the information collected for decision making. For example, the sampling of SAV includes a yearly mapping program to discern the spatial extent at the end of the summer season, and it includes quarterly sampling of transects in the region where SAV is known to occur. If that quarterly sampling were replaced by more frequent sampling of SAV at a smaller number of sentinel sites, data on the recent condition of the SAV (e.g., robust, recovering) could be used to predict the likely impacts to SAV of holding more water in the lake at that time and could inform real-time water management decisions regarding lake management. Over time, continued data collection would test the validity
of the prediction, building the knowledge base about effects of depth on this plant assemblage. Targeted monitoring could also enhance understanding of the effects of high water conditions on plants and animals in the lake, thereby informing the lake regulation planning process and improving the performance of the Lake Okeechobee environment model.
MODELING
In the past, evaluation of lake regulation schedules has depended largely on regional hydrologic model results and performance measures for select ecological attributes in the lake that are based on past research. Because of the uncertainties described above, there are shortcomings to this approach. Those uncertainties could be reduced by integrating a recently developed and validated lake ecosystem model (Jin and Ji, 2013) into the process. Furthermore, this same model might be used in real time for operational optimization while managing the lake under a particular regulation schedule.
The Lake Okeechobee Environment Model (LOEM) is a coupled hydrodynamic-wind wave-sediment resuspension and transport model with more than 2,100 grid cells and five vertical layers (Jin and Ji, 2001, 2013). The model has a submerged vegetation component that considers wave energy, water depth, turbidity, and plant growth rates in response to light attenuation and sediment nutrients. The LOEM is a tremendous advance over previously used models that treated the lake as one unit, rather than examining vertical and horizontal variability, which today is the norm for ecosystem models. Therefore, it can model sediment resuspension and transport around the lake, as well as phytoplankton and plant densities in particular locations of the lake. The LOEM has effectively predicted the lake-wide spatial extent of SAV and the temporal dynamics (acreage and biomass) at a particular sampling location over a 9-year time period. Because the model can also predict the transport of suspended solids and phosphorus within the lake and the wave energy on the western shoreline, it could be used to predict how a particular water level regime might influence a variety of conditions, including SAV spatial extent, erosion potential at the littoral fringe, and phosphorus movement into the littoral zone. If an empirical relationship can be derived from historical monitoring data, it may also be possible to use the model to predict cattail expansion.
In summary, the SFWMD now has a sophisticated modeling tool to help screen alternatives in a regulation schedule review. The tool might also play a role in projecting how certain key attributes of the lake might respond to future changes in water level as a part of operational optimization. This lake model will need to be used in concert with regional models to evaluate systemwide
benefits and tradeoffs of different approaches to manage the lake and other parts of the broader ecosystem.
TRADEOFFS
The current regulation schedule for Lake Okeechobee holds water at a considerably lower level than the prior schedule. Although this provides potential benefits for nearly every in-lake ecological attribute discussed in this chapter, it may provide widespread negative effects for Everglades dry season flows, the Northern Estuaries, and water supply. Those negative effects happen because of the tremendous loss of regional water storage compared to the earlier lake regulation schedule.
When a new Lake Okeechobee regulation schedule is considered, the analysis of alternatives performed by the USACE must consider the tradeoffs that exist between potential impacts to the condition and ecosystem services of the lake, the availability of water for human uses, and potential benefits to the condition and ecosystem services of downstream ecosystems (i.e., the Northern Estuaries and the remnant Everglades). Regulation schedule evaluations always are performed in this broad regional context. The challenge is to perform a systemwide analysis of alternatives that allows water managers to select a lake regulation schedule that maximizes the benefits, minimizes the adverse impacts where possible, and balances the tradeoffs, considering the latest science and real-time operational capabilities.
CONCLUSIONS AND RECOMMENDATIONS
Lake Okeechobee is the last major component of water storage in the northern end of the South Florida ecosystem to be resolved, and its regulation schedule has significant implications for conditions throughout the ecosystem. The lake regulation schedule will soon be revisited to determine new operational rules. The completion of the Herbert Hoover Dike rehabilitation project could enable higher water levels to be held within Lake Okeechobee, although the feasibility of higher water levels must still be determined through an updated risk assessment. The regulation schedule revision process also considers tradeoffs among the ecological conditions in the lake, the Northern Estuaries, and the Everglades, as well as water supply and flood management. Hydrologic and ecological modeling tools have been developed to assess potential benefits and impacts from various regulation schedules on the lake and broader region. To inform that process and in response to frequent questions about the impacts of increased water levels on the ecology of Lake Okeechobee, the committee sum-
marized the latest information and identified key research needs to help inform the within-lake portion of the tradeoff analysis.
The magnitude of ecological impacts in the lake from additional storage will depend upon antecedent ecological conditions. Improved understanding of these dependencies could be used to inform real-time operations to reduce adverse ecological effects and provide more flexibility given appropriate risk tolerance in lake management. A new regulatory schedule that stores more water in Lake Okeechobee would require tradeoffs between in-lake ecological impacts and ecological and water supply benefits throughout the South Florida ecosystem. Past research has shown that ecological conditions in the lake are adversely affected by high water levels (above ~16 feet) and multiple consecutive years without low water levels (~12 feet). Additionally, reversals of water level recession during spring nesting can adversely affect wading birds and snail kites. However, there are considerable uncertainties about high water impacts to SAV and near-shore emergent vegetation, which provide important ecological services in the lake, because many of the effects of high water depend on antecedent conditions. For example, high stage effects on SAV vary depending upon whether the plants are healthy and mature, stressed, or just recovering after a prior impact. Reducing those uncertainties and using that information to inform operations could reduce the ecological impacts associated with increased storage.
Adjustments to Lake Okeechobee monitoring and full integration of modeling tools would provide rigorous science-based information to support a regulation schedule review and real-time optimization of operations under any regulation schedule. Refinements to the ecological monitoring and adaptive management program could reduce critical uncertainties, inform lake regulation schedule planning, and enhance real-time lake operations. For example, as discussed earlier in this chapter, moving from quarterly transect sampling of SAV to more frequent sampling at just a few representative sites might provide more actionable information and lead to a better understanding of the effects of antecedent conditions. Monitoring could also improve the understanding of the potential impacts from inundation to emergent vegetation in the near-shore zone. Further, the Lake Okeechobee Environment Model is a tool to use in concert with regional hydrologic and ecological models to evaluate the implications of alternative regulation schedules and lake operations, particularly as new data become available to refine the model’s SAV component.
This page intentionally left blank.


