
3
Restoration Progress
This committee is charged with the task of discussing accomplishments of the restoration and assessing “the progress toward achieving the natural system restoration goals of the Comprehensive Everglades Restoration Plan [CERP]” (see Chapter 1 for the statement of task and Chapter 2 for a discussion of restoration goals). In this chapter, the committee updates the National Academies’ previous assessments of CERP and related non-CERP restoration projects (NASEM, 2016; NRC, 2007, 2008, 2010, 2012, 2014). This chapter also addresses programmatic and implementation progress and discusses the ecosystem benefits resulting from the progress to date.
PROGRAMMATIC PROGRESS
To assess programmatic progress the committee reviewed a set of primary issues that influence CERP progress toward its overall goals of ecosystem restoration. These issues, described in the following sections, relate to project authorization, funding, and project scheduling.
Project Authorization
Once project planning is complete, CERP projects with costs exceeding $25 million must be individually authorized by Congress. Water Resources Development Acts (WRDAs) have served as the mechanism to congressionally authorize U.S. Army Corps of Engineers (USACE) projects, and the CERP planning process was developed with the assumption that WRDAs would be passed every 2 years. This, however, has not occurred. In the 18 years since the CERP was launched in WRDA 2000, three WRDA bills have been enacted:
- WRDA 2007 (Public Law 110-114), which authorized Indian River Lagoon-South, Picayune Strand Restoration, and the Site 1 Impoundment projects;
- Water Resources Reform and Development Act (WRRDA) 2014 (Public Law 113-121), which authorized four additional projects (C-43 Reservoir, C-111 Spreader Canal [Western], Biscayne Bay Coastal Wetlands [Phase 1], Broward County Water Preserve Areas [WPAs]); and
- WRDA 2016 (Title I of The Water Infrastructure Improvements for the Nation Act [WIIN Act]; Public Law 114-322), which includes authorization for the $1.9 billion Central Everglades Planning Project (CEPP). WRDA 2016 also authorized changes to the Picayune Strand Restoration Project related to cost escalations to allow for its completion.
A fourth WRDA was passed on October 10, 2018 (just prior to this report’s release) and is expected to be signed into law by the president. WRDA 2018 authorized the 240,000 acre-foot (AF) Everglades Agricultural Area Storage Reservoir proposed in a CEPP post-authorization change report, which was developed by the SFWMD under Section 203 of WRDA 2000. No CERP projects are currently awaiting authorization. Thus, the authorization process does not pose any current delays on CERP restoration progress.
Authorized CERP projects are sometimes classified as Generation 1, 2, or 3 by the WRDA bills in which they were authorized, with the Melaleuca Eradication Project, which was authorized under programmatic authority, included in Generation 1. Section 1132 of WRDA 2016 included a requirement that the Secretary of the Army review completed post-authorization change reports and provide any recommendations to Congress within 120 days of completion of the report, which could potentially reduce administrative delays in CERP planning and authorization in the future.
Funding
Funding for Everglades restoration remains an important constraint on achieving a rate of progress that would be consistent with the original vision for the CERP. Federal funding for the CERP is illustrated in Figure 3-1, which include construction funds and support for planning, design, coordination, and monitoring. After a significant decrease to $44 million in fiscal year (FY) 2014, federal spending has increased to between $70-103 million over the 4 years FY20152018. The FY2019 USACE budget request includes $68 million for the CERP, amounting to 7.8 percent of the agency’s construction budget (USACE, 2018a). Over the most recent 5-year period for which data are available (FY2014-2018), federal funding for Everglades restoration averaged $198 million per year, with
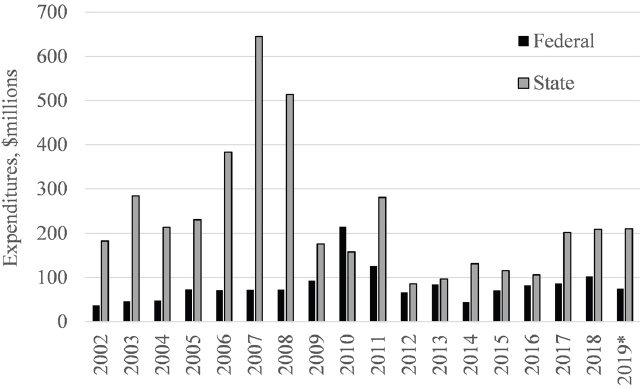
NOTE: Asterisk reflects budget requested.
SOURCE: SFERTF, 2018.
$77 million for CERP and $121 million for non-CERP efforts (Figure 3-2). These data show relatively steady CERP funding and variable non-CERP funding from the federal government.
State budgets for the CERP have sharply increased in recent years, while non-CERP funding has remained steady (Figures 3-1 and 3-2). From FY2014 to FY2018, state restoration spending averaged $153 million for CERP and $581 million for non-CERP efforts. In FY2017 and FY2018, CERP funding exceeded $200 million per year, nearly doubling spending levels over the previous 5 years.
South Florida Water Management District (SFWMD)’s Capital Improvements Plan for FY2018 through FY2022 reflects an intent to continue these higher levels of funding for the CERP. The Capital Improvements Plan calls for a 5-year total of $1.59 billion for surface water projects (an average of $318 million per year). About two-thirds of these projected expenditures are for CERP projects, and another 17 percent is for water quality improvements as part of the Restoration Strategies program (discussed later in this chapter).
The collection of previously authorized CERP projects combined with new projects still in various stages of planning (discussed in more detail later in this chapter) represent a very large financial commitment. Recent CERP project
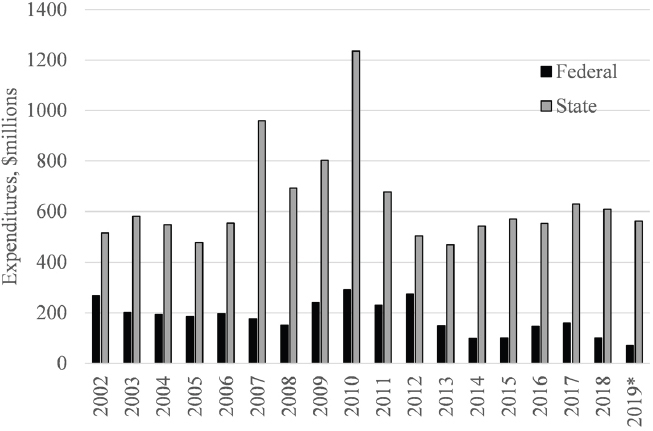
NOTE: Asterisk reflects budget requested.
SOURCE: SFERTF, 2018.
and program cost estimates, including only authorized projects, were approximately $12.3 billion (in 2016 dollars).1 About $3 billion of that was funded through FY2016,2 leaving a balance of roughly $9 billion. The Everglades Agricultural Area (EAA) Reservoir adds an increment of $1.3 billion, and the Lake Okeechobee Watershed Project is currently estimated to cost $1.4 billion. Two other projects in planning—the Western Everglades Restoration Project and the Loxahatchee River Watershed Project—do not yet have tentatively selected plans or cost estimates.
Estimation of annual funding requirements necessary to pay for these projects is dependent on the scheduling and final project costs. If federal funding for CERP projects continues at recent (5-year average) levels and is matched 50-50 by the state, about $155 million is available annually. At that rate, completion
___________________
1 Reflects the $1.98 billion authorized cost of the Central Everglades Planning Project, authorized in 2016, and the $10.3 billion cost (in 2016 dollars) reported prior to authorization.
2NASEM (2016) reported $2.7 billion in state and federal CERP obligations as of FY2016. These obligations have not been inflation adjusted, so the number of $3 billion here is used as an approximation.
of currently authorized projects (including the EAA Storage Reservoir) would take approximately 65 years. With annual funding equal to FY2018 funding of $312 million annually, the timeline for completion of currently authorized projects is reduced to just over 30 years. Completion of projects in planning or currently unplanned CERP projects would lengthen that timeline. Increases in current funding levels would expedite those time horizons in a proportional manner.
Project Scheduling and Prioritization
The anticipated future progress of CERP projects and the relationships among all the federally funded South Florida ecosystem restoration projects and some highly relevant state-funded projects are depicted in the Integrated Delivery Schedule. The Integrated Delivery Schedule is not an action or decision document but rather a guide for planning, design, construction sequencing, and budgeting. The schedule is developed by the USACE and SFWMD in consultation with the South Florida Ecosystem Restoration Task Force and the many CERP constituencies. The Integrated Delivery Schedule replaced the Master Implementation Sequencing Plan, initially developed for the CERP, as required by the Programmatic Regulations (33 CFR §385.30).
An updated Integrated Delivery Schedule was released in July 2018 (USACE, 2018b). The reporting horizon for the 2018 schedule remains only through 2030 as in the previous December 2016 version. Modifications in the latest Integrated Delivery Schedule included numerous changes based on weather-related conditions, executions of contracts, and funding levels. The overall effect of these changes is a continued stretching out of the anticipated timeline for completing most of the authorized projects. Among the most significant programmatic changes is the acceleration of the Lake Okeechobee Regulation Schedule revision (previously to be completed in 2025, but now estimated in 2023) in response to the accelerated Herbert Hoover Dike rehabilitation schedule, with an estimated completion in 2022. The Integrated Delivery Schedule also shows that authorization is expected for the EAA Storage Reservoir in 2018; authorization of the Loxahatchee River Watershed Restoration and the Lake Okeechobee Restoration projects in WRDA 2020; and authorization of the Western Everglades Restoration Project in WRDA 2022. Once authorized, the new projects will create difficult political choices for the CERP program regarding whether to move forward with all projects simultaneously but more slowly or to prioritize some projects over others to expedite benefits.
As noted in NASEM (2016), the key limitations of the Integrated Delivery Schedule are that it is difficult to discern individual project costs or essential dependencies among projects; it does not include the full set of anticipated CERP
projects (only project components scheduled through 2030 are included), giving a false impression on when the CERP will be completed; and there is no longer a requirement that RECOVER assess impacts of changes to the Integrated Delivery Schedule on expected CERP outcomes. The Programmatic Regulations required RECOVER to assess any changes in the master schedule “for effects on achieving the goals and purposes of the Plan and the interim goals and targets” (30 CFR 385.30[b][2]). Documentation of the effects of changes to the schedule on the nature and timing of anticipated ecosystem benefits would inform decisions to maximize regional benefits as soon as possible.
CERP RESTORATION PROGRESS
In the following sections the committee focuses on natural system restoration benefits emerging from the implementation of CERP projects (Figure 3-3). The project discussions are organized in order of authorization. For readers to understand the level of natural system restoration progress to be expected, a brief description of the state of implementation progress for each project is also provided in the text and in Table 3-1. The committee’s previous report (NASEM, 2016) contains additional descriptions of the projects and progress up to October 2016, while this section emphasizes progress or new information gained during the past 2 years. The South Florida Environmental Report (SFWMD, 2018c), the 2015 CERP Report to Congress (USACE and DOI, 2016), and the 2016 Integrated Financial Plan (SFERTF, 2016) also provide detailed information about implementation and restoration progress. The following sections outline the natural system restoration progress based on monitoring to date at CERP projects for which construction has begun.
Generation 1 CERP Projects
Generation 1 projects are those authorized by Congress in WRDA 2007 (Picayune Strand Restoration, Site 1 Impoundment, and Indian River Lagoon-South) or by program authority (Melaleuca Eradication). A summary of implementation progress as of June 2018 is provided in Table 3-1. The location of the various projects is shown in Figure 3-3.
Picayune Strand Restoration
The Picayune Strand Restoration Project, the first CERP project under construction, focuses on an area in southwest Florida substantially disrupted by a real estate development project that drained 55,000 acres (about 86 mi2) of
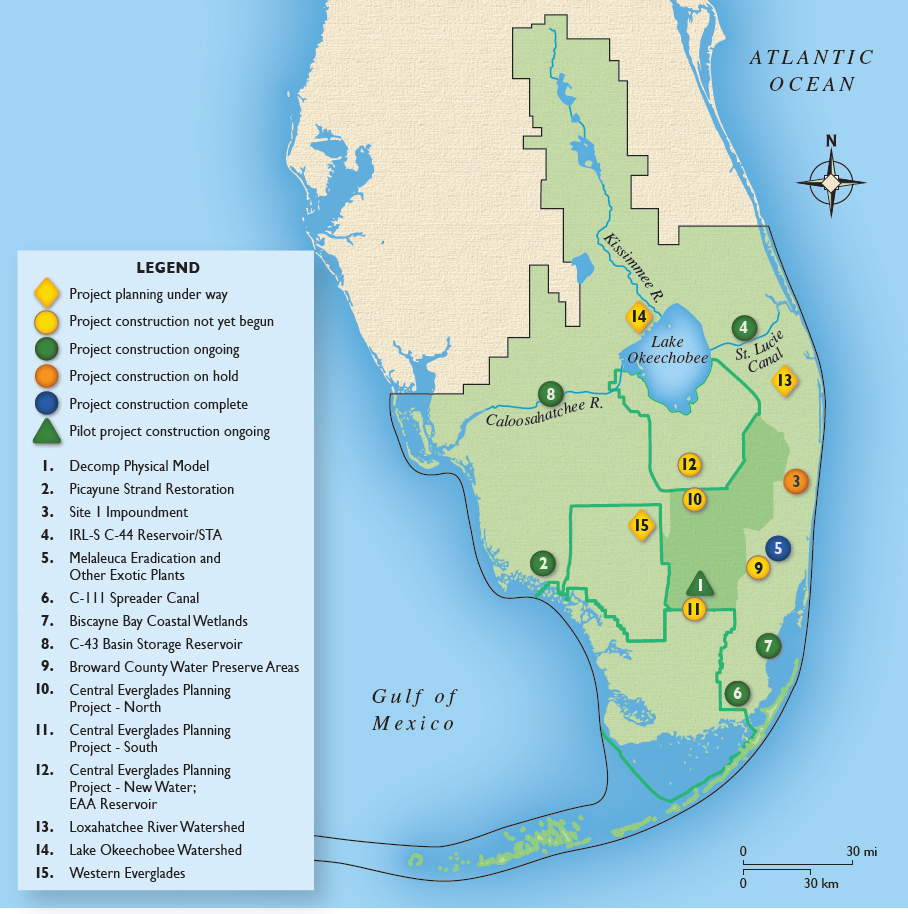
SOURCE: © International Mapping Associates.
TABLE 3-1 CERP or CERP-Related Project Implementation Status as of July 2018
| Project or Component Name | Yellow Book (1999) Estimated Completion | IDS 2018 Estimated Completion | Project Implementation Report Status | Authorization Status | Construction Status | Ecosystem Benefits Documented to Date |
|---|---|---|---|---|---|---|
| GENERATION 1 CERP PROJECTS | ||||||
| Picayune Strand Restoration (Fig. 3-3, No. 2) | 2005 | 2023 | Submitted to Congress, 2005 | Authorized in WRDA 2007 | Ongoing | Increased water levels in 20,000 acres and with early vegetation responses detected |
| Site 1 Impoundment (Fig. 3-3, No. 3) | 2007 | Submitted to Congress, 2006 | Authorized in WRDA 2007 | |||
| - Phase 1 | 2016 | Completed, 2016 | ~16% reduction in seepage loss | |||
| - Phase 2 | Not specified | Phase 2 requires further authorization. | Not begun | NA | ||
| Indian River Lagoon-South (Fig. 3-3, No. 4) | Submitted to Congress, 2004 | Authorized in WRDA 2007 | ||||
| - C-44 Reservoir/STA | 2007 | 2020 | Ongoing | None to date | ||
| - C-23/24 Reservoir/STA | 2010 | 2030 | Not begun | NA | ||
| - C-25 Reservoir/STA | 2010 | 2027 | Not begun | NA | ||
| - Natural Lands | NA | Not specified | Not begun | NA | ||
| Melaleuca Eradication and Other Exotic Plants (Fig. 3-3, No. 5) | 2011 | NA | Final June 2010 | Programmatic authority WRDA 2000 | Construction completed 2013, operations ongoing | Increased capacity for biocontrol |
| GENERATION 2 CERP PROJECTS | ||||||
| C-111 Spreader Canal Western Project (Fig. 3-3, No. 6) | 2008 | 2022 | Submitted to Congress, 2012 | Authorized in WRRDA 2014 | Mostly complete; S-198 structure not yet constructed | Current data insufficient to assess response to project |
| Biscayne Bay Coastal Wetlands (Phase 1) (Fig. 3-3, No. 7) | 2018 | 2022 | Submitted to Congress, 2012 | Authorized in WRRDA 2014 | Ongoing | Some wetland vegetation responses to freshwater inputs; no change in nearshore salinity |
| C-43 Basin Storage: West Basin Storage Reservoir (Fig. 3-3, No. 8) | 2012 | 2022 | Submitted to Congress, 2011 | Authorized in WRRDA 2014 | Ongoing | None to date, construction ongoing |
| Broward County WPAs (Fig. 3-3, No. 9) | Submitted to | Authorized in | ||||
| - C-9 Impoundment | 2007 | After 2030 | Congress, 2012 | WRRDA 2014 | Not begun | NA |
| - C-11 Impoundment | 2008 | 2025 | Not begun | NA | ||
| - WCA-3A & -3B Levee Seepage Management | 2008 | After 2030 | Not begun | NA | ||
| GENERATION 3 CERP PROJECTS | ||||||
| Central Everglades Planning Project (Fig. 3-3, Nos. 10, 11 and 12) | NA | Submitted to Congress, 2015 | Authorized in WRDA 2016 | Not begun | NA | |
| - PPA South | 2030 | |||||
| - PPA North | 2030 | |||||
| - PPA New Water | After 2030 | |||||
| EAA Storage Reservoir (Fig. 3-3, No. 12) | 2015 | NA | Submitted to Congress, 2018 | Authorized in WRDA 2018 | NA | NA |
| Project or Component Name | Yellow Book (1999) Estimated Completion | IDS 2018 Estimated Completion | Project Implementation Report Status | Authorization Status | Construction Status | Ecosystem Benefits Documented to Date |
|---|---|---|---|---|---|---|
| Project or Component Name | Yellow Book (1999) Estimated Completion | IDS 2018 Estimated Completion | Project Implementation Report Status | Authorization Status | Construction Status | Ecosystem Benefits Documented to Date |
| CERP PROJECTS IN PLANNING | ||||||
| Loxahatchee River Watershed (Fig. 3-3, No. 13) | 2013 | NA | In preparation | NA | NA | NA |
| Lake Okeechobee Watershed (Fig. 3-3, No. 14) | 2009-2020 | NA | Draft PIR released July 2018 | NA | NA | NA |
| Western Everglades (Fig. 3-3, No.15) | 2008-2016 | NA | In preparation | NA | NA | NA |
| REMAINING UNPLANNED CERP PROJECTS | ||||||
| WCA Decompartmentalization (Phase 2) | 2019 | NA | NA | NA | NA | NA |
| Everglades National Park Seepage Management | 2013 | NA | NA | NA | Partly addressed by LPA Seepage Management Project | NA |
| Biscayne Bay Coastal Wetlands, Phase 2 | 2018 | NA | NA | NA | NA | NA |
| C-111 Spreader Canal, Eastern Project | 2008 | NA | NA | NA | NA | NA |
| C-43 ASR | 2012 | NA | NA | NA | NA | NA |
| Site 1 Impoundment ASR | 2014 | NA | NA | NA | NA | NA |
| Agricultural Reserve Reservoir | 2013 | NA | NA | NA | NA | NA |
| North Lake Belt Storage Area | 2021-2036 | NA | NA | NA | NA | NA |
| Central Lake Belt Storage Area | 2021-2036 | NA | NA | NA | NA | NA |
| WCA 2B Flows to Everglades National Park | 2018 | NA | NA | NA | NA | NA |
| WPA Conveyance | 2036 | NA | NA | NA | NA | NA |
| Caloosahatchee Backpumping with Stormwater Treatment | 2015 | NA | NA | NA | NA | NA |
| West Miami-Dade Reuse | 2020 | NA | NA | NA | NA | NA |
| South Miami-Dade Reuse | 2020 | NA | NA | NA | NA | NA |
| A.R.M. Loxahatchee National Wildlife Refuge | 2003 | NA | NA | NA | NA | NA |
| Internal Canal Structures | ||||||
| Broward Co. Secondary Canal System | 2009 | NA | NA | NA | NA | NA |
| Henderson Creek – Belle Meade Restoration | 2005 | NA | NA | NA | NA | NA |
| Southern CREW | 2005 | NA | NA | NA | NA | NA |
| Lake Trafford Restoration | 2004 | NA | NA | NA | NA | NA |
| Southwest Florida Feasibility Studies | 2004 | NA | NA | NA | NA | NA |
| Florida Bay Florida Keys Feasibility Study | 2004 | NA | NA | NA | NA | NA |
| Comprehensive Integrated Water Quality Plan | 2006 | NA | NA | NA | NA | NA |
NOTES: Table 3-1 does not include non-CERP foundation projects. NA = not applicable. Remaining unplanned CERP projects include all projects more than $5 million (2014 dollars) as reported in USACE and DOI (2016), for which the components have not been incorporated in other planning efforts. SOURCES: NASEM, 2016; USACE, 2018b.
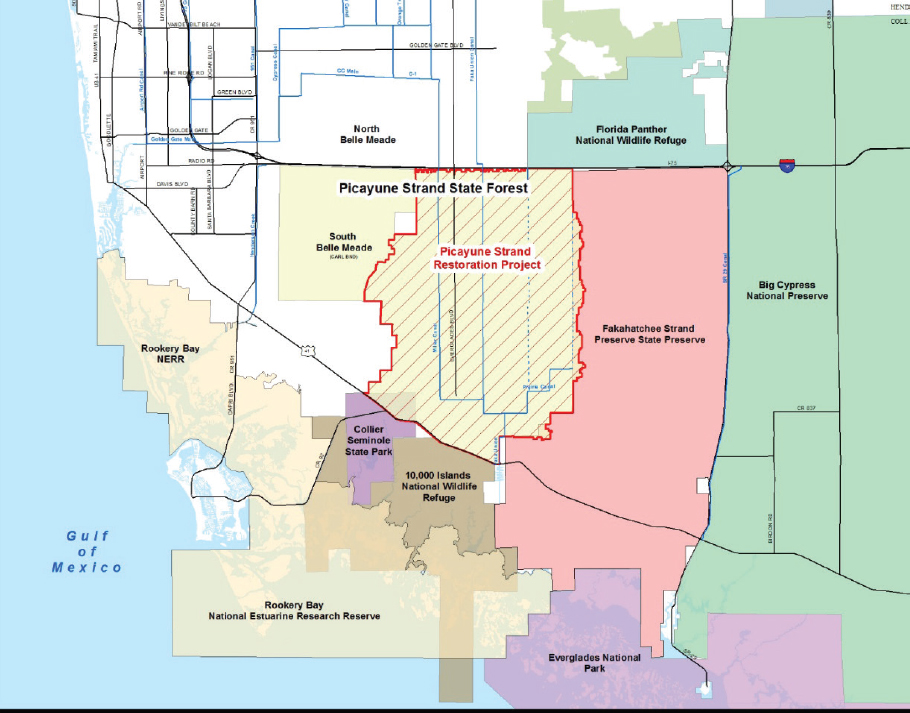
SOURCE: Chuirazzi et al., 2018.
wetlands before being abandoned (Figure 3-3, No. 2). The roads and drainage disrupted sheet flow into Ten Thousand Islands National Wildlife Refuge, altered regional groundwater flows in surrounding natural areas, and drained a large expanse of wetland habitat (Figure 3-4).
The primary objective of the Picayune Strand Restoration Project is to “establish the pre-development hydrologic regime, including wet and dry season
water levels, overland sheet flow, and hydroperiod” (RECOVER, 2014). An array of ecological objectives is dependent on this restoration of hydrology. Hydrologic restoration involves filling at least 50 percent of the length of the larger canals and several smaller ditches draining the area. The project also requires eliminating impediments to reestablishing sheet flow by removing raised roads and logging trams. There has been considerable progress in constructing the Picayune Strand Restoration Project, including canal plugging, road removal, and construction of pump stations (Table 3-2). The ecosystem responses expected to arise from hydrologic restoration include the reestablishment of natural plant distribution and composition, increase in fish and wildlife resources, restored habitat for listed species, and restored ecological connectivity to adjacent public lands (USACE and SFWMD, 2009). To achieve these benefits, the project requires not only the restoration of natural hydropatterns but also the control of exotic and nuisance plants and reestablishment of a natural fire regime in the Picayune Strand State Forest.
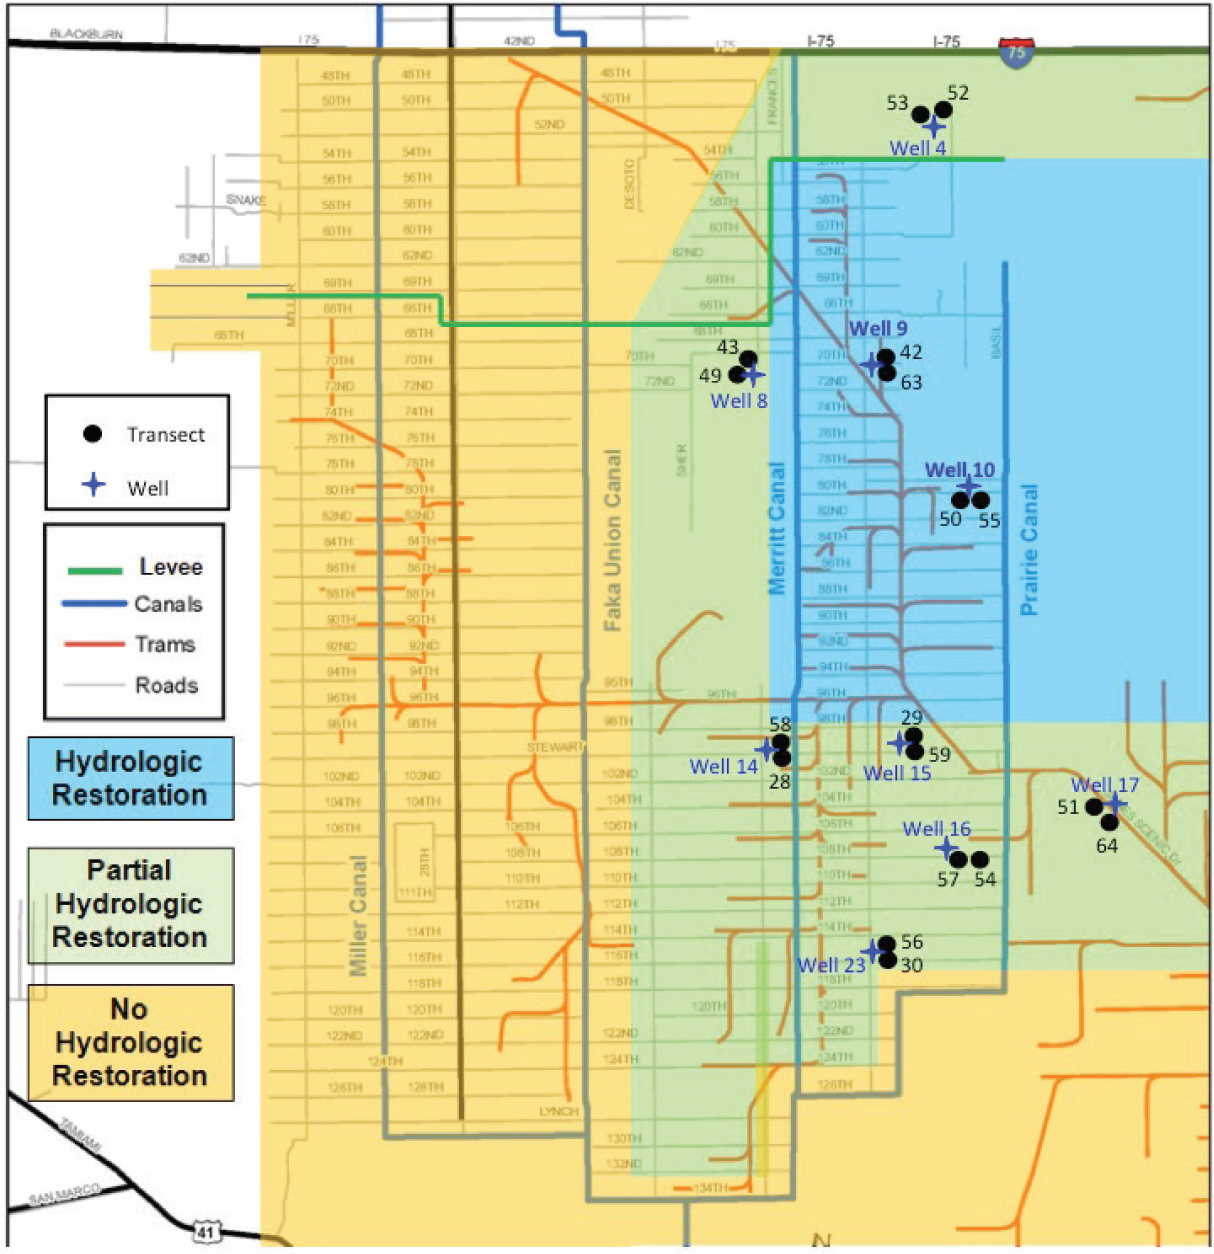
Because hydrologic restoration is a pre-condition for ecological restoration, hydrologic monitoring should provide the first signals of potential restoration success. A robust monitoring effort for both hydrologic and ecological objectives (USACE and SFWMD, 2009; see also Chapter 4) has been established. The hydrologic monitoring results are then utilized to delineate the project area into three levels of hydrologic restoration achieved to date—full, partial, and no hydrologic restoration—determined based on the project components constructed and the local influences of neighboring canals on water levels (see Figure 3-5). Since construction has begun, ecological monitoring has been focused on the areas with full or partial hydrologic restoration, utilizing reference sites in neighboring Fakahatchee Strand Preserve State Park and Florida Panther National Wildlife Refuge (Barry et al., 2017; Worley et al., 2017).
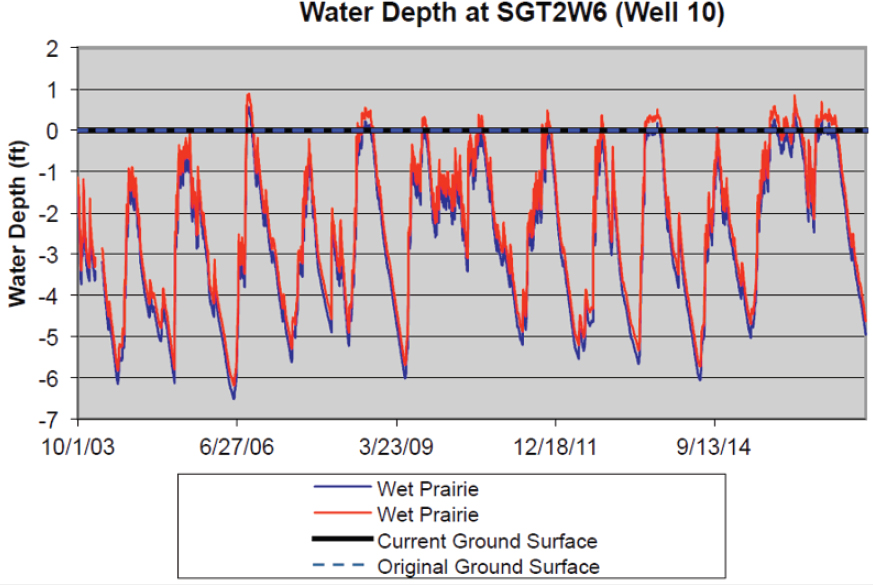
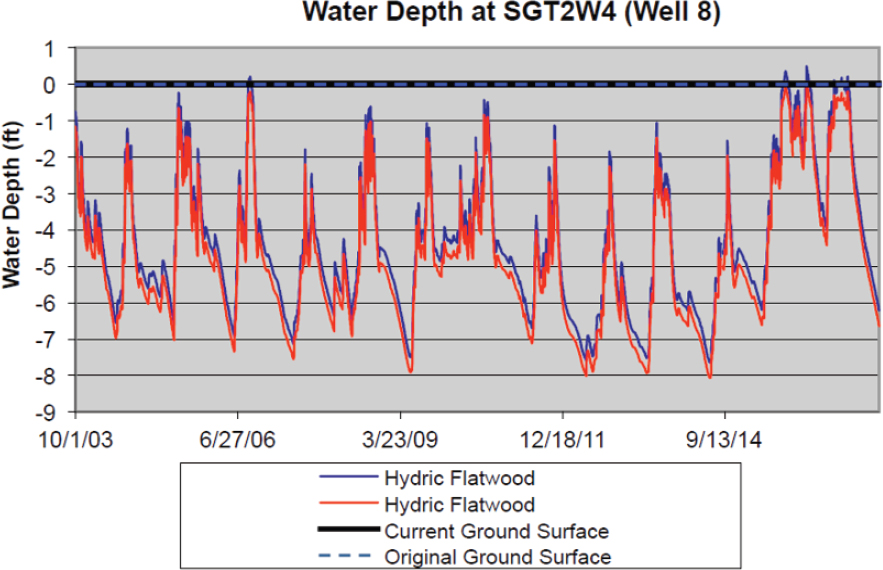
Patterns of lengthening hydroperiod (the period of time per year that water levels are at or above ground surface) appear to follow restoration progress, with the largest gains demonstrated at those wells in the fully restored areas. For example, Figure 3-6 shows evidence of lengthening hydroperiod in the upper reach of the Prairie Canal (Well 10 in Figure 3-5) almost immediately after plugging the Prairie Canal (2004 through 2007) and further lengthening after the filling of the neighboring Merritt Canal in 2015, when the area was considered to be fully restored. Records from this area for 1997-2004 indicated a lack of recorded standing water, in contrast to the significant hydroperiods observed in 2008, 2013, fall and winter of 2015, and 2016. In contrast, Figure 3-7 depicts a partially restored area along the Merritt Canal (Well 8 in Figure 3-5), which appears to be responding to the canal plugging and removal of roads and logging trams completed in 2015. This area had no significant periods of inundation
TABLE 3-2 Phases and Progress of the Picayune Strand Project
| Lead Agency | Road Removal (mi) | Logging Tram Removal | Canals to Be Plugged (mi) | Other | Project Phase Status | |
|---|---|---|---|---|---|---|
| Tamiami Trail Culverts | State | NA | NA | 17 culverts constructed | Completed in 2007 | |
| Prairie Canal Phase | State (expedited) | 64 | 30 | 7 | Hydrologic restoration of 11,000 acres in Picayune Strand and 9,000 acres in Fakahatchee Strand State Preserve Park | Plugging and road removal completed in 2007; logging trams removed in 2012 |
| Merritt Canal Phase | Federal | 65 | 16 | 8.5 | Merritt pump station, spreader basin, and tie-back levee constructed | Completed in 2015; pump station transferred to SFWMD in 2016 |
| Faka Union Canal Phase | Federal | 81 | 11 | 7.6 | Faka Union pump station, spreader basin, and tie-back levee constructed | Roads removed in 2013; pump station completed in 2017; canal plugging scheduled for 2022 |
| Miller Canal Phase | Federal/State | 77 | 11 | 13 | Construct Miller Canal pump station, spreader basin, tie-back levee, and private lands drainage canal; remove western stair-step canals | Miller pump station completed May 2018; road removal and canal plugging scheduled for 2019 and 2022, respectively |
| Manatee Mitigation Feature | State | 0 | 0 | 0 | Construct warm water refugium to mitigate loss of existing refugium | Completed in 2016 |
| Southwestern Protection Feature | State | 0 | 0 | 0 | Construct 7-mile levee for flood protection of adjacent lands | Construction completion scheduled for 2022 |
| Stair-step canals between Prairie and Faka Union Canals | Federal | 0 | 0 | 5.2 | Construction completion estimated in 2018 |
SOURCE: J. Starnes, SFWMD, personal communication, 2016.
SOURCE: Chuirazzi et al., 2018.
SOURCE: Barry et al., 2017.
until 2015 and 2016, in which the completion of restoration activities coincided with above average rainfall years. Although the hydrographs visually indicate that restoration is progressing, the analysis of the information is only qualitative and lacks rigorous statistical comparisons of the restored areas against the reference sites (see Chapter 4).
Vegetation transects have been sampled six times since 2005 (see Chapter 4 for more details). The most recent 2016 vegetation monitoring (Barry et al., 2017) describes the results for vegetation transects in three types of pre-drainage habitat—cypress, wet prairie, and pineland—which are reported by four strata (i.e., vertical layers of vegetation): canopy trees, subcanopy trees, the
SOURCE: Barry et al., 2017.
shrub layer, and groundcover.3 It should be expected that time to response will differ by habitat and strata; for example, standing trees in cypress habitat may not have a visible response for decades, while groundcover in freshwater marsh habitat may respond within a growing season or two. Thus, the 2016 monitoring may not have allowed an appropriate lag time for evidence of a response in all habitat types.
The vegetation monitoring results provide an emerging trajectory of restoration, although few definitive conclusions can be drawn from the data. Across all habitat types, short-term changes are most evident in the groundcover stratum, as
___________________
3 Canopy trees consist of woody plants with a diameter at breast height (dbh) greater than 10 cm; subcanopy trees consist of woody plants with a dbh between 2.5 and 10 cm, excluding woody shrubs; the shrub layer consists of trees with a dbh of less than 2.5 cm and all shrub individuals; and groundcover consists of all remaining plants and primarily herbaceous species.
NOTE: “Control” here describes the reference sites.
SOURCE: Barry et al., 2017.
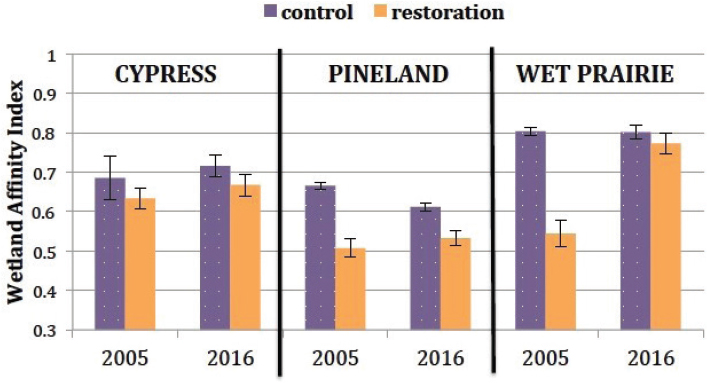
should be expected. Comparisons of the groundcover in the wet prairie habitat between 2005 and 2016 show significant recovery. By 2016, wet prairie Wetland Affinity Index values (a measure of the probability that the observed species generally occur within wetlands) were similar to reference transects, which represent the target restoration conditions (Figure 3-8). In contrast, restored transects in pinelands have not shown appreciable improvement, although this is partially explained because they occur in areas with partially restored hydrology.
Faunal indicators (e.g., treefrogs, aquatic macroinvertebrates, and fish) were sampled for the first time post-restoration in 2016. The monitoring data show a system that is generally in transition from short hydroperiods to more sustained surface water inundation, but with a high variability between individual sites (Worley et al., 2017), which makes significant differences between restored, partially restored, and nonrestored sites more difficult to detect (see Chapter 4). Macroinvertebrates sampling showed no significant difference in diversity of species between restoration and reference sites. A slight indication of a macroinvertebrate shift at restored sites can be seen between the 2005-2006 and 2016-2017 samplings and may be the beginning signal of a temporal shift.
The aquatic fauna monitoring data provide striking evidence of the challenge of invasive species. For example, the total treefrog population across all
sites consists of only three species, with an exotic species (the Cuban treefrog) accounting for 98 percent of the individuals captured. There was no significant difference in treefrog composition between reference and restored sites, and the data indicate that Cuban treefrogs are outcompeting native species across all sites. Fish composition showed a similar challenge, with the post-restoration study documenting the presence of the non-native African jewelfish across both reference and restored sites.
In general, because of the ongoing construction and extended construction timeline with estimated completion in 2023, evaluations of restoration success at Picayune Strand require assessment by the level of hydrologic restoration. In areas considered fully restored, early signals of hydrologic restoration are provided by well data showing increasing hydroperiods, and vegetation response is evident in groundcover strata with increasing Wetland Affinity Index values that show similarity between reference targets and restored sites. However, few statistically significant responses to restoration have been documented. In Chapter 4, the committee discusses improved monitoring and assessment strategies to more rigorously demonstrate early restoration success.
Site 1 Impoundment
The Site 1 Impoundment Project (No. 3 on Figure 3-3; Figure 3-9) was originally cast as a single-phase effort to modify local hydrologic conditions to store more water (13,300 AF) and to help alleviate demands on water in Arthur R. Marshall Loxahatchee National Wildlife Refuge (LNWR). Without the project, during wet periods, runoff from LNWR is shunted to the ocean, while during dry periods, water is taken from the LNWR to meet user demands elsewhere. Planners projected that the Site 1 impoundment would allow for better management of water to supply natural system demands within the LNWR (USACE and SFWMD, 2016a). In 2009, the project was divided into two phases (see Figure 3-9). Construction of Phase 1, completed in 2016, was an $81 million effort that included modifications to the existing L-40 levee and construction of a 6-acre wildlife wetland area (USACE and SFWMD, 2016a; G. Landers, USACE, personal communication, 2016). Phase 1 is estimated to provide a 16 percent reduction in existing seepage at the L-40 levee (USACE, 2016a). Phase 2 of the project requires further congressional authorization necessitated by increased costs (USACE, 2018c). The SFWMD, however, in 2016 communicated to the USACE that it is no longer interested in constructing Phase 2, because of the high anticipated cost of the plan relative to the benefits provided (M. Morrison, SFWMD, personal communication, 2016). CERP planners have not formally deauthorized the project. However, based on current agency support and the fact
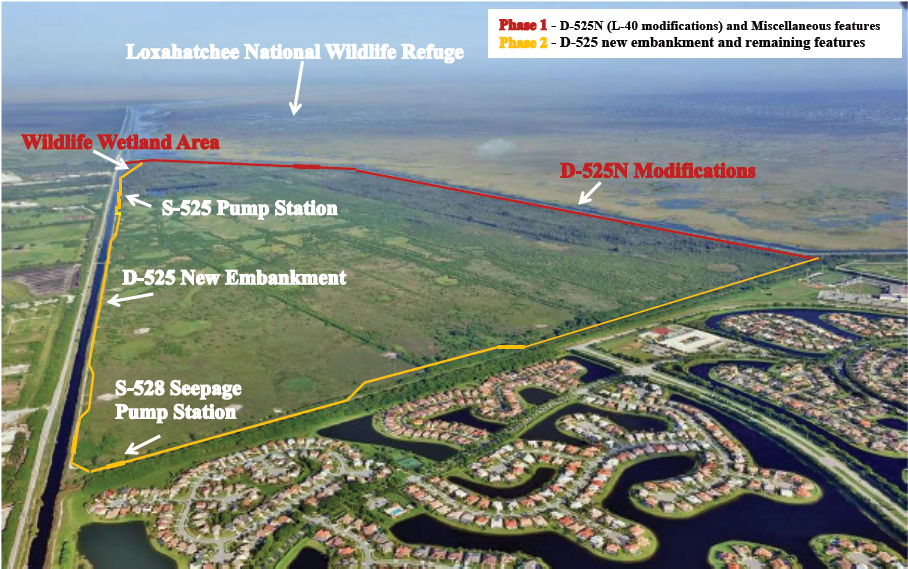
SOURCE: Modified from Audubon of Florida, 2010.
that the project was deleted from the July 2018 draft Integrated Delivery Schedule (USACE, 2018b), it appears unlikely that Phase 2 of the Site 1 Impoundment Project will ultimately be constructed.
Indian River Lagoon-South
The Indian River Lagoon and St. Lucie Estuary are biologically diverse estuaries located on the east side of the Florida Peninsula, where ecosystems have been impacted by polluted runoff from farmlands and urban areas and surges of freshwater (USACE, 2013). The Indian River Lagoon-South (IRL-S) Project (Figure 3-3, No. 4) is designed to reverse this damage through improved water management, including the 50,600 AF C-44 storage reservoir, three additional reservoirs with a total of 97,000 AF of storage, four new stormwater treatment
areas (STAs), dredging of the St. Lucie River to remove 7.9 million cubic yards of muck, and restoring 53,000 acres of wetlands, among other features. The project is anticipated to cost $3 billion in 2014 dollars (USACE and DOI, 2016). Construction is under way on the C-44 reservoir and STA, with estimated completion in 2020 (Gonzales, 2018).
Melaleuca Eradication and Other Exotic Plants
The Melaleuca Eradication and Other Exotic Plants Project is a CERP effort to address the potential threat to restoration posed by non-native invasive plant species. Five invasive species that are particularly problematic are the focus of major ongoing management efforts: Melaleuca (Melaleuca quinquenervia), Brazilian pepper (Schinus terebinthifolius), Australian pine (Casuarina spp.), old world climbing fern (Lygodium microphyllum), and air potato (Dioscorea bulbifera). A crucial part of this work is centered at the U.S. Department of Agriculture’s Invasive Plant Research Laboratory in Davie, Florida, where specific biological control agents—mostly insects—are developed. With CERP funds, the U.S. Department of Agriculture has constructed a 2,700-square-foot annex to the present laboratory to facilitate additional mass rearing (Figure 3-3, No. 5). The annex was completed in 2013 and has been transferred to the local sponsor (USACE, 2015a). The project includes CERP operations and maintenance funding for mass rearing, release, and field monitoring of biocontrol agents to manage the spread of invasive non-native plant species in the Everglades and South Florida (USACE and SFWMD, 2015a).
The Invasive Plant Research Laboratory releases biocontrol agents for invasive plants widely in South Florida, including in Everglades National Park (IPRL, 2017). The number of releases has been increasing, with more biocontrol agents released in 2017 than in any previous year. A total of 283,000 air potato beetles (Lilioceris cheni), 1,600,000 waterhyacinth planthoppers (Megamelus scutellaris), 1,480,000 Lygodium moths (Neomusotima conspurcatalis), and 742,000 Lygodium mites (Floracarus perrepae) were released in the four years 2014-2017. Releases of the air potato beetle have reduced the growth rate and spread of air potato in many areas in the Everglades ecosystem. Research has shown that the Lygodium mite can complement fire control efforts by severely impacting regrowth, while the waterhyacinth planthopper has been shown to make the plants more susceptible to herbicides, possibly offering a path to reduced herbicide application without loss of control efficacy (IPRL, 2017).
The Melaleuca Eradication and Other Exotic Plants Project is one effort among many efforts to control invasive plant species in the Everglades, and several federal and state agencies are engaged to control these problem plants.
As a result, the exact contributions of this CERP project in the overall effort are difficult to parse, although the control of invasive plants is essential to achieve restoration goals (NRC, 2014).
Generation 2 CERP Projects
Four second-generation CERP projects were authorized as part of WRRDA 2014 (Table 3-1): the Biscayne Bay Coastal Wetlands (Phase 1) Project, the C-111 Spreader Canal (Western) Project, the C-43 Reservoir, and the Broward County Water Preserve Areas. No construction has begun on the Broward County Water Preserve Areas, so the discussions will focus on the other three projects.
Biscayne Bay Coastal Wetlands (Phase 1) Project
The Biscayne Bay Coastal Wetlands Project (Figure 3-3, No. 7) is designed to address near-shore hypersalinity and to improve the ecological condition of the wetlands, tidal creeks, and near-shore habitat by restoring the timing and quantity of freshwater flows into the bay and Biscayne National Park. Historically, drainage and development cut off the wetlands from their source of freshwater, resulting in wetland losses and an increase in salinity along the margin of the bay. The overall project seeks to reverse these effects on 11,300 acres of the total 22,500 acres of wetlands. Phase 1 of the Biscayne Bay Coastal Wetlands Project is small, with a total footprint of approximately 3,800 acres divided into three geographically distinct regions: the Deering Estate Flow-way, the Cutler Wetlands Flow-way, and the L-31E Flow-way (SFERTF, 2016; Figure 3-10). The project includes the construction of pump stations, spreader canals, and culverts and the restoration of flow-ways (USACE, 2018d). Construction of the Deering Estate component and 4 of the 10 culverts in the L-31E Flow-way were expedited by the SFWMD and completed by 2012. By 2018, the last 6 culverts were completed, and in April 2017, the SFWMD installed an interim pump to increase water available to flow through the culverts. The USACE is expected to construct the remaining features of the L-31E Flow-way, including four pump stations, by 2022. Construction of the Cutler Wetlands component is scheduled for 2020-2021 (USACE, 2018d).
Deering Estate. The S-700 pump station on the C-100A Spur Canal within the Deering Estate is designed to restore historic freshwater flow through the wetlands and into Biscayne Bay to reduce near-coastal salinity. In water year (WY) 2017, the pump station diverted approximately 12,900 AF of freshwater from the C-100 Canal to the remnant wetlands near Cutler Creek (Charkhian et al., 2018).
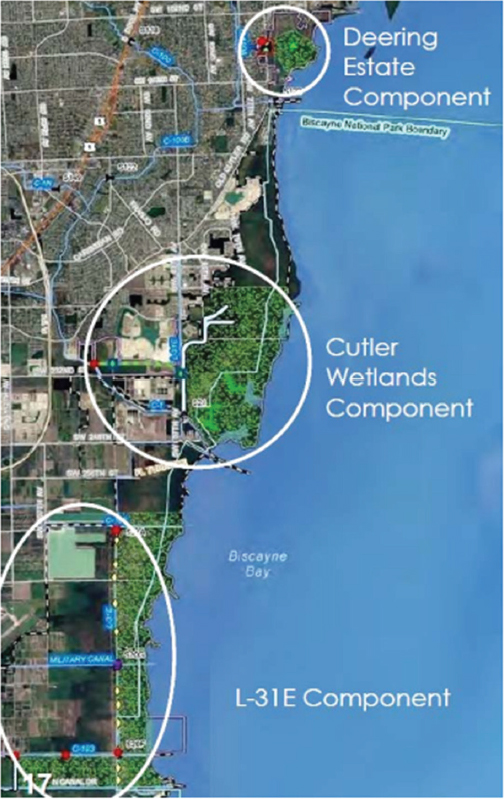
SOURCE: USACE and SFWMD, 2012.
Although this component has a small footprint, the project is seeing some progress toward the project goals. Since pumping began, salinity in Cutler Creek and in groundwater has decreased. Salinity in the upper reaches of Cutler Creek, which was subject to saltwater intrusion, decreased to less than 1 practical salinity unit (psu)4 in response to freshwater inputs. Groundwater stage has
___________________
4 Psu is nearly equivalent to parts per thousand but is measured using electrical conductivity.
risen, and groundwater salinity, which typically peaked at more than 20 psu in the dry season under the coastal mangroves, was reduced to less than 10 ppt by freshwater inputs (Charkhian et al., 2017, 2018). Nearshore salinity has not shown as much response to the project and remained on average above the RECOVER target of 20 psu.
In the initial design, the Deering Estate S-700 pump station would be controlled by a programmable logic controller based on the stage, but this functionality was prevented by programming limitations. Instead, the District’s operations control room has controlled pumping, and the project has largely been operated under discontinuous pumping. The permeable limestone bedrock allows the water level to drain quickly when pumping stops, leading to wide fluctuations in water levels and periods with no standing water. Recent pump tests to investigate the effects of a pulsed versus continuous pumping schedule resulted in a RECOVER recommendation for a constant pumping rate of at least 25 cubic feet per second (cfs) (representing at least 19 acres inundated, or 58 percent of the historic wetlands in the project area). Constant pumping reduced atypical water level fluctuations and improved wetland salinity, although the area of inundation was reduced (Charkhian, 2017).5 The revised operations will be implemented in WY2019 (M. Jacoby, SFWMD, personal communication, 2018).
The inability to date to create a natural hydroperiod may have limited the ecological response. For example, the project has not yet facilitated the expected shift in the vegetation communities, although there is some evidence of a shift toward hardwood tree species that are more tolerant of flooding (Charkhian et al., 2018). Some upland vegetation that had encroached into the wetland has begun to die back with mean vegetation canopy cover declining slightly between 2013 and 2016, although the differences were not statistically significant (Charkhian, 2017).
Although these operations represent improvements, it is not clear that the low pumping rate will provide the ecological benefits that are predicted for this component of the Biscayne Bay Coastal Wetland Project. A reassessment of the predicted ecological outcomes under the new pumping rates is warranted (e.g., near-shore salinity, vegetation response) in order to determine whether the expected ecological targets can be met. This presents an opportunity to learn more about the system’s response and to implement adaptive management options as appropriate (USACE and SFWMD, 2011a).
The L-31E Component. The L-31E Culverts component aims to improve habitat conditions by diverting water from canal discharges into coastal wetlands, thereby
___________________
5 At a rate of 100 cfs, 94 percent of the historic wetlands or 31 acres are inundated (Charkhian, 2017).
improving near-shore salinities. Delivering sufficient freshwater through the L-31E Culverts to wetlands east of the L-31E Canal has been an ongoing challenge because of the lack of pumps to move water to the culverts and hold the stage high enough in the canal to promote flow into the coastal wetlands. The SFWMD reports a regulatory-based performance target to divert 4 percent of the total coastal discharges to the wetland as freshwater flow from the L-31E Canal,6 although none of the project documents demonstrates that this target flow will meet the project’s ecological objectives. RECOVER (2014) states that “the volume of water diverted may provide a more direct restoration-based target than the percentage of available water.” Between water years7 2012 and 2017, the project has only met the regulatory 4 percent flow target in 24 of the 84 months (Figure 3-11). Dry season flows rarely occurred outside of periods when the temporary or interim pumps were in place, and even in wet seasons, the stage in the L-31E Canal is lower than the “optimal level” necessary to drive the target freshwater flows into the coastal wetland (Charkhian, 2017). Dry season flows are anticipated to increase when the four pump stations are constructed (anticipated in 2020).
Sawgrass mapping within a 370-acre area of the Miami Dade-County preserve wetlands in February 2017 showed a marginal increase in its areal extent, increasing from 43.1 to 52.0 acres between 2013 and 2017 and replacing upland species. There has also been a slight increase in the abundance of various bird species, amphibians, invertebrates, and fish species relative to baseline abundance data (Charkhian et al., 2018), although these reports are anecdotal and not linked to a monitoring performance target. Given that the hydrologic performance targets have not been met, it is not surprising that the ecological response has been limited.
Across both project components, there is a surprising lack of rigorous analysis of the monitoring data relative to project objectives and expectations, given the time that the project components have been operational. Without this analysis, it is difficult to clearly assess restoration progress relative to expectations and whether adaptive management steps are needed.
C-111 Spreader Canal (Western) Project
The C-111 Canal (Figure 3-3, No. 6) is the southernmost canal for the entire Central and Southern Florida Project. Originally designed to provide flood protection for agricultural lands to the east in Dade County, a major problem resulted when the C-111 Canal also drained water from the Southern Glades and Taylor Slough in Everglades National Park. Much of the water in the canal is a result of
___________________
6 Special Conditions 10-C of USACE Permit SAJ-2007-1994-1327 [IP-TKW].
7 The water year runs from May 1 through April 30.
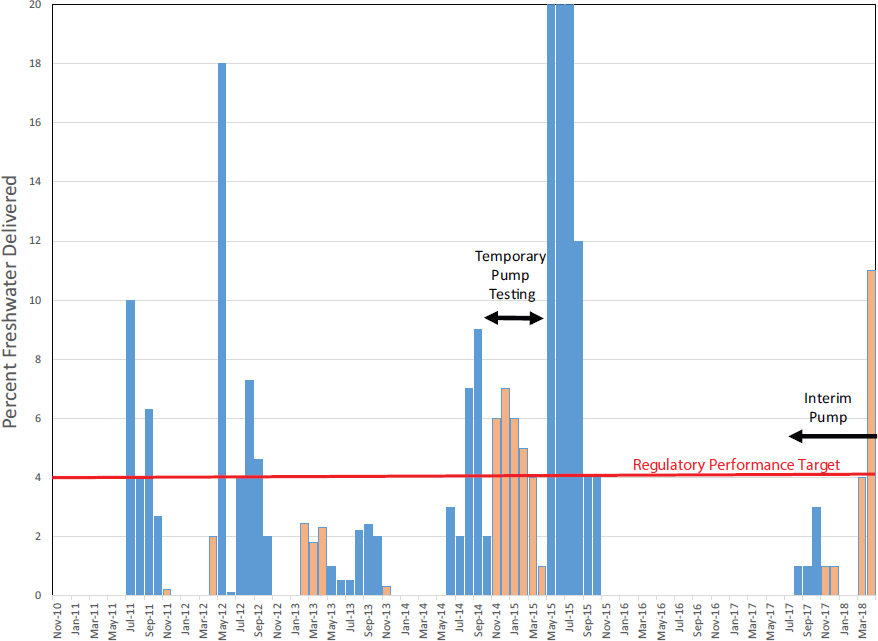
SOURCE: Data from Charkhian et al., 2014, 2015, 2016, 2017a, 2018; M. Jacoby, SFWMD, personal communication, 2018.
seepage from Everglades National Park to the west. The amount of seepage and the resulting change in flow pattern caused environmental and ecological damage to Taylor Slough, which became too dry; at the same time, Barnes Sound and Manatee Bay suffered ecological damages as high freshwater flows upset the natural salinity balance of their waters. Working in concert with the non-CERP C-111 South Dade Project and the SFWMD Florida Bay Initiative to the north (discussed later in this chapter), the C-111 Spreader Canal (Western) Project promises to restore the volume, distribution, and timing of flow into Taylor Slough and to improve salinity regimes in eastern Florida Bay (SFWMD, 2013).
The C-111 Spreader Canal Project is structured in two phases. The first phase—the Western Project—creates a 6-mile-long hydraulic ridge along the eastern boundary of Everglades National Park to reduce seepage from the park and to improve the hydrology of Taylor Slough and includes canal modification to reduce canal flows into eastern Florida Bay. The Western Project features include two pump stations (S-199 and S-200), a 516-acre detention basin (the Frog Pond Detention Area), canal plugs, and the Aerojet Canal impoundment and weirs (see Figure 3-12). The C-111 Spreader Canal (Western) Project was largely completed in February 2012 and began operations in June 2012. One additional new structure (S-198) is authorized in the lower section of C-111, which has not yet been scheduled for construction (USACE, 2018e). The second phase of the C-111 Spreader Canal Project (Eastern phase) has not yet been specifically planned or authorized.
The objective of the CERP project is not to add water to Taylor Slough but rather to create a hydraulic ridge that prevents water flowing in Taylor Slough
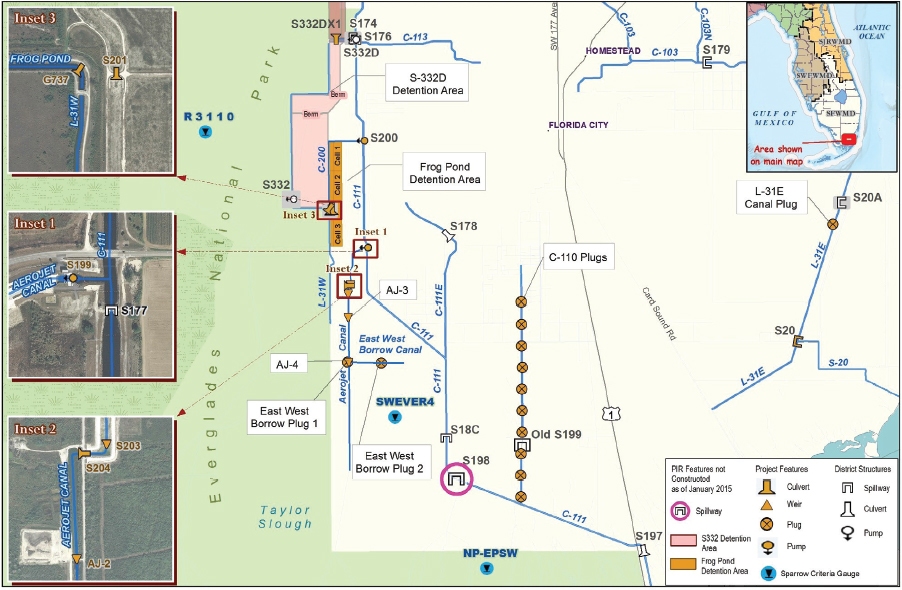
SOURCE: Qui et al., 2018.
from seeping into the C-111 canal. Water pumped into the Frog Pond Detention Area (through S-200; see Figure 3-12) and the Aerojet Canal impoundment (through S-199) will seep into the ground and back into the canal. The expectation is that the reduction in seepage from Taylor Slough will increase flow into Florida Bay, reducing salinity and having positive ecological effects. The hydrologic ridge element of the project only functions when water is available to fill the detention areas.
The natural system benefits of the C-111 Spreader Canal (Western) Project are difficult to completely separate from those of neighboring non-CERP projects, including the C-111 South Dade Project and the Florida Bay Initiative. The S-332D Detention Area of the C-111 South Dade Project (see Figure 3-12) has been operating since 2003 and has similar overarching objectives (D. Crawford, USACE, personal communication, 2018). The Florida Bay Initiative has been operating since 2017. The results shown here are assumed to be the collective response of multiple projects. Two reports that evaluate the monitoring data associated with project success are Qui et al. (2018) and Kline et al. (2017).
Qui et al. (2018) focuses on water year 2017 and indicates that the project has been operating generally as expected. Annual mean flow was 82 cfs at S-199 and 113 cfs at S-200, with operations primarily in the wet season. The report summarizes data on hydroperiod in the Southern Glades and Model Lands and salinity in the coastal zone but does not draw conclusions about project effectiveness.
Kline et al. (2017) provide a more detailed analysis of data for water year 2016 based on an analysis of data from 1993 to 2016. They estimate the amount of water that flows through Taylor Slough, into the Southern Glades between S-198 and S-197, and directly into eastern Florida Bay (Manatee Bay) via canal discharge (through S-197). The authors also estimate seepage back into the canal to the east of the Aeroject Canal feature (calculated as the difference in flow from S-177 to S-18C).
These hydrological responses over time are partially described in Figure 3-13, which shows substantial year-to-year variability. In years prior to project operation, a significant amount of water flowed to Manatee Bay (part of the Biscayne Bay watershed) via C-111 Canal discharge and over land from the C-111 Canal into the Southern Glades to northeastern Florida Bay, causing these areas to have lower salinities, while less water flowed through Taylor Slough to north central Florida Bay (see Figure 3-13). Since project operations started in 2012, some years showed increased Taylor Slough flows relative to eastern discharges (2013, 2014) and other years seemed to show little effect (2012, 2015). Based on a detailed seasonal analysis of the water budget for C-111SC and rainfall, Kline et al. (2017) conclude that the project can successfully increase Taylor Slough
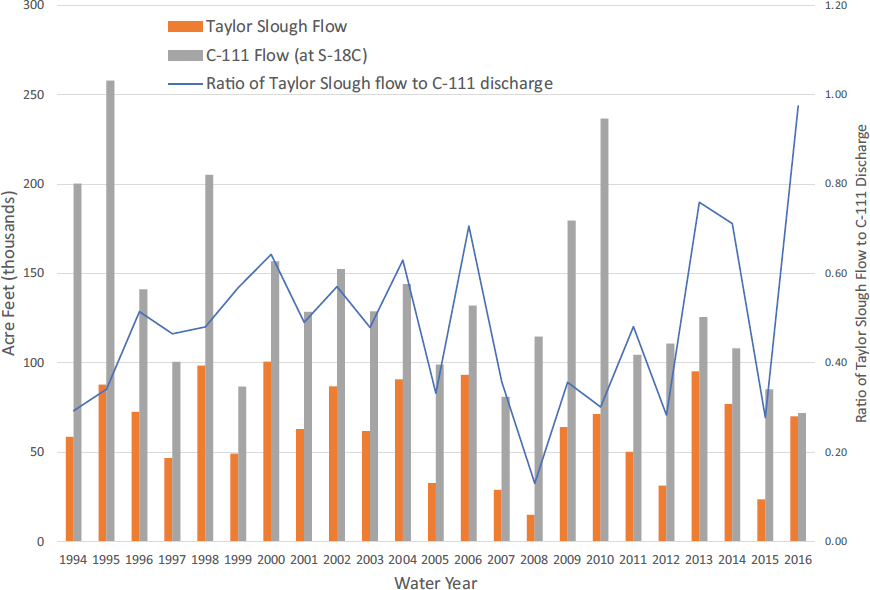
SOURCE: Modified from Kline et al., 2017.
flows to Florida Bay if rainfall is sufficient, but the project is less effective during periods of drought because water for project operations is insufficient. Kline et al. (2017) conclude that additional water will be needed to meet the project goals. Additional water may be available to the project through the implementation of the CEPP and the Combined Operations Plan for Mod Waters and C-111 South Dade, but these operational decisions have not been determined.
Kline et al. (2017) also estimated the efficiency of the project by calculating the amount of seepage back into the canal after water enters Taylor Slough through the S-200 and S-199 pumps (the efficiency is the estimated percentage not lost to seepage). They estimated that the S-199 and S-200 pumps combined were only 7 percent efficient in the wet season compared to 73 percent in the dry season for water year 2016. The higher dry season efficiency is likely due
to a steeper westward hydraulic gradient when marsh water levels are low. The benefits provided from the project could be even greater in the wet season if seepage could be further reduced.
Most of the ecological monitoring associated with C-111 Spreader Canal has focused on responses in Florida Bay. However, there is some evidence of increases in long-hydroperiod species such as Eleocharis (spikerush) in Taylor Slough (Figure 3-14). Troxler et al. (2013) suggest that with sustained water management, shifts in plant community structure could occur in 5-10 years. The effects of the project on ecological metrics in Florida Bay and near-shore habitats are difficult to assess for two reasons. First, the expected effect of the project on salinity is small relative to natural variation—Qui (2016) notes that project modeling indicates a net improvement in salinity concentrations of 3 percent in near-shore embayments. Second, sea-level rise has resulted in saltwater intrusion, potentially masking the effects of the project on submerged aquatic
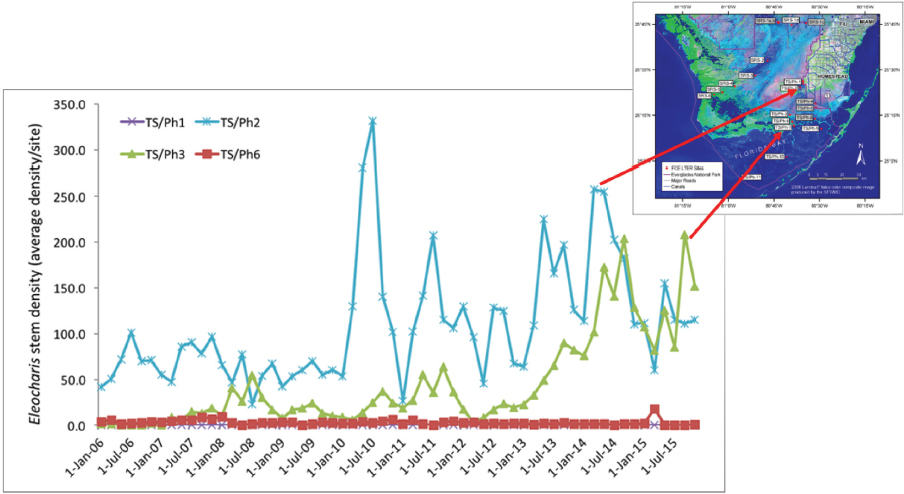
NOTE: The Ph1 and Ph6 sites did not have Eleocharis. The Ph1 site has never had Eleocharis, and the Ph6 site has salinity levels that adversely affect Eleocharis growth.
SOURCE: F. Sklar, SFWMD, personal communication, 2018.
vegetation (SAV) and freshwater fish abundance. The past four hydrologic years have seen high water levels during the dry season, which resulted in a low number of days where the water level associated with high prey concentrations was optimal. The changes in water levels associated with sea-level rise also affected roseate spoonbill nesting success as feeding is connected with low water levels that concentrate freshwater fish prey. Kline et al. (2017) conclude that “sea level rise is having profound effects on the upper trophic levels in the Florida Bay coastal habitats that may alter how restoration projects are assessed.”
Based on available monitoring data, the hydrologic and ecological effects of the project have not been fully determined. Extreme events in 2015-2017, including severe drought and seagrass die-off, have made an evaluation of progress difficult. These events have led to encroachment of marine water into transitional creeks, movement of freshwater fish upstream, changes in avian ecology, and possible increases in nutrients (Kline et al., 2017; Sklar and Dreschel, 2018), which may confound the assessment of project effects. Monitoring to evaluate project success is discussed in more detail in Chapter 4.
C-43 Storage Reservoir
A major environmental issue in the estuary of the Caloosahatchee River on the west coast of Florida is the restoration and maintenance of appropriate salinity levels for aquatic organisms, particularly shellfish. Early in the 20th century, the course of the Caloosahatchee River was deepened and straightened, and canals were dug in the river basin to provide a capacity for drainage of agricultural lands and urban areas. As a result, during prolonged dry periods, freshwater flow to the estuary is greatly reduced, to the extent that saline water can migrate far up the river and kill beds of freshwater submerged plants. During periods of heavy rainfall, large volumes of nutrient- and sediment-rich freshwater are transported into the estuary, affecting habitat quality for seagrasses, oysters, and other aquatic organisms. The Caloosahatchee River (C-43) West Basin Storage Reservoir (Figure 3-3, No. 8) is a CERP project designed to impound up to 170,000 AF of stormwater runoff from the C-43 drainage basin or from Lake Okeechobee during wet periods (USACE and SFWMD, 2016b), hence protecting the estuary from excessive freshwater. During dry periods, this stored water can be released to supplement low river flows to maintain optimal salinity levels in the estuary and is available for water supply. The project has four phases associated with construction. The first phase of construction began in late 2015, and the reservoir is anticipated to be completed by July 2022 (SFWMD, 2017). Because construction is still in an early phase, it is too soon to see natural system benefits from this project.
Generation 3
A single large project—the CEPP (Figure 3-3, Nos. 10, 11, and 12; NRC, 2014; USACE and SFWMD, 2014)—makes up Generation 3. CEPP was authorized in WRDA 2016 as a $1.9 billion project. CEPP includes a flow equalization basin to provide storage to increase the quantity of water flowing into the remnant Everglades and improve water quality treatment for the new water. The project also improves the distribution of flow through seepage management, the filling of canals, and the levee removal in the central Everglades. The project has been divided into three phases based on project partnership agreements (PPAs): PPA North, PPA South, and PPA New Water. Construction has not begun, and therefore there are no project-related benefits to discuss, although construction of two early components of PPA South (the S-333N pump station and removal of old Tamiami Trail) are expected to begin in October 2018.
A post-authorization change report (SFWMD, 2018a) submitted by the SFWMD to convert the A-2 flow equalization basin to a 240,000 AF reservoir was authorized by Congress in October 2018. The committee examined this project component but did not rigorously review the project analysis or the selection of alternatives.
EAA Storage Reservoir Project
In May 2017, the Florida legislature enacted Water Resource Law of 2017 (Senate Bill 10), which mandated a new planning effort focused on water storage in the Everglades Agricultural Area. This project was intended to reduce harmful freshwater discharges from Lake Okeechobee to the St. Lucie and Caloosahatchee estuaries and to increase the flow of freshwater to the Everglades. The Florida Senate appropriated $800 million for the planning, design, and construction of the project. The law specifically directed the SFWMD to develop a post-authorization change report for the CEPP that evaluates the benefits of a potential reservoir with a minimum of 240,000 AF storage along with required associated treatment on the footprint of the proposed 56,000 AF A-2 flow equalization basin (FEB) as authorized in CEPP. The law allowed for consideration of an alternate configuration using the Restoration Strategies A-1 FEB if a minimum of 360,000 AF total storage could be provided with the necessary treatment. The legislature authorized the SFWMD to acquire additional land for the project from willing sellers but specifically prohibited the use of eminent domain. The law set a stringent timeline for the planning process, requiring that an approved report be submitted to Congress for authorization by October 1, 2018. The SFWMD conducted numerous public meetings during the planning process to ensure consistency with the National Environmental Policy Act and eligibility for federal cost shar-
ing and delivered the post-authorization change report to the USACE on March 26, 2018. The project was conditionally approved by the Office of Management and Budget in July 2018.
In its development of the tentatively selected plan, the SFWMD evaluated five initial alternatives, representing two basic configurations and footprints, with different locations of the reservoirs and STAs within the footprints. One alternative (C360C) used a different operational plan to allow for water supply. The SFWMD used the Regional Simulation Model under contemporary (1965-2005) climate conditions to analyze future benefits and assumed that Lake Okeechobee would operate under its current regulation schedule with the additional flexibility assumed in the CEPP. In addition, the analysis excluded the potential benefits of other projects in planning as well as the potential impacts of sea-level rise and changes in precipitation and temperature patterns. After further evaluation and optimization, the SFWMD identified a final alternative (C240A) that enables water supply deliveries from the reservoir. The proposed plan is comprised of a 240,000 AF, 23-foot-deep reservoir with multipurpose operational flexibility, a 6,500-acre STA, and conveyance improvements. The new reservoir would take the place of the Central Everglades A-2 FEB with additional land from willing sellers to the west, preserving the continued functioning of the Restoration Strategies A-1 FEB. In addition, the plan includes conveyance improvements to the Miami and North New River Canals. The net increase in the cost of the CEPP based on the post-authorization change report for the EAA Storage Reservoir Project is approximately $1.3 billion (SFWMD, 2018b). Once authorized by Congress, the revised CEPP (with EAA Storage Reservoir) could take 10 years to become operational with unconstrained funding, or 20 years with funding of $214 million/year. Table 3-4 lists the expected benefits of the project above and beyond currently authorized CERP projects.
Together with other authorized projects, the EAA Storage Reservoir is predicted to increase average annual flows into the Everglades Protection Area by 370,000 AF (SFWMD, 2018a). This flow exceeds the 323,000 AF increase projected for the original CERP (USACE and SFWMD, 1999). Also together with other authorized projects, the EAA Storage Reservoir will reduce the number of Lake Okeechobee mean monthly high-flow discharge events to the Northern Estuaries by 63 percent and the volume of Lake Okeechobee discharge by 55 percent, not including discharge events caused by local basin runoff. The original CERP goal was an approximately 80 percent reduction in damaging discharges from Lake Okeechobee to the Northern Estuaries (SFWMD, 2018a).
USACE planning guidelines require that new CERP projects be evaluated individually, with the Future Without (FWO) project condition, which assumes that all authorized CERP projects are in place, compared to the same condi-
TABLE 3-4 Hydrologic Impacts of the EAA Storage Reservoir Compared to the Future with Currently Authorized CERP Projects
| Impact on Hydrology Beyond Other Authorized Projects | |
|---|---|
| Lake Okeechobee |
Minimal hydrologic change:
|
| St. Lucie Estuary |
Moderate hydrologic change:
|
| Caloosahatchee Estuary |
Moderate improvement:
|
| Central Everglades |
Negligible to moderate improvement:
|
| Florida Bay |
Minor beneficial effects:
|
SOURCE: SFWMD, 2018a.
tions but with the proposed new project in place. This approach is reasonable for determining the benefits of the project alone, but it neglects the synergistic systemwide effects of future projects or possible changes in lake regulation, which could result in selection of a suboptimal plan. As mentioned previously, the EAA Storage Reservoir analyses included a model run that combined the tentatively selected EAA Reservoir plan with one early planning alternative from the Lake Okeechobee Watershed Restoration Project, consisting of 200,000 AF of surface storage and 80 5-MGD ASR wells, to provide a preliminary estimate of the cumulative impacts of these projects. This alternative represented
significantly more above-ground storage than was ultimately included in the Lake Okeechobee Watershed Restoration Project tentatively selected plan. The combination was shown to achieve an 86 percent reduction in the number of high-flow estuary events, a 78 percent reduction in high estuary flows by volume from Lake Okeechobee to the Northern Estuaries, and 99 percent of the original goal for CERP flows into the Everglades (SFWMD, 2018a). This preliminary modeling exercise suggests that the original CERP flow targets may be achievable with less than the original CERP storage projects, although the analysis should be rerun with the final Lake Okeechobee Watershed plan. This analysis underscores the benefits of more inclusive systemwide modeling to understand the ultimate outcomes of all CERP projects in planning, as recommended in NASEM (2016).
The EAA Storage Reservoir analyses and projection of benefits were based on historic rainfall (1965-2005). CERP agencies should consider a new approach to identifying the best alternatives for new projects that quantitatively evaluates the robustness of hydrologic and ecologic benefits to possible future climate and sea-level rise conditions, such as Robust Decision Making (RDM) or Decision Making under Deep Uncertainty (DMDU) planning processes (Groves and Lempert, 2007; Lempert et al., 2006). Otherwise, the analyses could result in selection of a project that is vulnerable to future conditions.
Projects in Planning
Progress in project planning has important implications for the location and pace of future restoration progress, as well as the restoration benefits provided by those projects. This section describes aspects of several projects for which planning is under way—the Loxahatchee River Watershed Restoration, Lake Okeechobee Watershed Restoration, and Western Everglades Restoration projects. Although the committee examined all three projects, the committee did not rigorously review the project analysis or the selection of the final project alternatives for any of the planning efforts.
Loxahatchee River Watershed Restoration
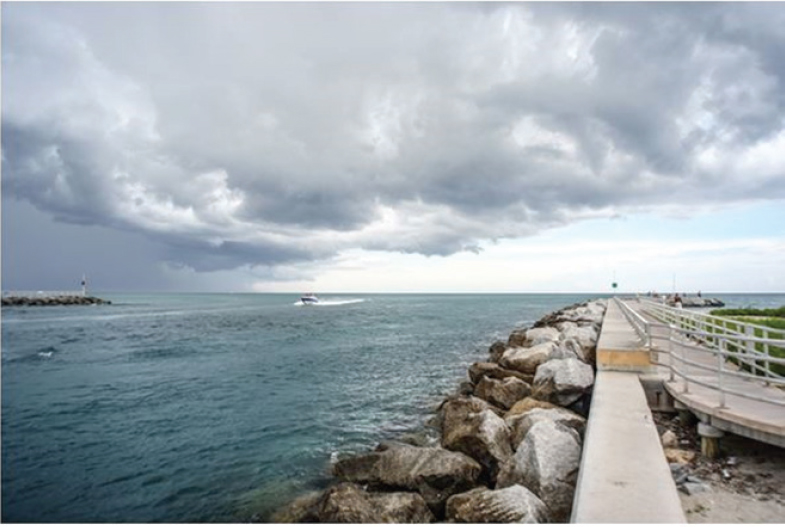
The Loxahatchee River once drained a large expanse of coastal lagoons and undeveloped wetlands to the west, north, and south through sloughs and creek channels. Water flowed into the ocean at a natural river mouth that sometimes closed after storms, when it was blocked by shoaling of sand. In 1922 a construction project cut a deep channel 6 feet below mean low water level at the river mouth, as well as built jetties on the north and south sides of the inlet, each measuring 300 feet in length. Between 1942 and 1947, sand again blocked the inlet and since then it has been kept open with twice-yearly maintenance
dredging by the Jupiter Inlet District. The jetties have been extended in length and hardened with concrete and large boulders (Figure 3-15). Deepening of the Jupiter Inlet has allowed considerably more ocean water to move upstream at high tide compared to the past. There also is less freshwater input to the river from its basin, because much of the former wetlands have been converted to farms and urban and suburban land uses (FDEP, 2010). Taken together, greater upstream movement of ocean water and reduced freshwater inputs have resulted in salinization of the river in areas that once were fresh.
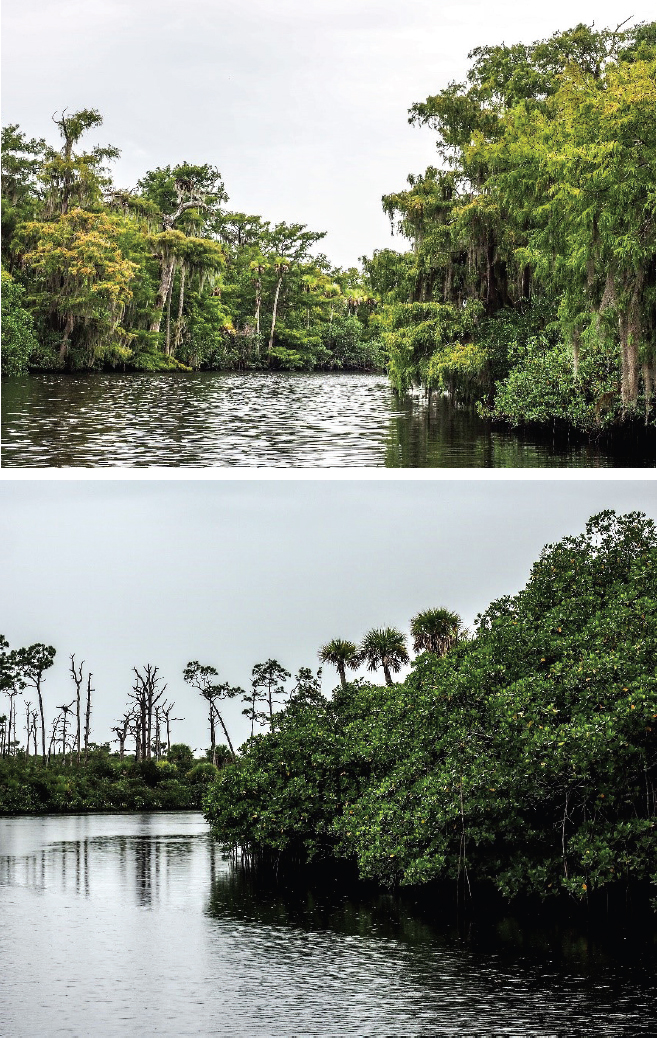
The intrusion of saltwater far up the river and onto its floodplain has led to a major change in the landscape. In particular, up-river migration of mangrove has displaced cypress (FDEP, 2010). Progressing upstream by boat, one can observe dense mangrove for many miles (Figure 3-16), and in some places remnant dead cypress trees. Then cypress begins to appear, far back from the river channel in the floodplain, until one finally reaches a place where salinity is low enough that a natural cypress community exists right to the banks of the river. The Loxahatchee River Watershed Restoration Project (Figure 3-3, No. 13)
SOURCE: Karl Havens.
SOURCE: Karl Havens.
is intended to address the issue of salinization of the river, as well as other issues in the watershed. The full suite of project objectives are as follows (USACE and SFWMD, 2018a):
- Improve water distribution and timing to restore the natural system’s ecological functioning,
- Rehydrate natural areas that have been hydrologically impacted by excessive draining and water diversion,
- Reestablish connections among natural areas that have become spatially and/or hydrologically fragmented,
- Improve timing and distribution of water from the upstream watershed to increase the resiliency of freshwater riverine habitats to future sea-level changes, and
- Restore, sustain, and reconnect the area’s wetlands and watersheds that form the historic headwaters for the river.
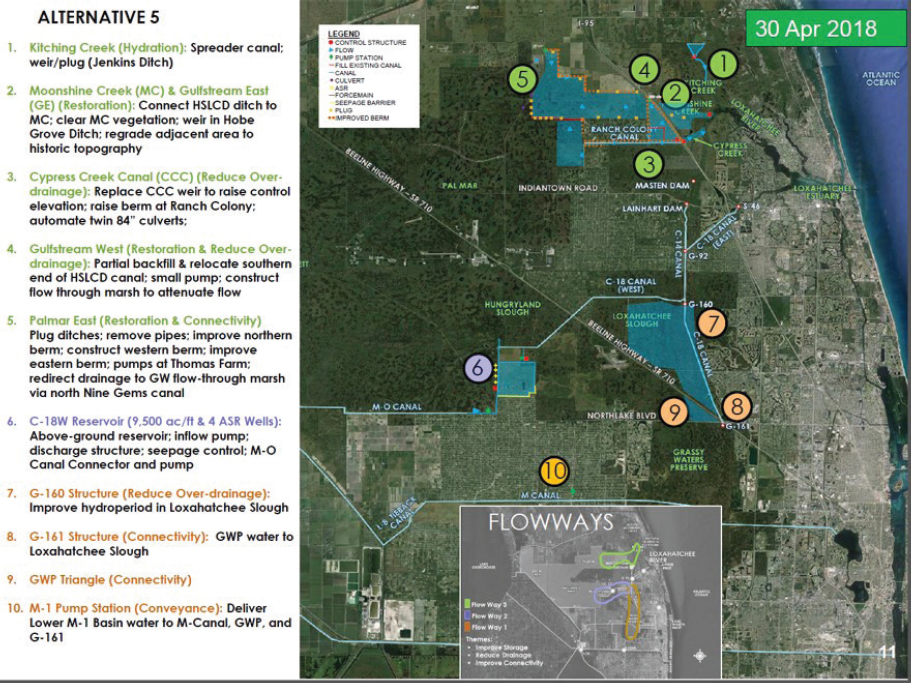
The Project Delivery Team is evaluating a rescoped project, and a report describing the results was expected in September 2018, which was too late for the committee’s review. The team is evaluating the performance of four alternatives that combine different water storage and conveyance features (Table 3-3). These include different amounts of deep and shallow storage in the L-8 basin, different amounts and types (constructed vs. natural) of storage in the C-18W basin, different numbers of aquifer storage and recovery (ASR) wells, and different approaches to flowing water through three delivery routes in the headwaters of the river. The alternatives involve a complex array of interconnected projects
TABLE 3-3 Loxahatchee River Watershed Restoration Project Alternatives
| Alternative | Deep Storage in L-8 Basin | Shallow Storage in L-8 Basin | C-18W Basin Storage | Aquifer Storage and Recovery (ASR) | Primary Delivery Route | Secondar y Delivery Route | FW 3 Features |
|---|---|---|---|---|---|---|---|
| 2 | None | 4,300 ac-ft | 7,200 ac-ft reservoir | 2 wells at C-18W storage | FW2 | FW1 | Full range |
| 5 | None | None | 9,500 ac-ft reservoir | 4 wells at C-18W storage | FW2 | FW1 | Full range |
| 10 | 44,000 ac-ft | None | 7,200 ac-ft reservoir | None | FW1/ | FW2 | Limited |
| 13 | None | 6,500 ac-ft | Increased wetland elevations to support natural storage | 4 wells at L-8 storage | FW2 | FW1 | Full range |
SOURCE: Foster, 2018.
that include adding spreader canals, plugging ditches, regrading land, replacing weirs, and constructing reservoirs, pumps, and/or ASR wells. An example is shown in Figure 3-17. Although the evaluation of alternatives is ongoing, early results indicate potential benefits for the river salinity. Results from a hydrodynamic model indicate that salinities can be substantively improved (Figure 3-18).
A major driver of this project implies that cypress habitat is of greater value than mangrove habitat, even though both are native Florida plant assemblages with ecosystem values. Further, cypress requires a particular inundation regime, not just a certain salinity, and it is not clear whether this was considered dur-
SOURCE: Foster, 2018.
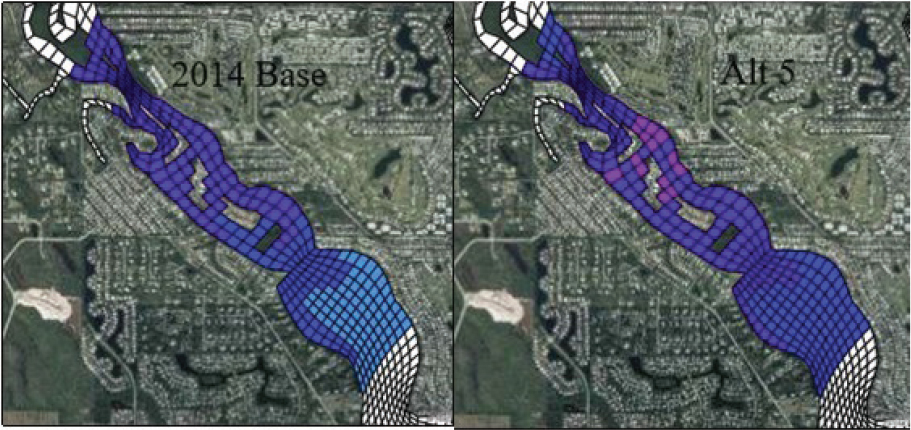
NOTE: The comparison illustrates a potential for improvement—here between Alternative 5 and the no action base based on increasing freshwater flows. The colors correspond to percentages of time that salinities are in the desired range. The light blue color is <20%, deep blue 20-40%, dark blue 40-60%, and purple 60-80%. The region that most often meets the salinity performance target is pushed downstream, and an area develops up-river with salinities meeting the target more than 60% of the time, which does not exist in the base.
SOURCE: SFMWD, 2017.
ing project development or evaluation. Finally, of the various CERP restoration projects, this project is among those particularly sensitive to the effects of sea-level rise, which was not incorporated explicitly into alternatives analysis and selection (J. Leeds, SFWMD, personal communication, 2018). The agencies assume that they will be able to overcome this issue through adaptive management, which becomes a greater factor in affecting salinity in the mangrove-cypress transition area every year. Yet it remains to be seen whether any amount of adaptive management can be effective out to 2050, especially in times of drought. The CERP agencies have mentioned plans to examine potential effects of sea-level rise on project benefits, which the committee considers to be a critical next step because future sea-level rise could potentially negate this project’s value, at least regarding prevention of further upstream expansion of mangrove.
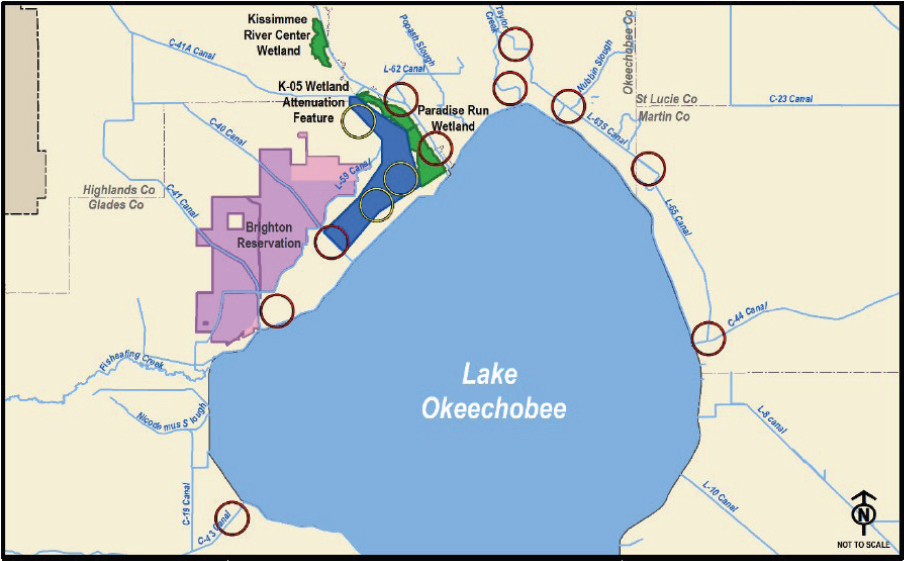
Lake Okeechobee Watershed Restoration Project
The Lake Okeechobee Watershed Restoration Project located north of Lake Okeechobee is intended to provide additional storage to improve the quantity, timing, and distribution of flows into Lake Okeechobee to reduce the occurrence of extreme high and low water levels, improve systemwide operational flexibility, reduce high-volume estuary discharges, increase the spatial extent and condition of wetland habitat, and increase available water supply (M. Ferree, SFWMD, personal communication, 2018). Project goals do not include improving delivery of water to the remnant Everglades. The 3-year USACE planning process began in 2016. Project features that are being evaluated to deliver benefits include reservoirs, ASR wells, wetland/floodplain restoration, perpetual flowage easements, and interbasin transfers. Deep injection wells to dispose of water were discussed in early planning meetings but are not part of the proposed project.
Based on technical analyses, numerical modeling, public input, and other factors, the project delivery team identified three alternatives, each including reservoir storage (ranging from 65,000 to 276,000 AF), ASR wells, and wetlands restoration on the north side of Lake Okeechobee. From this analysis, the team tentatively selected a plan that includes 43,000 AF of storage in a shallow (4 feet average depth) “wetland attenuation feature” designed to enhance habitat benefits, 80 ASR wells (with 448,000 AF/year storage capacity), and approximately 5,300 acres in wetland restoration (Figure 3-19).
The $1.4 billion tentatively selected plan is predicted to reduce the number of months of high water discharge (>2,800 cfs) from Lake Okeechobee to the Caloosahatchee Estuary by 10 percent (or by 7 months in the 41-year modeled scenario) over the future without project scenario. The plan is predicted to reduce the number of 2-week periods of high discharge from Lake Okeechobee by 46 percent in the 41-year simulation (or 17 times that the 14-day moving average is greater than 2000 cfs for more than 14 days). The tentatively selected plan is predicted to increase the percentage of time that the lake is in the ecologically preferred stage envelope from 28 to 32 percent and to reduce water supply cutbacks by 33 percent. The full analysis is documented in the project implementation report, which was released in July 2018 (USACE and SFWMD, 2018c). Because this date was late in the committee’s study process, the committee was unable to review the analysis in detail.
The specific benefits provided by ASR relative to those provided by shallow storage or by revisions to Lake Okeechobee operations were not identified. Because ASR provides 448,000 AF/year in subsurface storage compared to 43,000 AF of dynamic storage in the shallow storage feature, some critical uncertainties remain to be resolved with large-scale ASR before the project is implemented. NRC (2015) highlighted concerns regarding ecotoxicology that
SOURCE: USACE and SFWMD, 2018b.
were not resolved in the ASR Regional Study (USACE and SFWMD, 2015b) and suggested further field-scale research to resolve these questions, possibly using a cluster of ASR wells to examine the effects. Such testing would need to be incorporated into the design plan.
The modeling of project results does not account for future precipitation and temperature changes. The resiliency of each alternative to changing environmental conditions associated with climate and sea-level rise should be evaluated for all projects, but especially for one that considers the effects of lake stage on habitat conditions. Precipitation scenarios should be examined to determine whether some alternatives provide greater resilience under a wider range of future scenarios. In addition, the analyses should consider the benefits south of Lake Okeechobee to inform understanding of the systemwide benefits, avoid uncertainty regarding the ultimate disposition of water that is not discharged to the estuaries as a result of the project, and enable review of the results in the context of other planned projects, such as Central Everglades Restoration and the EAA Storage Reservoir.
Although the USACE does not consider unauthorized projects when projecting benefits, in this case the process would have benefited from analysis of the systemwide effects of the tentatively selected plan for the Lake Okeechobee Watershed Restoration Project and the proposed EAA Storage Reservoir Project in combination. The committee is concerned that the project-by-project analysis conducted thus far may result in selection of suboptimal alternatives and skew the estimation of environmental benefits attributable to individual projects. In early 2018, before the tentatively selected plan was finalized, an analysis of the combined projects assumed much larger above-ground storage for the Lake Okeechobee Watershed Restoration Project (200,000 AF) than what was ultimately chosen. Although an important first step toward more integrated analyses, this analysis should be repeated with the final plan. Modeling of the system at a larger geographic extent would also enable evaluation of synergies that would otherwise not be observable (see also Chapter 6).
Western Everglades Restoration Project
The term “western Everglades” is commonly used to refer to the Everglades landscape that extends westward from WCA-3A and the Everglades Agricultural Area and encompasses Big Cypress National Preserve, as well as reservations of the Seminole and Miccosukee tribes (Figure 3-20). This area suffers from impaired water quality, particularly from phosphorus-laden runoff from agriculture landscapes in the north and altered hydrology. Elevated nutrient levels have spurred changes in flora and fauna, degrading the biodiversity of the region and impacting habitats used for traditional cultural practices. Unnaturally high water levels drown tree islands and inundate nesting habitat along the perimeter of WCA-3A, while unnaturally dry conditions promote wildfires elsewhere within the western Everglades. The Western Everglades Restoration Project (WERP) is intended to reestablish ecological connectivity; restore hydroperiods and pre-drainage distributions of sheet flow; restore low-nutrient conditions to reestablish native vegetation; and promote ecosystem resilience. At 1,200 square miles, the WERP footprint is large, covering an area equivalent to the CEPP.
The WERP planning process is ongoing, and selection of a tentative plan is anticipated in early 2019. The three alternative plans under initial consideration shared several features, including new water control structures (weirs, culverts), levee gaps, and canal backfills, that were intended to improve hydration patterns within the interior portions of Big Cypress National Preserve and Seminole Big Cypress Indian Reservation. Each plan included stormwater treatment facilities north of the tribal areas designed to reduce nutrient concentrations associated with new water flows to meet downstream water-quality standards. While Alter-
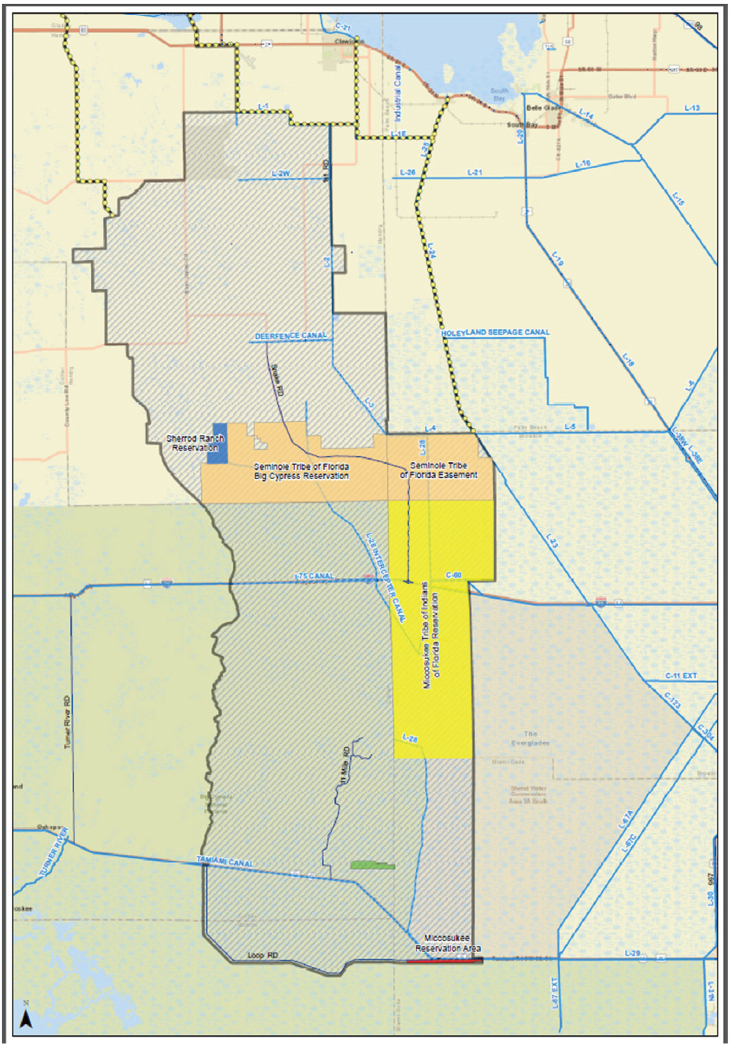
SOURCE: http://www.saj.usace.army.mil/Missions/Environmental/Ecosystem-Restoration/Western-Everglades-Restoration-Project/.
native 1 relied on a rain-driven, passive management approach, Alternatives 2 and 3 incorporated more active management features, including ASR wells and a new connection for delivering water from Lake Okeechobee. Alternative 3 also incorporated new canals that connect northern parts of the project area with Lake Okeechobee, the Caloosahatchee River, and the Miami Canal, which could provide some additional relief to the northern estuaries that receive flows from the lake.
The planning team evaluated these three alternative plans using regional and subregional models, and, as of May 2018, is developing two revised alternatives for a second round of modeling based on the features from the original plans that performed well. The planning team has also developed a resilience performance measure to assess the performance of the project in terms of its capacity to sustain ecological benefits under conditions of stress. The approach will involve training a stochastic hydrologic emulator tool, as described by Ali (2009), to approximate the hydrologic responses computed by the Regional Systems Model (RSM) for a historical period of record (e.g., 1965-2005). The trained emulator will simulate project outcomes, but with synthetic rainfall and temperature records that include periods of stress, such as a prolonged drought or a wet season with especially intense rainfall. The approach is still in development and was originally intended to be applied to all alternatives but is currently (as of October 2018) anticipated to be applied only to the tentatively selected plan (D. Crawford, USACE, personal communication, 2018). The committee lauds this effort to evaluate project resilience in the context of an uncertain future that may bring more frequent extreme events capable of threatening CERP infrastructure and of imperiling recovered and recovering portions of the ecosystem. However, analysis of resilience would be even more useful if applied earlier in the analysis of alternatives.
CERP Pilot Projects: The Decomp Physical Model
Pilot projects are limited efforts designed to provide scientific or engineering knowledge that can be applied to improve major restoration projects. They provide the opportunity to experiment with methods and approaches without incurring the large expense of fully developed restoration projects. Only one CERP pilot project is currently under way—the Decomp Physical Model (DPM). The DPM is a large-scale active adaptive management project to improve understanding of how degraded portions of the ridge and slough landscape might respond to increased water deliveries and to inform decision making regarding restoration project design and operational targets for flow in the ridge and slough landscape (see project details in Box 3-1). Four flow experiments were
executed between 2013 and 2016, and NASEM (2016) detailed the scientific findings through mid-2016. In the fourth year of the pilot, landscape modifications and sawgrass removal were explored to evaluate the potential of active slough management to reshape flow characteristics and to increase sediment movement, thereby serving as a way to jump-start restoration.
The DPM is entering a second phase of testing that will occur from 2018 to 2021. The second phase will allow for year-round discharges from S-152 subject to operational constraints based on phosphorus levels in L-67A and stages in WCA-3B and nearby canals. It will also include a large-scale active management component to increase sheet flows by modifying slough structure within the pocket. Key questions guiding the second phase of the DPM are summarized in Box 3-2. Answers to these questions will reduce uncertainties related to the spatial and temporal scales of sheet flow reestablishment and biological responses to the restored flows. Interest is especially focused on the spatial extent of restoration of sloughs and the velocities required for restoration. By extending the flow from a few months to year round, hydrologic connectivity of currently fragmented sloughs may increase. Finally, research on backfilling of canals will provide quantitative insights into sediment and phosphorus loading in the canals and the potential effects on downstream marsh areas (Choi et al., 2017). No DPM phase 2 results were available to review as of June 2018.
NON-CERP RESTORATION PROGRESS
CERP projects are not the only restoration efforts ongoing in the Everglades region. Several non-CERP projects are critical to the overall success of the restoration program, and their progress directly affects CERP progress. This section reviews new information on major non-CERP efforts, with an emphasis on natural system restoration benefits or implications for CERP progress. Progress in non-CERP projects that contribute to restoring flow, improving water quality, and controlling invasive species are also discussed.
Restoring Flow to Northeast Shark River Slough and Taylor Slough
Several non-CERP projects contribute to the overall objective of increasing flows in Northeast Shark River Slough and Taylor Slough within Everglades National Park. These include the Limestone Products Association Seepage Management project, the Modified Water Deliveries to Everglades National Park Project (Mod Waters), the C-111 South Dade Project, and the Florida Bay Initiative (Figure 3-21). Several of these projects, now completed or nearing completion, will operate together through the Combined Operations Plan to maximize the ecosystem benefits of the new water control features.
Limestone Products Association Seepage Management
Seepage management involves regulating the exchange of groundwater from natural areas into developed areas, which are separated from one another by canals, levees, or other structures. During the wet season in particular, the L-31N Canal diverts groundwater, drawn primarily from the northeastern portion of Everglades National Park, to the C-111 basin in south Miami-Dade County. As part of a non-CERP project constructed in exchange for wetland mitigation credits, the Miami-Dade Limestone Products Association constructed a seepage barrier in this area to reduce this groundwater discharge to the L-31N Canal, thereby increasing water levels and promoting greater sheet flow in northeast Shark River Slough.
Phase 1 of this project began in 2012 with the construction of a 2-mile-long seepage barrier as a pilot project. Construction of the barrier involved excavating a 32-inch-wide trench to a depth of 35 feet below the ground’s surface. The trench was filled with a concrete-bentonite slurry formulated specifically for this application. Phase 2 of the project—a 3-mile extension of the seepage barrier—was constructed in 2016 (see Figure 3-21).8
___________________
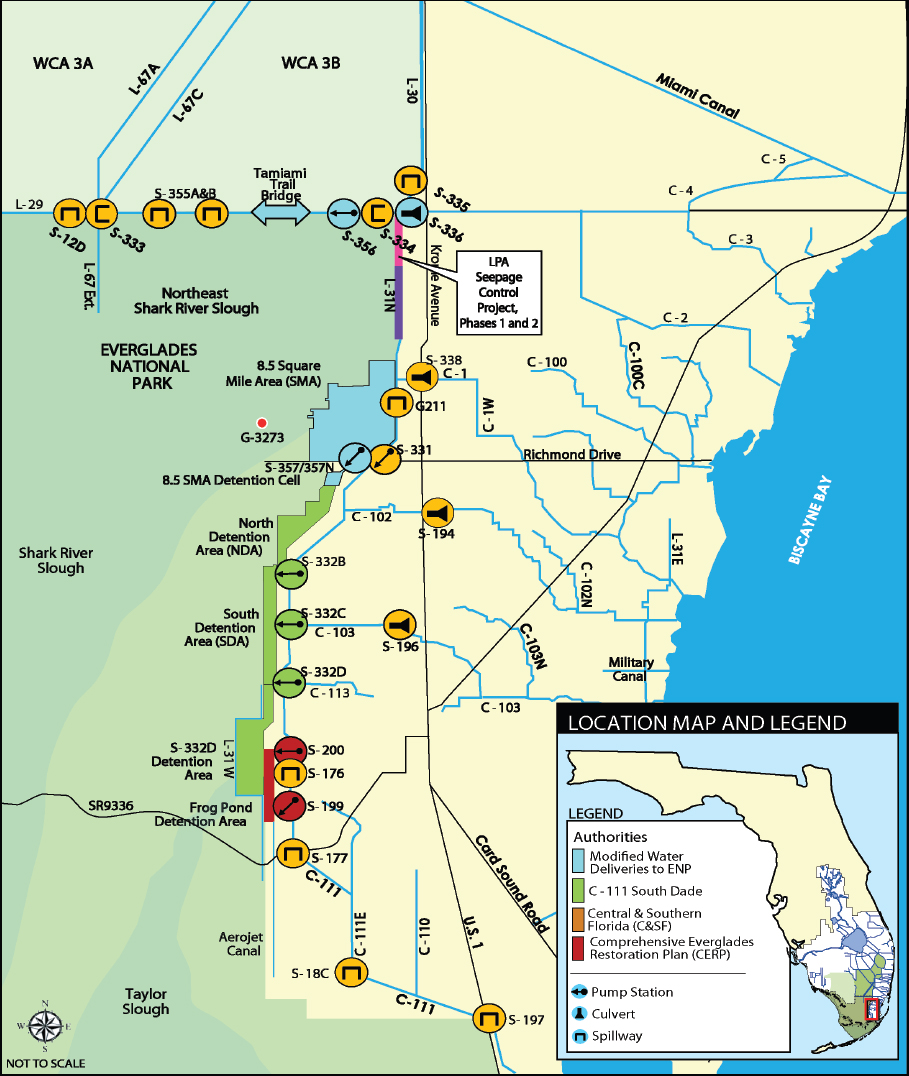
SOURCE: Modified from USACE, 2017, fact sheet.
Hydrologic measurements demonstrate the barrier is reducing seepage into the canal. Recent monitoring data indicate that the 3-mile Phase 2 barrier extension increased groundwater elevation differences across the barrier by about 0.7 to 1.2 feet during the wet conditions of 2016 and 2017, which indicate greater resistance to groundwater flow (Figures 3-22 and 3-23). This results in additional hydraulic head within the wetland to drive sheet flow through Shark River Slough. The available data are encouraging and suggest that the project is satisfying its objectives.
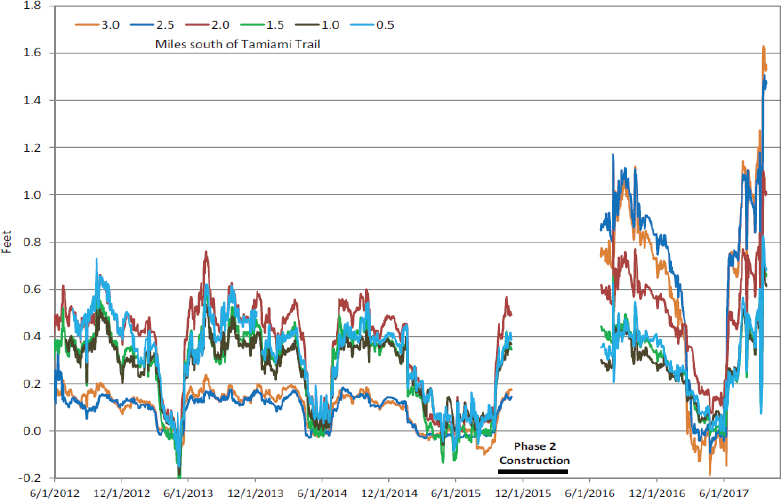
NOTE: Phase 1 of the seepage barrier extended 2 miles south of Tamiami Trail, so the 2.5 and 3.0 mile monitoring stations (orange and blue lines) served as control sites, unaffected by the project through late 2015. Phase 2 of the project extended the barrier another 3 miles to the south, and the post-construction monitoring shows even greater differences in water levels for the 2.5- and 3-mile sites than the Phase 1 sites. These central sites are the farthest from the ends of the seepage barrier.
SOURCE: T. MacVicar, MacVicar Consulting, personal communication, 2017.
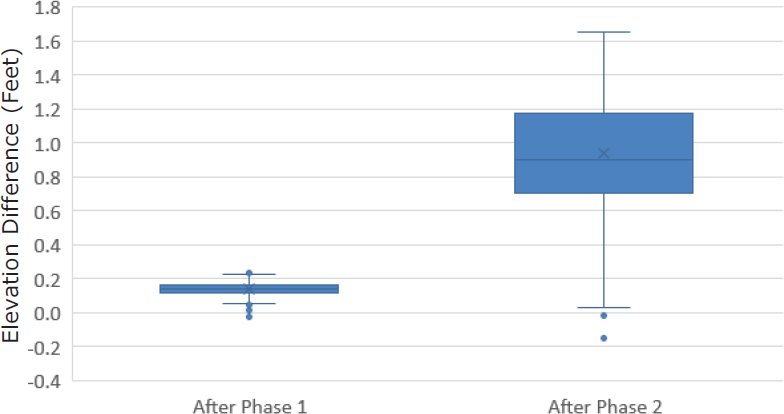
NOTE: “After Phase 1” includes wet season data from 2012 to 2015, and “After Phase 2” includes wet season data from 2016 to 2018.
SOURCE: T. MacVicar, MacVicar Consulting, personal communication, 2018.
Modified Water Deliveries to Everglades National Park Project
Congress provided legislative authority in 1989 for the creation of a project to improve water flows into Everglades National Park, where Everglades micro-topography and vegetation were in decline as a result of insufficient inflows. In 1992, the General Design Memorandum (GDM) for the Modified Water Deliveries to Everglades National Park Project (Mod Waters; USACE, 1992) envisioned several features to increase the flow of water from WCA-3 into Everglades National Park to accommodate flows up to 4,000 cfs. Increasing the flow of water from WCA-3A into Northeast Shark River Slough is a central aspect of Everglades restoration, and the capacity for successful southward movement of waters provided by the CEPP and other future CERP projects depend critically upon the conveyance, seepage reduction, and flood management provided by Mod Waters. Hence, completion of Mod Waters is essential to the ultimate success of
the CERP. An extensive discussion of the history and details of this long-delayed project was provided by NRC (2008), and updates on progress are provided in each of the succeeding biennial reviews.
Construction of all major components of Mod Waters was completed in May 2018, including flood mitigation in the 8.5-square-mile area, conveyance and seepage control, and the 1-mile bridge on Tamiami Trail (see Figure 3-21; Gonzales, 2018). Operation of the project will be determined based on the Combined Operational Plan, discussed later in this section.
Although the 1-mile Tamiami Trail bridge is the sole bridging feature within Mod Waters, a 2.3-mile western bridge is under construction under the Tamiami Trail Modifications: Next Steps Project, with construction completion estimated in December 2018. Engineering design is also under way on Tamiami Trail Next Steps Phase 2, which would include raising 6.7 miles of roadbed to accommodate CERP design water levels of 9.7 feet in the L-29 Canal and installing additional culverts and concrete arches in the locations of historic sloughs (R. Johnson, DOI, personal communication, 2018). These projects combined with construction of the Central Everglades S333-N gated spillway (estimated to start construction in October 2018) are projected to improve the capacity to move water from WCA-3A into Everglades National Park, reducing the damage associated with high water conditions in the WCAs and increasing flows to Northeast Shark River Slough.
C-111 South Dade
The C-111 South Dade Project provides the connection between Mod Waters and L-31N Seepage Management projects to the north and the C-111 Spreader Canal (Western) Project to the south (described earlier in this chapter; see Figure 3-21). This major modification to the Central and South Florida (C&SF) Project’s C-111 Canal was authorized in 1994 to maintain existing flood protection and other C&SF project purposes in developed areas east of C-111, while restoring natural hydrologic conditions in the Taylor Slough and eastern panhandle areas of Everglades National Park (USACE, 2015b). Increased freshwater flows in these areas also help conditions in Florida Bay.
The C-111 South Dade Project consists of a combination of large detention areas and levees, pump stations and structures, bridges, and backfilling (Figure 3-21; USACE, 2015b). The overall project contributes to maintenance of the hydraulic ridge along the C-111 corridor, thereby reducing seepage to the east. The South Detention Area was completed and operational in 2010. Benefits from the project operations to date are discussed collectively with the C-111 Spreader Canal Project, discussed earlier in the chapter. The final features of the C-111 South Dade Project are scheduled for completion by fall 2018 (Gonzales,
2018). The C-111 South Dade Project will ultimately be operated and evaluated as part of the Combined Operational Plan.
Combined Operational Plan
As the final components of the Mod Waters and C-111 South Dade projects are nearing completion, efforts have recently been focused on developing the Combined Operational Plan for the system that will be used to meet the overarching objectives of the projects. These objectives include increasing flows from WCA-3A into Northeast Shark River Slough, maintaining higher water levels in Everglades National Park without exacerbating flooding in suburban and agricultural lands to the developed east, increasing flows to Taylor Slough and Florida Bay, and reducing regulatory discharges from WCA-3A through the S-12 structures or south through the South Dade Conveyance Canals. In 2015, in cooperation with Everglades National Park, the USACE began a phased implementation of operations of Mod Waters and C-111 facilities to move more water into Northeast Shark River Slough and obtain data needed to develop the operating plan (Box 3-3; NPS, 2016; USACE, 2016b). The Everglades Restoration Transition Plan (ERTP; George, 2016) previously defined operations for the constructed features of the Mod Waters and C-111 South Dade projects. Completion of the Combined Operational Plan is anticipated in 2020.
Florida Bay Project
In July 2016, the SFWMD launched a new state-funded initiative to move more water into Taylor Slough and Florida Bay via infrastructure modifications in the area near the S-332D detention area and the Frog Pond (see Figure 3-21). Modifications include expedited completion by the SFWMD of authorized C-111 South Dade features, which included adding 10 plugs, an additional weir in the L-31W Canal, and levee removal in the S-332D detention area to promote more flow into Taylor Slough. Other work includes sealing the S-332D discharge basin and adding pump capacity in the S-199 and S-200 pumps in the C-111 canal (W. Wilcox, SFWMD, personal communication, 2018). A new connection between the Frog Pond detention area and the L-31W canal (G-737; see Figure 3-24) was added by the SFWMD under the Florida Bay Project and completed in 2017 (Qui et al., 2018).
Rather than constructing a hydraulic ridge as is used in the C-111 South Dade and C-111 Spreader Canal Western projects, the Florida Bay Project enhances direct discharge into Taylor Slough. The project initially raised concerns about whether additional loads of phosphorus associated with higher
flows of water that meets all water quality criteria would trigger an ecological imbalance in Taylor Slough. State and federal agencies are partnering to support a comprehensive monitoring and adaptive management plan to examine the project effects on downstream water quality, floc nutrient content, periphyton, vegetation, invertebrates, and fish in Taylor Slough. The committee supports this initiative and the comprehensive monitoring and adaptive management program. This effort should greatly inform understanding of the ecosystem response to increases in nutrient loads associated with increases in discharge and should resolve uncertainties in a structured process along the way.
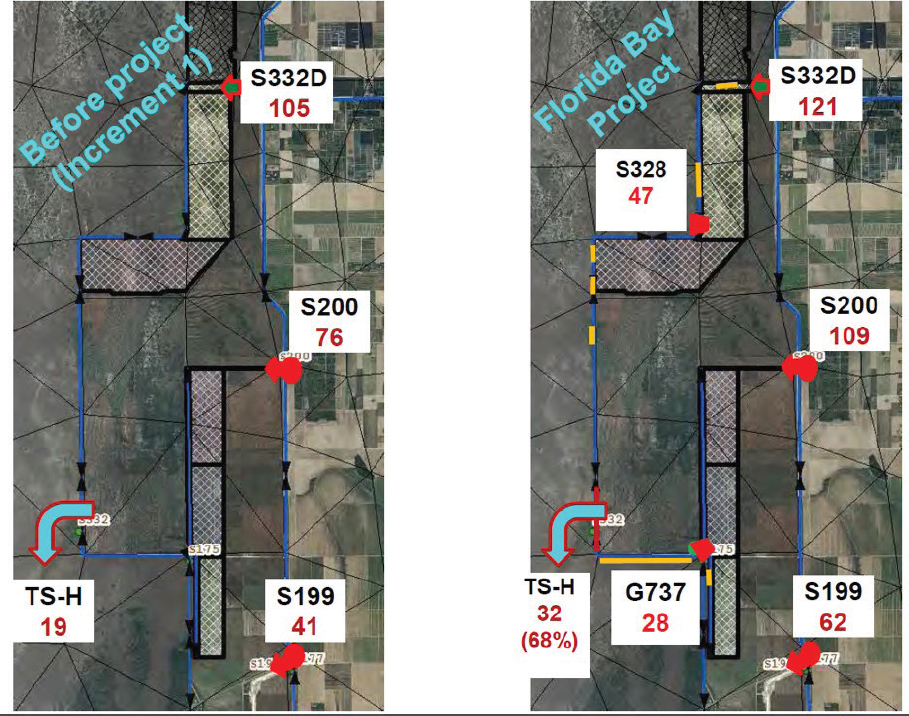
SOURCE: W. Wilcox, SFWMD, personal communication, 2018.
Everglades Water Quality Initiatives
The Everglades is an oligotrophic system whose productivity is limited by phosphorus. Historically, concentrations of phosphorus were very low in soil and water. Elevated inputs of phosphorus from agriculture, urban development, and other human activities can and have altered the structure and function of the wetland. The Everglades Forever Act and the water quality standards for phosphorus in the Everglades Protection Area established the concentrations of total phosphorus necessary to protect the ecosystem. These values are used to guide
water quality management in the Everglades using field data from monitoring programs. Achieving these water quality goals is critical to progress in moving water into the Everglades Protection Area (see Chapter 2), and therefore, progress addressing water quality throughout the watershed has implications for CERP progress. Phosphorus dynamics in Lake Okeechobee, which will be the source of most of the new water in the CERP, is discussed in Chapter 4.
Stormwater Treatment Areas
The state of Florida’s 1994 Everglades Forever Act authorized the construction and operation of large constructed wetlands, known as STAs. These STAs are central to the state efforts to restore and protect water quality and maintain the structure and function of the Everglades Protection Area. In 2012, the SFWMD developed its “Restoration Strategies” plan, which provides for expanding existing STA acreage to meet the water quality–based effluent limitation (WQBEL) for discharges from the STAs. The WQBEL requires (1) a maximum total phosphorus annual flow-weighted mean of 19 parts per billion (ppb) and (2) a long-term flow-weighted mean of total phosphorus concentration of 13 ppb not to be exceeded in more than 3 of 5 years (Leeds, 2014).
The STAs are designed and operated by the SFWMD to decrease total phosphorus concentrations in surface water prior to discharge into the Everglades Protection Area. Including the recent expansions of STA-2 and STA-5/6, pursuant to the SFWMD’s Restoration Strategies, a total of 57,000 acres of treatment area is currently permitted to operate. To support the operation of STA-3/4 and STA-2, the A-1 FEB, with 56,000 AF of water storage capacity, was completed in 2016. A second FEB (L-8) with approximately 45,000 AF of water storage capacity to improve the function of STA-1E and STA-1W should be completed in 2018 (see Figure 3-25 and Table 3-5). Flow equalization basins should improve STA performance by limiting large water and phosphorus inputs during wet periods to ensure adequate treatment and supplying water during dry periods to ensure that treatment cells retain some water to maintain their function.
For the operational period from 1995 to present, the STAs in total have treated approximately 18.6 million AF of water (~6 trillion gallons). This treatment has removed 2,300 metric tons (mt) of total phosphorus from water flows entering the Everglades Protection Area, with an overall removal rate of 77 percent (Figure 3-26). During this period, the flow-weighted mean concentration of total phosphorus in the outflow has been 31 ppb.
In 2017, the STAs treated a combined 1.1 million AF of water, retaining 108 mt of total phosphorus. This treatment level is equivalent to an 84 percent reduction in the total phosphorus load, resulting in a flow-weighted mean of 15 ppb
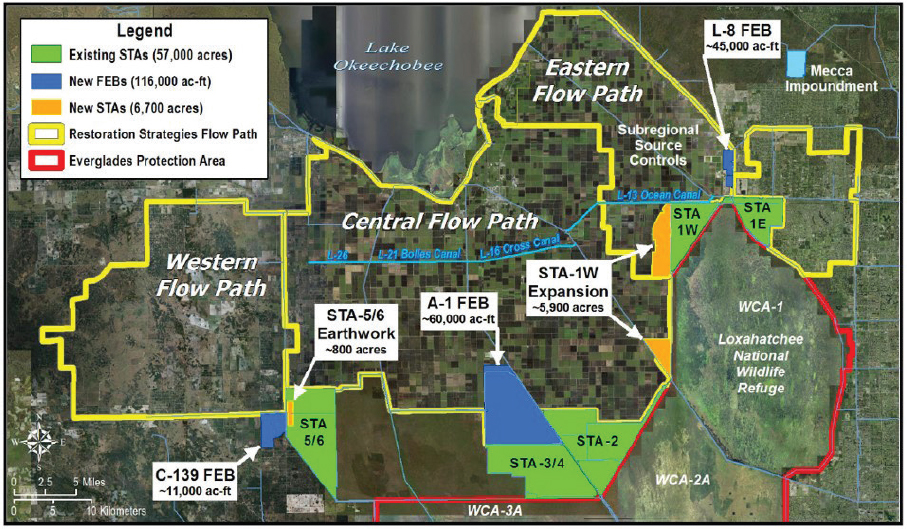
SOURCE: SFWMD.
total phosphorus concentration in the outlet water. This level is the lowest flow-weighted mean concentration of total phosphorus attained to date for the combined annual discharge from the STAs. The flow-weighted mean concentrations of total phosphorus in outflow of individual STAs ranged from 11 ppb (STA-3/4) to 23 ppb (STA-1W) in 2017, while the percentage of the total phosphorus load retained in the STAs ranged from 80 (STA-3/4) to 87 percent (STA-1E, STA-5/6).
Since the early 2000s, the STAs have steadily improved in phosphorus removal from water inflows, despite marked event-based, seasonal, and annual variation in water and phosphorus loads. With the FEBs coming on line, the performance of the STAs is expected to continue to improve. The performance of the STAs is approaching the WQBEL discharge limit. If the removal of total phosphorus continues to improve and remains below the discharge limit of 13 ppb over the longer term (more than 2 of 5 years), then STA discharges can be redistributed as contemplated by the CERP and the CEPP.
TABLE 3-5 Summary Status of Major Restoration Strategies Project Elements
| Component | Purpose | Status | Construction Completion |
|---|---|---|---|
| Eastern Flowpath | |||
| L-8 FEB | Attenuate flow into STA-1E and -1W | Completed | June 2017 |
| L-8 Conveyance Features (G-716, G-341, G-541) | Assist movement of inflows and outflows to L-8 FEB | Most completed; G-341 under construction | TBD; final phase to begin February 2019 |
| STA-1W expansion (Phase 1) | Increase STA-1W effective treatment area | Under construction | December 2018 |
| STA-1W expansion (Phase 2) | Increase STA-1W effective treatment area | Design under way | TBD |
| Central Flowpath | |||
| A-1 FEB | Attenuate flow into STA- 2 and -3/4 | Completed | 2015 |
| Western Flowpath | |||
| STA 5/6 Earthwork | Improve the performance of STA-5/6 | Under construction | TBD |
| C-139 FEB | Attenuate flow into STA- 5/6 | Design underway | TBD |
SOURCE: https://www.sfwmd.gov/documents-by-tag/resstrategies; Jacoby, 2018; M. Jacoby, SFWMD, personal communication, 2018.
Water Quality in the Everglades Protection Area
The SFWMD has developed mass balances of water and nutrients for the Everglades. These mass balances are useful because they provide a systemwide perspective on the inputs and processing of important constituents (Figure 3-27) (Julian et al., 2018). Figure 3-27 shows that over the most recent 5-year period (2013-2017), 139 mt of total phosphorus was exported from Lake Okeechobee to the EAA or STAs. After flow through the EAA, 193 mt entered the STAs, with only 34 mt exported from the STAs.
Time series analysis of the period of record (1979-2016) has shown significant decreases in annual geometric mean concentrations of total phosphorus for inflows to the Loxahatchee Natural Wildlife Refuge (WCA-1), WCA-2, and WCA-3, which reflects the continued improvement of the phosphorus removal of the STAs. Similar trends were also evident over the more recent 2005-2016 time period. Total phosphorus concentrations in inflows to Everglades National Park have been variable and, unlike trends observed in other regions, have not steadily declined over the period of record. However, recent decreases in total phosphorus concentrations were evident for interior monitoring sites in
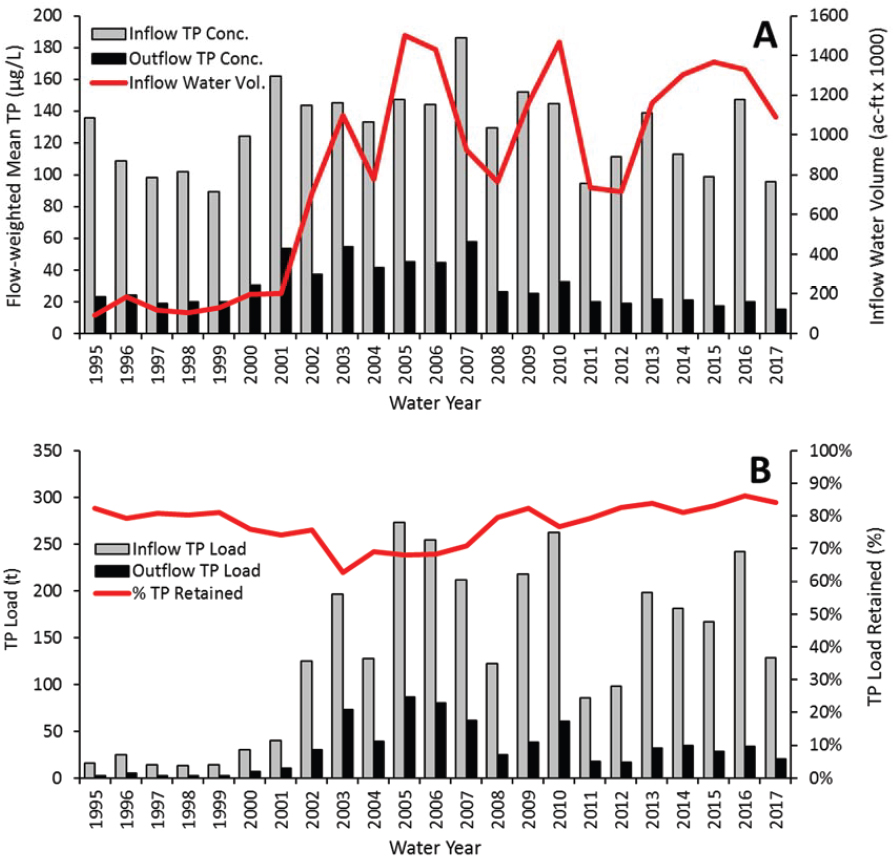
SOURCE: Chimney et al., 2018.
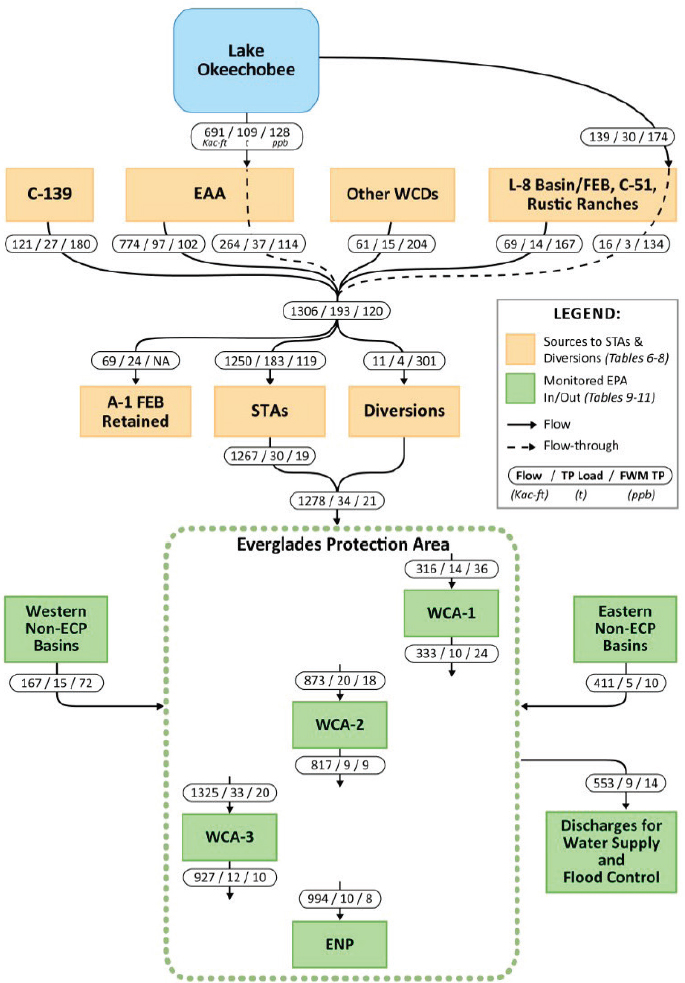
NOTE: WCD = water control district and ECP = Everglades Construction Project.
SOURCE: Julian et al., 2018.
Everglades National Park as well as WCA-2 and WCA-3. Seventy-one percent of the interior marsh sites had annual geometric mean concentrations of total phosphorus of 10 ppb or less, while 79 percent throughout the greater ambient monitoring network had annual geometric mean concentrations of total phosphorus of 15 ppb or less (Figure 3-28; Julian et al., 2018).
Analysis of data from the water quality monitoring program for 2013-2017 showed that unimpacted portions of the WCAs passed all four parts of the compliance test.9 Impacted (i.e., phosphorus-enriched) sites of the WCAs, however, routinely failed one or more parts of the compliance test. Total phosphorus concentrations at some of the impacted sites were below the long-term and annual limits and appear to be transitioning from impacted to unimpacted conditions. Overall, the STAs have been effective in removing phosphorus from inflowing waters, and removal efficiency is improving with time. The Everglades water quality is expected to continue to improve as additional FEBs and STAs come on line through Restoration Strategies.
Planning for Invasive Species Management
Invasive exotic species present a major challenge for Everglades restoration (NRC, 2014). At least 192 exotic animal species are established in the Greater Everglades, and 75 plant species are listed as priorities for control by the SFWMD (NRC, 2014). Ideally, the restored Everglades would have only the species found there before European occupation, but that goal cannot be achieved. Most established exotic species in the region cannot be exterminated, and populations of some of them cannot even be controlled. The “restored Everglades” will inevitably have a combination of its pre-European biota and many exotic species. Being able to predict which exotic species are most likely to become established and cause undesirable effects would be very helpful to managers and decision makers (NRC, 2014). Perfect prediction is impossible, but partial predictive success can be extremely valuable for informing decisions concerning how to target efforts to prevent introduction of potentially invasive species and how to control already established exotic species. NRC (2014) recommended, among other things, development of a “strategic early detection and rapid response (EDRR) system that addresses all areas, habitats, and species.”
A screening tool for managers to use to assess the need to initiate a rapid response, as well as the resources and knowledge available to support
___________________
9 The four-part test is used to assess compliance according to the following four provisions: (1) 5-year geometric mean is less than or equal to 10 ppb, (2) annual geometric mean averaged across all stations is less than or equal to 11 ppb, (3) annual geometric mean averaged across all stations is less than or equal to 10 ppb for 3 of 5 years, and (4) annual geometric mean at individual stations is less than or equal to 15 ppb (FAC §§ 62.302.540).
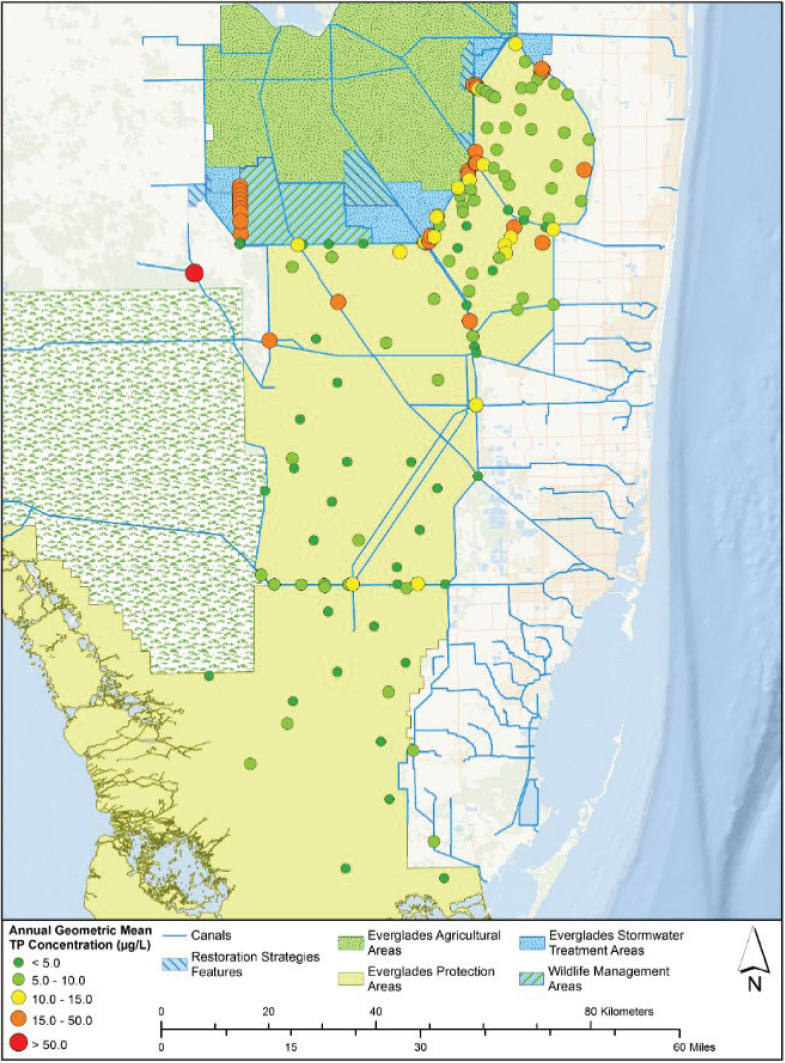
SOURCE: Julian et al., 2018.
that response, is in development. The tool consists of a systematic evaluation of information about species—both potential invaders and invasive species already present—that then permits a qualitative evaluation of the likelihood that a species will become established and invasive. The tool is being tested against invasive species that exist in the system to determine how well it would have worked if it had been used with the information available at that time. To date, a retrospective analysis of more than 100 species has largely confirmed the tool’s usefulness (C. Romagosa, personal communication, 2018). In addition, the tool could help guide research of established exotic species by evaluating the potential value of different kinds of information.
CONCLUSIONS AND RECOMMENDATIONS
CERP project implementation remains in the early stages. If recent (5-year average) federal funding levels continued and were matched by the state, construction of the remaining components of the congressionally authorized projects could take approximately 65 years; construction of projects in planning or those currently unplanned would further lengthen that timeline. At this pace of restoration, it is even more imperative that agencies anticipate and design for the Everglades of the future.
Incremental restoration progress from early CERP projects is difficult to evaluate because of a lack of rigorous assessment of outcomes relative to project goals and some limitations in existing monitoring plans. The committee reviewed available data and analysis on the restoration progress associated with three early CERP projects in which substantial project components are now in place and operating. The Picayune Strand Restoration Project shows increased water levels in the area of the two canals plugged to date. Hydrologic conditions are expected to improve further toward conditions at the reference sites once neighboring canals are plugged. Some early indicators of habitat response at Picayune Strand are apparent in the species composition of groundcover vegetation and suppression of some exotic species, but other ecological indicators, such as increased cypress regeneration, have not shown significant change. This lack of response could be due to lag times in ecological response, limitations in the monitoring plan, or insufficient hydrologic restoration to date. Analysis of these or other factors is an essential but missing component of performance assessment (see Chapter 4). At the C-111 Spreader Canal Project, neither hydrologic nor ecological response in Taylor Slough or Florida Bay due to the project has been documented based on monitoring data, because the monitoring and assessment plans are not robust enough to discern project impacts from existing hydrologic variability. The lack of specific numeric targets and an explicit
plan and model to evaluate restoration progress hinders restoration assessment of these two projects. The Biscayne Bay Coastal Wetlands monitoring program has documented hydrologic and ecological responses, although both are limited by the small spatial scale of the components that have been implemented and important project components that are not yet constructed.
Concurrent project planning efforts have significantly advanced the CERP vision for water storage, but a holistic understanding of the benefits of the combined projects at a systemwide scale and their resilience to sea-level rise and climate change is lacking. Tentatively selected plans have been developed for the EAA Storage Reservoir and the Lake Okeechobee Watershed Restoration Project, which together propose adding 283,000 AF of surface storage and 80 ASR wells. Each project is expected to reduce high-volume discharges from Lake Okeechobee to the Northern Estuaries and to modestly improve the period that Lake Okeechobee stage is at ecologically preferred levels. The EAA Reservoir also provides moderate hydrologic improvements to WCA-2A and northern WCA-3A. By 2019, all of the large CERP storage projects at the northern end of the system will have been planned, with only the southern storage (i.e., Lake Belt) remaining unresolved. Preliminary modeling suggests that, with system optimization, the full storage planned in the original CERP may not be needed to provide the flows into the northern end of the Everglades as envisioned in the CERP. However, an integrated, systemwide modeling of the planned projects is needed to understand the combined benefits relative to restoration objectives. More rigorous analysis of the potential effects of climate change and sea-level rise on restoration outcomes is necessary in planning for all projects, so that restoration investments are designed for and more resilient to future conditions. The SFWMD and the Interagency Modeling Center have the talent and tools to conduct these analyses, and the SFWMD is pursuing this approach for planning and management issues outside of the CERP.
Impressive advances have been made toward water quality objectives in the stormwater treatment areas. The lowest flow-weighted mean total phosphorus concentrations to date (15 ppb for all STAs combined) were attained in water year 2017, and continued water quality treatment and science investments through the Restoration Strategies program are expected to further reduce phosphorus levels toward the 13 ppb goal. Achieving this goal is a necessary step to move forward with new water flows in the central Everglades. Understanding the dynamic ecological responses to restored flows (and the relative importance of phosphorus concentration and load in controlling ecosystem response) during these transitions is an emerging challenge. Where existing flows are currently being redistributed, as in the Decomp Physical Model and the non-CERP Florida Bay Initiative, project teams are following adaptive management approaches
where feasible to learn from these efforts and to inform future Everglades flow restoration projects.
The recent completion of two major non-CERP projects is expected to provide important restoration benefits to Everglades National Park and increasing operational flexibility for managing high water events throughout the remnant Everglades. Completion of the Mod Waters and C-111 South Dade projects in August 2018 is a major achievement that has been more than 25 years in the making. Development of the Combined Operational Plan is under way, which will quantify the benefits provided by these projects.
This page intentionally left blank.


