
4
Will the Minimization and Mitigation Measures Meet the Biological Objectives?
This chapter addresses the second part of the Committee’s statement of task, that is, whether the minimization and mitigation (M&M) measures are meeting the biological objectives. Rather than consider the dozens of M&M measures individually, this chapter is organized by category of M&M measure, with five major categories being identified: (1) flow protection measures, (2) measures to protect water quality, (3) planting of submerged aquatic vegetation (SAV) including Texas wild rice and removal of nonnative vegetation, (4) recreation management, and (5) riparian restoration. For each category, the section describes the relevant M&M measures and the extent of their implementation, it shows monitoring data when available, and it summarizes what is known about the effectiveness of the M&M measures. Each section concludes with a determination that the suite of measures in that category is (1) highly effective, (2) effective, (3) somewhat effective, (4) ineffective, or (5) effectiveness cannot be determined with available information. These ratings are parallel to those given in Chapter 3 in terms of the information necessary to achieve a certain rating and the role of uncertainty. Because the Committee did not separate out the contributions of individual M&M measures, it was not possible to determine whether all of the individual measures were required to meet that rating. Each section also suggests what might be done in the near future to increase the rating for that category.
TABLE 4-1 Flow Protection Measures in the Habitat Conservation Plan
| M&M Measure (HCP Section) | Spring System | Purpose |
|---|---|---|
| Voluntary Irrigation Suspension Program Option (5.1.2) | Comal and San Marcos | Reduces water withdrawals for irrigation based on irrigation well levels |
| Regional Water Conservation Program (5.1.3) | Comal and San Marcos | Reduces water withdrawals for municipal use based on conservation efforts such as leak detection and repair |
| Aquifer Storage and Recovery (5.5.1) | Comal and San Marcos | Water banking for later use |
| Critical Period Management Stage V (5.1.4) | Comal and San Marcos | 44% water withdrawal reduction for municipal, industrial, and irrigation use based on spring flow and index well water levels |
FLOW PROTECTION MEASURES
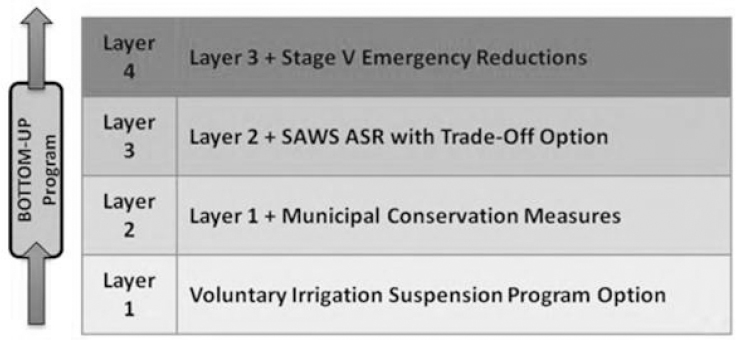
The four flow protection measures of the Habitat Conservation Plan (HCP) are (1) Critical Period Management Stage V, (2) the San Antonio Water Supply Aquifer Storage and Recovery, (3) the Voluntary Irrigation Suspension Program Option (VISPO), and (4) the Regional Water Conservation Program (RWCP). These four flow protection measures (Table 4-1) are the most expensive elements of the entire HCP and comprised 71 percent of the HCP 2017 expenses, totaling $12.2 million through 2017 (Blanton and Associates, 2018). The measures have been designed to maintain the required minimum flows needed by the listed species in the Comal and San Marcos Spring systems during the Drought of Record and are applied in a Bottom-Up approach as needed to maintain those flows (Figure 4-1). Given the central importance of these two facts, a determination of whether these flow protection measures are effective is crucial to evaluating the overall success of the HCP.
An important tool for evaluating the flow protection measures is provided by the system responses to 2013–2014 drought conditions, since it is the only period when all five Critical Period Management stages1 and
___________________
1 The Critical Period Management stages I through IV predate the HCP, with precursor versions having originated from EAA rulemaking beginning in 1997 and amendments occurring thereafter, with eventual codification of the current version in the passage of Senate Bill 3 in 2007. The bill directed the EAA to adopt and enforce withdrawal reductions of up to 40 percent in the San Antonio Pool and 35 percent in the Uvalde Pool based on spring flow and
VISPO have been implemented to date. Both 2015 and 2016 were relatively wet years, and although 2017 saw a return to a drier cycle, only Stage I Critical Period Management was triggered (a 20 percent withdrawal reduction in the San Antonio Pool). The Aquifer Storage and Recovery system is not yet fully implemented but seeks to protect 50,000 ac-ft of Edwards permits from being withdrawn during certain drought conditions. The Regional Water Conservation Program is not expected to be fully implemented until 2020. Thus, these latter two programs have not yet been tested.
In the absence of observations during times of extreme drought, the basis for demonstrating the impacts of the flow protection measures on the flow in both systems is the MODFLOW model of the Edwards Aquifer. Since the original 2004 MODFLOW model was created to serve as the basis for the Bottom-Up program that frames the spring flow protection measures (HDR, Inc., 2011), significant steps have been taken to improve the modeling effort, not only to allow for a more accurate analysis of the four measures but also to provide a more effective management tool.
Adaptive management concepts have underpinned implementation and maintenance of the flow protection measures through monitoring progress and evaluating lessons learned. The Edwards Aquifer Authority (EAA) has
___________________
index well index well levels. Critical Period Management Stage V was developed under the HCP; hence it is referred to in Table 4-1 and Figure 4-1. Details on all five CPM plan stages are presented in a later section of this chapter.
also taken steps to look beyond these flow protection measures by exploring other aspects of water quantity optimization, including continued assessment of aquifer hydraulics, collaboration with the U.S. Department of Agriculture Natural Resources Conservation Service conservation activities within the EAA, recharge protection, and long-term aquifer storage strategies (Hamilton and Boenig, 2017).
In this section, updates on the four flow protection measures are provided, followed by a discussion of MODFLOW model refinements and reduction of uncertainty since Report 2 (NASEM, 2017). The section ends with a determination of whether the flow protection measures can achieve the flow component of the biological objectives in the HCP (see Chapter 3 for details on the flow objectives for the Comal and San Marcos systems).
Voluntary Irrigation Suspension Program Option
VISPO involves voluntary enrollment by irrigation permit holders for a five- or ten-year period, requiring enrolled permit holders to suspend pumping for one year in the event of triggering condition in index well J-17. Specifically, if on October 1 of the prior year the water-level elevation in J-17 drops to equal or below 635 ft mean sea level, this trigger occurs. Participants receive an annual payment (“Standby Fee”) of $50/ac-ft of the pledged withdrawal rights under the VISPO Forbearance Agreement. In years when a suspension of water use is mandated by the trigger, participants receive an additional Forbearance Payment, which equals $150/ac-ft per annum of the pledged withdrawal rights that the permittee will be unable to withdraw. The Standby Fee and Forbearance Payment are increased each year by 1.50 percent, compounded annually, starting with the year after the agreement became effective.
There are two types of withdrawal rights encompassed by the program: (1) Base Irrigation Groundwater that is restricted to irrigation use, and (2) Unrestricted Irrigation Groundwater that is not restricted by location or purpose. VISPO enrollees to date have preferred the Base over the Unrestricted program by a factor of more than 3:1.
The VISPO enrollment goal of 40,000 ac-ft was met in 2014 and is now 40,921 ac-ft. Many individuals enrolled in the late summer and early fall of 2014 as it became clear that restrictions would likely be triggered in 2015. The J-17 indicator well was below 635 ft on October 1, 2014, and the VISPO program was triggered throughout 2015. Because of abundant precipitation in 2015 and 2016, VISPO was not triggered in 2016 or 2017. As a result, the permit holders could use the enrolled water.
Payouts for VISPO through 2017 totaled $2.21 million (Blanton and Associates, 2018). Renewal of the VISPO agreements will be important since 42 agreements totaling 9,489 ac-ft will expire at the end of 2018.
Regional Water Conservation Program
The RWCP allows municipal, industrial, and exempt private well owners to offset their pumping through a series of conservation measures, including leak detection, use of high-efficiency plumbing, commercial or industrial retrofit rebates, and water reclamation. Under the HCP, the goal of this program is 20,000 ac-ft, where half of the conserved groundwater will be available for pumping and the other half is placed in a Groundwater Trust, thereby reducing stress on the aquifer and springs (Blanton and Associates, 2017). As an example, near the end of 2016, the City of Uvalde distributed more than 525 high-efficiency, low-flow toilets and more than 500 plumbing kits to city residents. The San Antonio Water System (SAWS) is implementing a five-year leak detection and repair program that alone may nearly satisfy the goals of the RWCP due to estimated savings totaling 19,612 ac-ft, half of which will be held in the Groundwater Trust and is not to be pumped through 2028 (Blanton and Associates, 2018).
Aquifer Storage and Recovery
SAWS Aquifer Storage and Recovery (ASR) facility is the most expensive of the four flow protection measures. Withdrawn groundwater from the Edwards Aquifer is pumped via pipeline and stored underground in the Carrizo Aquifer at the SAWS ASR facility in south Bexar County. In the event of severe aquifer conditions in the Edwards and spring flow conditions at Comal Springs, ASR water could be recovered at SAWS discretion and redistributed to San Antonio when demand is high in order to offset any prescribed forbearance of permitted Edwards withdrawals required of SAWS under this program (EARIP, 2012; EAA and SAWS, 2013).
The overall goal of the ASR program is for the EAA to acquire 50,000 ac-ft through lease and forbearance agreements, for a total of up to 176,000 ac-ft potentially required to be forborne between the EAA (50K) and SAWS (126K) during the prescribed drought conditions that trigger forbearance. A total of 126,000 ac-ft could be redistributed by SAWS to its customers during such drought conditions. Through 2017, 32,583 ac-ft was leased by permit holders for SAWS ASR storage toward the spring flow protection goal, bringing the total storage to 82,708 ac-ft (Blanton and Associates, 2018).
Two mutually beneficial programs, the ASR Leasing Program and the ASR Pooling Program, offer opportunities to permit holders while achieving conservation benefits and storage in the event of Drought-of-Record conditions. The ASR Leasing Program offered 1-, 5-, 7-, 10-, and 15-year terms for specified volumes of unrestricted groundwater. With a 5-year lease, for example, the program annually pays $140/ac-ft. This leasing program is
ideal for permit holders who know they will not need specific volumes of water over the agreed-upon lease period. In 2018, the EAA discontinued accepting or renewing ASR leases because the SAWS ASR will soon be recharged with sufficient groundwater to meet the EAA’s and SAWS’ storage obligations under this program. For this reason, the EAA has shifted its focus to obtain forbearance agreements (rather than leases or lease options) to fill out the remainder of the 50,000 ac-ft.
The ASR Pooling Program is more flexible, while incentivizing conservation through fiscal compensation. This program allows the permit holder to pool unpumped groundwater withdrawal rights at year’s end. The cumulative pool created by program participants may be used to offset regional contributions to the ASR in support of the HCP. Program participants are paid $50/ac-ft for the portion used for pooling purposes.
A change to the ASR program occurred in early 2018, after consideration of lease marketability and simulation results using the updated version of the MODFLOW groundwater flow model. The lease options were simplified and reduced from three to two leasing tiers, which are now coordinated with new, long-term forbearance agreements. All agreements are now sliding acre-foot scales, and the forbearance agreements are exercised in the year after the 10-year moving annual average of the Edwards recharge falls to 500,000 ac-ft/yr or below. This recharge value is a decrease of 72,000 ac-ft/yr from the original HCP (EARIP, 2012). Scenarios are also being explored involving the use of water elevations in index well J-17 as a trigger rather than 10-year rolling average recharge estimates. Given the uncertainty in recharge rates, this seems to be a prudent approach.
In NASEM (2017), potential water quality concerns were raised regarding the SAWS ASR. Although the EAA considers this to be a SAWS issue, given the importance of the ASR facility to the HCP, the Committee reiterates a few important issues. While available data suggest that water quality concerns related to metals mobilization are not currently present, conditions or activities could occur that may lead to mobilization of metals as an ASR facility expands its storage volume, which is planned for the SAWS H2Oaks ASR facility (formerly Twin Oaks ASR). Operational activities may yield changes in aquifer oxidation-reduction conditions such that constituents can be mobilized where none occurred or were detected before. One example is exposure of native (unaffected) aquifer rocks/sediments to stored water as the storage zone expands. Moreover, detection of mobilized metals can be missed because the release of arsenic, molybdenum, and related constituents can be a function of sample frequency and timing relative to operational cycle stages for each well (i.e., recharge, storage, or recovery) and location of sampling wells relative to the expanding mixing zone (Arthur et al., 2005, 2007).
Critical Period Management Stage V
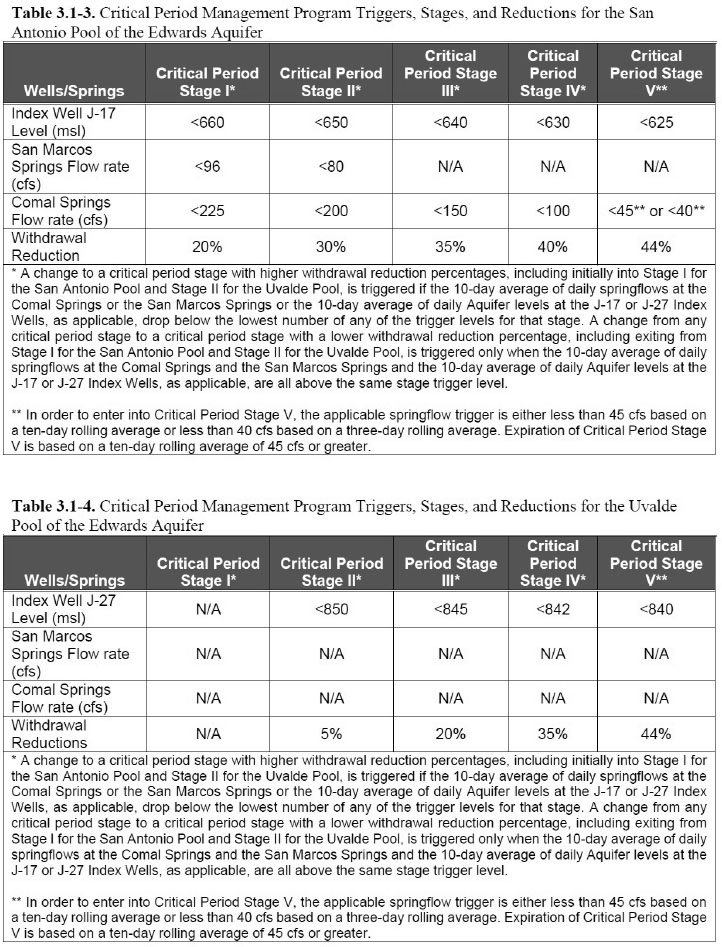
The five-stage Critical Period Management Program is in place to ensure that aquifer levels and spring flows are sustained above specific thresholds during Drought-of-Record conditions. These conditions are specific to the two main pools in the aquifer, the San Antonio and Uvalde pools. In the San Antonio pool, critical parameters are water levels in index well J-17 and flow rates at San Marcos Springs and Comal Springs (Figure 4-2). Water levels in index well J-27 are taken to represent Uvalde Pool conditions. Withdrawal reductions from the Edwards Aquifer are implemented through layered management scenarios involving groundwater conservation measures and use of alternative water supplies (EARIP, 2012). The hydrologic conditions that trigger each management layer can be evaluated using MODFLOW simulations that would theoretically sustain spring flows across Drought-of-Record conditions.
Critical Period Management Stage V is the most restrictive in terms of withdrawals, requiring maximum withdrawal reductions up to 44 percent. For perspective, “it is anticipated that during Stage V, all outdoor use of groundwater withdrawn from the aquifer will be prohibited, except for limited circumstances, such as foundation watering, watering from a handheld hose, and emergency uses such as firefighting” (EARIP, 2012). At the other end of the spectrum, Stage I triggers no reduction in withdrawals from the Uvalde Pool and a 20 percent reduction in withdrawals from the San Antonio Pool. The specifics of triggering conditions are based on statistics and duration of the conditions, as are mechanisms for downgrading critical period stages. For example, in the San Antonio pool, “in order to enter into Critical Period Stage V, the applicable spring flow trigger is either less than 45 cfs based on a ten-day rolling average, or less than 40 cfs, based on a three-day rolling average. Expiration of Critical Period Stage V is based on a ten-day rolling average of 45 cfs or greater” (Blanton and Associates, 2017).
As noted previously, Stage V was triggered for the Uvalde Pool from March 2013 through 2014 and into early 2015. In the San Antonio Pool, Stage II, III, or IV restrictions were in place from 2013 to 2015, including 142 days in Stage IV during 2014 (Blanton and Associates, 2015). In 2016, no stage of the Critical Period Management Program was triggered owing to increased aquifer levels and spring flows during the period (Blanton and Associates, 2017). Decreased aquifer levels and spring flows during 2017 resulted in two separate triggers of Stage I in the San Antonio Pool for a total of 61 days, resulting in a reduction of 3.4 percent to all permits (Blanton and Associates, 2018). Stage II was triggered in June 2018 in the San Antonio Pool.
Refinement of the MODFLOW Model
Hydrologic modeling serves two principal objectives in the HCP: (1) to simulate spring flows during a repeat of the Drought of Record to determine if implementation of the Bottom-Up package of the four flow protection measures will be effective and (2) to serve as a predictive tool for other water resource management and conservation scenarios. The Committee’s first two reports made several observations that present model challenges and many recommendations pertaining to evaluating and reducing model uncertainty.
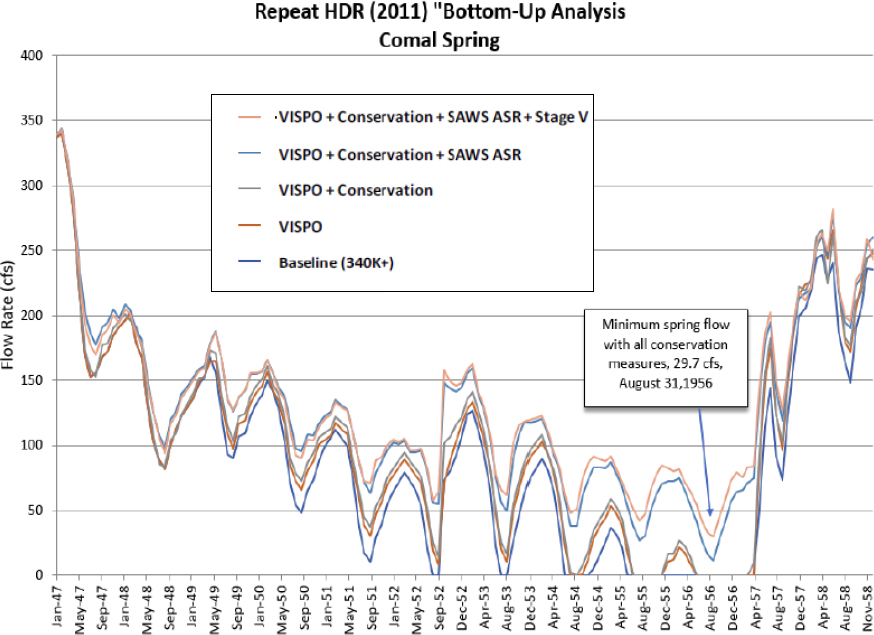
Some of the Committee’s recommendations about the hydrologic modeling have been addressed by the EAA team. For example, improvements have been made in the hydrologic conceptual model. The EAA has conducted a sensitivity analysis of recharge estimates and boundary flow along the contributing zone (the latter being the focus of the Interformational Flow Program). Furthermore, PEST (Model-Independent Parameter Estimation software) runs of numerous models reflecting different recharge scenarios are complete, and the Bottom-Up package has been optimized using the updated and recalibrated MODFLOW model. The results of updated Bottom-Up analysis were presented by Jim Winterle in January 2018 and indicate that the minimum flow at Comal Springs for the August 1956 Drought of Record is 10 percent greater than the original MODFLOW Bottom-Up results (using all four flow protection measures; Figure 4-3). Similar results were observed for the updated San Marcos Springs Bottom-Up analysis.
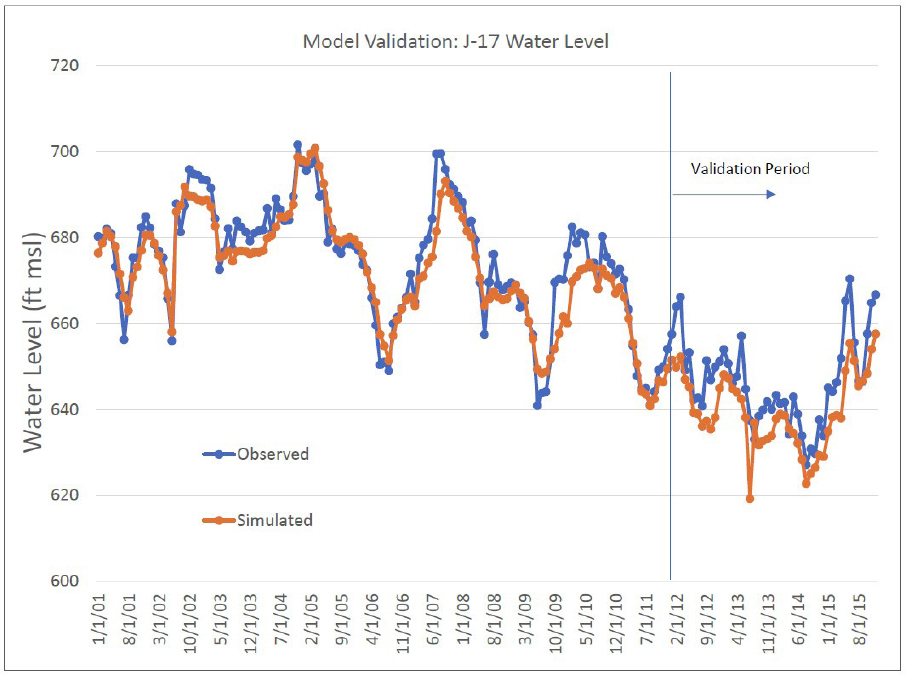
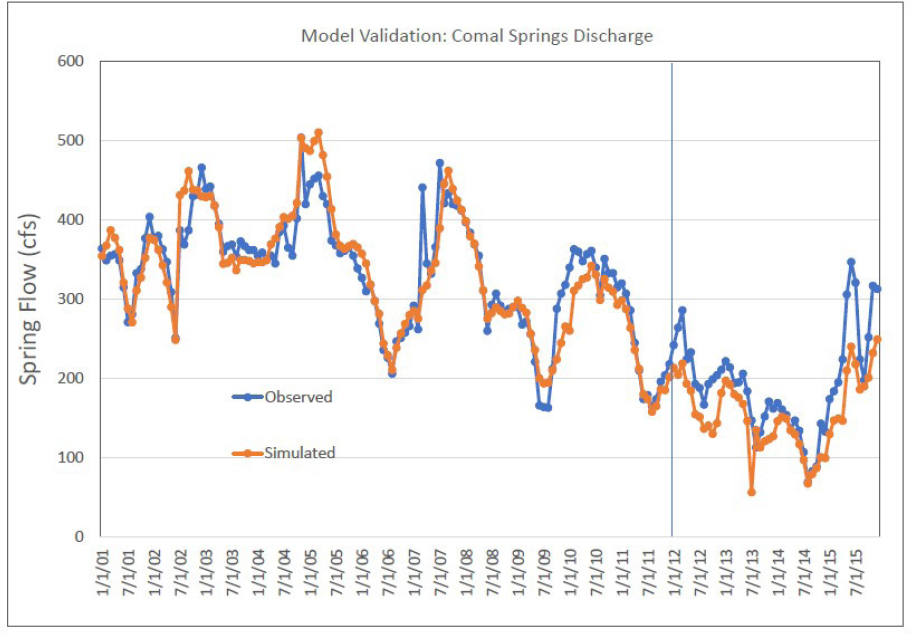
In NASEM (2017), there was the suggestion to validate the model by testing it against periods of data that were not used in the calibration, specifically during the more recent drought of 2011 to 2014, as well as the wet year of 2015. As noted above, this period includes periods of Critical Period Management restrictions, including Stage V in the Uvalde Pool and the triggering of VISPO in 2014 for the 2015 year. This validation has been conducted, and the model shows general agreement with the well levels and the spring flow observations, but with periods of substantial deviation. For example, during the validation period, several peak water levels in J-17 occur more than 10 feet below observed values, with few paired data points tightly matching as well as during the pre-2011 period (Figure 4-4). The low flows are also underestimated by the model but match within 5 feet except for one point in 2013, which is approximately 15 ft below observed. There exists better agreement in the J-27 simulation for the validation period; however, a strong divergence begins after May 2015, with differences between simulated and observed water levels on the rising limb of the hydrograph exceeding 20 feet. Likewise, spring flow measurements at Comal Springs during the validation period match less well than the calibration
period and are 50 cfs or more below observed rates at both peak and low flows (Figure 4-5). San Marcos simulated and observed flow rates exhibit less error in the low flows, with exception of simulated peaks greater than 50 cfs in the latter part of the validation period and a low-flow simulation approximately 25 cfs below observed. Uncertainty in model validation against observed water-level elevations and spring flows is expected given the scale, hydrologic dynamics, and hydrogeologic complexities within the model domain. In general, errors were greater at peak flows than low flows during the validation period, and the calibration period shows greater differences at peak flows, with generally better agreement at low flows.
The greatest model underpredictions tend to occur during periods of rapid recovery, with the simulations showing slower recovery in water-well levels. Underprediction of the indicator well levels and prediction of a slower recovery during wet periods means that the model is conservative—in the sense of protecting the listed species and the spring ecosystems—because it overpredicts the impacts of dry conditions on water levels in the wells. This is not necessarily true in all conditions, but it is reassuring that the model either matched or conservatively predicted indicator-well levels during a period characterized by drought conditions, when water restrictions were in place, and during a period of validation and not calibration.
NASEM (2017) also recommended addressing model versioning and peer review of each new version. Liu et al. (2017) provide an excellent example of implementation of this recommendation, including insightful external peer-review comments maintained verbatim in the report appendix. Completion of additional uncertainty analysis using PEST++ inverse parameter estimation software is anticipated during the next year, including evaluation of uncertainty in hydraulic parameters and recharge quantity distribution, as well as simultaneous inverse parameter estimation of the 2001–2015 period and the 1947–1958 Drought of Record (Winterle, 2018).
The continuing modeling efforts of the EAA, including validation and uncertainty analysis, are on the right track. Many advances have been accomplished to reduce model error to below the proposed criterion for spring flow calibration statistics (Table 4-2). Note that the model errors, as shown in Table 4-2, are large compared to the HCP minimum monthly flow requirements. For comparison, the HCP minimum flow for Comal Springs is 45 cfs (minimum monthly average) and for San Marcos Springs is 52 cfs (minimum monthly average). In particular, the updated model root mean square (RMS) error is more than half of the minimum average monthly flow rate for the springs. The RMS error tends to emphasize larger deviations which, as indicated above, may be dominated by higher flow periods during recovery from dry weather and not by the drought periods themselves. Maximum absolute error reflects the greatest observed error between the model simulation and observed values. These errors (Table 4-2) are more than double the minimum flows. It is noteworthy that the errors represent the entire model period, including the calibration and validation periods for the updated model. Given the need to estimate minimum flows, it may also be useful to focus on errors during periods of low flow, for example, the magnitude and direction of the RMS and maximum deviations at the minimum flow.
TABLE 4-2 Spring Target Calibration Summary
| Error Statistic | Proposed Criterion, cfs | Original 2004 Model, cfs | Updated Model, cfs |
|---|---|---|---|
| Comal Springs RMS error | ≤50 | 37.9 | 26.2 |
| Comal Springs maximum absolute error | ≤150 | 139 | 79.7 |
| San Marcos Springs RMS error | ≤35 | 62 | 28.0 |
| San Marcos Springs maximum absolute error | ≤150 | 134 | 114.3 |
SOURCE: Data from Winterle (2018).
Will the Flow Protection Measures Meet the Flow Objectives?
Although model refinements continue to reduce uncertainty, it is difficult to assess the degree to which the model can achieve the original goal of validating the Bottom-Up package because the model error is proportionally high compared to the required minimum flows, and not all of the Bottom-Up package has been implemented and validated by model simulation runs. However, two droughts have been modeled using flow protection measures. The model of the Drought of Record showed flows above triggers when flow protection measures were applied (Figure 4-3). In addition, model validation during periods of Stage V restrictions in the Uvalde Pool and Stage IV restrictions in the San Antonio Pool as well as during periods of VISPO triggering in 2014 suggest that the model has been successful in conservatively estimating both indicator-well levels and minimum spring flows. Furthermore, the model predictions tended to be conservative at low flows during the validation period. Finally, throughout the 2014 drought during which Critical Period Management measures reached Stage IV in the San Antonio pool and Stage V in the Uvalde Pool, spring flows remained above threshold levels. Some uncertainty will remain regarding the effectiveness of the flow protection measures until each stage has been triggered (e.g., ASR for both springs and Stage V for the San Antonio pool). Taking all of this information into account, the Committee concludes that the flow protection measures will be effective in meeting the flow component of the biological objectives for all listed species.
Certain activities and outcomes could further improve confidence in the flow protection measures and lead to a higher rating. Model validation should continue into the future as new periods of drought arise, which can test the Bottom-Up package and other scenarios (see Chapter 5). In addition, an uncertainty analysis is presently under way, but the results will not be available until 2019. If the uncertainty analysis shows that a parameter such as intraformational flow or recharge is overestimated, then low-flow periods predicted by the model are not as conservative. In this case, the flow protection measures should be updated and perhaps new triggers should be considered in Phase 2 of the HCP. Moreover, there might be a more precipitous decline in spring flow than predicted by the model in the case of unevenly distributed recharge leading to asymmetrical drought. The flow protection measures need to be robust enough to address these alternative scenarios. The rating for flow protection measures could move toward highly effective if results of the uncertainty analysis show that errors are low or if model improvements continue to demonstrate that the model is biased low (i.e., conservatively underestimates well levels and spring flows).
WATER QUALITY PROTECTION MEASURES
This section considers the M&M measures designed to protect water quality in the Comal and San Marcos river systems (Table 4-3). These include stormwater control measures, golf course management, and the management and removal of litter and floating vegetation. These measures are appropriately directed toward watershed activities and not direct action in the river systems, with the exception of removing litter and floating vegetation. An Applied Research project indicated that direct control of dissolved oxygen in Landa Lake was likely not effective, as was addressed in the Committee’s previous report (NASEM, 2017). This discussion focuses primarily on watershed management through stormwater control plans. (Note that other activities in the river such as bank stabilization and recreation management are discussed in subsequent sections.)
The water quality protection measures are meant to achieve the biological objective of maintaining water quality within 10 percent of historical conditions. However, for the Comal Springs riffle beetle, this objective ap-
TABLE 4-3 Water Quality Protection Measures in the Habitat Conservation Plan
| M&M Measure (HCP Section) | Spring System | Target Contaminants | Purpose |
|---|---|---|---|
| Low-impact development/BMPs (5.7.3) | San Marcos | Sediment, flow | Prevent contamination from entering rivers via stormwater runoff |
| BMPs for stormwater control (5.7.6) | Comal | Sediment, flow | Prevent contamination from entering rivers via stormwater runoff |
| Management of floating vegetation mats and litter removal (5.3.3 and 5.4.3) | Comal San Marcos | Low DO | Remove algae and vegetation from spring openings in Spring Lake; to avoid entanglement with TWR; litter removal |
| Decaying vegetation removal program (5.2.4) | Comal | Low DO | Prevent decaying vegetation from lowering DO in Landa Lake |
| Golf course management (5.2.11, 5.4.9) | Comal San Marcos | Pesticides, nutrients | Prevent chemicals applied to the golf courses from entering rivers |
NOTE: BMP = best management practices; DO = dissolved oxygen; TWR = Texas wild rice.
plies to spring water quality, which is not a target of the M&M measures being evaluated here. Hence, this section pertains most directly to the water quality component of the biological objective for the fountain darter. Chapter 3 has already discussed the peculiarities of this objective, such as the fact that the criterion of 10 percent deviation is not clearly defined and makes little sense for some parameters, such as pH. The discussion below will instead focus on the effectiveness of measures to maintain or improve water quality and recognizes that appropriately measuring success is an important and ongoing challenge.
Stormwater Control Measures
The City of San Marcos lies in one of the most rapidly developing counties in the country, with a reported 61 percent population increase from 2000 to 2010 (John Gleason LLC, 2017). The City of New Braunfels, through which the Comal Spring River flows, is considered fully developed, but increased development is expected in outlying areas, such as the Blieders Creek headwaters northwest of the city. With this population growth and development come impervious surfaces, such as roads, parking lots, and structures. Impervious surfaces reduce infiltration of stormwater, resulting in increased overland flow to streams, carrying with it any pollutants on roadways and other surfaces. One of the most important pollutants in stormwater is sediment, which can accumulate in portions of the Comal and San Marcos rivers and degrade habitat. NASEM (2017) indicated that removal of sediment from the river is likely to be ineffective without control of the source of these sediments. The rapid flow of stormwater to streams increases stream discharge, further disrupting habitats. This combination of stressors (increased flow and pollutant loading) from urban development is known as “urban stream syndrome” (Walsh et al., 2005). Entities in both the Comal and San Marcos watersheds have developed plans to try to reduce the impact of new and existing development.
A number of different terms are used to describe efforts to minimize the detrimental effects of stormwater. Low-impact development refers to plans that govern how construction projects operate to reduce impacts on both stormwater and resource use. Green infrastructure encompasses a wide variety of techniques for capturing stormwater and trying to mimic the natural water cycle, rather than just using stormwater piping systems. Stormwater control measures (SCMs), also referred to as best management practices (BMPs), are used to capture stormwater and enhance infiltration. By enhancing infiltration, SCMs can minimize pollutant loads (e.g., nutrients and sediments) entering the stream through stormwater runoff and reduce high flows, which can damage aquatic habitats. SCM is the term
adopted in this report to be consistent with previous National Academies guidance (NRC, 2009).
Various techniques are used to reduce stormwater flows to streams, and thus reduce stream discharge (Davis, 2005; Geosyntec Consultants and Wright Water Engineers, Inc., 2009; NRC, 2009). SCMs typically involve capturing stormwater, storing it during storm events, and infiltrating it to provide a slower, filtered pathway to stream discharge points. SCMs that can cut peak storm flows, reduce volumes, and capture sediment and other contaminants are also important because they have the potential to decrease habitat disruption caused by erosion (Walsh et al., 2005; Hood et al., 2007). Water can be captured by using topography to direct flow to basins or by piping water from streets or roofs to underground chambers. When plants are used to maintain infiltration pathways and enhance evapotranspiration, it is referred to as a bioinfiltration basin. Implementation of basins typically requires a larger area, where underground chambers can be constructed in a large or small size to fit in between existing structures or along streets. Another type of SCM is bank stabilization, which can be used to reduce erosion in areas of high flow by use of rock walls, and other structures along a bank; this bank erosion contributes to sediment loads and habitat loss in streams. Bank stabilization projects are categorized as recreational M&M measures in the HCP and discussed in a subsequent section of this chapter.
Although SCMs have been used for decades to manage stormwater, it is difficult to assess their effectiveness because monitoring has been limited and is challenging (Strecker et al., 2001; NRC, 2009), although efforts to compile data on SCM effectiveness are under way (Leisenring et al., 2014). For example, SCMs are assumed to reduce pollutant loads, particularly from roadways, but unless the input loading is measured, the efficacy of the pollutant reduction is unknown; thus, typical load reductions may not apply for site-specific source terms. The tracking of pollutant loads is also difficult due to multiple sources and pathways (Fletcher et al., 2013; Filoso et al., 2015). The impact of SCMs on stream health is difficult to assess because of fragmented implementation and uncertainties in performance (Roy et al., 2008). By some estimates, measurable impact occurs only when the density of projects approaches the density of development, which is extraordinarily costly (Lui et al., 2015; Vogel et al., 2015; Bell et al., 2016). Efforts continue to develop appropriate assessment techniques for SCMs, including the development of treatment trains and principles for matching capacity to flow regimes (Loperfido et al., 2014; Walsh et al., 2016).
Failure of basins, often due to clogging, diversion of stormwater (lack of capture), or incorrect leveling of outfall structures, is not uncommon
(e.g., Livingston, 2000; Emerson et al., 2005; Brown and Borst, 2014) particularly in the initial period after construction. Retrofitting basins to fix these issues is now a part of SCM treatments.
Initial planning for stormwater control in the HCP (EARIP, 2012, App. L) focused on reducing pollutant loads. The HCP made several recommendations, although specific targets were not spelled out. The plan recommended limiting impervious cover; reducing stormwater runoff into the Old Channel, Landa Lake, Spring Lake, and the recharge and contributing zones; and banning the use of coal tar sealants to reduce polycyclic aromatic hydrocarbons in runoff from roadways and parking lots. In the Comal Springs system, street-sweeping programs have been implemented to reduce loading from street runoff. The HCP also directed development of a water quality monitoring program. However, the monitoring program was not tied to evaluating stormwater control measures or directing management of stormwater control; rather, the water quality monitoring plan more broadly evaluated stream health along target reaches.
While the initial plans included incentive programs to encourage private development of SCMs, the more recent plans (described below) emphasize development of SCMs on public property (or Texas State University property). This shift in focus recognizes the need for access to larger areas for stormwater control, the costs associated with construction, and the need for maintenance after construction, which are all more readily available through public entities (or large landowners). The stormwater management plans abide by the Texas Commission on Environmental Quality volume requirement to store the first ½ inch of rain for 24 hours. The plans now include recently enacted ordinances requiring stormwater management plans for sites that involve 5,000 ft2 of development, including guidelines for construction practices. Both the Comal and San Marcos communities also include public outreach and education in their plans, pollution prevention in vulnerable areas such as parking lots and critical habitats, and maintenance activities for the SCMs.
The City of New Braunfels Water Quality Protection Plan (WQPP; Alan Plummer Associates, 2017) and the WQPP for San Marcos and Texas State University (John Gleason LLC, 2017) proposed several measures to reduce impacts of stormwater on the aquatic habitats of the Comal and San Marcos Springs river systems. The SCMs proposed in the WQPPs for both cities, and the attempts to prioritize projects, are typical of stormwater remediation methods for urban systems. Given that most urban streams cannot be returned to pristine conditions, the goals of stormwater management in these two systems are stabilizing the stream system, reducing flows and pollutant loads, and improving development practices.
TABLE 4-4 Cost Comparisons for Sediment Removal and Stormwater Control Projects in Sessom Creek
| Metric | Project 1. Existing Sediment Removal Project | Project 2. Stream Restoration of Reach 2 (including RPS 9 and 10) | Project 3A. Stream Restoration of Windmill Tributary | Project 3B. Stormwater BMP for Windmill Tributary w/limited restoration |
|---|---|---|---|---|
| Pounds of TSS Removed per year | 159,780 | 190,383 | 800 | 46,336 |
| Total Capital Cost (1) | $744,292 | $1,250,000 | $141,250 | $197,015 |
| Annualized Cost ($/yr) | $186,073 | $74,183 | $9,270 | $16,534 |
| Cost per pound TSS removed (2) | $1.16 | $0.39 | $11.59 | $0.36 |
(1) Total Capital Costs for Projects 2 and 3 includes preliminary engineering, design, and construction phases
(2) Calculated as Whole Life Cycle Cost divided by Pounds of TSS Removed per year
NOTE: TSS = total suspended solids, BMP = best management practices.
SOURCE: John Gleason LLC (2017).
San Marcos System
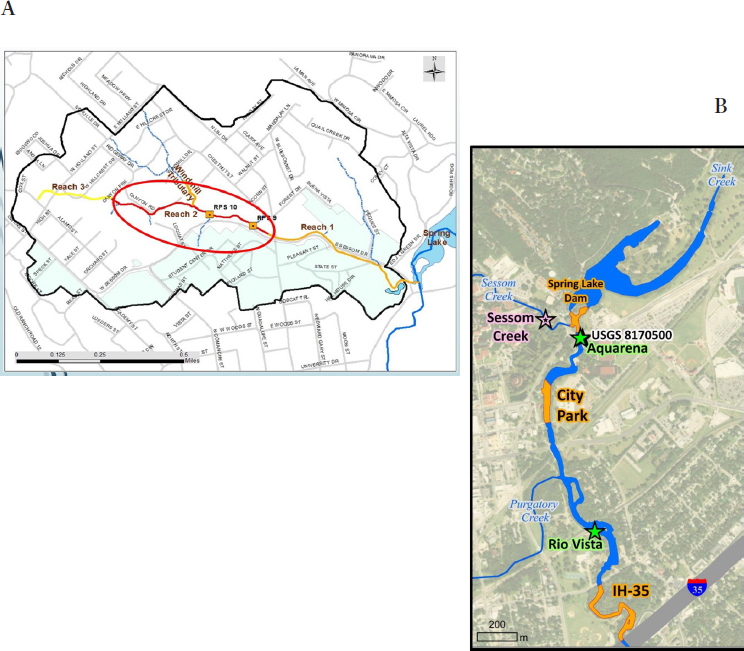
The SCM plans in the San Marcos system are focused on Sessom Creek. This tributary is a major contributor of sediment to the San Marcos River because of the large impervious surface area in the subwatershed, high flows, and erodible soils (John Gleason LLC, 2017). Attempts to mitigate the sediment input to the main channel by removing sediment have not been cost-effective due to recurring inputs (NASEM, 2017). The types of SCMs proposed have been evaluated in terms of cost, funding potential, sediment removal potential, and land opportunities (John Gleason LLC, 2017). Typical projects proposed are bank stabilization, stream reconnection, wet ponds, wetland retrofitting, and detention basins. Using multiple SCMs in a focused area is a good strategy for increasing the impact of stormwater control, and Sessom Creek represents a reasonable target. Approximately 50 projects have been proposed, but initially three projects in the middle reach have received permitting (Table 4-4, Figure 4-6a) and are paid for in part by HCP funding that was redirected from sediment removal operations. It is not clear how many SCMs will ultimately be installed or the pace of projects per annum. In addition, monitoring where Sessom Creek enters the main stem (Figure 4-6b) will be initiated, including stream gauging for the first time, water quality monitoring, and stormwater sampling. The water quality monitoring includes turbidity sensors.
SCMs were also proposed close to East Hopkins Street, with sediment removal ponds scheduled to be constructed early in 2018, and rain gardens and a bioinfiltration basin were recently completed near C. M. Allen Park-
way. The initial SCMs were close to the street and stream, but modifications of the initial plans were approved. Sediment storage ponds are now located on public property, but farther from the stream than the initial proposed locations in the HCP. A comparison of the capture areas for the new locations relative to the initial design was not provided.
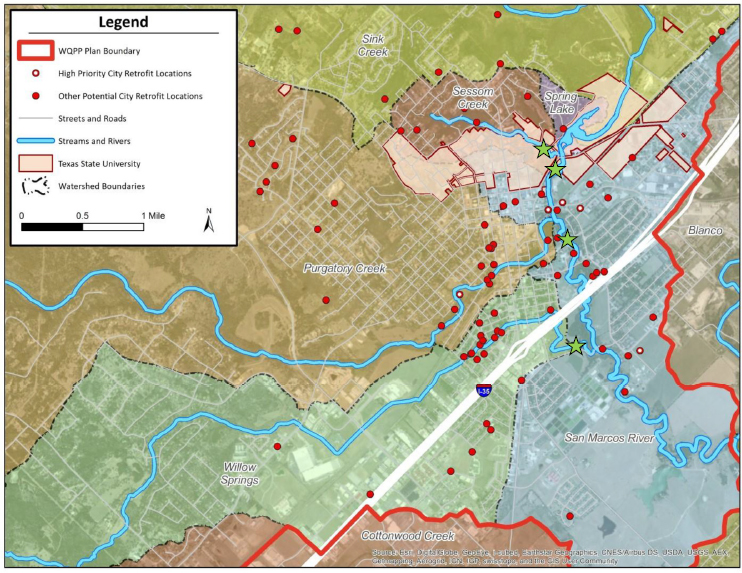
A number of additional SCMs are mentioned in the San Marcos WQPP, including rain gardens, wet ponds, bioinfiltration basins, constructed wetlands, stormwater reuse, natural area conservation (purchasing land for protection from development), and turf management (Figure 4-7). Design proposals have been evaluated for their capture areas, nutrient reduction, and sediment reduction potentials. However, there was no timetable proposed for these additional measures, and the implementation is dependent on available funding. Any prioritization of sites and monitoring has yet to occur.
Comal System
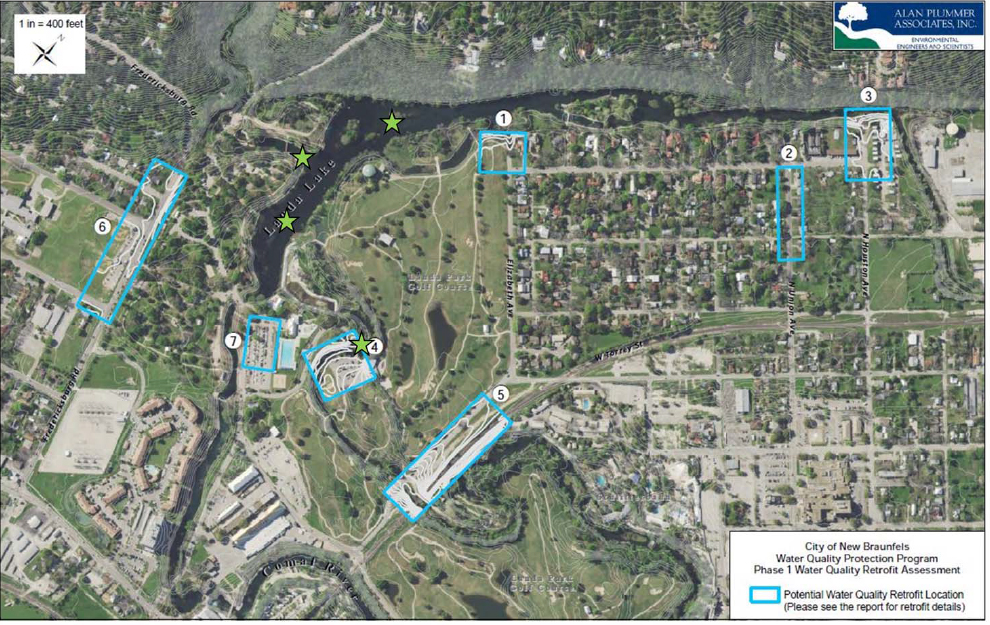
In the Comal Springs system, both bank restoration and other proposed SCMs have been located near the Old Channel and Landa Lake (Alan Plummer Associates, 2017; Figure 4-8) and approximately $1.1 million in projects have been proposed (Table 4-5). These projects include bioinfiltration strips, rain gardens, rain harvesting in tanks, and underground vaults (one is expected to be completed in the Landa Lake parking lot during reconstruction). Again, design proposals have been evaluated for their capture areas, nutrient reduction, and sediment reduction potentials. Potential sources of funding for these projects are a drainage utility tax and application for funding to the San Antonio River Authority; other grant sources are being investigated. Timetables for implementation are not available. In addition, new development is expected along Blieders Creek (the Veramendi Project) which provides an opportunity to include low-impact development measures rather than merely retrofitting existing urban areas. The WQPP
for New Braunfels also proposes limiting development in buffer zones near the streams.
A number of bank stabilization projects have been implemented on Landa Lake by the City of New Braunfels and the Edwards Aquifer Authority, which are discussed in more detail in the section on Riparian Res-
TABLE 4-5 Costs of Proposed Stormwater Control Projects near Landa Lake and the Old Channel
| Site 1 | Site 2 | Site 3 | Site 4 | Site 5 | Site 6 | Site 7 | |
|---|---|---|---|---|---|---|---|
| Location | Elizabeth Ave at Landa Lake | North Union Street from Dallas to Edgewater | North Houston Ave at Landa Lake | Golf Course Club House | Overflow Parking along Elizabeth Ave | Fredericksburg Road Stormdrain Outfall into Landa Park | Landa Park Aquatic Complex Parking Lot |
| Recommended Measure | Rain Garden | Linear Roadside Rain Garden | Rain Garden | Grass/gravel pavers, function as filter strip | Grass/gravel pavers | Storm Drain Underground Vault | Permeable Pavers |
| Approx. Drainage Area (acres) | 5 | 4 | 4.3 | 0.26 | 1.2 | 5.4 | 1.5 |
| Approx. Impervious Cover (acres) | 1.9 | 1.2 | 1.3 | 0.24 | 0 | 5 | 1.4 |
| TSS lbs per year managed | 875 | 720 | 700 | 170 | 15 | 2200 | 170 |
| Total Measure Cost | $71,156 | $138,000 | $99,619 | $34,500 | $138,000 | $86,250 | $345,000 |
NOTE: TSS = total suspended solids.
SOURCE: Alan Plummer Associates (2017) and Pence (2018).
toration. These include rock walls along Landa Lake and vegetative mats, resloping, and fencing along the Old Channel.
Management of Golf Course Diversions and Operations
These M&M measures are included in the HCP to manage withdrawal of surface water from the Comal River and to improve water quality in the Comal and San Marcos rivers by minimizing runoff of fertilizers and chemicals used on golf courses near the rivers. The City of New Braunfels and Texas State University both committed to developing plans to address fertilizer and chemical use via Integrated Pest Management Plans. Additionally, the City of New Braunfels is allowed to divert water from the Comal River for irrigation, but historically the city has not used its fully permitted amount. The City committed to work with New Braunfels Utilities to develop a water reuse system, and water from this project will be used to supplement or replace water withdrawn from the Comal River.
In 2013, Golf Course Management Plans as well as Integrated Pest Management Plans were developed and implemented for the golf courses in New Braunfels and on the Texas State University Campus (SWCA Environmental Consultants, 2014). The City of New Braunfels maintains a vegetative buffer between the golf course and Landa Lake and the Old Channel of the Comal River to increase protection of water quality. In October 2015 the golf course at Texas State flooded, and several months later university officials decided to close the course. According to an article in the school newspaper (The University Star), recreational fields will be developed on the old golf course grounds in the next three to five years. Management of the fields will follow a Grounds Management Plan as well as the previously developed Integrated Pest Management Plan (Blanton and Associates, 2017).
Litter Collection and Floating Vegetation Management
Reduction of litter and dispersal/removal of floating mats of vegetation is a measure conducted in the Comal and San Marcos systems. Its purpose is to remove/dislodge floating mats of vegetation that accumulate in part from recreational disturbance to vegetation. Litter that has been trapped in the vegetation mats is removed by hand (via SCUBA) prior to dislodging and removal of vegetation mats. Litter is also removed from the bottom of the rivers. Floating mats shade SAV, impede flowering of Texas wild rice, and degrade fountain darter habitat. Focal areas for vegetation mat management include Comal Springs, Landa Lake, the Old and New Channels of the Comal River, and the stretch of the San Marcos River from Sewell Park to interstate highway I-35.
Floating vegetation management and hand removal of litter from both systems is an ongoing process and has been conducted during the entire life of the HCP. This M&M measure is coordinated by the cities of New Braunfels and San Marcos, as well as Texas State University, with each entity responsible for predefined areas. Litter removal peaks in the summer months when recreational use of the rivers is greatest; hundreds of pounds of litter are removed each year (Blanton and Associates, 2016). In 2013, when the City of San Marcos implemented a No Alcohol and No Styrofoam ordinance, there was a reduction in new litter removed by the SCUBA crews (SWCA Environmental Consultants, 2014).
Will the Water Quality Protection Measures Meet the Water Quality Objective for Fountain Darters?
The Committee’s assessment is that the water quality protection M&M measures, focusing primarily on stormwater control, will be somewhat effective in meeting the water quality component of the biological objective for fountain darters in the Comal and San Marcos stream systems. This assessment is based on whether the M&M measures, many of which have yet to be implemented, are likely to keep water quality from further degrading or to improve water quality, for whatever parameter they target. Sediment reduction is the target for bank stabilization and other SCMs that control runoff. Nutrient reduction is the target of SCMs that control runoff and golf course management. Organic contaminants are the target of coal tar restrictions, street sweeping, and golf course management. Each of these water quality parameters has the potential to impact fountain darter habitat. The rating is based on the prevailing evidence of the benefits of SCMs in other areas as well as on the plans provided for the Comal and San Marcos systems, rather than existing data for these systems. The Committee believes that the plans for water quality protection, which have been recently updated, are moving in the right direction. The section below discusses the reasons for the rating of somewhat effective and makes suggestions for how a higher rating could be achieved.
Two main considerations have led to the rating of somewhat effective. The first is an issue in any urban system: the effectiveness of SCMs for overall stream health is very difficult to assess, and long-term monitoring is needed (STAC, 2010; Hamel et al., 2013). Nonetheless, capturing stormwater is an important strategy to help reduce pollutant loading to the system. The second issue is the high degree of uncertainty in implementation rates, which makes it difficult to assess how much improvement can be expected. The plans list far more projects than the handful that are currently underway, and the EAA has limited opportunity to manage stormwater in the upper portions of the watershed outside their direct control.
Several activities would improve the likelihood of impactful SCMs. First and foremost, there should be formalized project tracking to help with prioritization and assessment of progress. Second, it is critical to track project functioning, including visual inspections. Informal inspection programs have been occurring in some areas, but formal inspection to ensure that all SCMs are functioning and receiving necessary maintenance would help improve success rates. Third, mapping of stormwater capture areas is important and would benefit from ground-based LiDAR surveys for detailed topographic analysis. Many SCMs fail because the capture area is not accurately estimated, and the structure overflows due to underdesign or underperforms due to overdesign. Fourth, performance monitoring of SCMs is needed, but the current water quality monitoring program may not be sufficient to assess effectiveness. For example, the monitoring point in City Park is not at the end of the restoration work along that reach (Figure 4-7). While moving long-term monitoring sites is not recommended, adding new sample sites or additional data loggers could help assess the performance of SCMs, such as the monitoring point being added where Sessom Creek enters the main channel (Figure 4-6). Furthermore, SCMs can be assessed using water-level loggers placed to look for evidence of stormwater capture, bypassing, or overflows (Toran, 2016). Finally, it is important to recognize that benefits of SCMs can be difficult to measure, particularly for water quality parameters. Stabilization of parameters and a reduction in peak flows are also important for improving habitats (e.g., by reducing sediment loading). Population growth in the watershed guarantees that stormwater management will continue to be necessary to maintain water quality in the stream systems.
SUBMERGED AQUATIC VEGETATION RESTORATION
Restoration and maintenance of SAV is a key component of reaching the biological goals for fountain darters because these fish are strongly dependent on a vegetated habitat. Alongside this specific goal, SAV is widely recognized as an ecologically valuable component of streams and lakes because it supports invertebrates that may be near the base of the food web, and oxygen produced by the plants can help maintain adequate levels of dissolved oxygen. The HCP lays out four M&M measures related to aquatic plants. The first is specific for Texas wild rice (Zizania texana), one of the listed species and also recognized as habitat for fountain darters. The other three M&M measures all deal with some aspect of plant management, including removal of exotic/invasive species and either active planting or maintenance (gardening) of desired native plants that have been documented as fountain darter habitat. These three measures are considered together since the actual management activities are quite similar, although
there are reach-specific goals for coverage and differences in the ultimate desired SAV communities in the Comal and San Marcos systems.
SAV species known to support fountain darters at abundances on the order of 5 individuals/m2 or greater are targeted for planting, and explicit areal coverages for each SAV type and reach are based on historical records of plant abundance. These actions are guided by a fundamental assumption that more habitat for the fountain darter will ultimately lead to an overall increase in its population and will probably confer more resilience to negative events, such as low flows or floods. Along with planting native SAV is the active removal of nonnative SAV species (even if known to be fountain darter habitat). Note that removing nonnative SAV without sufficient replacement and restoration of native SAV can result in a net loss of fountain darter habitat, although there is a projected plan to regain lost area with native SAV. In this instance, nonnative SAV removal is largely a management choice related to the preference for a native community of SAV. The exception to this is the potential benefit of nonnative SAV removal to restoration of Texas wild rice, which could be articulated with a new biological objective for Texas wild rice (as discussed in Chapter 3). Table 4-6 gives the HCP reference for each SAV restoration M&M measure, the relevant system, and target species.
Texas Wild Rice Enhancement and Restoration
Texas wild rice grows only in the upper reaches of the San Marcos River—an indication of how rare this species is. First collected in 1892, Texas wild rice was formally designated as a distinct species in 1933. At
TABLE 4-6 Submerged Aquatic Vegetation Restoration Measures in the Habitat Conservation Plan
| M&M Measure (HCP Section) | Spring System | Target Species |
|---|---|---|
| Texas wild rice enhancement and restoration (5.3.1, 5.4.1) | San Marcos | TWR, FD |
| SAV restoration (nonnative removal and native reestablishment) and maintenance (5.3.8, 5.4.3, 5.4.12) | Comal and San Marcos | TWR, FD |
| Landa Lake and Comal River aquatic vegetation restoration and maintenance (5.2.2) | Comal | FD |
| Old Channel Environmental Restoration and Protection Area (5.2.2.1) | Comal | FD |
NOTE: FD = fountain darter; TWR = Texas wild rice.
that time, Texas wild rice was abundant in the San Marcos River, including Spring Lake (Terrell et al., 1978). By the 1960s, however, there had been several attempts to remove Texas wild rice from the San Marcos River, going so far as to harrow the bottom with agricultural equipment to make the river more enticing for recreational activities. When Emery (1967) observed the length of the San Marcos River, he only found a single specimen in Spring Lake. Furthermore, he observed no Texas wild rice in the uppermost 0.8 km of the San Marcos River, with a few scattered plants in the lower 2.4 km, and none at all were left below this reach. A follow-up estimate by Beaty (1975) revealed a coverage of about 240 m2. In 1976, Emery measured Texas wild rice abundance using a floating frame and found a total cover of 1,131 m2 with most of it in the upper reaches (Emery, 1977). The Texas Parks and Wildlife Department monitored areal coverage of Texas wild rice from June 1989 to 1994, which reveals baseline conditions in the San Marcos River before restoration of about 1,005 m2 to 1,592 m2.
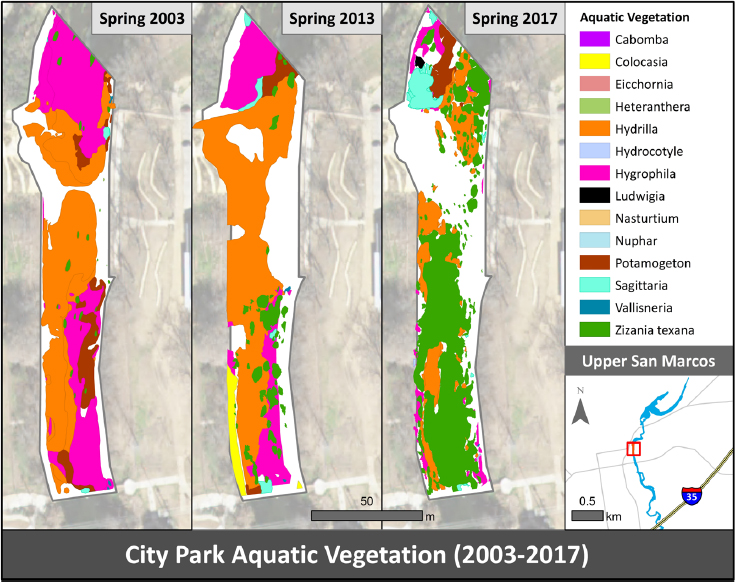
The long-term biological goals (LTBGs) for Texas wild rice (see Table 2-2) are an order of magnitude higher than the low abundances observed in the decades before the HCP. And yet, they have been nearly achieved in total, as shown in Table 4-7, although some reach-specific abundances have not yet reached their targets. Since the last total system sampling of SAV carried out in 2013, Texas wild rice has expanded by an estimated 7,963 m2 through planting and natural expansion. Over the last year alone, Texas wild rice expanded by an estimated 3,800 m2 in the San Marcos River, with every reach having gained coverage, even the reach below I-35. This recovery trend is not only good news for Texas wild rice, but it also aids in reaching the fountain darter biological goals. Expansion of Texas wild rice in the City Park region of the San Marcos River is shown in Figure 4-9.
TABLE 4-7 Progress in Reaching the Biological Goals for Texas Wild Rice in the San Marcos System
| Reach Segment | Area, m2 | Goal, m2 | % Attained |
|---|---|---|---|
| Spring Lake | 41 | 1,000 – 1,500 | 4.1 |
| Spring Lake Dam to Rio Vista | 8,769 | 5,810 – 9,245 | 100 |
| Rio Vista Dam to I-35 | 404 | 910 – 1,650 | 44.4 |
| Downstream of I-35 | 52 | 280 – 3,055 | 18.7 |
| Total | 9,266 | 8,000 – 15,450 | 100 |
SOURCE: Furl (2017).
Texas wild rice is monitored along the entire length of the San Marcos River annually.
The Committee hypothesizes that the combined measures of removing nonnatives and replanting native SAV have been particularly important to the success of Texas wild rice because the nonnatives (Hydrilla and Hygrophila) are all carbon-concentrating species capable of outcompeting Texas wild rice, especially if pH or temperature becomes elevated. It seems clear that nonnative plant removal is one important factor in the 2017 resurgence of Texas wild rice in the San Marcos system. The City of San Marcos’s efforts to remove nonnative SAV, plant Texas wild rice, and maintain the newly planted species via gardening appears to be highly successful thus far.
SAV Restoration and Maintenance
The focus of SAV restoration measures in both the Comal and San Marcos systems has been removal of nonnative species, reestablishment of native species, and conservation or maintenance of native species. These activities are carried out by the cities of New Braunfels and San Marcos and by Texas State University. The primary native SAV species used in reestablishment include Ludwigia, Sagittaria, Cabomba, Potamogeton, and Vallisneria. Bryophytes are mapped and sampled and support the highest density of fountain darters per area (BIO-WEST, 2016), but they are not subject to active planting. (Bryophytes are relatively small, short-stature, non-flowering plants. Despite their importance, management of these plants is limited to keeping some open space, free of other plants, for their occupation and spread. Active planting of bryophytes is not considered effective because they lack seeds and consequently are difficult to raise, handle, and establish.)
The purpose of these M&M measures has been to increase areal coverage by several species of SAV to serve as habitat for the fountain darter. Indeed, as discussed in Chapter 2, the biological goals for fountain darters in both systems involve maintaining a certain areal coverage of specific native SAV species (see Table 2-1). To make room in the river channels for more native SAV, there has also clearly been a focus on eradicating nonnative SAV species such as Hydrilla and Hygrophila, even though these nonnatives can support fountain darters. As discussed in NASEM (2017), there can be conflict between the objectives of planting native SAV and removing nonnative SAV when reestablishment of natives does not immediately replace the fountain darter habitat value lost with removal of the nonnative species. This concern was addressed by an adaptive management action taken by the EAA in late 2016 after publication of the SAV report (BIO-WEST and Watershed Systems Group, 2016). The action added new areas subject to native SAV establishment, the so-called restoration reaches, to the existing LTBG reaches where acreage goals were already in force. In addition, the action removed nonnative SAV from the tables of fountain darter biological goals. The revised tables of SAV areal coverage, SAV species, and fountain darter abundance in each type of vegetation reflect the realities of the actual area suitable for SAV growth along with the focus on removal of nonnatives.
Success of these measures has been incremental since implementation of the HCP began, and the reader is referred to the HCP annual reports to see the SAV individual plant numbers and acreage planted in specific years. In 2017, planning in the Comal system focused on the Old Channel area, including the LTBG reach and an adjacent restoration reach as well as Landa Lake. Only limited native SAV planting occurred in the Upper Spring Run
LTBG and restoration reaches. In ten areas in the Old Channel LTBG and restoration reaches, 1,433 m2 of native SAV was planted, for a cumulative, five-year total area planted in the Old Channel of 4,814 m2. This acreage corresponds to a total of 6,073 plants. Also in 2017, 502 m2 were planted in eight restoration plots in Landa Lake, bringing the five-year total acreage planted in the lake to 3,429 m2. In terms of nonnative SAV removal, approximately 886 m2 of Hygrophila was removed from the Comal River system in 2017.
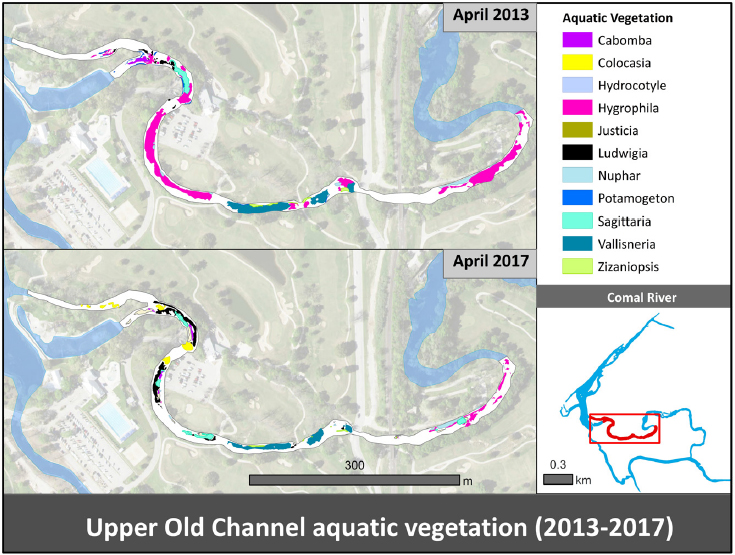
Figure 4-10 demonstrates that from 2013 to 2017 there has been a substantial shift in the SAV species found in the Old Channel, an area that has undergone extensive removal of nonnative SAV and replanting of native SAV. Table 4-8 shows the 2017 seasonal coverage of various native and nonnative SAV types in both the Old Channel LTBG reach and the Upper Spring Run LTBG reach. As indicated in the table, most native SAV types increased in coverage over the year, both from new plantings following removal of Hygrophila and from expansion of existing beds. The table indicates how far the restoration is from reaching the goals for each SAV type in
TABLE 4-8 Seasonal Coverage of Submerged Aquatic Vegetation (m2) in Two Reaches of the Comal System in 2017
| Species | October 2016 | January 2017 | April 2017 | October 2017 | Goal |
|---|---|---|---|---|---|
| Old Channel LTBG Reach | |||||
| Ludwigia | 35 | 14 | 10 | 106 | 425 |
| Sagittaria | 0 | 0 | 0 | 45 | 450 |
| Cabomba | 0 | 0 | 0 | 72 | 180 |
| Hygrophila | 503 | 818 | 962 | 589 | 0 |
| Bryophytes | 250 | 114 | 58 | 107 | 550 |
| Upper Spring Run LTBG Reach | |||||
| Ludwigia | 53 | 72 | 45 | 21 | 25 |
| Sagittaria | 936 | 761 | 982 | 961 | 850 |
| Cabomba | 9 | 5 | 7 | 7 | 25 |
| Hygrophila | 0 | 0 | 0 | 0 | 0 |
| Bryophytes | 1,536 | 1,687 | 1,944 | 1,070 | 1,750 |
NOTE: LTBG = long-term biological goal.
SOURCE: Blanton and Associates (2018; Tables 3.2-3 and 3.2-10).
each reach, with considerably more progress having been made in the Upper Spring Run reach than in the Old Channel reach. Since implementation of the HCP, substantial amounts of nonnatives have been removed, leading to a loss in fountain darter habitat (as discussed in NASEM, 2017), but that habitat is slowly being replaced with native SAV.
As discussed above, the City of San Marcos spends considerable time and resources on the planting of Texas wild rice, which occurs alongside efforts to restore other native SAV that provides superior habitat for the fountain darter in the San Marcos River. In 2017, these measures were focused on certain portions of the river, such as Spring Lake, the Spring Lake Dam LTBG reach, the City Park LTBG reach, the Cypress Island restoration reach, the I-35 LTBG reach, and the expanded I-35 restoration reach. As an example of the progress made, in the Spring Lake Dam LTBG reach, approximately 498 m2 of Hydrilla, Hygrophila, and vegetation mats were removed. Once the area was denuded of nonnative SAV, an estimated 30 m2 was planted with about 930 individual plants, including Cabomba (120 individuals), Ludwigia (804 individuals), and Sagittaria (10 individuals) (Figure 4-11). As one progresses farther down the river, the removal and replanting efforts diminish, and for many reaches only SAV maintenance has been performed. This was in accordance with the restoration time line
enacted after the biological goals for the fountain darter in both systems were updated in late 2016. In total, approximately 3,595 m2 of nonnative SAV were removed from the San Marcos system, and almost 46,000 individuals were planted in 2017 (including Texas wild rice). Ludwigia repens was particularly successful in comparison to other species and to past years. There were small increases in acreage for Cabomba, but only mixed results for Potamogeton.
In both the Comal and San Marcos systems, progress toward reaching the SAV acreage goals has been incremental, with both losses and gains being experienced since implementation of the HCP. This may not be apparent from Figures 4-10 and 4-11 but is exemplified in Tables 4-9 and 4-10. These tables show that while removal of the nonnative Hydrilla and Hygrophila from the San Marcos system has been consistent and successful in terms of acreage removed from 2013 to 2016, the planting of native SAV has not kept pace, and in some cases there has been a net negative acreage (e.g., with Potamogeton and Cabomba). Looking forward, there are plans for continued planting of native SAV that appear feasible and capable of
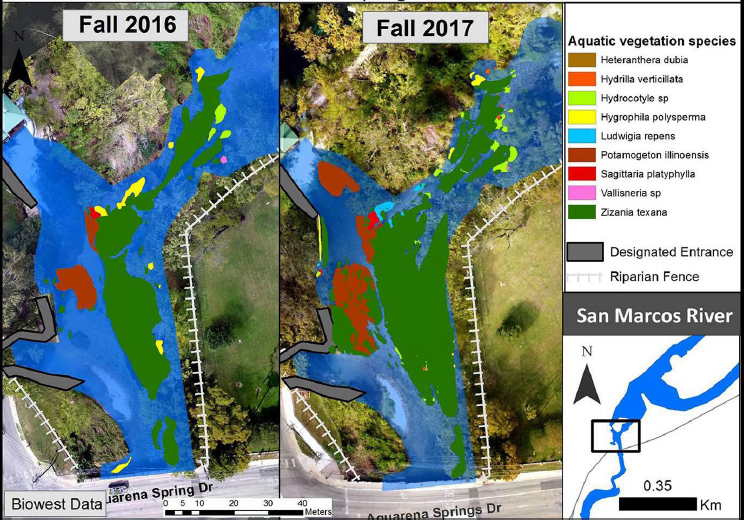
TABLE 4-9 Trends in Areal Coverage (m2) of Aquatic Vegetation at all San Marcos Work Sites from 2013 to 2016 and Changes Detected 2013–2016 and 2015–2016
| Species | 2013 | 2014 | 2015 | 2016 | 2013–2016 | 2015–2016 |
|---|---|---|---|---|---|---|
| Cabomba | 163.0 | 36.6 | 13.8 | 11.5 | −151.5 | −2.3 |
| Heteranthera | 0.0 | 152.8 | 63.8 | 165.5 | 165.5 | 101.7 |
| Hydrillaa | 3,980.2 | 1,804.1 | 1,032.5 | 864.1 | −3,116.1 | −168.4 |
| Hydrocotyle | 78.2 | 131.4 | 25.3 | 112.4 | 34.2 | 87.1 |
| Hygrophilaa | 2,610.6 | 1,382.6 | 888.8 | 861.6 | −1,749.0 | −27.2 |
| Ludwigia | 0.0 | 73.3 | 0.0 | 9.0 | 9.0 | 9.0 |
| Nasturtiuma | 31.4 | 111.7 | 0.0 | 0.0 | −31.4 | 0.0 |
| Potamogeton | 1,530.4 | 762.7 | 437.8 | 800.9 | −729.5 | 363.1 |
aNonnative species. Work sites in 2016 had aquatic vegetation efforts (i.e., removal and planting) and included Spring Lake, Sewell Park, City Park, Hopkins Street–Bicentennial Park, Cypress Island, Rio-Vista Dam, and I-35.
SOURCE: Blanton and Associates (2017).
TABLE 4-10 Trends in Areal Coverage (m2) of Aquatic Vegetation at City Park of San Marcos River 2013–2016 and Changes Detected 2013–2016 and 2015–2016
| Species | 2013 | 2015 | 2016 | 2013–2016 | 2015–2016 |
|---|---|---|---|---|---|
| Heteranthera | 0.0 | 0.3 | 0.8 | 0.8 | 0.5 |
| Hydrillaa | 1,466.3 | 308.3 | 301.1 | −1,165.2 | −7.2 |
| Hydrocotyle | 0.0 | 0.0 | 0.1 | 0.1 | 0.1 |
| Hygrophilaa | 585.6 | 191.8 | 53.8 | −531.8 | −138.0 |
| Ludwigia | 0.0 | 0.0 | 9.0 | 9.0 | 9.0 |
| Nasturtiuma | 1.6 | 0.0 | 0.0 | −1.6 | 0.0 |
| Potamogeton | 254.0 | 180.2 | 112.1 | −141.9 | −68.1 |
| Sagittaria | 17.8 | 0.0 | 19.1 | 1.3 | 19.1 |
| Vallisneriaa | 1.7 | 0.0 | 0.0 | −1.7 | 0.0 |
| Zizania | 384.3 | 1,348.3 | 1,544.6 | 1,160.3 | 196.3 |
aNonnative species.
SOURCE: Blanton and Associates (2017).
reaching the coverage targets. Tables 26 (Comal) and 34 (San Marcos) in BIO-WEST and Watershed Systems Group (2016) show year-by-year efforts required to attain the required areal coverage. Planting of roughly 12 to 50 of each species in each reach will attain the coverage goal, and the contractors have shown the capacity and knowledge required to carry out this work.
As discussed in detail in the Committee’s second report (NASEM, 2017), the Comal and San Marcos SAV teams have had considerable success in terms of the ratio of plants put in the system that have survived and become established. As of 2016, the ratios of individual plants to resulting coverage in square meters was 20:1 in the Comal and 31:1 in the San Marcos (BIO-WEST and Watershed Systems Group, 2016). The Texas wild rice ratio was eight plants for every resulting square meter of coverage. Extensive experience by the contractors has added to confidence in propagation and planting methodologies such that a restoration plan describing the required area of new SAV along with a time line for achieving the coverage goals appears reasonable for both systems, with work in the Comal system scheduled for completion by 2023 and in the San Marcos system by 2027. Areas to be planted and maintained in each year are within the amount of yearly work already performed (although the work is expensive and increases would easily exceed budgeted amounts).
The monitoring of SAV in the two river systems is extensive. As dis-
cussed in previous reports of the Committee, aquatic vegetation is mapped throughout the entire river systems every five years, although in the San Marcos River, Texas wild rice is mapped annually. Vegetation in the LTBG reaches is mapped twice per year and when triggered by low-flow conditions. This monitoring program means that there are abundant data for performance monitoring of the restoration measures, as exemplified by BIO-WEST and Watershed Systems Group (2016), which included the number of plants planted, resulting sustained area, increased coverage of vegetation from baseline maps in 2013, and lessons learned from new techniques.
As discussed extensively in NASEM (2017), a mechanistic model of SAV growth and dispersal was constructed as part of the larger ecomodel developed for the fountain darter. The model development was useful because it highlighted the factors presumed to affect SAV performance, such as interspecific competition for light, sensitivity to flow velocities, nutrient limitation, or substrate preference. Unfortunately, model development has not reached the point where the model can be used to predict the performance of the SAV restoration measures.
Will the SAV Restoration Measures Meet the Habitat Objectives for Texas Wild Rice and the Fountain Darter?
With their documented success in planting and propagation to date, removal of nonnative SAV, and readjustment of SAV species included as fountain darter habitat, the Committee determines that these combined measures will be effective in meeting the habitat component of the biological goals for Texas wild rice and the fountain darter. These measures were not rated as highly effective for three main reasons. First, there may be a scouring flood that could completely reset both systems (although this is largely outside human control). Over geological time, the systems have certainly been scoured multiple times and recovered, but with climate change, such events may be more common in the future. Second, for the Comal system there is a reliance on bryophyte cover to provide habitat for about 75 percent of the fountain darters. Bryophytes cannot be actively managed, and the present strategy is simply to maintain some open areas suitable for bryophytes and free of both native and nonnative plants. This is an overreliance on the capability of these plants to spread and establish without a solid understanding of what controls bryophyte success. In addition, there is not a clear management response to be brought to bear if naturally recruited bryophyte coverage seems to be falling short of the required area. Finally, continual maintenance gardening will be needed to meet the SAV targets in both systems. Financial constraints may arise from the maintenance needs of existing SAV if extreme events occur or if progressively inferior portions
of the rivers are targeted for planting. The Committee understands that there is a cushion of restoration funds now, but there is no guarantee that this will be sufficient for the “perfect storm” of bad events or that the funds will remain available indefinitely.
The current practice of brute-force weeding and planting will probably allow the EAA to meet its objectives but may not be sustainable, and the resulting systems may not be as resilient as a system that sorts itself out with different coverages of various SAV species. Separately, it seems likely that removal of nonnative SAV is key to further expansion of Texas wild rice. As discussed further in Chapter 5, it would be desirable to have the systems become more self-maintaining.
RECREATION MANAGEMENT
Human recreational use of the San Marcos and Comal systems has occurred for decades, and continued recreational use of these natural resources is identified as one of the activities covered by the HCP. Recreational use of the springs and associated river stretches is under the jurisdiction of the cities of New Braunfels and San Marcos, as well as Texas State University. These entities played a large role in developing the recreational M&M measures, along with individuals representing recreational interests. The EAA also contracted with Halff Associates to prepare a Recreation Study that reviewed and summarized existing data and ordinances that regulate recreation and recreation development in the San Marcos and Comal systems (Halff Associates, Inc., 2010). Findings from this study, stakeholder comments, deliberations among members of the Recreation Work Group, as well as input from the five HCP permit holders were instrumental in developing M&M measures to reduce or eliminate negative impacts to the Comal and San Marcos systems from recreational activities of the hundreds of thousands of people who enjoy these natural resources each year.
The majority of recreation-associated M&M measures target habitat protection and water quality issues such as siltation and turbidity. Protections to mitigate recreation-associated damage to covered species are often most important during periods of low flow. More recreation-associated M&M measures were identified in the HCP for the San Marcos system than for the Comal, largely due to recreational activities associated with Sewell Park on the Texas State University campus, the tubing operation at City Park, and other recreational activities (swimming, fishing, picnicking, etc.) that occur at public recreation areas downstream to I-35. The recreational M&M measures listed in the HCP are outlined in Table 4-11.
TABLE 4-11 Recreation Management Measures in the Habitat Conservation Plan
| M&M Measure (HCP Section) | Spring System | Target Speciesa | Purpose |
|---|---|---|---|
| Management of public recreational use (5.2.3) | Comal | CSRB, FD | Prevent physical damage to species and their habitats |
| Management of recreation in key areas (5.3.2, 5.3.2.1, 5.4.2) | San Marcos | TWR, FD | Reduce physical damage to TWR |
| Designation of permanent access points/bank stabilization (5.3.7) | San Marcos | TWR | Prevent shoreline erosion |
| Diving classes in Spring Lake (5.4.7.1, 5.4.7.2, 5.4.7.3) | San Marcos | SMS, FD, TWR | Prevent physical damage to species and their habitats |
| Boating in Spring Lake and Sewell Park (5.4.10) | San Marcos | SMS, FD, TWR | Prevent physical damage to species and their habitats |
| State Scientific Areas (5.6.1) | San Marcos | TWR | Prevent physical damage to species and their habitats |
NOTE: CSRB = Comal Springs riffle beetle, FD= fountain darter; SMS = San Marcos salamander; TWR = Texas wild rice.
aThis column is broader than those species that have a district recreational control biological objective. Rather, it broadly considers all organisms that could benefit from recreational control.
Management of Public Recreational Use in the Comal System
Recreational use of the Comal system is addressed via two strategies: (1) New Braunfels City ordinances and policies and (2) issue of Certificates of Inclusion (COIs) for commercial outfitters that desire coverage under the incidental take permit (ITP). The City of New Braunfels made the commitment not to relax environmental protections to the Comal system that were already provided when the HCP was written. They also agreed to enforce current regulations, limit recreational use on Landa Lake to paddle boats, prohibit access to spring runs in Landa Park to just the wading pool of Spring Run 2, and prohibit recreation in the Old Channel, with the exception of recreational activities associated with the Schlitterbahn Waterpark Resort. The City also committed to develop a COI program for recreational outfitters (e.g., mainly inner-tube providers) that follows certain guidelines
(e.g., provide litter bags, organize an annual river cleanup, erect educational signage, submit an annual report). Outfitters that opt in to this voluntary program and adhere to all its requirements receive incidental take coverage of listed species in the HCP for the duration of their certificate (not to exceed the duration of the ITP term).
The City of New Braunfels continues to enforce City Ordinance Section 142-5, which restricts access to Landa Lake, Comal Spring runs, and the Old Channel of the Comal River, as they are obligated to do under the HCP. Enforcement began the first year the HCP was in effect and has been ongoing. Signs were installed near the shoreline at Landa Lake and spring runs informing visitors about this environmentally sensitive area and access restrictions. These efforts may have questionable effectiveness, as during a Committee site visit in October 2017, several park visitors were observed wading in one of the protected spring runs.
The recreational outfitter COI program was initiated the first year of the HCP. The goal for 2014 was to enroll most of the outfitters by the end of that year. Nonetheless, the HCP annual report for 2016 states that the City of New Braunfels reported that this process is still ongoing, and outfitters continue to be recruited to join the COI program (Blanton and Associates, 2017). However, as of January 2018, no recreational outfitters have enrolled in the program. Outfitters not enrolled in the program remain liable for take of listed species due to their operations. Enrollment of all outfitters in this program should be pursued to reduce recreational impacts, enhance public awareness, and alleviate liability of outfitters through coverage under the ITP.
Management of Recreation in the San Marcos System, Including the Designation of Permanent Access Points/Bank Stabilization
Recreational M&M measures in the San Marcos system involve protecting Texas wild rice in the San Marcos River from damage caused by a diversity of activities (e.g., swimming, snorkeling/SCUBA, tubing, and recreation with dogs). Protecting fountain darters from increased turbidity (caused by shoreline erosion) and incidental contact by recreationists is another important goal. The recreation area of greatest concern in the San Marcos River is at City Park, where there is high demand for inner tubes rented by the Lion’s Club operating out of the San Marcos City Recreation Hall. Additional key recreation areas targeted in the HCP include Spring Lake and access points along the river on the Texas State University campus. “Recreation control is not meant to curtail recreation for large stretches of the river, but simply within key high quality habitat areas for Texas wild rice to limit unnecessary impacts during low-flow conditions.” (EARIP, 2012).
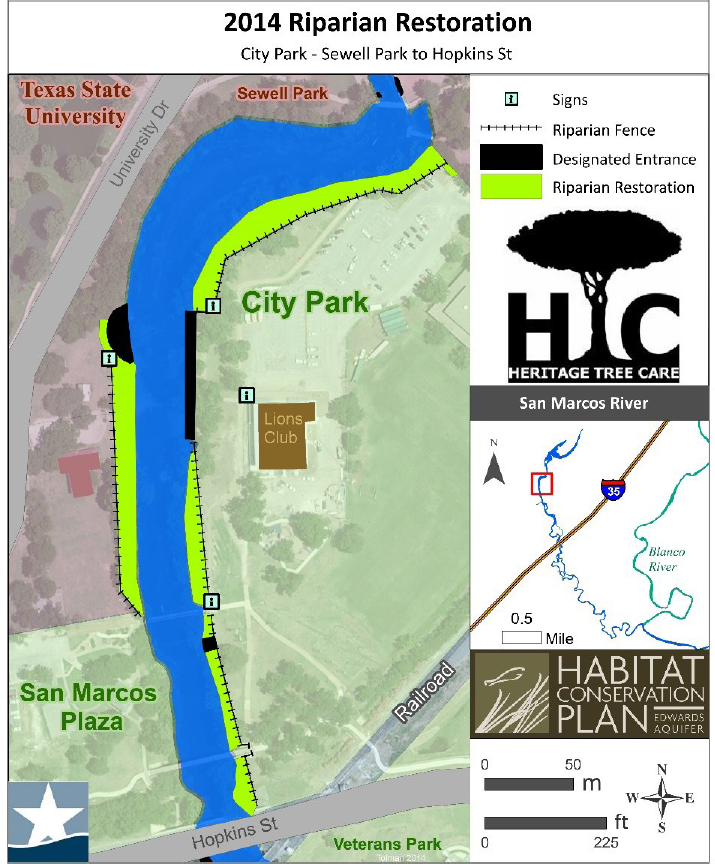
A specific recreational M&M measure was for the City of San Marcos to establish permanent river-access points at several locations along the San Marcos River: City Park (see the black areas in Figure 4-12), Hopkins Street and Cheatham Street underpasses, Bicentennial Park, Rio Vista Park (Figure 4-13), and Ramon Lucio Park (Figure 4-14). These sites were chosen because they were already being used by recreationists to access the San Marcos River and were heavily eroded. Texas State University was
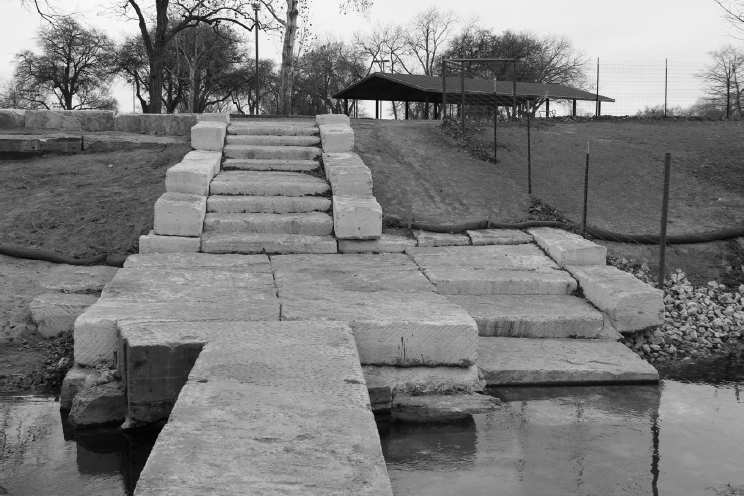
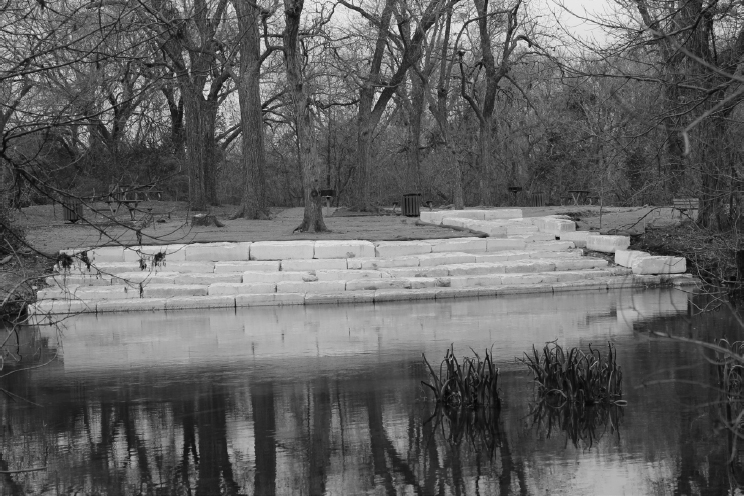
also tasked to establish permanent river-access points on the east and west banks of the river between Spring Lake Dam and the bridge at Aquarena Drive. Additional permanent access points include Dog Beach, Lion’s Club Tube Rental, the Wildlife Annex, and possibly other areas over time. The establishment of permanent access points (via the installation of hardened structures) directs river users to desired locations and also stabilizes the bank from erosion and reduces turbidity.
Areas of riverbank interspersed among the permanent access points are to be planted with dense vegetation to encourage river access only at desired locations. The City of San Marcos also committed to work with private landowners to enforce trespassing laws because the public uses private property illegally to gain access to the river. An educational program was proposed in the HCP that includes signage erected at the access points, maps showing locations of access points, literature distributed at local businesses, and an outreach program for the San Marcos Consolidated Independent School District, among other educational tools. The City of San Marcos and Texas State University also agreed to a partnership to educate river users and enforce environmental regulations. Finally, like the City of New Braunfels, the City of San Marcos was to implement a recreational outfitter COI program as described earlier.
Establishment of permanent river-access points at all predetermined locations was completed by the end of 2014 (Blanton and Associates, 2015), and the City of San Marcos has maintained the access points and repaired bank stabilization structures as needed since then. Terraces and walls were constructed from natural stone to stabilize the riverbank and facilitate river access by the public. Native vegetation was planted between permanent access points to eliminate public access in these areas. Fences were erected at the upland edge of the plantings to protect the vegetation until it matures. Buffer zones (100 ft wide) excluding picnic tables, portable grills, and pop-up shelters from the shore of the San Marcos River were established at Rio Vista Falls and numerous other locations from Sewell Park to I-35. The educational program is in place and continues to realize numerous accomplishments (Blanton and Associates, 2015). Numerous kiosks and educational signs were developed and installed at key recreation areas. In collaboration with Texas State University, a Conservation Crew consisting of a team of university students was developed to educate the public about the HCP, with an emphasis on protected species, especially Texas wild rice. The Conservation Crew is active on the river annually from around Memorial Day to Labor Day. They conduct a variety of activities that include speaking with people along the river about natural resource protection, inspecting riparian fences and educational signs for damage, clearing floating mats of vegetation from Texas wild rice stands, public outreach events, and litter removal—they remove thousands of pounds of litter annually.
The Conservation Crew has become a popular paid-internship opportunity for Texas State University students.
Diving Classes in Spring Lake
The purpose of these recreational M&M measures is to ensure that listed species and their habitats within Spring Lake are not negatively impacted by the activities of SCUBA divers in Spring Lake. The Meadows Center for Water and the Environment, operated by Texas State University, is the organization that controls access to and regulates diving in Spring Lake, as specified in the Meadows Center’s revised Spring Lake Management Plan. This is accomplished by limiting the number of divers in the lake at any particular time and also ensuring that divers are trained to avoid contacting covered species or disturbing critical habitat. Divers trained under this program provide valuable volunteer services, such as litter removal and algae control. A diving supervisor coordinates and supervises all volunteer divers in Spring Lake. The center has a Diving Program Control Board to review diving activities in Spring Lake to ensure that they are in compliance with the HCP and the Spring Lake Management Plan.
The number of divers using Spring Lake is monitored and reported annually in the HCP annual reports. The Texas State SCUBA Class program was supposed to formally revise their diving classes in 2013 to be consistent with protocols identified in the HCP, but they apparently did not (SWCA Environmental Consultants, 2014). However, in 2016 Texas State formally adopted the recreational diving protocol outlined in the HCP and the Spring Lake Management Plan.
Boating in Spring Lake and Sewell Park
Boating activities in Spring Lake and Sewell Park are regulated to minimize impacts to covered species and their habitats in the lake and in the San Marcos River. Boating M&M measures include limiting the number of boats on the water as well as designating access points and the areas where boats are allowed to operate (covered vessels include canoes, kayaks, and glass-bottom boats). Additionally, all boats launched at Spring Lake are cleaned before launching, following a protocol approved by the U.S. Fish and Wildlife Service (FWS).
In 2013, the Meadows Center revised its Spring Lake Management Plan to include measures outlined in the HCP. In Spring Lake these include limiting canoe and kayak classes to ≤ 2 classes/day that are limited to 20 students in 10 boats, and with a maximum time on the water of one hour; restricting operation of glass-bottom boats to areas of Spring Lake that are “mowed” with a harvester to control aquatic vegetation; decontamina-
tion of all boats launched at the lake following an approved protocol; and launching of boats only at established locations. At Sewell Park, canoe and kayak classes are limited to the stretch of the San Marcos River between the park and the Rio Vista dam. Boat access is limited to the floating dock adjacent to the recreation center. Additional restrictions include no more than three classes/day (each with a maximum duration of two hours) with 20 or fewer students in no more than ten boats. Texas State University was supposed to formally modify its boating program at Spring Lake and Sewell Park to be consistent with these guidelines in 2013 (SWCA Environmental Consultants, 2014), but apparently did not do so until 2015 (Blanton and Associates, 2016).
State Scientific Areas
Recreational activities traditionally occurring on the San Marcos and Comal Rivers (e.g., swimming, snorkeling, boating, tubing, wading, fishing, and dog activity) can have negative impacts on habitat for covered species. These impacts are exacerbated at low flows, when a greater percentage of plants and bottom substrate is exposed to potential negative consequences. The Texas Parks and Wildlife Department (TPWD) has the authority to establish State Scientific Areas (SSAs) for the purposes of education, scientific research, and preservation of flora and fauna of scientific or educational value. On March 29, 2012, the TPWD created an SSA designed to protect prime Texas wild rice habitat by restricting recreational activities during flows below 120 cfs in a two-mile reach of the San Marcos River from the Spring Lake Dam to the San Marcos wastewater treatment plant. When flows within the San Marcos River SSA are 120 cfs or less, physical barriers may be placed within the SSA to help recreational users avoid vulnerable stands of Texas wild rice while enjoying the river and to protect areas where habitat has been restored. Rules prohibit moving or altering SSA boundary markers, uprooting Texas wild rice within the area, or entering a marked SSA area. The regulations are intended to preserve at least 1,000 m2 of Texas wild rice.
When flows dropped below 120 cfs in the summer of 2013, physical barriers were deployed around two vulnerable stands of Texas wild rice (at Bicentennial Park and at the eastern spillway) to help people avoid the plant while recreating in the river (Figure 4-15). During summer 2014, flows were again below 120 cfs, and two additional exclusion areas were established downstream of the Hopkins Street railroad bridge and across from the Texas State Outdoor Recreation Center boat dock. Flows remained above 120 cfs in 2015 and 2016. In 2016 the four exclusion areas (see Figure 4-16) encompassed 1,772 m2 of Texas wild rice.
With the exception of the eastern spillway immediately below Spring
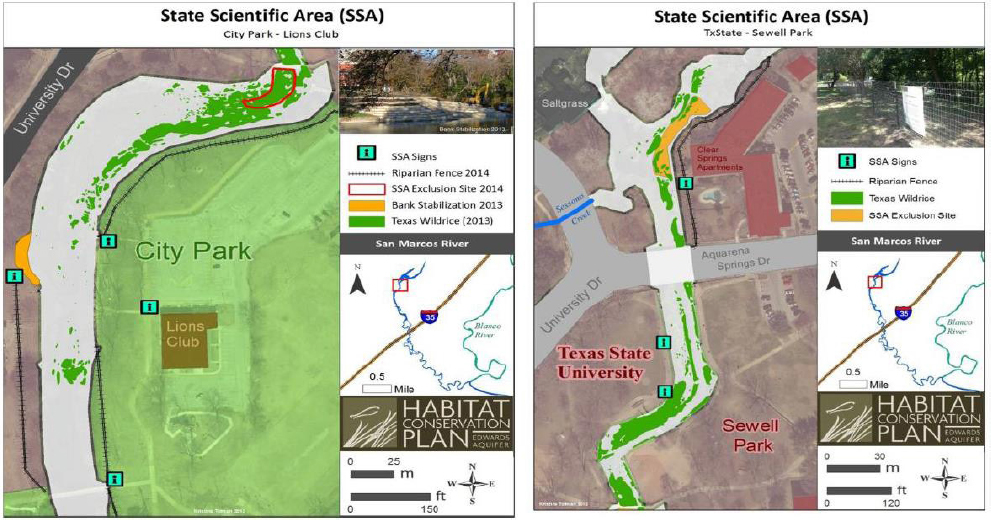
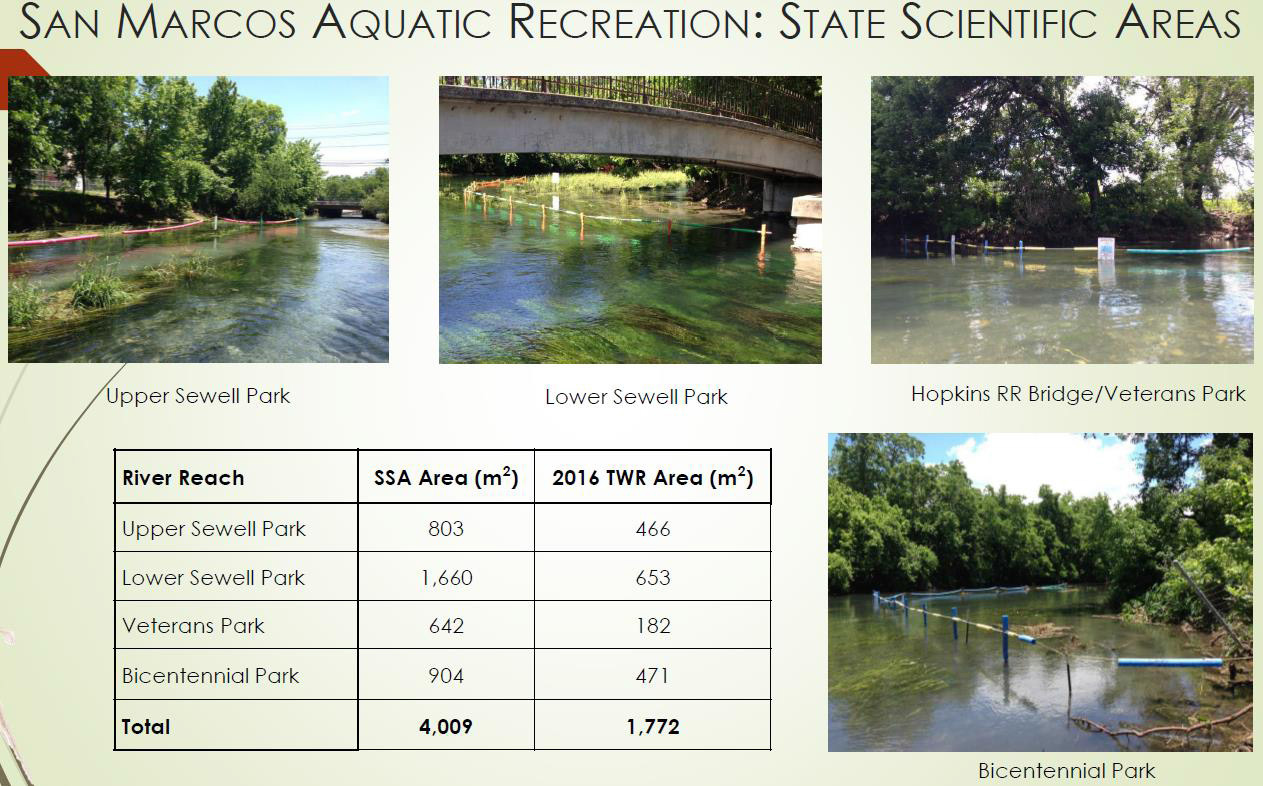
Lake Dam, areas protected by the SSA do not extend across the entire river channel, in order to maintain longitudinal connectivity for recreation and access throughout the river. Under low-flow conditions, recreational access to the eastern spillway is prohibited to protect critical habitat for San Marcos salamanders and to enhance the protection of fountain darters and Texas wild rice in the reach immediately below Spring Lake Dam.
The HCP calls for the TPWD to pursue creation of similar SSAs in the Comal Springs ecosystem to minimize impacts of recreational activities at low flows on existing fountain darter habitat and additional habitat created by the City of New Braunfels. In 2017, the TPWD was to initiate discussions with the City of New Braunfels regarding creation of an SSA for the Comal River.
Recreational use outfitters on the San Marcos system are required to provide a map and educational signage at the point of purchase to inform users about the SSA. A similar requirement will be implemented for outfitters in the Comal system when an SSA is established there.
Will Recreation Management Lead to Achievement of Texas Wild Rice and San Marcos Salamander Biological Objectives?
The M&M measures associated with recreation management play an important role in meeting several key biological objectives in the HCP, particularly those pertaining to Texas wild rice and the San Marcos salamander. Texas wild rice is directly vulnerable to damage such as breakage, loss of seed heads, and uprooting due to incidental or intentional contact from humans and dogs during in-stream recreational activities, especially during low flows. These impacts can be exacerbated by fragmentation of other vegetation, which then floats downstream and collects on wild-rice stands. Accidental contact by recreationists is less likely for other covered species, but indirect effects on habitat via siltation and turbidity can be important, especially for the San Marcos salamander and the Comal Springs riffle beetle. Recreation management indirectly supports biological objectives for the fountain darter by protecting aquatic vegetation that constitutes critical habitat for them, and by reducing turbidity, which may inhibit feeding by this visual predator.
The Committee rates the M&M measures intended to minimize recreational impact on Texas wild rice and the San Marcos salamander as effective. Anecdotal evidence suggests that measures to protect Texas wild rice in the San Marcos system have had favorable results. The suite of onsite and community educational efforts that have been implemented seem to have had a positive impact on user behavior (however, no formal evaluation has been conducted), contributing to successful establishment and maintenance of Texas wild rice stands. Implementation of access restrictions within the
SSA substantially reduced physical disturbance of vulnerable stands during low flows in 2013 and 2014. Establishment of permanent, non-erosive access points, coupled with establishment of riparian vegetation buffers that discourage access elsewhere, has substantially reduced point sources of sedimentation from shoreline erosion. The highly regulated use of boating and diving in Spring Lake not only minimizes impacts on covered species and their habitats but also educates users, promotes awareness, and enhances public appreciation of the San Marcos system. While the COI program for recreational outfitters has the potential to further reduce recreational impacts and enhance public awareness, as of January 2018 no outfitters had entered the program.
Considering the limited distribution of San Marcos salamanders and their strong association with spring outflows in Spring Lake, marginally regulated recreational activities, such as tubing, wading, and swimming (which primarily occur in the river proper), have much less potential to impact this listed species as compared to Texas wild rice. Rather, the recreation-associated M&M measures in the HCP that regulate recreation in Spring Lake are intended to prevent physical disturbance of San Marcos salamanders and their benthic habitats. Numerous measures are in place to ensure that SCUBA divers avoid contact with San Marcos salamanders, and only trained divers are allowed to swim outside of the Diver Training Area. These volunteers play an important role in removal of algae and litter from Spring Lake. Boating in Spring Lake is also highly regulated, and specific M&M measures ensure that boats do not damage San Marcos salamanders or their habitats.
There are several actions that can be taken to shift the rating toward highly effective. For Texas wild rice, enrollment of all outfitters in the COI program should be vigorously pursued to further reduce recreational impacts, enhance public awareness, and alleviate liability of outfitters through coverage under the ITP. Education efforts to encourage protection of covered species and their habitat could be further enhanced through the use of social media (e.g., Twitter, Facebook, and Snapchat), and through university websites to reach the campus community at Texas State University. For the San Marcos salamander, recreational access to the 50-meter stream reach immediately below the spillway should be further restricted. For both species it will be important that the actions currently in place be sustained, enforced, and monitored.
RIPARIAN MANAGEMENT
Riparian management measures, including restoring native riparian vegetation, stabilizing riparian banks, and preventing shoreline erosion and sedimentation, are considered critical to the CSRB, for which one of the bio-
logical objectives is to “restore riparian habitat adjacent to spring openings to reduce siltation” (EARIP, 2012). For the San Marcos salamander, there is no explicit biological objective linked to riparian restoration. However, the Committee has inferred its importance given that the biological goals of maintaining silt-free gravel for the salamander and the CSRB are very similar. Furthermore, the HCP states that “From a habitat perspective, the goal [for the San Marcos salamander] is to maintain silt-free habitat conditions via continued spring flow, riparian zone protection, and recreation control throughout each of the three reaches (hotel area, riverbed area, and eastern spillway below Spring Lake Dam)” (EARIP, 2012, p. 4-31).
Well-executed and monitored riparian management activities may also have positive effects on other listed species, for example, by mediating sediment loading and transport in the San Marcos system and thereby affecting the survival of Texas wild rice or by controlling the amount of shading or sedimentation, which can affect the growth of native SAV in both systems. Riparian management also supports recreation management by blocking access to portions of the rivers and funneling people to specific access points. This section focuses on the measures that involve restoring native riparian plant species and stabilizing banks. In the Comal system, this has been primarily, but not exclusively, for the benefit of the CSRB, while in the San Marcos system, riparian management has primarily occurred in conjunction with the establishment of permanent access points (which were evaluated in the Recreation Management section of this chapter). The riparian-related management measures in the HCP are shown in Table 4-12.
Riparian Restoration in the Comal System for the CSRB
The riparian management measures that predominantly affect whether the biological objectives of the CSRB can be met are those implemented in the LTBG reaches of Comal Springs that are monitored for the CSRB. The LTBG reaches for the CSRB are fed by multiple spring outflows within the reach of each main spring and receive no direct surface flow from upstream, or in the case of the western shoreline of Landa Lake, the springs are immediately adjacent to the bank in areas of low flow. Because of this hydrological disconnect from the main Comal system (e.g., Landa Lake flow), any activities that would impact the monitored CSRB populations will primarily come from the riparian banks immediately adjacent to each spring reach. A primary goal of riparian restoration is to promote bank stabilization by establishing root structures and thus preventing the siltation of adjacent spring openings. A secondary process of importance is the influence of riparian areas on nutrient loading to the aquatic habitat of the CSRB.
A riparian restoration program was implemented in 2013 to improve CSRB habitat in Spring Run 3 and the western shoreline of Landa Lake.
TABLE 4-12 Riparian Management Measures in the Habitat Conservation Plan
| M&M Measure (HCP Section) | Spring System | Target Species | Purpose |
|---|---|---|---|
| Riparian improvements and sediment removal specific to the CSRB (5.2.8) | Comal | CSRB | Increase the amount of usable habitat and food sources |
| Restoration of riparian zone with native vegetation (5.7.1) | Comal and San Marcos | CSRB, SMS, FD, TWR | Prevent shoreline erosion and sedimentation of rivers, provide food source for invertebrates |
| Bank stabilization/permanent access points (5.3.7) | San Marcos | FD, TWR | Discourage river users from entering the river in places other than permanent access points. |
NOTE: CSRB = Comal Springs riffle beetle; FD = fountain darter; SMS = San Marcos salamander; TWR = Texas wild rice.
These riparian areas are dominated by rocky soils with limited water capacity, shallow bedrock, and limestone outcrops on 20- to 40-percent grades. The overstory is dense and provides considerable shade that affects understory plant growth, which may affect restoration efforts of reestablishing native species. There is also evidence of sizeable deer grazing pressure on the vegetation of this shoreline habitat, in addition to other wildlife and park visitors that physically disturb replanted vegetation and contribute to erosion. Given the steep gradient, low water capacity, shallow rooting zone, and physical disturbance, determining the success of riparian restoration efforts is challenging and has been based primarily on observational evidence.
In 2016, riparian restoration involved (1) removal and/or treatment of exotic vegetation, (2) construction and maintenance of erosion structures, (3) revegetation of the shoreline by planting native vegetation, and (4) sediment and vegetation monitoring. The removal of nonnative vegetation and replanting with native species occurred about 45 feet up the hillside along approximately 1,105 ft of shoreline that extends from Spring Run 3 to private property along the western shoreline of Landa Lake. Temporary infrastructure in the form of drip irrigation lines, erosion control structures, and signs were installed and maintained to help replanted vegetation
thrive, reduce sediment movement, and maintain soil moisture. Replanting was primarily with plugs of inland sea oats (Chasmanthium latifolium) and Indiangrass (Sorghastrum nutans) that had been successfully used in the past, with some seedlings of Mexican buckeye (Ungnadia speciosa) and grass plugs. Restoration activities also involved the removal or herbicidal treatment of nonnative species, such as Japanese ligustum (Ligustrum japonicum) and elephant ear (Colocasia sp.). Plant survival within the restoration area was monitored monthly for a year, while any reemergent nonnative plants were continually removed. In general, the activities have resulted in increased abundance and diversity of the shrub and herbaceous layers (Blanton and Associates, 2017, App. L4).
To prevent bank erosion and runoff into the springs, erosion control structures that range from 3 to 64 ft long were installed along the 1,105 ft of shoreline of the restoration area; these have been maintained and monitored since installation. Sediment capture depth was measured by change in the exposure length of steel pins driven into the sediment within the structures. Captured sediment runoff volume was quantified by measuring sediment accumulation behind the structures. It was estimated that 0.72 cubic yards of sediment was prevented from entering the two study reaches in 2016 (Blanton and Associates, 2017, App. L4).
To prevent physical damage and disturbance to the restoration activities from park visitors, signs were placed along trails and entrances to areas along the restored shoreline. However, the success of this signage is ambiguous, as evidenced by damaged infrastructure. Visual observations by the Committee during a site visit in 2017 found that people were actively wading in and around the spring openings in the presence of signage.
The main negative influence on the riparian restoration activities was excessive rainfall, which submerged or washed out previously planted native species. Areas of the restored shoreline with abundant sunlight supported the most successful replanting efforts, while shaded habitat led to low survivorship of even species considered to be shade tolerant (e.g., certain grasses and wild rye [Elymus sp.]). One exception was the ice plant (Verbesina virginica) and inland sea oats that are reproducing in the restored shoreline even in shaded areas. In one quantitative survey of inland sea oats, Indiangrass and cut rice grass, the average survivorship of plant plugs in 2016 was 70 percent—higher than in 2013 (36 percent) and 2014 (60 percent), but lower than in 2015 (82 percent), indicating annual variability that should be considered in long-term monitoring. Wild rye showed limited survivorship during summer monitoring events.
In 2017, all of these riparian restoration activities continued along Spring Run 3 and the western shoreline (Figure 4-17). An additional 500 linear feet of brush berms and fenced enclosures were constructed in 2017 to prevent deer foraging and trampling of replanted native vegetation and
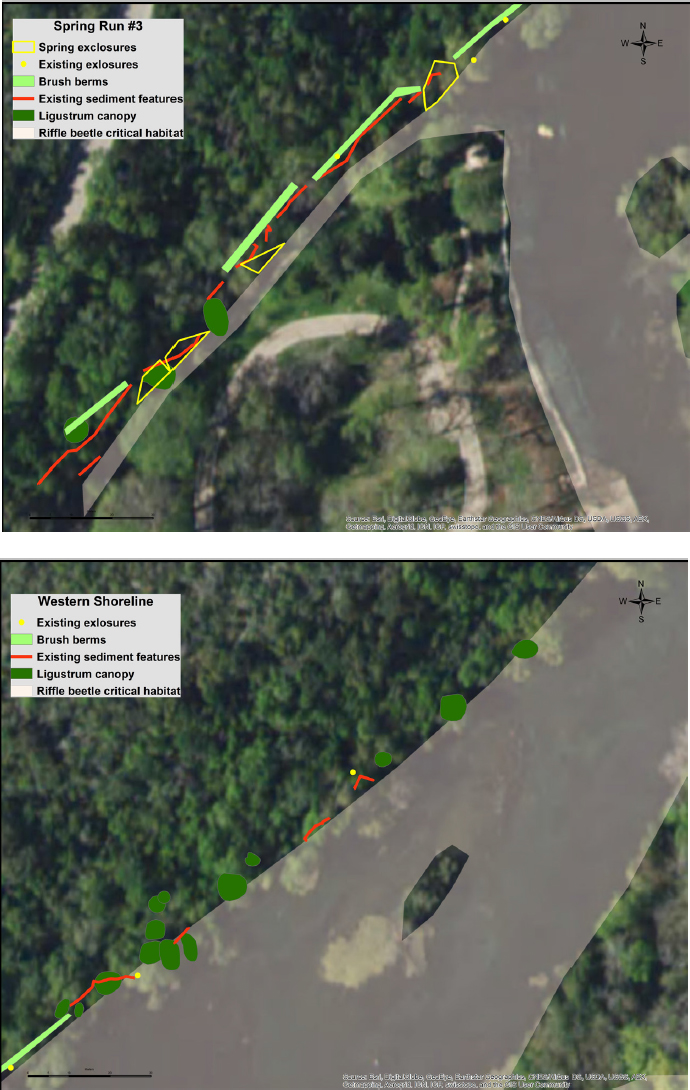
to reduce erosion and runoff near CSRB spring orifices. A total of 385 new native plants were planted within the project area. The riparian planting activities have had to contend with the reemergence of nonnative species that are competing with the newly replanted native species. Although riparian sediment and vegetation continued to be monitored, the 2017 HCP Annual Report (Blanton and Associates, 2018) has no discussion of the monitoring results.
Riparian Restoration along the Old Channel
Riparian restoration along sections of the Comal River that are not habitat for the CSRB is done primarily for the purposes of improving fountain darter habitat via reduction of erosion and sedimentation that might inhibit the growth of SAV. In 2016, approximately 1,000 ft of previously eroding bank habitat along the Old Channel was replaced with stabilization structures to prevent continued erosion. This activity included using water-filled bladder dams to minimize sediment and debris entering the channel while recontouring the slope and installing toe-of-slope systems, mid-slope waler walls, run-on control berms, and drainage swales (Figure 4-18). At the end of the construction activities, erosion control matting was installed, and topsoil was applied and then hydroseeded with a native plant seed mix.
In 2017, similar nonnative removal and native replanting activities continued. Along certain parts of the channel, including adjacent to the golf course, fencing was erected and 10-ft buffers were delineated as no-mow zones to encourage the establishment of functional riparian zones. Monitoring and maintenance of these riparian areas were conducted, but the results of these activities are not discussed in the 2017 HCP Annual Report (Blanton and Associates, 2018). These activities are planned to continue downstream along the Comal River in 2018, with each new section first receiving treatment to remove invasive riparian plants and then subsequently having new native riparian plants planted. Similar to the remarks for evaluating riparian restoration success in habitats that directly impact the CSRB, there is a critical need to quantitatively evaluate native plant establishment success, bank erosion runoff, and aquatic sedimentation. The extent to which these riparian restoration activities will prevent sediment from entering aquatic habitats in both the short and long terms depends on how well the native species become established and function to reduce erosion.
Riparian Improvements and Sediment Removal in the San Marcos System
Substantial riparian restoration has taken place within the San Marcos system, with similar nonnative removal and native planting occurring in
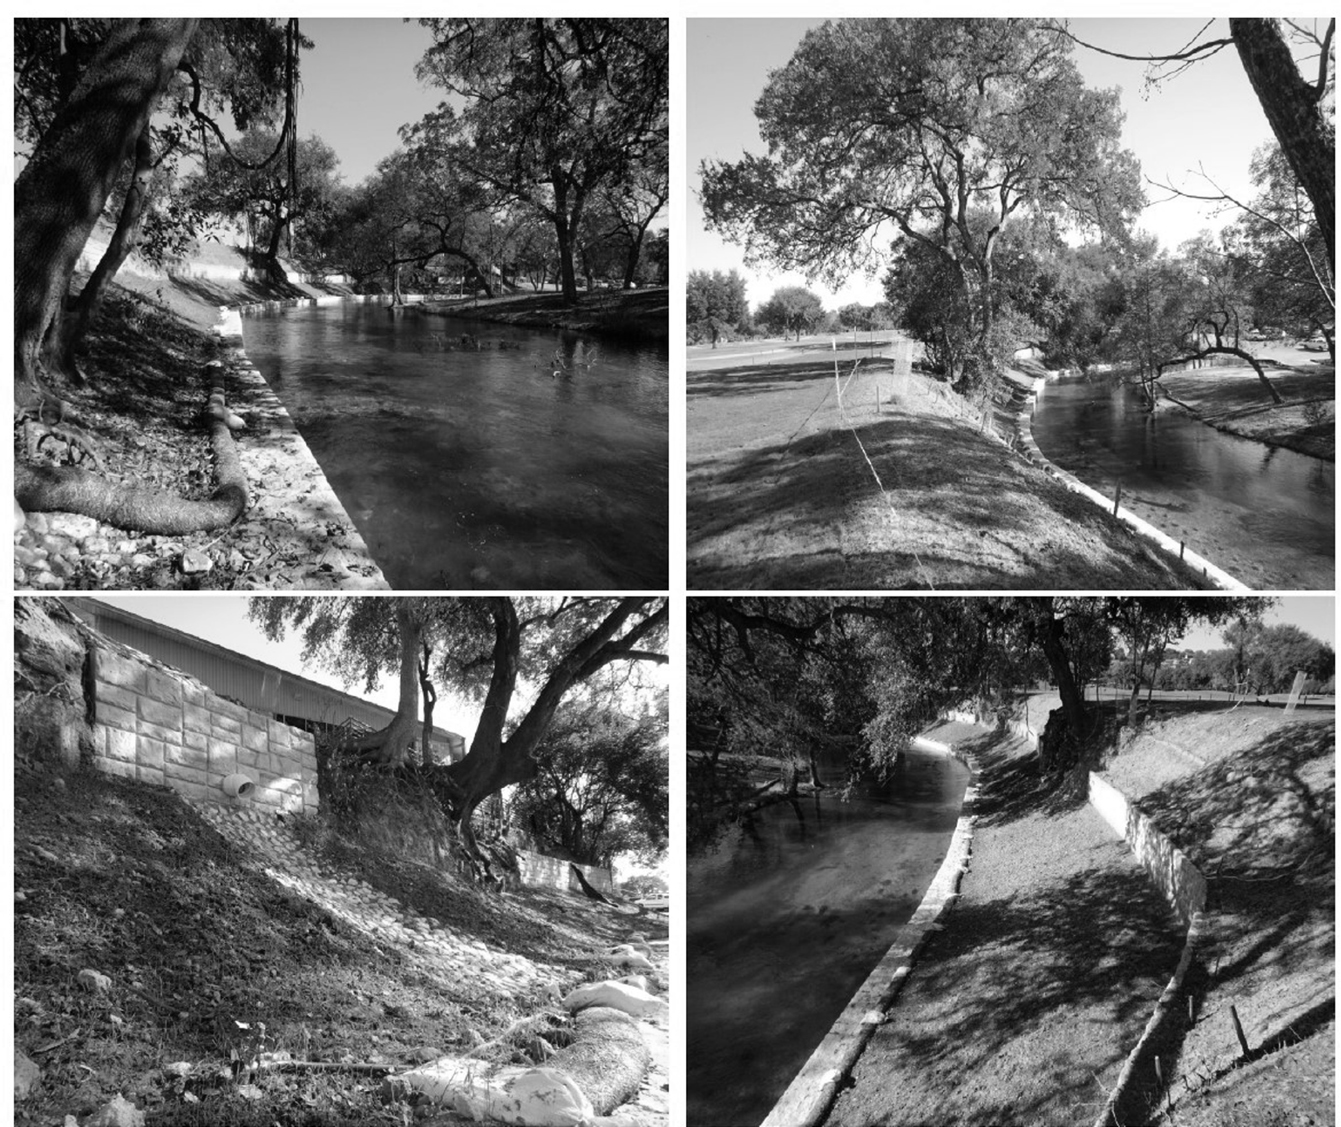
riparian zones along Ramon Lucio Park, Dog Beach Park, Rio Vista Park, Crooks Park, Bicentennial Park, City Park, and Sessom Creek Park. In San Marcos, the riparian replanting activities have been undertaken primarily to support recreation management by blocking access to the San Marcos River except at designated points (see the example in Figure 4-12). However, improving riparian coverage can also benefit the water quality of adjacent aquatic habitats by filtering runoff and reducing sedimentation from erosion. The goals of this work have been, among other things, to increase the width of the riparian zone to at least 15 meters, to maintain all treated and adjacent areas from Clear Springs to I-35 to address seed sources, and to remove invasive trees below I-35 (Furl, 2017).
Note that riparian restoration occurring in the vicinity of the San Marcos salamander (Spring Lake and the Spring Lake Dam region) is likely to be very important to the goal of maintaining silt-free gravel and hence to the habitat component of the biological objective for the salamander. Be-
cause riparian restoration is not a stated objective for any listed salamander, there is no discussion of this issue in the HCP annual reports. However, effective and sustained riparian restoration activities are likely to have positive effects on maintaining silt-free salamander habitat.
Additional Considerations for Riparian Management Activities
There have been considerable changes over the last century to the riparian areas along both rivers (most notably the construction of numerous dams along the Comal River, beginning with the first flour mill in the 19th century). Apparently, large cypress (Taxodium distichum) trees once dominated wet locations along both rivers, with oak trees (Quercus spp.) on drier sites, intermingled with a diverse understory. There have already been some efforts to plant young cypress trees along the San Marcos River to restore what should eventually be a partially shaded canopy over large portions of the upper segments of the river. Hence, there are questions about how dense the canopy should be to match the needs of the listed fish and beetles on one hand and SAV species and bryophytes on the other hand. SAV and bryophytes prefer high light for highest productivity. However, if the overarching tree canopy is very open, water temperatures will rise, and if there are abundant nutrients in the water column, eutrophication would be expected, especially during low-flow periods. In contrast, if the stream bed is too deeply shaded by dense canopy, there will be low productivity of the SAV and bryophyte communities, which may limit fountain darter production (Best, 1984). More light measurements are needed in these reaches to determine if they are light limited or not. The success of reestablishing the native riparian plants themselves is also driven by light availability that presumably will not change unless the overstory trees are removed. In 2017, there was additional removal and pruning of some vegetation to increase light availability to the understory replanted native vegetation.
While there has been some effort to make visual and photographic assessments of how well the native riparian planting mediates soil erosion, there has been no quantitative measure of its success. For instance, while there is visual evidence of sediment accrual behind erosion control structures, there is no measurement of how the rate of this accrual occurs or if it will change once the native vegetation is established. Similarly, there is no measurement of how much sediment is being lost by these structures and entering the aquatic habitats, and there is no monitoring or measuring of aquatic sedimentation. Monitoring or measuring sedimentation and substrate impaction is necessary to evaluate the success of the riparian restoration activities relevant to the CSRB. Examples of how to monitor sedimentation of aquatic substrates can be found in Pasternack and Brush (1998), Knight and Pasternack (2000), and Pasternack et al. (2000). As
part of the water quality monitoring program, there is turbidity monitoring in Spring Runs 1, 3, and 7. However, the turbidity loggers are not placed where they can monitor suspended sediment from riparian restoration, and turbidity is only being measured at one CSRB LTBG reach, Spring Run 3. A quantitative evaluation of the role that native riparian planting activities are having on erosion and aquatic sedimentation deposition is highly warranted.
Moreover, the long-term success of these M&M measures is dependent on the effectiveness of the erosion control structures. These structures are currently made from organic materials that naturally degrade, they are damaged by wildlife and park visitors, and they will require continued maintenance and replacement in forthcoming years. Similar issues arise with the drip irrigation system. A long-term (i.e., decades) plan for dedicating resources to the construction, expansion, maintenance, and replacement of the erosion control and other infrastructure would be useful.
There are studies that have evaluated the efficacy of riparian restoration efforts and found that removal of nonnative species and replanting with native species are complex activities that can be potentially negative by increasing areas of bare soil and compromising bank stability (see Beater et al., 2008). It has even been debated that nonnative species can have a conservation benefit (see Schlaepfer et al., 2011, and the rebuttal, Vitule et al., 2012).
Will Riparian Restoration Achieve the Biological Objectives for CSRB?
While the removal of nonnative riparian plants and reestablishment of native species appears to be showing consistent success since the initiation of riparian restoration activities in 2013, the degree to which this activity is responsible for reducing sediment runoff and hence protecting CSRB habitat is not known. The installation of erosion control structures at the same time as planting, while rational to prevent immediate runoff, obfuscates assessing the success of native plant reestablishment in managing runoff. Monitoring of sediment accumulation in the structures showed that soil is being washed into and captured by the control structures, preventing runoff and deposition into Lake Landa. However, these same observations suggest that the bank habitat has not yet been stabilized by subsequent planting of native vegetation. There is no quantitative monitoring of aquatic sedimentation in the areas adjacent to riparian restoration. For these reasons, the Committee is unable to determine whether riparian management measures will achieve the biological objectives of the CSRB.
Despite this determination for riparian activities intended to improve CSRB habitat, a more definitive assessment can be made for the riparian restoration activities in areas where the CSRB is not routinely found (e.g.,
riparian restoration in the Old Channel of the Comal River and bank stabilization in the San Marcos system). The evidence presented in photographs makes it clear that the riparian restoration measures are effective for reducing erosion and sedimentation that might stymie the growth of SAV and for supporting recreation management by funneling people to permanent access points.
NATIONAL FISH HATCHERY AND TECHNOLOGY CENTER REFUGIA
The HCP calls for establishment of both salvage and long-term refugia programs. These efforts apply to all covered species in both the Comal and San Marcos systems. The limited geographic distribution of these species leaves the populations vulnerable to extirpation throughout all or a significant part of their range.
The purpose of the salvage refugia program is to collect and maintain captive stocks of listed Edwards Aquifer species (and genes) so that individuals are available for reintroduction following a low-flow or other catastrophic event. The HCP requires the establishment of off-site refugia to maintain captive populations of the listed Edwards Aquifer species when it is determined that a significant loss is imminent due to a catastrophic event, such as prolonged drought, calling into question the likelihood of continued species existence in the wild. Specific triggers for salvage collections based on flow, habitat characteristics, or catch per unit effort of target organisms are specified in the HCP. (No salvage events were triggered in 2015 or 2017.)
The long-term refugia program is to house and protect adequate populations (and genes) of covered species; support appropriate research activities; develop protocols for husbandry, propagation, and effective reintroduction techniques; and expand knowledge of their biology, life histories, and genetic variation. For example, the CSRB is being housed and studied at the refugia both to inform improvements in the field monitoring of the beetle and to determine the best conditions for maintaining colonies over the long term.
Given delays in securing a contract for the long-term refugia due to legal questions, and the threat of drought conditions, refugia operations were initiated in a staggered, two-phase process. The first step consisted of establishing a Salvage Refugia Program aimed at quickly providing refuge capabilities to protect the covered species over the short term, ensuring against imminent salvage-trigger threats. This phase became operational in early 2016, and collections of covered species were initiated.
The second step consisted of establishing a Long-Term Refugia Pro-
gram to provide a long-term facility and refugia for the covered species for the duration of the ITP. In 2016, the EAA Board of Directors approved a contract with the FWS for a Long-Term Refugia Operation, effective January 1, 2017. The contractor was to begin capturing seven different endangered species from their current habitat and bringing them to the FWS San Marcos Aquatic Resource Center located in San Marcos, Texas (the primary off-site refugia), and Uvalde National Fish Hatchery, located in Uvalde, Texas (the secondary off-site refugia).
During 2017, the FWS initiated hiring the necessary staff to perform refugia operations (husbandry, propagation, research), collect contractually required amounts of HCP covered species, and commence the design and construction of the EAA physical infrastructure used to house the HCP covered species. Construction is under way and expected to be completed in 2018. Primary long-term refugia populations are fully established for Texas wild rice, San Marcos salamanders, and fountain darters from the San Marcos River, and target numbers of fountain darters from the Comal River will likely be reached in 2018. Achieving target numbers for the other species will take at least several more years.
Details of the Salvage Refugia Research Plan are presented in the 2016 HCP Annual Report (Blanton and Associates, 2015, App. K2), along with summaries of the numbers of each species that have been collected and the research findings on the biology and life history of several of the covered species.
This M&M measure does not directly address any of the specific biological goals and objectives, but it serves as a potential safety net backing up all of them. The extent to which reintroduction would be successful is unknown and likely varies among species. Research conducted under this measure may inform ecological models for various covered species. Despite its inherent limitations, the Committee considers this M&M measure to be effective. To the extent possible, refugia populations should continue to be maintained in more than one location to reduce the risk of complete loss. Texas wild rice produces recalcitrant seeds that do not survive the desiccation necessary for conventional seed bank storage, but refugia personnel do maintain a bank of seeds on a rolling basis. Seeds are collected regularly and stored for six months, then used to grow new plants. Cryopreservation is a feasible alternative method of long-term propagule preservation for Texas wild rice (Walters et al., 2002). Currently, cryogenic storage is not being used for Texas wild rice propagules, but it could be considered. The refugia program serves as much more than an insurance policy for the listed species; applied research under this program is the primary means to discover more information about the life histories of these organisms that can inform future management and should be continued.
CONCLUSIONS AND RECOMMENDATIONS
The flow protection measures will be effective in meeting the flow component of the biological objectives for all listed species. Throughout the 2014 drought during which both VISPO and Critical Period Management Stage IV and V restrictions were triggered, spring flows remained above threshold levels. Recent validation of the MODFLOW model during a drought period suggests that the model conservatively estimates both indicator-well levels and minimum spring flows, particularly at low flows. The model predicted that triggering of the four spring-flow protection measures would prevent simulated flows from going below the minimum HCP flow requirements during the Drought of Record. The rating for flow protection measures will move toward highly effective if results of the uncertainty analysis show that the errors are low or if model improvements continue to demonstrate that the model is biased low (i.e., conservatively underestimates well levels and spring flows).
The water quality protection measures, focusing primarily on stormwater control, will be somewhat effective in meeting the water quality component of the biological objective for fountain darters in the Comal and San Marcos stream systems. This assessment is based on whether the measures, many of which have yet to be implemented, are likely to keep water quality from further degrading or to improve water quality. The rating of somewhat effective is based on the difficulty in determining the effectiveness of SCMs as well as the uncertainty in how many projects will be implemented. Of the many suggestions given for how to improve the rating, the most important are tracking project implementation and functioning. There should be formalized project tracking to help with prioritization and success rates.
The SAV restoration measures, including the replanting of Texas wild rice, will be effective in meeting the habitat component of the biological objective for Texas wild rice and fountain darters. These measures have been in place since 2013 and have seen incremental and positive progress in moving the systems from being dominated by nonnative SAV, such as Hydrilla and Hygrophila, to housing a variety of native SAV species. Removal of nonnative SAV has reduced fountain darter habitat, but this was a known consequence and future plantings of native SAV combined with expanded areas should compensate. The planting program for Texas wild rice has been particularly successful. The ratings could move to highly effective if there were less reliance on intensive planting efforts and less dependence on bryophytes as fountain darter habitat in the Comal system.
The recreational management measures will be effective in meeting the habitat component of the biological objectives for the San Marcos salamander and Texas wild rice. Establishment of permanent river-access points is complete, including terraces and walls to stabilize the riverbank and facili-
tate river access by the public. Native vegetation has been planted between permanent access points to eliminate public access in these areas. Exclusion areas within the San Marcos River have been actively implemented and maintained when low-flow conditions occur, and substantial outreach efforts have been undertaken to ensure compliance by recreational users. Actions to improve the rating include enrollment of all outfitters in the COI program; better control of recreational access to the 50-meter stream reach immediately below the spillway; and sustaining, enforcing, and monitoring the suite of actions currently in place.
The Committee is unable to determine whether riparian management measures will contribute to achieving the biological objectives of the CSRB. This is due to a lack of quantitative monitoring of the riparian restoration efforts to show that they are preventing siltation of adjacent springs, as well as to the substantial maintenance requirements of erosion control structures. There is the potential for negative effects of nonnative plant removal and replanting activities, such as increased sedimentation of spring substrates. For the other riparian restoration activities (e.g., bank stabilization) in both systems that do not directly affect CSRB habitat, site visits and observations suggest that riparian restoration is effective for reducing erosion and sedimentation that might inhibit the growth of SAV and for supporting recreation management by funneling people to permanent access points.
The refugia is effective in supporting the biological goals and objectives of the listed species. Excellent progress has been made in establishing refugia populations of the listed species, and applied research conducted in conjunction with the program has already substantially increased the knowledge base for several of the species. Actions to support continued success include sustained maintenance of populations in more than one location, exploration of methods for long-term preservation of Texas wild rice propagules, and continued development of a vigorous applied research program.
REFERENCES
Alan Plummer Associates, Inc. 2017. City of New Braunfels: Edwards Aquifer Habitat Conservation Plan Impervious Cover and Water Quality Protection—5.7.6 Water Quality Protection Plan, Phase I. Report. May 4.
Arthur, J. D., A. A. Dabous, and J. B. Cowart. 2005. Water-rock geochemical considerations for aquifer storage and recovery: Florida case studies. Pp. 327-339 in Underground Injection Science and Technology, Developments in Water Science, vol. 52, C.-F. Tsang and J. A. Apps (eds.). Amsterdam: Elsevier.
Arthur, J. D., A. A. Dabous, and C. C. Fischler. 2007. Aquifer storage and recovery in Florida: Geochemical assessment of potential storage zones. Pp. 185-197 in Management of Aquifer Recharge for Sustainability, P. Fox (ed.). Phoenix, AZ: Acacia.
Beater, M. M. T., R. D. Garner, and E. T. F. Witkowski. 2008. Impacts of clearing invasive alien plants from 1995 to 2005 on vegetation structure, invasion intensity and ground cover in a temperate to subtropical riparian ecosystem. South African Journal of Botany 74:495-507.
Beaty, W. V. 1975. Texas wildrice. Texas Horticultural Society 2:9-11.
Bell, C. D., , S. K. McMillan, S. M. Clinton, and A. J. Jefferson. 2016. Hydrologic response to stormwater control measures in urban watersheds. Journal of Hydrology 541:1488-1500.
Best, E. P. 1984. Models on metabolism of aquatic weeds and their application potential. Pp 254-273 in Aquatic Weeds: The Ecology and Management of Nuisance Aquatic Vegetation, A. H. Pieterse and K. J. Murphy (eds.). Oxford, UK: Oxford University Press.
BIO-WEST. 2016. Year One Report. Evaluation of the Life History of the Comal Springs Riffle Beetle from Egg to Adult: Phase I. EAHCP Project No. 147-15-HCP. December 21.
BIO-WEST and Watershed Systems Group, Inc. 2016. Submerged Aquatic Vegetation Analysis and Recommendations. Edwards Aquifer Habitat Conservation Plan. Contract No. 15-7-HCP.
Blanton and Associates. 2015. Edwards Aquifer Habitat Conservation Plan. 2014 Annual Report. http://eahcp.org/documents/EAHCP%202014%20Annual%20Report.pdf.
Blanton and Associates. 2016. Edwards Aquifer Habitat Conservation Plan. 2015 Annual Report. http://eahcp.org/documents/EAHCP%202015%20Annual%20Report%20Final.pdf.
Blanton and Associates. 2017. Edwards Aquifer Habitat Implementation Plan. 2016 Annual Report. http://eahcp.org/documents/EAHCPAnnualReport2016.pdf.
Blanton and Associates. 2018. Edwards Aquifer Habitat Conservation Plan. 2017 Annual Report. http://www.eahcp.org/files/admin-records/NEPA-and-HCP/EAHCPAnnualReport2017_(1).pdf.
Brown, R. A., and M. Borst. 2014. Evaluation of surface and subsurface processes in permeable pavement infiltration trenches. Journal of Hydrologic Engineering 20(2):04014041-12.
Davis, A. P. 2005. Green engineering principles promote low-impact development. Environmental Science & Technology 39:338A-344A.
EARIP (Edwards Aquifer Recovery Implementation Program). 2012. Edwards Aquifer Recovery Implementation Program Habitat Conservation Plan. http://www.eahcp.org/files/uploads/Final%20HCP%20November%202012.pdf.
Emerson, C. H., C. Welty, and R. G. Traver. 2005. Watershed-scale evaluation of a system of storm water detention basins. Journal of Hydrological Engineering 10(3):237-242.
Emery, W. H. P. 1967. The decline and threatened extinction of Texas wild rice (Zizania texana Hitchc.). Southwestern Naturalist 12(2):189-205.
Emery, W. H. P. 1977. Current status of Texas wild rice (Zizania texana Hitchc.). Southwestern Naturalist 22(3):389-406.
Filoso, S., S. M. Smith, M. R. Williams, and M. A. Palmer. 2015. The efficacy of constructed stream–wetland complexes at reducing the flux of suspended solids to Chesapeake Bay. Environmental Science & Technology 49(15):8986-8994.
Fletcher, T. D., H. Andrieu, and P. Hamel. 2013. Understanding, management and modelling of urban hydrology and its consequences for receiving waters: A state of the art. Advances in Water Resources 51:261-279.
Furl, C. 2017. Conservation Measures → Biological Objectives → Biological Goals. Presentation to the National Academies’ Committee to Review the Edwards Aquifer Habitat Conservation Plan. October 2.
Geosyntec Consultants and Wright Water Engineers, Inc. 2009. Urban stormwater BMP Performance Monitoring. Washington, DC: U.S. Environmental Protection Agency. http://www.bmpdatabase.org/Docs/2009%20Stormwater%20BMP%20Monitoring%20Manual.pdf.
Halff Associates, Inc. 2010. Initial Study on the Recreational Impacts to Protected Species and Habitats in the Comal and San Marcos Springs Ecosystems. November 3. http://earip.org/Reports/10-0930-Final-Report-b.pdf.
Hamel, P., E. Daly, and T. D. Fletcher. 2013. Source-control stormwater management for mitigating the impacts of urbanisation on baseflow: A review. Journal of Hydrology 485:201-211.
Hamilton, M., and J. Boenig. 2017. Re-conceptualizing the Edwards Aquifer Authority Recharge Program: Staff Recommendations to Optimize and Protect the Edwards Aquifer. EAA Technical White Paper. 19 pp.
HDR Engineering, Inc. 2011. Evaluation of Water Management Programs and Alternatives for Springflow Protection of Endangered Species at Comal and San Marcos Springs. Report No. 12-01. Edwards Aquifer Authority
Hood, M. J., J. C. Clausen, and G. S. Warner. 2007. Comparison of stormwater lag times for low impact and traditional residential development. Journal of the American Water Resources Association 43(4):1036-1046.
John Gleason LLC. 2017. Water Quality Protection Plan for the City of San Marcos and Texas State University. Prepared for the City of San Marcos and Texas State University. January 1.
Knight, M. A., and G. B. Pasternack. 2000. Sources, input pathways, and distributions of Fe, Cu, and Zn in a Chesapeake Bay tidal freshwater marsh. Environmental Geology 39(12):1359-1371.
Leisenring, M., J. Clary, and P. Hobson. 2014. International Stormwater Best Management Practices (BMP) Database Pollutant Category Statistical Summary Report: Solids, Bacteria, Nutrients, and Metals. Geosyntec Consultants, Inc. and Wright Water Engineers, Inc.
Liu, A., N. Troshanov, J. Winterle, A. Zhang, and S. Eason. 2017. Updates to the MODFLOW Groundwater Model of the San Antonio Segment of the Edwards Aquifer. Edwards Aquifer Authority.
Livingston, E. H. 2000. Lessons learned about successfully using infiltration practices. Pp. 81-96 in National Conference on Tools for Urban Water Resource Management and Protection. EPA/625/R-00/001. Washington, DC: U.S. Environmental Protection Agency.
Loperfido, J. V., G. B. Noe, S. T. Jarnagin, and D. M. Hogan. 2014. Effects of distributed and centralized stormwater best management practices and land cover on urban stream hydrology at the catchment scale. Journal of Hydrology 519:2584-2595.
Lui, Y., V. F. Bralts, and B. A. Engel. 2015. Evaluating the effectiveness of management practices on hydrology and water quality at watershed scale with a rainfall-runoff model. Science of the Total Environment 511:298-308.
NASEM (National Academies of Sciences, Engineering, and Medicine). 2017. Review of the Edwards Aquifer Habitat Conservation Plan: Report 2. Washington, DC: The National Academies Press.
NRC (National Research Council). 2009. Urban Stormwater Management in the United States. Washington, DC: The National Academies Press.
Pasternack, G. B., and G. S. Brush. 1998. Sedimentation cycles in a river-mouth tidal freshwater marsh. Estuaries 21(3):407-415.
Pasternack, G. B., W. B. Hilgartner, and G. S. Brush. 2000. Biogeomorphology of an upper Chesapeake Bay river-mouth tidal freshwater marsh. Wetlands 20(3):520-537.
Pence, N. 2018. Impervious Cover/Water Quality Protection, LID and Sediment Removal. Presentation to the National Academies Committee to review the Edwards Aquifer Habitat Conservation Plan. January 4.
Roy, A. H., S. J. Wenger, T. D. Fletcher, C. J. Walsh, A. R. Ladson, W. D. Shuster, H. W. Thurston, and R. R. Brown. 2008. Impediments and solutions to sustainable, watershed-scale urban stormwater management: Lessons from Australia and the United States. Environmental Management 42:344-359.
Schlaepfer, M. A., D. F. Sax, and J. D. Olden. 2011. The potential conservation value of nonnative species. Conservation Biology 25:428-437.
SWCA Environmental Consultants. 2014. Edwards Aquifer Habitat Conservation Plan, 2013 Annual Report. USFWS Permit No. TE63663A-0. http://eahcp.org/documents/FINAL_2013_EAHCP_Annual_Report.pdf.
STAC (Scientific and Technical Advisory Committee of the Chesapeake Bay Program). 2010. Small Watershed Monitoring Designs. STAC 10-004. http://www.chesapeake.org/pubs/232_D.E.Weller2010.pdf.
Strecker, E. W., M. M. Quigley, B. R. Urbonas, J. E. Jones, and J. K. Clary. 2001. Determining urban storm water BMP effectiveness. Journal of Water Resources Planning and Management 127:144-149.
Terrell, E. E., W. H. P. Emery, and H. E. Beaty. 1978. Observations on Zizania texana (Texas Wildrice), an Endangered Species. Bulletin of the Torrey Botanical Club 105(1):50-57.
Toran, L. 2016. Water level loggers as a low-cost tool for monitoring of stormwater control measures. Water 8(8):346.
Vitule, J. R. S., C. A. Friere, D. P. Vazquez, M. A. Nuñez, and D. Simberloff. 2012. Revisiting the potential conservation value of non-native species. Conservation Biology 26:1153-1155.
Vogel, J. R., T. L. Moore, R. R. Coffman, S. N. Rodie, S. L. Hutchinson, K. R. McDonough, A. J. McLemore, and J. T. McMaine. 2015. Critical review of technical questions facing low impact development and green infrastructure: A perspective from the Great Plains. Water Environment Research 87(9):849-862.
Walsh, C. J., A. H. Roy, J. W. Feminella, P. D. Cottingham, P. M. Groffman, and R. P. Morgan. 2005. The urban stream syndrome: Current knowledge and the search for a cure. Journal of the North American Benthological Society 24(3):705-723.
Walsh, C. J., D. B. Booth, M. J. Burns, T. D. Fletcher, R. L. Hale, L. N. Hoang, and A. Wallace. 2016. Principles for urban stormwater management to protect stream ecosystems. Freshwater Science 35(1):398-411.
Walters, C., D. H. Touchell, P. Power, J. Wesley-Smith, and M. F. Antolin. 2002. A cryopreservation protocol for embryos of the endangered species Zizania texana. Cryoletters 23:291-298.
Winterle, J. 2018. Updates to the MODFLOW Groundwater Model of the San Antonio Segment of the Edwards Aquifer. Presentation to the National Academies Committee to Review the Edwards Aquifer Habitat Conservation Plan. January 4.


