
5
Use of OST in a Changing Climate
Future climate conditions are likely to affect water supply operations for New York City. Changes in the seasonality, frequency, duration, type (rain vs. snow), and magnitude of precipitation events and their effects on streamflow in the Catskill and Delaware watersheds over the last several decades have been detected in observational data to varying degrees. To adapt to future changes in precipitation and streamflow patterns, the New York City Department of Environmental Protection (NYC DEP) and other water utilities need statistical methods, simulation modeling, and other analytical tools to help them assess trends over recent decades, project a range of possible future conditions, and estimate impacts of these future conditions on water quantity and water quality, most notably turbidity in the case of New York City’s system. A systematic, quantitative approach to analysis of longer-term changes at the watershed scale, including changes in climate patterns, will provide NYC DEP with a transparent evidence base to support risk-based decisions on future capital needs, modifications of existing infrastructure, watershed protection measures, and changes in operating rules to control storage, flows, and turbidity. Examples of climate-relevant decisions for the NYC DEP in the context of this study include determination of reservoir storage needs, planning for provision of flows to the Delaware River, and determination of the feasibility of OST-informed operations including the use of alum to meet turbidity and system reliability goals.
With these purposes in mind, this chapter assesses whether OST in its current configuration can continue to be used operationally as climate conditions change. It also discusses how OST, when used in simulation mode,
can be applied effectively to assess vulnerabilities in the New York City water supply system that may arise from future climate change.
OBSERVATIONS OF A CHANGING CLIMATE: IMPACTS ON CATSKILL AND DELAWARE WATERSHEDS IN CONTEXT
The broader context for the use of OST under changing climate conditions is the understanding from global and national assessments that hydrology and water resources have been and will be affected significantly by climate change. These broader-scale assessments suggest that the New York City water supply system will experience changing hydrologic conditions under a changing climate, although with large uncertainties about the effects and their direction (wetter vs. drier), magnitude, duration, and seasonal timing.
This section begins by briefly summarizing major findings and their uncertainties regarding observed hydrologic changes at global and national scales, mainly from the Intergovernmental Panel on Climate Change (IPCC) and the National Climate Assessment (NCA) Northeast chapter1 (Horton et al., 2014). This broad-scale summary is followed by an overview of observations of precipitation and streamflow trends specific to the Northeast region of the United States and the Catskill and Delaware watersheds in particular.
Larger-Scale Observed Trends
The IPCC Fifth Assessment Report (AR5) finds that climate change is already having significant effects on the hydrologic cycle at both global and regional2 scales (IPCC, 2013, 2014). There is observational evidence
___________________
1 Major assessments such as those conducted by the IPCC and the U.S. Global Change Research Program (USGCRP) report their findings as well as information about the robustness of the findings. IPCC authors provide levels of evidence and agreement for each of the major assessment statements (Stocker et al., 2013). Available evidence is described as limited, medium, or robust and degree of agreement as low, medium, or high. Confidence in the validity of a finding is based on the type, amount, quality, and consistency of evidence (e.g., mechanistic understanding, theory, data, models, and expert judgment) and the degree of agreement. Evidence is most robust when there are multiple consistent independent lines of evidence of high quality. The U.S. NCA provides traceable accounts for its key messages (see USGCRP, 2017, ch. 3, Supplemental Material, for those related to water resources). For each key message, the evidence base, role of new information, and remaining uncertainties are described, and a level of confidence assigned as low, medium, high, or very high. New York State ClimAID and New York Panel on Climate Change (NPCC) reports follow similar guidelines.
2 For information about IPCC AR5 regional analyses, see WGII AR5, ch. 21, Regional Context (Hewitson et al., 2014). See also http://www.ipcc-data.org/guidelines/pages/ar5_regions.html.
that in regions across the globe with snowfall, climate change has altered streamflow seasonality. Except in very cold regions, warming in the last decades has tended to reduce the spring maximum snow depth and brought forward the spring maximum of snowmelt discharge. (Note that these findings do not specifically address risks and benefits to watersheds within the New York City water supply system.) With regard to observed trends in floods, however, the IPCC states: “there continues to be a lack of evidence and low confidence regarding the sign of trend and magnitude and/or frequency of floods at a global scale” (Stocker et al., 2013). Further, there is little or no observational evidence at global and regional scales and only medium agreement that soil erosion and sediment loads have been altered significantly due to change climate.
Focusing on the United States, the NCA analyzed current and projected changes in the water cycle and how a changing climate may affect water resources use and management for the regions of the country (Georgakakos et al., 2014). The NCA found, with high confidence, that annual precipitation and river-flow increases have been observed in the Midwest and Northeast regions of the United States, and that very heavy precipitation events have increased nationally. Formal attribution approaches, however, have not established a significant connection between increased riverine flooding and human-induced climate change.
Observed Trends in Regional and Local Extreme High Precipitation and Streamflow
Several assessments, including some by the NYC DEP, and individual studies have analyzed observed hydrologic changes for the specific area of the New York City water supply watershed; these assessments also include projections of future trends. Examples include the Union of Concerned Scientists’ Confronting Climate Change in the Northeast (Frumhof et al., 2007; Hayhoe et al., 2007); the Northeast chapter of the NCA (Horton et al., 2014); the ClimAID Integrated Assessment for Effective Climate Change Adaptation in New York State (Horton et al., 2011); the New York City Panel on Climate Change (2015); NYC DEP climate change assessments (NYC DEP, 2008; 2013); and the Metro East Coast Study (Major and Goldberg, 2001).
Recent analyses of extreme hydrologic events across the United States show that extremely large precipitation events are increasing over much of the country, with particularly steep trends over the northeastern United States (Frei et al., 2015; Huang et al., 2017). Findings of these and other recently published studies specifically related to analysis of historical precipitation and streamflow observational data from the Northeast are summarized in Table 5-1. Note that “extreme” is defined differently in these
TABLE 5-1 Observed Regional-to-Local Trends in Precipitation and Streamflow
| Hydrological Variable | Description | Spatial Scale | Period of Analysis | Direction of Change | Reference |
|---|---|---|---|---|---|
| PRECIPITATION | |||||
| Mean annual total precipitation | — | Northeast region | 1901–2014 | Increasinga | Huang et al., 2017 |
| 1979–2014 | Increasinga | ||||
| Extreme precipitation | Amount of precipitation falling on the 1% of wet days recording the most precipitation | Northeast region | 1901–2014 | Increasinga | Huang et al., 2017 |
| 1979–2014 | Increasinga | ||||
| Mean and total precipitation | Regional mean total daily precipitation for annual, warm (June–October), and cold (November–May) seasons | Northeast region | 1948–2011 | Warm-season precipitation increased after 2002 prior to which a secondary peak occurred in 1970s; cold season remained relatively flat after around 1970 despite high interannual variability | Frei et al., 2015 |
| Annual and seasonal precipitation | Annual, winter (December–February) and summer (June–August) precipitation (mm/decade) | Northeast region | 1900–1999 | Annual – Increasingb Winter – Decreasingb Spring – Increasingb | Hayhoe et al., 2007 |
| 1970–2000 | Annual – Decreasingb Winter – Increasingb Spring – Decreasingb | ||||
| Extreme precipitation | Extreme high annual and warm-season (June–October) precipitation; events greater than or equal to the 95th percentile | Southern New York State | Variable depending on station; range of 55–121 years | Marked increase during last two decades with accelerated rate of increase since the mid-1990sc | Matonse and Frei, 2013 |
| Hydrological Variable | Description | Spatial Scale | Period of Analysis | Direction of Change | Reference |
|---|---|---|---|---|---|
| STREAMFLOW | |||||
| Extremely large 1-, 4-, 7-day mean annual, warm (June–October), and cold (May–November) season streamflow | Frequency of extreme streamflow events | Northeast region | 1963–2011 | More frequent high annual streamflow extremes in 1970s and maximum frequency in 2000s. | Frei et al., 2015 |
| Mean magnitude of extreme events | During warm season, magnitudes were 10-40% higher in the 2000s than during the 1980s; cold-season values peaked during the 1970s and 1980s; thus warm-season magnitudes of extreme hydrologic events were greater in the last two decades than during previous decades. | ||||
| Low flow | Streamflow 7-day low-flow amount (%/decade) | Northeast region | 1950–1999 | Increasingb | Hayhoe et al., 2007 |
| 1970–2000 | Decreasingb | ||||
| Annual and warm-season streamflow magnitude and frequency | Annual and warm-season (June October) streamflow events | Southern New York State | Variable depending on gauge; range 53–75 years | Streamflow events were larger in the 1950s and 1960s, smallest during the 1970s and 1980s, and have increased to their highest magnitudes on record in recent decades.c | Matonse and Frei, 2013 |
aStatistical significance at p < 0.05.
bAnnual and seasonal precipitation trends for the entire region were calculated using monthly USHCN data; level of statistical significance not reported.
cParametric results of regional mean peak streamflow frequency estimates from five overlapping 30-yr periods reveal an increasing pattern in flood flows from the 1970s to 1990s for all return periods, in particular for flow magnitudes of return periods of 25 years or greater. Nonparametric analysis demonstrated that extreme warm season hydrological events were more frequent in the region during the last decade than at any time on record.
studies, but in all cases discussed here refers to large rainfall events or high streamflow—the “right-side tails” of frequency distributions. For example, a common definition of “extreme” used in some of these studies is a magnitude or frequency of an event above the 95th or 99th percentile.
Huang et al. (2017) found that spatially averaged, both annual total and extreme precipitation across the Northeast increased significantly between 1901 and 2014. Frei et al. (2015) demonstrated that the increase in extreme hydrologic events over the Northeast region is primarily a warm-season phenomenon and is caused more by an increase in frequency than magnitude.
Similar trends in extreme high-precipitation events have been found at more local scales, some of which are summarized in Table 5-1. A recent analysis in southern New York State found that there has been a marked increase in the frequency of warm-season (June–October) extreme high hydrologic events in the mid-Hudson Valley and Catskill regions during the last two decades, with an accelerated rate of increase since the mid-1990s (Matonse and Frei, 2013). Peak snowmelt in the Catskills region (1952–2005) represented by stream runoff volume generally shifted from early April at the beginning of the record to late March at the end of the record, consistent with a decreasing trend in April runoff and an increasing trend in maximum March air temperature (Burns et al., 2007). The Committee undertook its own trend analysis for seven locations within the Catskills and found an increasing trend in mean discharge for the summer months as well as the one-day maximum in the summer months, as described in Appendix A.
The causes of the increasing frequency of extreme high hydrologic events in the region are uncertain, and it is unclear whether this recent increase is part of a trend that will continue or a short-term fluctuation. It is consistent, however, with an increase in the frequency of extreme high precipitation events in the northeastern United States as indicated by the National Oceanic and Atmospheric Administration (NOAA) climate extremes index3 and global projections based on climate models (Kunkel et al., 2013).
Observations of Regional and Local Droughts
The NYC DEP considers the drought that occurred in the region during the early to mid-1960s to be the “drought of record.” Since the 1960s, droughts have been in abeyance in the region. A tree-ring study published in the 1970s (Cook and Jacoby, 1977) found that the 1960s drought was the most severe episode in terms of both intensity and duration for the past 241 years. Seager et al. (2012) found the 1960s drought to be associated
___________________
3 See noaa.gov/extremes/cei/graph/ne, June 2017.
with internal atmospheric variability, rather than anthropogenic alterations to the climate system. However, six water emergencies since 1981 have been declared for the New York City (NYC) region despite the prevailing wet conditions, substantial conservation of water since 1979, and meteorological data showing little severe or extreme drought since 1970 (Pederson et al., 2013). Recent experience in the NYC watershed region has been that flows in the dryer seasons of the year, primarily the summer months, have been increasing rather than decreasing, such that droughts do not appear to be intensifying in this region (see Appendix A).
Pederson et al. (2013) caution that the recent increasing trends in warm-season precipitation and streamflow may lull decision makers into lack of adequate preparation for drier conditions. Through tree-ring analysis spanning 500 years, the authors conclude that the 20th century and the sustained and repeated pluvial events over the last 43 years mask the potential for severe and significant drought in the greater NYC region with concurrent implications for its water supply. They urge that NYC’s water supply systems be viewed as vulnerable to severe and potentially frequent drought, and suggest that preparation for drought be part of the management of the region’s currently abundant water resources.
GLOBAL- AND REGIONAL-SCALE PROJECTIONS OF CLIMATE CHANGE
For purposes of providing context for considering impacts of climate change on the NYC water supply and specifically OST’s applicability, this section summarizes some of the salient conclusions from recent global, regional, and more localized studies of future climate impacts. It is important to distinguish these projections, which are made at various scales with varying relevance to the NYC watershed, from the recent observations previously discussed.
Larger-Scale Projected Changes
According to the IPCC, climate change impacts on the hydrologic cycle at both global and regional scales are projected to continue and intensify in the coming decades (IPCC, 2013, 2014). In particular, the freshwater-related risks of climate change are projected to increase significantly with increasing greenhouse gas (GHG) concentrations (Jiménez Cisneros et al., 2014). In regions with snowfall, the alterations in streamflow seasonality that have already been observed are expected to increase. Increases in heavy rainfall and temperature are projected to change soil erosion and sediment yield, although the extent of these changes is highly uncertain depending on rainfall seasonality, land cover, and soil management practices.
The NCA found that water resources managers and planners in most U.S. regions will encounter new risks, vulnerabilities, and opportunities that may not be properly managed within their existing practices. Very heavy precipitation events are projected to increase in all regions with high confidence. The NCA assigned medium confidence to the potential for increased risks of flooding in many basins in the United States and high confidence for intense precipitation events and riverine flooding posing growing challenges in the Northeast (Horton et al., 2014; Wehner et al., 2017). The NCA stresses that the timing of any emergence of a future detectable anthropogenic change in flooding is unclear, and that future changes in flood frequencies and intensities will depend on a complex combination of local-to-regional influences and the conditions in each catchment, such as topography, land cover, and management.
With regard to drought, medium-high confidence was assigned to the finding that short-term (seasonal or shorter) droughts are expected to intensify. The NCA emphasized that climate change is expected to affect water demand and the ways that water is used within and across regions and economic sectors.
Projections at Regional and Local Scales
Regional studies, including those of the Northeast chapter of the NCA, have found that river flooding is projected to pose a growing challenge to the region’s environmental, social, and economic systems (Horton et al., 2014). Increased temperature, reduced winter snow seasons, and short-term droughts are also expected to occur in the Northeast over the next century according to the Union of Concerned Scientists’ regional assessment (Frumhoff et al., 2007; Hayhoe et al., 2007). In a more recent Northeast study, Demaria et al. (2016) applied a multiple global climate model (GCM) ensemble and statistical downscaling and found that streamflows are projected to increase in the 21st century, while low flows are projected to be less pronounced, especially under a higher GHG emissions scenario. These projections of streamflow conditions into the future are in agreement with the trends that have been observed in the past few decades (see Appendix A).
A considerable body of work has addressed how future climate change would affect water resources specifically for New York City, starting in 2001 with the Metro East Coast Assessment (Major and Goldberg., 2001), and continuing with studies by NYC DEP (2008; 2013), Matonse et al. (2013), Mukundan et al. (2013), and Pradhanang et al. (2013). These studies utilized downscaled projections of future temperature and precipitation from GCMs to drive hydrologic models to determine impacts to streamflow and other factors. GCMs, downscaling techniques, and associated hydrologic watershed models (HWMs) are described in detail in Appendix B.
Table 5-2 summarizes the major projected changes in hydrologic components for the New York City watershed due to climate change. Pradhanang et al. (2013) studied streamflow and found that earlier snowmelt and reduced snowpack would advance timing and increase the magnitude of discharge in winter and early spring (November to March) and decrease it later in the spring. Matonse et al. (2013) projected more runoff during winter, increased spring and summer evapotranspiration, and decreased days of drought. The results for the West of Hudson portion suggest that future climate change will impact regional hydrology on a seasonal basis. Makundan et al. (2013) found an increase in the annual rate of soil erosion, but not an increase in sediment yield at the water outlets, with effects most significant in winter due to a shift in the timing of snowmelt and a decrease in the proportion of precipitation received as snow.
The NYC DEP (2013) Integrated Modeling Study, which utilized some components of the OST, found strong effects in timing of spring snowmelt and peak flows with turbidity loads increasing in fall and winter. Findings indicated that the timing of the spring snowmelt is predicted to shift from a distinct peak in late March and April to being more evenly distributed throughout the winter and fall due to increased temperatures causing less precipitation to fall as snow, decreased snow accumulation, and earlier snowmelt. Turbidity is projected to increase in the fall and winter and decrease in the spring.
Many but not all of these studies found that drought may be less prevalent in the region in the future, based on the range of downscaled GCMs included. This is because many of the GCM scenarios predict an increase in precipitation throughout the year, which compensates for the loss of snow water storage and increased evapotranspiration due to higher temperatures. The Metro East Coast Assessment did project the potential for increasing droughts in the New York City watershed region (Major and Goldberg, 2001), as did the ClimAID study, which concluded that there was potential for increasing late warm-season droughts throughout New York State (Horton et al., 2011). These two studies also raised the potential for the combination of droughts and sea level rise to cause salt fronts to encroach upon the Hudson River and threaten the water supply of neighboring jurisdictions and New York City’s emergency supply.
IMPROVING THE UTILITY OF OST FOR CONTINUED USE AS AN OPERATIONAL DECISION SUPPORT TOOL
Traditional water utility projections of temperature, precipitation, and streamflow have largely been based on the assumption that past conditions are a good representation of future conditions. However, an abundance of evidence strongly suggests that conditions are likely to change in the future,
TABLE 5-2 Projected Changes in New York City Watershed Components Due to Climate Change
| Variable | Projected Change Time of Year | Timeslice(s) | Number of GCMs, Emissions Scenarios, Downscaling Method | HWMs | Reference |
|---|---|---|---|---|---|
| Snowmelt | Earlier | 2081–2100 | 9 GCMs, Change factor method | SWAT-WBa | Pradhanang et al., 2013 |
| Earlier | 2046–2065 2081–2100 | 3 GCMs, Delta method | GWLF-VSAb | Matonse et al., 2013 | |
| Streamflow | Increase November–March, decrease April | 2081–2100 | 9 GCMs, Change factor method | SWAT-WBa IHAc | Pradhanang et al., 2013 |
| Streamflow | Positive trends in 3-day peak flows; decrease in magnitude of 7-day low flows and mean base flows; length of low-flow season likely to extend by mid-century despite increased precipitation as atmospheric demand increases | 2028–2082 | 16 GCMs, 2 Emission scenarios, Quantile-mapping approach | VICd | Demaria et al., 2016 |
| Runoff | Increase in winter, slight decrease in spring | 2046–2065 2081–2100 | 3 GCMs, 3 Emissions scenarios, Delta method | GWLF-VSAb | Matonse et al., 2013 |
| Droughts | More frequent | 2020s 2050s 2080s | 2 GCMs Delta method | PDSIe | Major and Goldberg, 2001 |
| Droughts | Short-duration warm season droughts more likely than not become more common; extreme multiyear droughts uncertain | 2020s 2050s 2080s | 16 GCMs, Delta method | PDSIe | Horton et al., 2011 |
| Floods | More frequent | 2020s 2050s 2080s | 2 GCMs, Delta method | PDSIe | Major and Goldberg, 2001 |
| Erosion | Increase in winter | 2081–2100 | 9 GCMs, Change factor method | SWAT-WBa | Mukundan et al., 2013 |
| Sediments | No significant change | 2081–2100 | 9 GCMs, Change factor method | SWAT-WBa | Mukundan et al., 2013 |
| Nutrients | Increase in winter and fall | 2046–2065 2081–2100 | 4 GCMs, Delta method | GWLF-VSAb UFI-PROTBASf CE-QUAL-W2g OASISh | NYC DEP, 2013 |
aSWAT-WB - A water balance-based version of the Soil & Water Assessment Tool.
bGWLF-VSA - Generalized Watershed Loading Function model, variable source area version.
cIHA - Indicators of Hydrologic Alteration model.
dVariable Infiltration Capacity model.
ePDSI - Palmer Drought Severity Index.
fUFI-PROTBAS - Upper Watershed Institute PROtech Based Algal Simulations.
gA two-dimensional, longitudinal/vertical, hydrodynamic and water quality model.
hOASIS - Options AnalysiS in Irrigation Systems.
a phenomenon known as “nonstationarity” (Milly et al., 2008; IPCC, 2013, 2014). There are ways in which OST and its inputs can be improved and utilized so that it can continue to be effective as a decision support tool even under changing climate conditions. In 2004, a report of the National Academies defined adaptive management as follows:
Adaptive management promotes flexible decision making that can be adjusted in the face of uncertainties as outcomes from management actions and other events become better understood. Careful monitoring of these outcomes both advances scientific understanding and helps adjust policies or operations as part of an iterative learning process. Adaptive management also recognizes the importance of natural variability in contributing to ecological resilience and productivity. It is not a “trial and error” process, but rather emphasizes learning while doing. Adaptive management does not represent an end in itself, but rather a means to more effective decisions and enhanced benefits. Its true measure is in how well it helps meet environmental, social, and economic goals, increases scientific knowledge and reduces tensions among stakeholders.
Adaptive management practices can help to improve water resources decision making under changing climate conditions, even in the face of population growth, changes in water demand, and land-use changes.
Regular Updates and Reanalysis of Trends in Climate and Streamflow Data
A key part of adaptive management is ongoing data collection and analysis to improve and update decisions. If OST is going to continue to be useful to the NYC DEP in a future characterized by changing climate conditions, it needs to be updated regularly with the latest climate and streamflow data. Furthermore, there needs to be ongoing reanalysis of the actual trends that are taking place. For example, the generation of ensemble forecasts by the Hydrologic Ensemble Forecasting System (HEFS) as an input to OST must be updated to track the changing climate. This involves examination of historical and recent data for evidence of changing climate conditions and the related effects on water resources, such as runoff. These relationships need to be embedded in OST and updated over time. At the time of this report, OST had not been routinely updated with the latest climate and streamflow data, nor had regular reanalyses of observed trends been undertaken. This is partly due to lack of data and analytical support from the National Weather Service. As discussed in Chapter 2, the lack of inclusion of recent (approximately the last two decades) climate information is a critical deficiency. Preparing for the impacts of future climate change must begin with an adequate representation of the contemporary climate.
Rigorous Comparison of Observed Data and Model Hindcast Simulations
Climate models linked to hydrologic models have been developed to project how water resource conditions may change in the future as a consequence of changing climate conditions (see Appendix B). These GCMs and regional climate models (RCMs) represent complex physical processes that govern Earth’s temperature and other climate variables. Hydrologic models use outputs of GCMs and RCMs to generate estimates of streamflow.
To build confidence in using selected GCMs, RCMs, and hydrologic models to project future water supply conditions in OST, the OST team needs to compare the observed climate and hydrology with climate and hydrology hindcast simulations at appropriate scales. As discussed in Chapter 2, hindcasting refers to the practice of establishing the skill of mathematical simulation models to replicate past conditions. It is done by utilizing the outputs of GCMs and RCMs forced by the history of greenhouse gas concentrations as inputs to hydrologic models, and then comparing the simulations of temperature, precipitation, and streamflow to the actual historical record of those variables, over the appropriate temporal and spatial scales.4
Hindcasting provides improved understanding of how well downscaled information from GCMs and RCMs represents regional climate and hydrology and the changes that are already underway. (Note that global mean CO2 concentrations have already risen by over 50 percent since the start of the industrial revolution and are understood to intensify the hydrological cycle, as warmer air can hold more water vapor, such that downpours are heavier.) Representation at finer spatial (e.g., watershed) and temporal (e.g., subdaily) scales of the NYC supply region is needed to improve the use of OST for climate change planning. Because understanding of how climate conditions may already be changing is crucial, it will be important to compare the trends in runoff characteristics with trends in hindcast simulations of the runoff characteristics over recent decades.
USING OST IN SIMULATION MODE TO BETTER PLAN FOR IMPACTS OF CLIMATE CHANGE ON THE NYC WATER SUPPLY
A considerable body of work on planning for climate change has been accomplished already by the NYC DEP and its partners. Preliminary versions of OST components have been used for climate change assessment for the NYC water supply by the NYC DEP Climate Change Integrated
___________________
4 GCMs are not expected to replicate year-by-year events or short-term trends nor finer-scale spatial scales than those at which they are parametrized (roughly 100 km). Rather, GCMs can be useful for exploring the dynamics of larger-scale climate processes such as the North Atlantic Oscillation. RCMs use GCM outputs to force finer-scale simulations that account for more detailed regional processes.
Modeling Project (CCIMP) Phases I and II. The use of OST in these and future studies will improve NYC DEP’s planning for climate change because OST incorporates the updated models and operational rules under which the water system is managed. Results of some of the completed studies have been summarized in the previous section on climate change impacts on the NYC watershed (e.g., Matonse and Frei, 2013; Matonse et al., 2013), but here the Committee elaborates further on methods used in recent studies and those that could be used in the future.
NYC DEP Climate Change Integrated Modeling Project
Since the NYC DEP’s Climate Change Plan’s release in 2008, the NYC DEP has utilized some components of OST in simulation mode for climate change studies (Owens and Frei, 2017). The CCIMP Phase I (concluded in 2013) consisted of a linked framework of GCM output, data inputs, and models that were used to predict streamflow, loadings, operations, and turbidity (see Figure 5-1). Different groups of researchers undertook modeling simulations of different parts of the framework. These included:
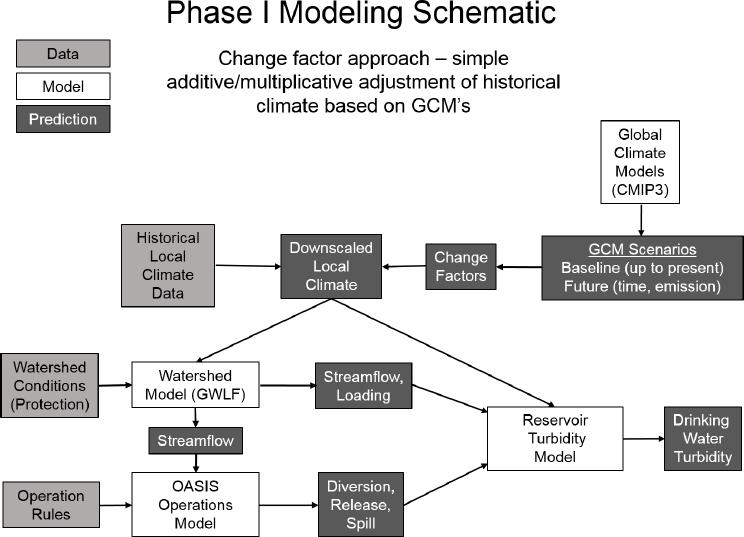
(1) prediction of future local climate based on the change factor approach (also referred to as the delta method) (Anandhi et al, 2011, 2013); (2) future climate scenarios used as input to the GWLF and SWAT watershed models to predict streamflows (Matonse et al., 2011; Mukundan et al., 2013); (3) future climate scenarios used as input to water quality models, with specified time series of reservoir operation (Samal et al., 2012; Pierson et al., 2013); and (4) predicted future streamflows used as inputs to OASIS (Matonse et al., 2013).
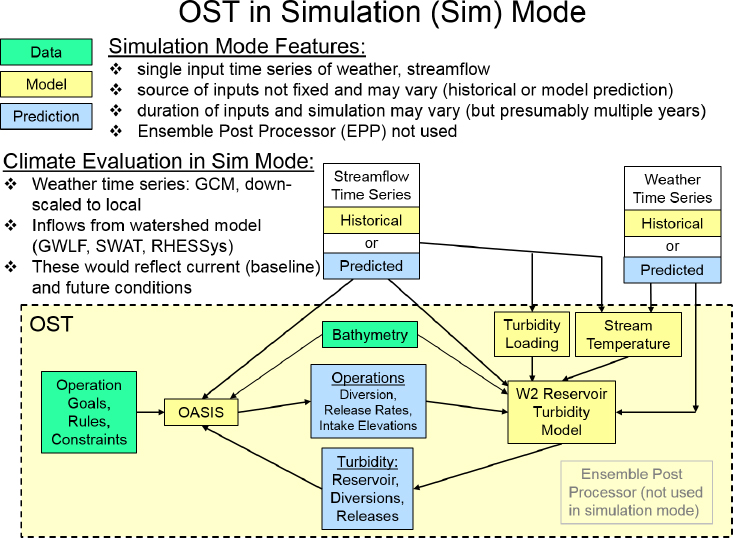
Phase II of the CCIMP improves on Phase I in several ways. OST is used with full implementation of its current operating rules and the W2 model (see Figure 5-2). According to Owens and Frei (2017), Phase II studies will focus on extreme events, using improved models and model linkages, and will make use of updated climate data and scenarios.
Approaches to Projecting Future Climate Conditions at a Watershed Scale
There are multiple, complementary approaches to projecting future changes in temperature, precipitation, and other climate variables. Com-
parisons among the approaches can yield a broader understanding of how climate change may affect the operation of the NYC water supply system on both near- and long-term timescales. These complementary approaches can be used to evaluate the potential impacts of climate change and adaptation strategies on the NYC water supply, including notably potential impacts of extreme high-precipitation events on turbidity. OST operated in simulation mode could be a crucial tool for use in this assessment process.
There are three approaches to generating climate inputs to OST, the first two of which are shown in Figure 5-2 and have been used or discussed by NYC DEP:
- Approach 1: GCMs, RCMs, and hydrological models. GCMs and RCMs provide precipitation and temperature projections, which are used as inputs to hydrologic models that in turn provide streamflow inputs to OST (the blue “predicted” streamflow time-series boxes in Figure 5-2).
- Approach 2: Historical and paleo-climate analogs. Historical records of streamflow and paleoclimate records such as tree rings are used to generate time-series projections of dryer and wetter periods (the yellow “historical” streamflow time-series boxes in Figure 5-2).
- Approach 3: Continuation of current conditions or trends. Observed conditions and/or trends in the watershed over different time periods are projected into the future to test the response of OST.
All three approaches are discussed in greater detail in the following section, including how current approaches could be improved. In addition, the use of sensitivity tests and stress tests, which are applicable to any of these approaches to generating climate projections, is discussed.
Approach 1: GCMs, RCMs, and Hydrologic Models
In Approach 1, GCMs and RCMs provide projections of precipitation and temperature, which are used as inputs to a hydrologic model that in turn provides streamflow inputs to OST. There are several ways that GCMs/RCMs and hydrologic models can be improved and/or more effectively used to facilitate Approach 1. These improvements address, in part, the uncertainties of GCMs/RCMs and hydrologic models described in Appendix B in the section on Limitations of Climate and Hydrologic Models.
Improvement of Model Processes. Several model processes within the overall integrated suite of models in OST could be improved. First, a key area for improvement is extreme precipitation events that occur on subdaily
timescales (Lenderink and Van Meijgaard, 2008) because heavy downpours on an hourly scale can be important for triggering turbidity events. Techniques should be developed to enable inclusion of intense subdaily precipitation in the OST simulations. Another area for improvement is vegetation. Climate and hydrologic models often assume that vegetation cover is static in time. Thus, changes in vegetation that affect albedo and runoff may not be realistically represented in the future. Interactive climate-vegetation models can be used to indicate how vegetation may change in the future due to climate change. Finally, formulation of CO2 effects on plant growth and stomatal conductance is another process that requires further research. Luo et al. (2013) have improved formulation of these processes in the SWAT model at watershed scales. Such model improvement will help to address the issue that parameter calibration may not be valid under different climatic conditions. NYC DEP should track advances in these areas and incorporate them into the OST suite of models, rather than making its own investments in research.
Use of Model Ensembles. Recent work combines multiple hydrologic models, climate models, and representative concentration pathways (RCPs) in ensemble approaches so that outcomes can be more explicitly characterized with regard to uncertainty, probability distributions, and weighting of scenarios based on likelihoods (e.g., Arnell and Gosling, 2013; Schewe et al., 2013; Haddeland et al., 2014; Horton et al., 2015). Using ensembles of climate and hydrologic models as drivers to OST analyses would enable climate change planning to be based on a better understanding of the range of potential impacts on supply and quality in the NYC watershed region.
Establishment of GCM Selection Criteria. Good practices for using GCM-generated projections as input to OST in simulation mode include establishing selection criteria for GCMs, model-based probability assessments, explicit characterization of uncertainties, and use of multimodel approaches. The NYC DEP has followed many of these practices in its climate change studies to date, and these should be continued and expanded using OST.
NYC DEP should develop explicit criteria for inclusion of GCMs in model ensembles, including such attributes as ability to adequately reproduce observed trends; representation of annual patterns of monthly mean temperature, precipitation, and runoff for the region and wetter and drier periods on a decadal basis; availability of daily outputs for variables important for hydrology for extreme-event analysis; and available model and application documentation. For example, see Demaria et al. (2016) for methods used to reduce uncertainty in future GCM projections by utilizing such selection criteria for the climate models used in regional studies.
Approach 2: Use of Climate Analogs
Climate analogs can be either historical records of streamflow or paleoclimate time series of tree rings or other climate-sensitive physical phenomena that can be related to past hydrologic conditions. Historical streamflow records in particular can be transformed into projections of future streamflow and used as input to OST, with the implication that future conditions will exhibit the same basic patterns as the past of high and low flows, frequency and magnitude of extreme events, and seasonal patterns. Paleoclimate analogs are often used as indicators of persistence of droughts or wet periods. A suite of analogs can be selected to represent observed periods of droughts, high precipitation, and high temperature to see how the water supply system as currently configured would respond.
A useful line of analysis for NYC DEP to pursue would be to compare the range of extreme events known to have occurred in the past to the range projected by process-based climate models, as was done for the Colorado River Basin (Groves et al., 2013). This comparison would enable NYC DEP and regional decision makers to gain an appreciation for the implications of these different assumptions about the range of future extreme events on water supply operations. The differences can be pronounced, with implications for future operations and investment decisions.
Approach 3: Continuation of Current Conditions or Trends
A third approach is to use current observed conditions or trends in the watershed, the latter derived from well-established statistical methods of trend analysis (such as the Mann-Kendall trend test and the Theil-Sen slope estimator), and project these into the future to test the response of OST. This can be done in two ways: (1) continuation of conditions such as the last few decades; or (2) continuation of current trends, so if, for example, streamflow has been increasing at 1 percent per year in recent years, continue that trend into the future. The advantage of this approach is that it captures the most up-to-date characteristics of streamflow or other variables without being dependent on the many modeling assumptions inherent in the climate and hydrologic modeling process. A disadvantage of this approach is that such estimates of observed trends are highly uncertain, although they may be more accurate representations than would exist if trend slopes were always assumed to be zero. In addition, this approach does not account for how continuing increases in greenhouse gas forcing may alter future climate processes, including larger-scale dynamics (e.g., changing circulation patterns and storm tracks), which may alter the trajectory of changes in the NYC watershed region in the coming decades.
Use of Sensitivity Tests on Climate Inputs
Sensitivity tests can be used on any of the three approaches to generating climate projections previously described. In the case of Approach 1, sensitivity results can be used to create response surfaces and emulators for testing a wide range of climate scenarios, beyond those selected for the direct GCM simulation studies. An example of the use of response surfaces created from sensitivity tests to a range of climate changes can be found in Prudhomme et al. (2010).
A variation of Approach 2, which has yet to be used by NYC DEP, is one in which historical records of temperature and precipitation are changed by some percent to see how this might affect the streamflow projections. This approach to sensitivity testing of historical climate projections is called the “climate change range-based method” and has been described by Whateley et al. (2014). The method makes use of long-term records of climate, changed incrementally by a range of fixed percentage increases or decreases in precipitation (such as ±10 percent), and a range of increments of temperature change, for example, +1, +2, +3, and +4°C. Simulations are run with these adjusted historical records, and key performance metrics are described. The sensitivity results can be shown graphically as a contour plot of a performance metric as a function of the change in precipitation and temperature. That result can then be evaluated to identify the “region” of the plot that represents outcomes that are problematic for the operation of the system (e.g., frequent water shortages or violations of turbidity standards). One can consider the plausibility of such changes in climatic conditions in comparison to process-based climate and hydrologic models.
Vulnerability Assessments
Vulnerability assessments, sometimes referred to as stress tests, are another useful way of investigating the impacts of climate change on water supply and quality, and can be done with any of the three approaches to climate projections already discussed. In one approach, critical levels of hydrologic changes (defined by their impacts on operations) are identified for a given system first and then meteorologic conditions that would achieve such changes are “backed out” of the process-oriented climate model through what are sometimes called inverse methods (e.g., Cunderlik and Simonovic, 2007). Trends toward these extreme outcomes, if any, can then be monitored and prepared for.
To this end, NYC DEP has developed a stochastic weather generator (Acharya et al., 2017) and has created streamflow conditions using it (Mukundan et al., 2017). The weather generator provides the means of working backward from the extreme streamflows identified as problematic
to the meteorological conditions that gave rise to those streamflows. The OST suite of models could usefully be exercised to see when the current weights, constraints, and goals cannot produce a solution given the extreme weather tested and would need to be changed. Such assumptions could be periodically reevaluated.
Decision Making Under Uncertainty
Another approach to vulnerability assessment is closely tied to decision making under deep uncertainty (DMDU) methods, also called “context first” (Ranger et al., 2010) and “agree on decisions” (Kalra et al., 2014). This approach is in contrast to predictive analysis in which uncertainties can be characterized using known probability functions, and risks to a system can be appropriately estimated on the basis of these known probabilities. However, probabilities of future climate states are unknown. For this reason, other risk-based approaches that avoid reliance on assumed probabilities of future climate states have been developed to assess the vulnerabilities of water supplies and other climate-sensitive systems. Methods such as robust decision making (Lempert et al., 2003, 2013a,b; Groves et al., 2013, 2014), decision scaling (Brown et al., 2012), Info-Gap (Ben-Haim, 2006), and assumption-based planning (Dewar, 2002) all seek to identify the future conditions (decision-relevant scenarios) under which vulnerabilities of a system are most serious. These methods then go one step further using various types of analyses to identify strategies to reduce these vulnerabilities and minimize risks of system degradation and failure.
As exemplified by Groves et al. (2014), OST was run 252 times across a wide range of possible future climate, demand, regulatory, and flow conditions.5 Performance of the water supply system was assessed in terms of percent drought days and percent alum days for a “future without action” and three future strategies (increased capacity of the Catskills Aqueduct, various operational changes, and supply augmentation from groundwater sources). The research, however, carried an important caveat:
Climate projections utilized and available at the time of this study do not adequately quantify future changes in extreme rainfall frequency and intensity, despite qualitative evidence in current trends. The inability of current climate science to adequately characterize the uncertainty in future climate with respect to extreme event frequency and intensity, underscores
___________________
5Groves et al. (2014) stated: “NYC DEP has developed 145 climate projections that reflect 29 GCMs, three [IPCC] emissions projections (A1B, A2, and B1), and two future time periods: 2045 to 2065 and 2080 to 2100. This study used a subset of 13 of these projections for the 2045 to 2065 time period, selected to capture a range of stressors to the system while also avoiding redundancy and reducing run time.”
the preliminary nature of the analysis and its conclusions because of the importance of extreme events to the reliability and quality of water supplied from the NYC system. (Groves et al., 2014)
For the foreseeable future, NYC DEP will be faced with uncertainties with respect to a changing climate. For this reason, it is important that it uses at least one of the decision making under uncertainty methods to inform its planning as it progresses through time, along with the complementary approaches to characterization of future climate inputs previously discussed.
COORDINATION BEYOND NYC DEP
If OST were updated on a regular basis, its function as a planning tool could occur in a broader context. These include participating in an indicator and monitoring system for the region and a coordinated study of risks from climate change. For example, in partnership with other NYC and regional agencies, NYC DEP could participate in the creation of a Climate Resiliency Indicator and Monitoring System for the New York metropolitan region in order to track frequency of occurrence of the range of weather conditions on an ongoing basis that pose the highest risks to the system (NPCC, 2015). Continual improvements in the information database and in the ability to analyze it are needed to inform planning, standards, regulations, and policies. Hydrologic data from the Hudson River Environmental Conditions Observing System (HRECOS), NYC DEP, U.S. Geological Survey, and NYC Department of Environmental Conservation could be gathered together so that all relevant data can be easily analyzed and disseminated to support climate change-related decision making (Solecki et al., 2015). These groups now often rely on their own observational networks that are not necessarily focused on climate change. Representatives from the groups that currently gather hydrologic data could join together to form a Climate Resiliency Indicators and Monitoring Working Group that would be able to link the many sources of climate change-related information for both water supply and quality and to analyze trends of key variables for the entire New York metropolitan region.
NYC DEP’s efforts could be usefully coordinated into a rigorous regional process linked by agreed-on approaches, data, scenarios, models, and interactions. It could be modeled on the National Climate Assessment, which is a national effort that summarizes the impacts of climate change on the United States, now and in the future (USGCRP, 2017). A coordinated Climate Change Planning Study accomplished with OST, once every four years in conjunction with the New York City Panel on Climate Change (NPCC, 2015), would provide ongoing benchmarks for long-term climate
change planning. Such an ongoing series of assessments would enable the study of interdependencies among sectors and systems as well as citywide planning.
CONCLUSIONS AND RECOMMENDATIONS
NYC DEP is already planning for climate change. Its efforts should be supported and enhanced to ensure the most reliable, highest-quality water supplies for the New York metropolitan region in the future. The following recommendations are meant to serve as a long-term guide for improving and enhancing the City’s ongoing efforts to both improve OST to support its future use under changing climate conditions and to aid in its use as a tool to conduct future climate change studies.
Given the Committee’s review of the NYC DEP’s and other studies on climate change in the NYC watershed region, there is every reason to expect that OST can continue to be used as an effective tool for operational support into the future if the Chapter 2 recommendation to update OST with the most recent data is taken. Regularly updating OST with the latest climate and hydrologic data so that the model parameterizations reflect current trends is essential to prepare for the future under changing climate conditions. Recent studies suggest that increases in summer precipitation and streamflow events and earlier snowmelt are already occurring in the NYC watershed region and will likely continue and be amplified in the near future.
As OST is used in simulation mode in future climate change studies, it will be important to consider a range of approaches as inputs to OST, including climate and hydrologic models, historical climate analogs, and current conditions and trends. Together, climate modeling and observational approaches provide effective and complementary inputs to near- and long-term water supply planning for the region. The combined results from these multiple approaches should be used to assist in decision making for the future.
NYC DEP should consider structuring future planning studies to identify the range of changes in hydrologic and water quality conditions that would trigger the need for operational changes, and then estimate the likelihood of such conditions. For example, analysis could focus on the level of turbidity in the Catskill system that would stress or exceed the ability of the current suite of infrastructure and operational practices to constrain it, and then predict the likelihood of climate and hydrologic conditions that might bring this about.
When using global climate models linked to hydrologic models to generate input to OST for climate change studies, NYC DEP should utilize ensembles of climate and hydrologic models so that model-based uncertainty can be explicitly characterized. Using larger ensembles of climate and hydrologic models as drivers to OST analyses would enable climate change planning to be based on a better-quantified assessment of future climate and streamflow in the NYC watershed region and capture the uncertainty in projections.
When using the global climate model (GCM) approach, NYC DEP should establish selection criteria for GCMs used as inputs based on how well the GCMs reproduce current climate and major climate trends over recent decades in this region. Other criteria for inclusion of GCMs in model ensembles reflect such attributes as the ability to represent annual patterns of monthly mean temperature, precipitation, and runoff for the region; availability of daily outputs for variables important for hydrology for extreme-event analysis; and model and application documentation. The ability of a GCM to approximately replicate the very substantial increases in summer streamflow and at the same time replicate the relatively trend-free record of spring and winter streamflow should be given significant weight in the criteria.
NYC DEP should consider coordinating with other NYC and regional agencies to create and update a Climate Resiliency Indicator and Monitoring System for the New York metropolitan region and assess climate change. This will track, on an ongoing basis, the frequency of occurrence of weather conditions that pose the highest risks to the water supply system. In addition, NYC DEP should consider participating in a regular Climate Change Planning Study in conjunction with the New York City Panel on Climate Change. This could provide ongoing benchmarks for long-term climate change planning for NYC DEP, allow for advanced preparations, and improve the rationale for investments and operational changes. Such benchmarking studies could usefully employ decision making under uncertainty methods to inform planning.
REFERENCES
Acharya, N., A. Frei, J. Chen, L. DeCristofaro, and E. M. Owens. 2017. Evaluating Stochastic Precipitation Generators for Climate Change Impact Studies of New York City’s Primary Water Supply. Journal of Hydrometeorology 18(3):879–896.
Anandhi, A., A. Frei, D. C. Pierson, E. M. Schneiderman, M. S. Zion, D. Lounsbury, and A. H. Matonse. 2011. Examination of change factor methodologies for climate change impact assessment. Water Resources Research 47(3):1–10.
Anandhi, A., M. S. Zion, P. H. Gowda, D. C. Pierson, D. Lounsbury, and A. Frei. 2013. Past and future changes in frost day indices in Catskill Mountain region of New York. Hydrological Processes 27(21):3094–3104.
Arnell, N. W., and S. N. Gosling. 2013. The impacts of climate change on river flow regimes at the global scale. Journal of Hydrology 486:351–364.
Ben Haim, Y. 2006. Info-Gap Decision Theory: Decisions Under Severe Uncertainty (Second Edition). Amsterdam: Elsevier.
Brown, C., Y. Ghile, M. Laverty, and K. Li. 2012. Decision scaling: Linking bottom-up vulnerability with climate projections in the water sector. Water Resources Research 48(9):1–12.
Burns, D. A., J. Klaus, and R. M. McHale. 2007. Recent climate trends and implications for water resources in the Catskill Mountain region, New York, USA. Journal of Hydrology 336(1-2):155–170.
Cook, E. R., and G. C. Jacoby. 1977. Tree-ring-drought relationships in the Hudson Valley, New York. Science 198(4315):399–401.
Cunderlik, J. M., and S. P. Simonovic. 2007. Inverse flood risk modelling under changing climatic conditions. Hydrological Processes 21(5):563–577.
Demaria, E. M., R. N. Palmer, and J. K. Roundy. 2016. Regional climate change projections of streamflow characteristics in the Northeast and Midwest US. Journal of Hydrology: Regional Studies 5:309–323.
Dewar, J. A. 2002. Assumption-Based Planning: A Tool for Reducing Avoidable Surprises. Cambridge, UK: Cambridge University Press.
Frei, A., K. E. Kunkel, and A. H. Matonse. 2015. The seasonal nature of extreme hydrological events in the northeastern United States. Journal of Hydrometeorology 16(5):2065–2085.
Frumhoff, P.C., J. J. McCarthy, J. M. Melillo, S. C. Moser, and D. J. Wuebbles. 2007. Confronting Climate Change in the U.S. Northeast: Science, Impacts, and Solutions. Synthesis report of the Northeast Climate Impacts Assessment. Cambridge, MA: Union of Concerned Scientists.
Georgakakos, A., P. Fleming, M. Dettinger, C. Peters-Lidard, T. C. Richmond, K. Reckhow, K. White, and D. Yates. 2014. In: Water Resources. Climate Change Impacts in the United States: The Third National Climate Assessment, J. M. Melillo, T. Richmond, and G. W. Yohe (eds.). U.S. Global Change Research Program, pp. 69–112. doi:10.7930/J0G44N6T.
Groves, D. G., J. R. Fischbach, E. Bloom, D. Knopman, and R. Keefe. 2013. Adapting to a Changing Colorado River: Making Future Water Deliveries More Reliable Through Robust Management Strategies. Santa Monica, CA: RAND Corporation. https://www.rand.org/pubs/research_reports/RR242.html.
Groves, D. G., J. R. Fischbach, N. Kalra, E. Molina-Perez, D. Yates, D. Purkey, A. Fencl, V. K. Mehta, B. Wright, and G. Pyke. 2014. Developing Robust Strategies for Climate Change and Other Risks. Report No. 4262. Denver: Water Research Foundation.
Haddeland, I., J. Heinke, H. Biemans, S. Eisner, M. Flörke, N. Hanasaki, M. Konzmann, F. Ludwig, Y. Masaki, J. Schewe, and T. Stacke. 2014. Global water resources affected by human interventions and climate change. Proceedings of the National Academy of Sciences of the United States of America 111(9):3251–3256.
Hayhoe, K., C. P. Wake, T. G. Huntington, L. Luo, M. D. Schwartz, J. Sheffield, E. Wood, B. Anderson, J. Bradbury, A. DeGaetano, and T. J. Troy. 2007. Past and future changes in climate and hydrological indicators in the US Northeast. Climate Dynamics 28(4):381–407.
Hewitson, B., A. C. Janetos, T. R. Carter, F. Giorgi, R. G. Jones, W.-T. Kwon, L. O. Mearns, E. L. F. Schipper, and M. van Aalst. 2014. Regional Context. In: Climate Change 2014: Impacts, Adaptation, and Vulnerability. Part B: Regional Aspects. Contribution of Working Group II to the Fifth Assessment Report of the Intergovernmental Panel on Climate Change. Barros, V. R., C. B. Field, D. J. Dokken, M. D. Mastrandrea, K. J. Mach, T. E. Bilir, M. Chatterjee, K. L. Ebi, Y. O. Estrada, R. C. Genova, B. Girma, E. S. Kissel, A. N. Levy, S. MacCracken, P. R. Mastrandrea, and L. L. White (eds.). Cambridge, United Kingdom and New York, NY: Cambridge University Press, pp. 1133–1197.
Horton, R., D. Bader, L. Tryhorn, A. DeGaetano, and C. Rosenzweig. 2011. Climate risks. In: Responding to Climate Change in New York State: The ClimAID Integrated Assessment for Effective Climate Change Adaptation. C. Rosenzweig, W. Solecki, A. DeGaetano, M. O’Grady, S. Hassol, and P. Grabhorn (eds.). Technical Report. Albany, NY: New York State Energy Research and Development Authority, pp. 15–48.
Horton, R., G. Yohe, W. Easterling, R. Kates, M. Ruth, E. Sussman, A. Whelchel, D. Wolfe, and F. Lipschultz. 2014. Northeast. In: Climate Change Impacts in the United States: The Third National Climate Assessment. J. M. Melillo, T. Richmond, and G. W. Yohe. (eds.). Washington, DC: U.S. Global Change Research Program, ch. 16.
Horton, R., D. Bader, Y. Kushnir, C. Little, R. Blake, and C. Rosenzweig. 2015. Chapter 1: Climate observations and projections. New York City Panel on Climate Change 2015 report. Annals of the New York Academy of Sciences 1336:18–35.
Huang, H., J. M. Winter, E. C. Osterberg, R. M. Horton, and B. Beckage. 2017. Total and extreme precipitation changes over the Northeastern United States. Journal of Hydrometeorology 18(6):1783–1798.
IPCC (Intergovernmental Panel on Climate Change). 2013. Climate Change 2013: The Physical Science Basis. Contribution of Working Group I to the Fifth Assessment Report of the Intergovernmental Panel on Climate Change. Cambridge, UK: Cambridge University Press.
IPCC. 2014. Climate Change 2014: Impacts, Adaptation, and Vulnerability. Part A: Global and Sectoral Aspects. Contribution of Working Group II to the Fifth Assessment Report of the Intergovernmental Panel on Climate Change. Cambridge, UK, and New York, NY: Cambridge University Press.
Jiménez Cisneros, B. E., T. Oki, N. W. Arnell, G. Benito, J. G. Cogley, P. Doll, T. Jiang, and S. S. Mwakalila. 2014. Freshwater resources. In: Climate Change 2014: Impacts, Adaptation, and Vulnerability. Part A: Global and Sectoral Aspects. Contribution of Working Group II to the Fifth Assessment Report of the Intergovernmental Panel on Climate Change. C. B. Field, V. R. Barros, D. J. Dokken, K. J. Mach, M. D. Mastrandrea, T. E. Bilir, M. Chatterjee, K. L. Ebi, Y. O. Estrada, R. C. Genova, B. Girma, E. S. Kissel, A. N. Levy, S. MacCracken, P. R. Mastrandrea, and L. L. White (eds.). Cambridge, UK and New York, NY: Cambridge University Press, pp. 229–269.
Kalra, N., S. Hallegatte, R. Lempert, C. Brown, A. Fozzard, S. Gill, and A. Shah. 2014. Agreeing on Robust Decisions: New Processes for Decision Making Under Deep Uncertainty. World Bank Policy Research Working Paper No. 6906, June 1, 2014. http://ssrn.com/abstract=2446310.
Kunkel, K. E., T. R. Karl, D. R. Easterling, K. Redmond, J. Young, X. Yin, and P. Hennon. 2013. Probable maximum precipitation and climate change. Geophysical Research Letters 40(7):1402–1408.
Lempert, R. J., S. W. Popper, and S. C. Bankes. 2003. Shaping the Next One Hundred Years: New Methods for Quantitative, Long-term Policy Analysis. Santa Monica, CA: RAND Corporation.
Lempert, R. J., N. Kalra, S. Peyraud, Z. Mao, S. B. Tan, D. Cira, and A. Lotsch. 2013a. Ensuring Robust Flood Risk Management in Ho Chi Minh City: A Robust Decision Making Demonstration. Policy Working Paper 6465. World Bank. http://elibrary.worldbank.org/doi/book/10.1596/1813-9450-6465.
Lempert, R. J., S. W. Popper, D. G. Groves, N. Kalra, J. R. Fischbach, S. Bankes and B. P. Bryant. 2013b. Making Good Decisions Without Predictions. RB-9701. Santa Monica, CA: RAND Corporation. http://www.rand.org/pubs/research_briefs/RB9701/index1.html.
Lenderink, G., and E. Van Meijgaard. 2008. Increase in hourly precipitation extremes beyond expectations from temperature changes. Nature Geoscience 1(8):511–514.
Luo, Y., D. L. Ficklin, X. Liu, and M. Zhang. 2013. Assessment of climate change impacts on hydrology and water quality with a watershed modeling approach. Science of the Total Environment 450–451:72–82.
Major, D., and R. Goldberg. 2001. Water Supply. In: Climate Change and a Global City: The Potential Consequences of Climate Variability and Change—Metro East Coast. C. Rosenzweig, and W. Solecki (eds.). Report for the U.S. Global Change Research Program, National Assessment of the Potential Consequences of Climate Variability and Change for the United States. New York: The Earth Institute, Columbia University, pp. 87–102.
Matonse, A. H., and A. Frei. 2013. A seasonal shift in the frequency of extreme hydrological events in southern New York State. Journal of Climate 26(23):9577–9593.
Matonse, A. H., D. C. Pierson, A. Frei, M. S. Zion, E. M. Schneiderman, A. Anandhi, R. Mukundan, and S. M. Pradhanang. 2011. Effects of changes in snow pattern and the timing of runoff on NYC water supply system. Hydrological Processes 25(21):3278–3288.
Matonse, A. H., D. C. Pierson, A. Frei, M. S. Zion, A. Anandhi, E. Schneiderman, and B. Wright. 2013. Investigating the impact of climate change on New York City’s primary water supply. Climatic Change 116(3–4):437–456.
Milly P. C., J. Betancourt, M. Falkenmark, R. M. Hirsch, Z. W. Kundzewicz, D. P. Lettenmaier, and R. J. Stouffer. 2008. Stationarity is dead: Whither water management. Science 319(5863):573–574.
Mukundan, R., S. M. Pradhanang, E. M. Schneiderman, D. C. Pierson, A. Anandhi, M. S. Zion, A. H. Matonse, D. G. Lounsbury, and T. S. Steenhuis. 2013. Suspended sediment source areas and future climate impact on soil erosion and sediment yield in a New York City water supply watershed, USA. Geomorphology 183:110–119.
NPCC (New York City Panel on Climate Change). 2015. Building the Knowledge Base for Climate Resiliency: New York City Panel on Climate Change 2015 Report. C. Rosenzweig and W. Solecki (eds.). Annals of the New York Academy of Sciences 1336: 1–150.
NRC (National Research Council). 2004. Adaptive Management for Water Resources Project Planning. Washington, DC: National Academes Press.
NYC DEP (New York City Department of Environmental Protection). 2008. Climate Change Program: Assessment and Action Plan. May. Report 1. York: NYC DEP.
NYC DEP. 2013. Climate Change Integrated Modeling Project. Phase I Assessment of Impacts on the New York City Water Supply West of Hudson Water Quantity, Schoharie Turbidity and Cannonsville Eutrophication. New York: NYC DEP.
Owens, E. 2017. Use of OST in Future Climate Modeling work. Presentation to the National Academies OST Expert Panel. September 25.
Owens, E., and A. Frei. 2017. Effects of Climate Change on NYC Watershed. Presentation to the National Academies OST Expert Panel. January 5.
Pederson, N., A. R. Bell, E. R. Cook, U. Lall, N. Devineni, R. Seager, and K. P. Vranes. 2013. Is an epic pluvial masking the water insecurity of the Greater New York City Region? Journal of Climate 26(4):1339–1354.
Pierson, D. C., N. R. Samal, E. M. Owens, E. M. Schneiderman, and M. S. Zion. 2013. Changes in the timing of snowmelt and the seasonality of nutrient loading: can models simulate the impacts on freshwater trophic status? Hydrological Processes 27(21):3083–3093.
Pradhanang, S. M., R. Mukundan, E. M. Schneiderman, M. S. Zion, A. Anandhi, D. C. Pierson, A. Frei, Z. M. Easton, D. Fuka, and T. S. Steenhuis. 2013. Streamflow responses to climate change: Analysis of hydrologic indicators in a New York City water supply watershed. Journal of the American Water Resources Association 49(6):1308–1326.
Prudhomme, C., R. L. Wilby, S. Crooks, A. L. Kay, and N. S. Reynard. 2010. Scenario-neutral approach to climate change impact studies: application to flood risk. Journal of Hydrology 390(3):198–209.
Ranger, N., A. Milner, S. Dietz, S. Frankhauser, A. Lopez, and R. Giovanni. 2010. Adaptation in the UK: A Decision-Making Process. Centre for Climate Change and Economics Policy. http://www.cccep.ac.uk/Publications/Policy/docs/PB-adaptationUK-ranger.pdf.
Samal, N. R., D. C. Pierson, E. Schneiderman, Y. Huang, J. S. Read, A. Anandhi, and E. M. Owens. 2012. Impact of climate change on Cannonsville Reservoir thermal structure in the New York City Water Supply. Water Quality Research Journal 47(3–4):389–405.
Schewe, J., J. Heinke, D. Gerten, I. Haddeland, N. W. Arnell, D. B. Clark, R. Dankers, S. Eisner, B. Fekete, F. J. Colón-González, S. N. Gosling, H. Kim, X. Liu, Y. Masaki, F. T. Portmann, Y. Satoh, T. Stacke, Q. Tang, Y. Wada, D. Wisser, T. Albrecht, K. Frieler, F. Piontek, L. Warszawski, and P. Kabat. 2013. Multi-model assessment of water scarcity under climate change. Proceedings of the National Academy of Sciences of the United States of America 111(9):3245–3250.
Seager, R., N. Pederson, Y. Kushnir, J. Nakamura, and S. Jurburg. 2012. The 1960s drought and the subsequent shift to a wetter climate in the Catskill Mountains region of the New York City watershed. Journal of Climate 25(19):6721–6742.
Solecki, W., C. Rosenzweig, R. Blake, A. de Sherbinin, T. Matte, F. Moshary, B. Rosenzweig, M. Arend, S. Gaffin, E. Bou-Zeid, K. Rule, G. Sweeny, and W. Dessy. 2015. New York City Panel on Climate Change 2015 Report. Annals of the New York Academy of Sciences 1336:89–106, ch. 6: Indicators and Monitoring.
Stocker, T. F., D. Qin, G. K. Plattner, M. Tignor, S. K. Allen, J. Boschung, and B. M. Midgley. 2013. Climate Change 2013: The Physical Science Basis. Contribution of Working Group I to the Fifth Assessment Report of the Intergovernmental Panel on Climate Change. New York: Cambridge University Press.
USGCRP (U.S. Global Change Research Program). 2017. Climate Science Special Report: Fourth National Climate Assessment, Vol. I, D. J. Wuebbles, D. W. Fahey, K. A. Hibbard, D.J. Dokken, B.C. Stewart, and T. K. Maycock (eds.). Washington, DC: U.S. Global Change Research Program. doi: 10.7930/J0J964J6.
Wehner, M. F., J. R. Arnold, T. Knutson, K. E. Kunkel, and A. N. LeGrande. 2017. Droughts, floods, and wildfires. In: Climate Science Special Report: Fourth National Climate Assessment, Volume I. Wuebbles, D. J., D. W. Fahey, K. A. Hibbard, D. J. Dokken, B. C. Stewart, and T. K. Maycock (eds.). Washington, DC: U.S. Global Change Research Program, pp. 231–256. doi: 10.7930/J0CJ8BNN.
Whateley, S., S. Steinschneider, and C. Brown. 2014. A climate change range-based method for estimating robustness for water resources supply. Water Resources Research 50(11):8944–8961.
This page intentionally left blank.


