
1
Introduction
DESCRIPTION OF THE NEW YORK CITY WATER SUPPLY
New York City’s water supply system is one of the oldest, largest, and most complex in the nation. On average, more than 1.1 billion gallons1 of water flow each day from the Delaware, Catskill, and Croton watersheds to meet the water supply needs of more than eight million people in the City itself; one million people in the counties of Westchester, Putnam, Orange, and Ulster north of the City; and the millions of commuters and tourists who visit the City throughout the year. Approximately 95 percent of the total water supply is delivered to the City by gravity (without pumping). Only about 5 percent of the water is regularly pumped to maintain the necessary pressure and respond to drought conditions. Most of the water supply receives no filtration or treatment other than disinfection. The Croton supply undergoes conventional treatment, including filtration, and in rare instances of high source turbidity, a coagulant is added to the Catskill supply to increase deposition of suspended solids.
The City’s water supply is managed by the Bureau of Water Supply within the New York City Department of Environmental Protection (NYC DEP). The Bureau’s mission statement is: “to reliably deliver a sufficient quantity of high quality drinking water and to ensure the long-term sustainability of the delivery of this most valuable resource in order to promote public health, economic development, and quality of life of the City of New York.” (Rush et al., 2011).
___________________
1 One billion gallons is equivalent to 3,069 acre-ft of water.
The system is managed to maximize system reliability and maintain high-quality drinking water for all its customers, including those receiving water between the source and the City. It also must address environmental concerns and meet regulatory and other legal obligations. These obligations include protecting the watersheds surrounding its reservoirs from contamination, maintaining flows for downstream users, and protecting fish habitat and stream ecosystems.
Historical Perspective
The following is drawn from a 2000 National Academies study (NRC, 2000) to offer a brief history of New York City’s water supply system. Figure 1-1 shows the basic elements of the system, while Table 1-1 is a reproduction of the NRC (2000) chronology of the City’s population served, water supply milestones, and related events. Table 1-2 extends Table 1-1 to include events since the NRC (2000) chronology, including many that led to the request for this study. This current study exists in the larger context of an historic, but also evolving, water supply system that has been modified often to adapt to new stresses on water supply and water quality and to reflect improved understanding of the connections between watershed protection, water supply reliability, drinking water quality, and public health.
In the early 1800s, fire, inadequate supply, and disease forced officials in New York City to look beyond the City’s borders for a reliable source of drinking water. Because Manhattan and the other boroughs are mostly set on hard rock, extracting water from these formations was never a viable option.2 Furthermore, as a coastal city New York is limited in its land area and it lacks the topography for building reservoirs with catchments of sufficient area to have met the growing demands. A study of Westchester County water resources led to construction of the Croton system of reservoirs and aqueducts, which was first put into operation in 1842 and completed by 1911 (Blake, 1956; Weidner, 1974).
By the turn of the 20th century, the City’s water engineers recognized that they would need to expand the supply even further beyond its borders to keep up with the City’s explosive population growth. They considered extracting water directly from the Hudson River, but water quality was unacceptable due to seasonal and climatic saline intrusion; the “salt line” of the Hudson estuary, varying with season and climate, extends as far north as Troy, New York, 150 miles north of the City. Instead, the New York State Water Supply Act of 1905 created a Board of Water Supply to develop a larger system of reservoirs and aqueducts in the Catskill Mountains north
___________________
2 In contrast, parts of Queens and all of Nassau and Suffolk counties on Long Island overlie a sole-source aquifer that provides drinking water to its more than seven million residents.
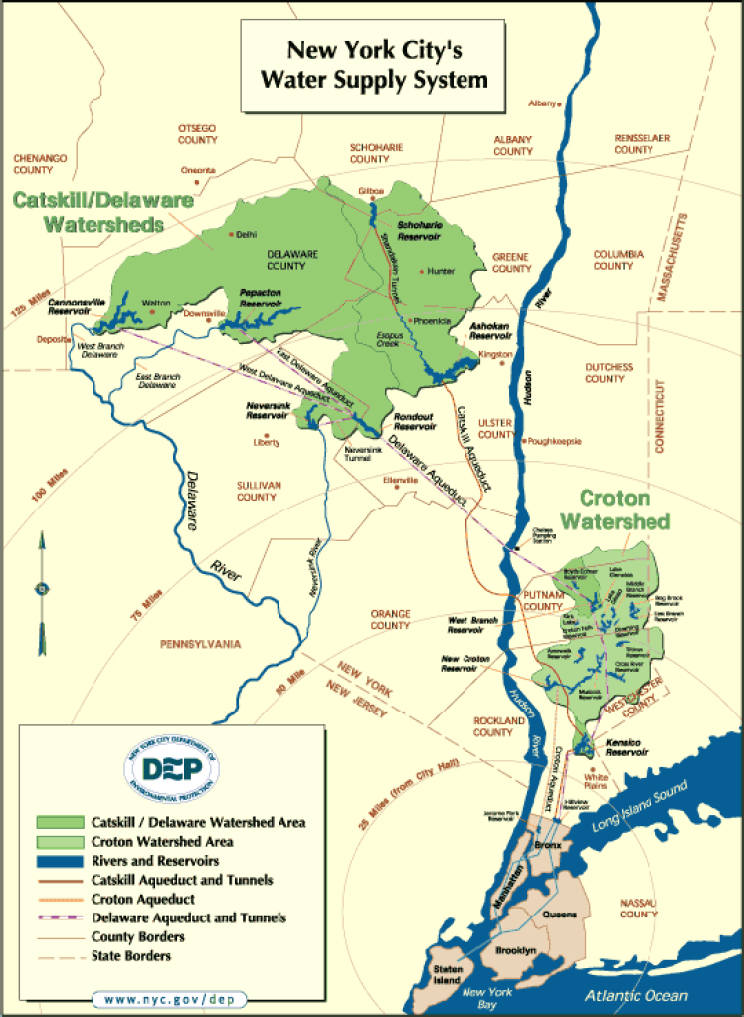
TABLE 1-1 Chronology of the New York City Population, Water Supply, and Related Events Through 1997
| NYC Population | Year | Event |
|---|---|---|
| 60,000 | 1800 | |
| 1811 | Commissioners Plan for NYC—future growth envisioned | |
| 1819 | Albert Giblin patents the silent valveless wastewater preventor (flush toilet) in Great Britain | |
| 1825 | Erie Canal opens | |
| 200,000 | 1830 | |
| 1832 | Cholera epidemic strikes NYC and other cities | |
| 1834 | NYC Board of Water Commissioners established by state legislature | |
| 1835 | Great Fire burns much of NYC | |
| 1837 | Croton River Dam and 41-mile aqueduct begun | |
| 1842 | First water reaches NYC from Croton River—celebrations | |
| 1858 | Central Park opened—including reservoir | |
| 1866 | New York State Metropolitan Health Act | |
| 1 million | 1878 | |
| 1893 | Completion of New Croton River aqueduct | |
| 1898 | Consolidation of five boroughs into “Greater NYC” | |
| 3.5 million | 1905 | State legislature gives NYC power to regulate upstate watershed land |
| 4.6 million | 1911 | New Croton River system completed—10% of present NYC system |
| 1925 | Interstate compact re Delaware River allocation—ratified only by New York | |
| 1927 | Catskill Mountain system completed—40% of present NYC system | |
| 1931 | New Jersey v. New York (283 U.S. 336) | |
| NYC is authorized to withdraw up to 440 million gallons per day (MGD) from Delaware River headwaters | ||
| 7.5 million | 1936 | Delaware River system begun |
| 1953 | New Jersey v. New York (347 U.S. 995)—NYC authorized to divert up to 800 MGD from the Delaware headwaters subject to maintaining minimum downstream flows. River Master appointed. | |
| NYC Watershed Regulations published |
| NYC Population | Year | Event |
|---|---|---|
| 7.7 million | 1961 | Delaware River Basin Interstate Compact adopted (four states and U.S.)—Delaware River Basin Commission established |
| 1964 | Delaware River system completed—50% of present NYC system | |
| 1964–65 | Northeast drought | |
| 7.9 million | 1970 | |
| 1989 | U.S. Environmental Protection Agency promulgated Surface Water Treatment Rule requiring water systems to filter or meet filtration avoidance criteria | |
| 7.3 million | 1990 | |
| 1993 | NYC received first Filtration Avoidance Determination for the Catskill/Delaware supply | |
| 1997 | Watershed Management Agreement signed |
SOURCE: Adapted from NRC (2000; Table 2-1).
and west of the City. By 1915, the Ashokan Reservoir (located 102 miles from Manhattan) was completed as well as the Catskill Aqueduct connecting the reservoir to the Croton system. Construction of the Schoharie Reservoir and Shandaken Tunnel followed in 1927.
Planning then began on development of the Rondout watershed and tributaries of the Delaware River within the State of New York, but the proposed expansion into the Delaware Basin raised concerns in the downstream states of Pennsylvania and New Jersey that New York City’s demand would jeopardize their own water supplies and other water needs. Ultimately, the U.S. Supreme Court resolved the matter in 1931 (New Jersey v. New York, 283 U.S. 336) and construction of the Delaware system proceeded. The Supreme Court ruled again on the interstate dispute in 1953 (New Jersey v. New York, 347 U.S. 995) and eventually the last of the Delaware River Basin reservoirs, Cannonsville, was completed in 1964.
The passage of the federal Clean Water Act (CWA) in 1972 and Safe Drinking Water Act (SDWA) in 1974 imposed a series of regulatory requirements on the City’s supply system that proved challenging to meet. In 1993, New York City secured its first Filtration Avoidance Determination for the Catskill/Delaware supply, and in 1997 the historic New York City Watershed Memorandum of Agreement (MOA) was signed by the City, the U.S. Environmental Protection Agency (EPA), state regulators, nearly 80 local governments in the watershed region, and environmental advocacy and
TABLE 1-2 Chronology of the New York City Water Supply and Selected Recent Events Related to This Study (2000-2017)
| NYC Population | Year | Event |
|---|---|---|
| 8 million | 2000 | |
| 2002 | Filtration Avoidance Determination issued | |
| 2002 | Catskill Turbidity Control Study begins | |
| 2006 | State Pollutant Discharge Elimination System (SPDES) permit issued regulating Shandaken Tunnel diversions | |
| 2005–2006 | Extremely wet weather | |
| 2007 | Filtration Avoidance Determination issued | |
| 2007 | SPDES permit issued for discharge of alum into the Catskill Aqueduct and Kensico Reservoir (Catalum SPDES permit) | |
| 8.375 million | 2010 | |
| 2010–2011 | Extreme weather, including Hurricane Irene, producing the highest discharges in 100 years in some parts of the watershed | |
| 2013 | Catskill/Delaware ultraviolet disinfection facility completed | |
| 2013 | Operations Support Tool completed | |
| 2013 | Consent Order issued requiring NYC to prepare environmental impact statement for proposed modifications to Catalum SPDES permit | |
| 2015 | Croton filtration plant enters into service | |
| 2016 | National Academies OST Review begins | |
| 2017 | New ten-year Flexible Flow Management Program takes effect | |
| 2017 | Filtration Avoidance Determination issued |
land protection organizations. Since then, New York City has been implementing a series of watershed protection programs to reduce the susceptibility of its surface water supply to contamination from a variety of sources. It is the City’s intention to avoid the need to filter its water into the future.
New York City depends on large tunnels to distribute water from its Croton reservoirs to consumers and businesses in the City. City tunnels #1 and #2 were constructed in 1917 and 1935, respectively. Construction of a third City water tunnel, begun in 1974 and now scheduled for completion in 2020, will provide a higher level of security and reliability when the older tunnels are temporarily removed from service for maintenance.
Because New York City’s water supply system extends well beyond the City’s geographic boundaries, the City has had to find creative ways to operate effectively and cooperatively with other jurisdictions throughout New York State as well as with neighboring states. In contrast, the State of Massachusetts eventually moved Boston’s unfiltered water supply system under the control of a regional water authority in recognition of the need to broaden the public support for watershed protection and infrastructure investments affecting populations well beyond Boston’s borders. Twenty-five years after the signing of the first MOA, New York City manages to reliably deliver high-quality drinking water with minimal treatment and without use of filtration, except for the Croton system.
Configuration of the System
The New York City water supply system of today, depicted in Figure 1-1, is made up of three upstate reservoir systems (the Croton, the Catskill, and the Delaware) that include 19 reservoirs and three controlled lakes with a total storage capacity of approximately 580 billion gallons. These three water collection systems were built with various interconnections to increase flexibility by permitting the exchange of water from one to another, which mitigates the impact of droughts and improves reliability.
The Delaware system provides 50 percent of the system’s supplies and includes four reservoirs: Pepacton, Cannonsville, and Neversink, from which water is diverted to the fourth reservoir, Rondout Reservoir. From Rondout Reservoir, water is diverted to West Branch and Kensico reservoirs via the Delaware Aqueduct. The Catskill system, providing 40 percent of supplies, includes the Schoharie and Ashokan reservoirs, the latter of which diverts water to Kensico Reservoir. The Catskill and Delaware aqueducts are mostly large (14 × 17 feet) excavations in solid rock. From Kensico, water is diverted to the Catskill–Delaware ultraviolet (UV) disinfection facility and then to Hillview Reservoir and subsequently conveyed to the City via City tunnels 1, 2, and 3. The Delaware system provides the highest-quality water in the system, and its use is increased to respond to unusual conditions such as high turbidity events in the Catskill system, droughts, or when a critical piece of infrastructure in the Catskill system is offline. The City’s Croton system, providing 10 percent of supplies, includes 12 reservoirs and three controlled lakes that deliver water to the New Croton Water Filtration Plant and then to the Jerome Park Reservoir in the Bronx prior to distribution.
The current capacities of the system’s reservoirs, capacities of conveyance structures, and the ranges of reservoir releases are shown in Figure 1-2. These releases are determined by court decree, discharge permit, or inter-
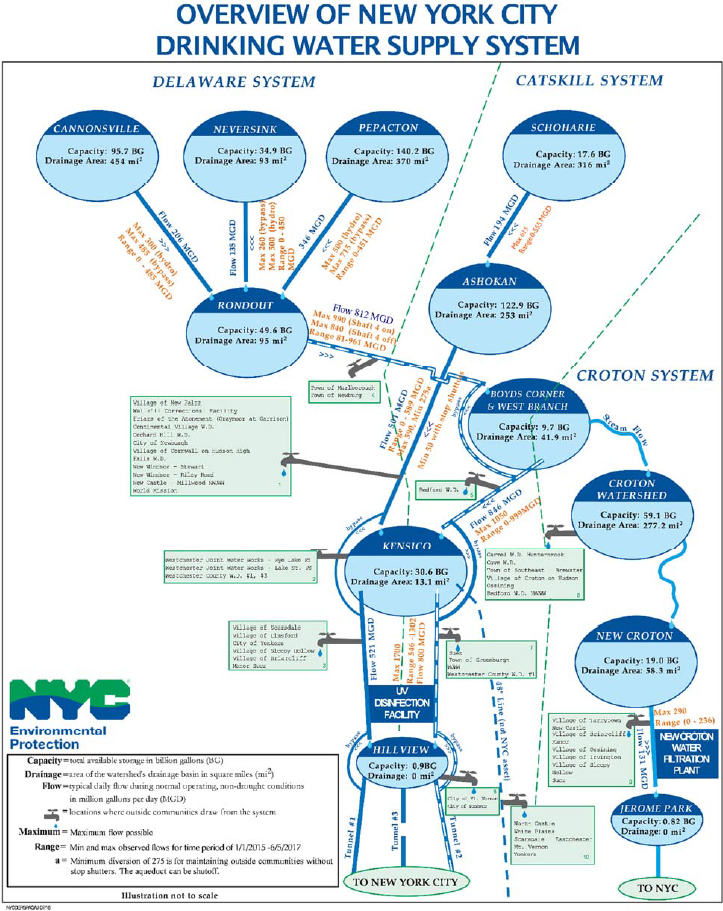
agency agreement, primarily to achieve environmental goals. The communities listed under the “water tap” icon receive untreated water from the City of New York and must provide drinking water treatment (including filtration) to meet regulatory requirements. As a result, variations in the City’s
water quality can affect the treatment requirements of these communities. The Delaware and Catskill system reservoirs also provide for downstream releases for environmental purposes but these are not shown in Figure 1-2.
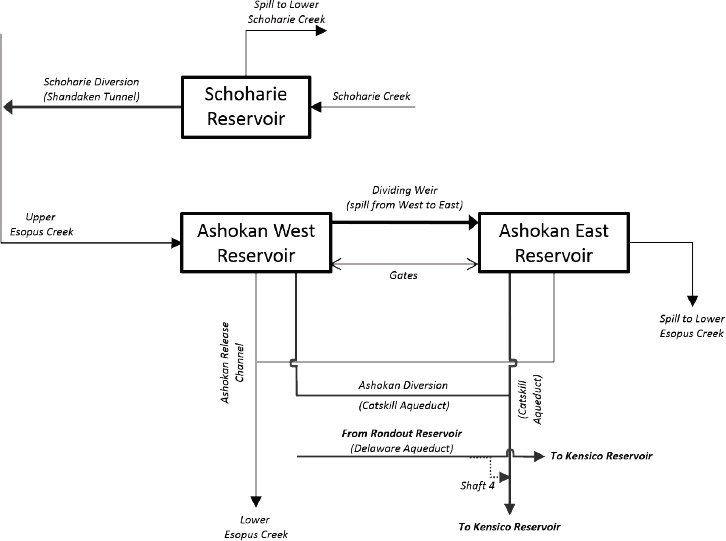
This report places emphasis on the Catskill system because it experiences high turbidity on an irregular basis, a fact that eventually led to the creation of the Operations Support Tool (OST) that is the subject of this study. This high turbidity is primarily a consequence of the geologic setting of the watersheds draining to the Schoharie and Ashokan reservoirs. The sources of turbidity are mainly from in-stream processes (as opposed to upland sources). These processes include the erosion of glacial lake silt and clay deposits in stream banks and beds as well as slope failures of these deposits during floods and also the re-suspension of silt and clay from stream beds (NYC DEP, 2008a). The key elements of the Catskill system are the Schoharie Reservoir, the East and West basins of Ashokan Reservoir, and the various devices that affect the quantities of water stored and released from them. These are shown schematically in Figure 1-3.
Historical and Anticipated Water Demand
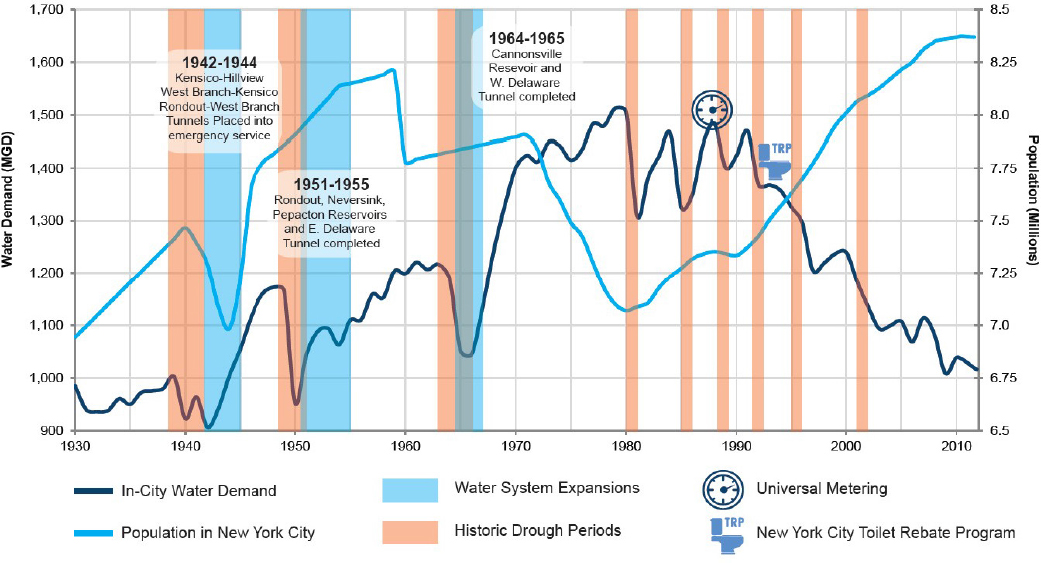
The most critical mission of NYC DEP Bureau of Water Supply is to supply sufficient quantities of high-quality water to meet the demands of consumers. Although demand for water is often thought to mirror trends in population, Figure 1-4 shows that there has been an inverse correlation between population growth and demand for water in New York City since the 1980s. Prior to the City’s population decline between 1970 and 1980 at the time of its financial crisis, increases in water demand generally followed population growth. During the 1970s, New York City lost 900,000 inhabitants, declining from 7.9 million in 1970 to 7.0 million in 1980. With the improvement in the City’s economy and the influx of new migrants from abroad, the City’s population in 1990 stood at 7.3 million. Since the early 1990s, per capita water use has decreased as a direct result of decreased use by its customers coupled with significant investments in demand management by NYC DEP. Figure 1-4 shows a 30 percent decrease in total demand in the past 25 years, despite a rising population. Population had increased to 8.6 million by the end of 2017, and it is projected to reach about 9 million by 2040 (NYC Department of City Planning, 2013).
New York City, similar to some other major U.S. cities, continues to reap significant benefits from water conservation practices. These practices have included federal standards for plumbing fixtures and EPA, state, and local utility public service campaigns to encourage water conservation, particularly during times of drought or scarcity (EPA, 2017). In the future, the rate of demand reduction is likely to taper off as system leaks are corrected, automated metering becomes more universal, and more efficient plumbing creates a new baseline for demand. These practices will also result in a hardening of demand, so that it will be more difficult to reduce demand in response to future drought shortages. However, significant growth in demand by the system’s existing suburban user communities both east and west of the Hudson River valley, which in 2016 averaged 120 MGD (NRC, 2000), is unlikely. These are mostly older communities that are largely built out, although some intensification of residential development may occur through the replacement of single-family homes with higher-density development. The City’s most recent five-year water demand management report shows continuing modest declines in average daily demand from 2013 to 2017 despite an increasing population (NYC DEP, 2018). Collectively, these trends suggest that the City should not have a problem meeting future demands.
Future demands on the New York City system could increase from the expansion of its service area to include communities and populations currently served by other sources. This could occur in the event that these other sources become contaminated or are no longer sufficient to meet the needs
of areas within reach of the City’s distribution system (NRC, 2000). In summary, the City’s demand management in the future will be a continuing balance among conservation-influenced consumption, changing demands in the service area, and the City’s obligations to in-stream ecological needs and downstream users.
REGULATORY FRAMEWORK
Delivery of the City’s drinking water is guided by a complex mix of federal and state laws and regulations, including those pertaining to unfiltered water supplies.
Safe Drinking Water Act
Originally passed in 1974, the SDWA instructed the EPA to set national health-based standards for public drinking water supplies and then work with states and water systems to implement and enforce the standards. When the SDWA was reauthorized in 1986, it was amended to address concerns that disease-causing microbial contamination was not being sufficiently controlled under the original act. In response, the 1986 SDWA Amendments required the disinfection of public water supplies and specified filtration for nearly all public water systems using surface water sources or groundwater sources considered to be under the direct influence of surface water.
SDWA programs in New York are overseen by the New York State Department of Health (NYS DOH) and EPA. The NYS DOH is the primacy agency that has the authority under both state and federal law to enforce all aspects of the SDWA.
Surface Water Treatment Rule
In 1989, EPA promulgated the Surface Water Treatment Rule (SWTR; 40 CFR Part 141, Subpart H) to address public health risks associated with Legionella, Giardia lamblia, and viruses for all public water systems using surface water or groundwater under the direct influence of surface water. The SDWA was further amended in 1996, in part to address additional concerns about pathogens in drinking water supplies. Numerous waterborne disease outbreaks, including the cryptosporidiosis outbreak in Milwaukee, were reported between 1980 and 1994 and were believed to have caused over 750,000 cases of disease (Craun, 1998). To address this pathogen risk in larger water systems, EPA amended the SWTR in 1998 with the Interim Enhanced Surface Water Treatment Rule (IESWTR; 40 CFR Part 141, Sub-
part P) and again in 2006 with the Long Term 2 Enhanced Surface Water Treatment Rule (LT2ESWTR; 40 CFR Part 141, Subpart W).
Under the original SWTR, public water systems that do not filter their water must meet criteria related to source water quality and site-specific conditions. If the criteria for avoiding filtration are not met, filtration treatment must be installed within 18 months of when the system failed to meet one or more of these filtration avoidance criteria. The SWTR established the following filtration avoidance requirements:
- The water system must monitor fecal coliform or total coliform density in representative samples of source water immediately prior to the first point of disinfectant application and fecal coliform concentrations must be <20/100 mL OR total coliform concentrations must be <100/100 mL in at least 90 percent of measurements from the previous six months. Samples must be collected weekly and every day that source water turbidity exceeds 1 NTU.3
- Turbidity levels cannot exceed 5 NTU prior to the first point of disinfectant application, based on representative grab samples collected at least every four hours.
- The water system must provide 99.9 percent Giardia lamblia and 99.99 percent virus inactivation daily (except any one day each month) in 11 of the 12 previous months, based on measurements made during peak hourly flow at or before the first customer.
- The water system must comply with the E. coli Maximum Contaminant Level (MCL) in 11 of the 12 previous months.
- A watershed control program must be in place that minimizes the potential for contamination of the source water by Giardia lamblia cysts and viruses. This program must characterize the watershed’s hydrology, physical features, land use, source water quality, and operational capabilities. It must identify, monitor, and control man-made and naturally occurring activities that may be detrimental to water quality and must also be able to control activities through land ownership or written agreements.
- The water supply cannot be identified as a source of a waterborne disease outbreak.
The IESWTR requires unfiltered systems to meet additional provisions to remain unfiltered, including compliance with more stringent disinfection byproduct MCLs and a requirement to address Cryptosporidium in their
___________________
3 Turbidity is a measure of the amount of incident visible light scattered by particles in water and is expressed in nephelometric turbidity units (NTU) when measured using standard methods.
watershed control programs. The LT2ESWTR requires unfiltered systems to provide further protection by having disinfection in place with at least 99 percent or 99.9 percent inactivation of Cryptosporidium, depending on source water monitoring results.
Filtration Avoidance Determination
As mentioned previously, New York City received its first waiver from filtration for the Catskill/Delaware supply in 1993. There were actually two filtration avoidance determinations (FADs) in 1993; the first was issued in January and the second in December. Both identified turbidity in the Catskills as a water quality problem, requiring NYC DEP to develop a plan to reduce turbidity in the Schoharie and Ashokan reservoirs. Subsequent FADs refined this turbidity control requirement, and NYC DEP’s response became known as the Catskill Turbidity Control Study, which is described further in Box 1-1.
New York City’s Watershed Protection Program. To comply with its FAD over the last 25 years, the NYC DEP created the Watershed Protection Program, memorialized in the 1997 Memorandum of Agreement, which includes numerous individual components that target potential sources of contamination to the water supply, including agriculture, stormwater, wastewater, and changes in land use. Under the Watershed Protection Program, New York City has acquired sensitive lands around its reservoirs and their headwaters, upgraded dozens of wastewater treatment and collection systems throughout the watershed, replaced more than 5,000 residential septic systems, restored about 40 miles of streambanks and floodplains, installed thousands of best management practices to improve the quality of runoff from local farms, and reviewed thousands of building projects to ensure that their plans aid in protecting water quality.
Some of this work has been done through partnerships with locally based organizations that have administered watershed protection programs over the past 25 years. These include the Catskill Watershed Corporation, the Watershed Agricultural Council, county Soil and Water Conservation Districts, and others. The Watershed Rules and Regulations give the City the authority to enforce multiple regulations pertaining to activities that could pose a risk to the water supply, including the siting of septic systems, wastewater treatment plant upgrades, and the use of setbacks around reservoirs.
The overall program relies on input from a comprehensive monitoring program to assess potential sources of water contamination, including the yearly collection and analysis of tens of thousands of water samples from more than 450 sites throughout the watershed. This monitoring, which
occurs at aqueducts, reservoirs, streams, and wastewater treatment plants, is essential to operating and managing the system to provide the best possible water at all times, to identify water quality trends, and to focus watershed management efforts. Progress on the program is reported in the Watershed Water Quality Annual Report (NYC DEP, 2017).
In December 2016, NYC DEP submitted a new ten-year plan for source water protection to NYS DOH. The Mayor’s Office announced receipt of its new ten-year waiver from NYS DOH on December 28, 2017. The City also committed “an estimated $1 billion over the next decade to comply with the FAD by administering programs that protect the upstate reservoirs and the vast watershed lands that surround them” (New York City Office of the Mayor, 2017).
The Clean Water Act
One of the first major laws addressing the contamination of U.S. waters was the Federal Water Pollution Control Act of 1948. The act was reorganized and substantially expanded in 1972 in response to persistent and growing concerns that water pollution was not being adequately controlled. The product of these 1972 amendments became known as the CWA, expanding the original Federal Water Pollution Control Act by:
- creating the basic structure for regulating pollutant discharges into U.S. waters;
- authorizing EPA to set wastewater standards for industry;
- furthering existing requirements to set water quality standards for all contaminants in surface waters;
- requiring permits for all pollutant discharges from point sources into navigable waters;
- funding construction of wastewater treatment plants; and
- beginning to characterize and address nonpoint source pollution.
The New York State Department of Environmental Conservation (NYS DEC) is the agency with primacy in exercising the authority under both state and federal laws to enforce the CWA in New York State. The CWA established many types of permits. EPA’s National Pollutant Discharge Elimination System (NPDES) permit program was created to control point source discharges, such that an entity discharging pollutants into waterbodies would have to limit that discharge as specified in its permit, to ensure compliance with minimum treatment technology requirements and a waterbody’s water quality standards. Some states, including New York, have assumed primacy for the NPDES program; in these cases, permits are referred to as State Pollutant Discharge Elimination System (SPDES) permits.
Under the CWA, each state must designate the use or uses of each of its surface waters and adopt water quality criteria to protect those designated uses. States may designate waterbodies for recreational uses; protection and propagation of fish, shellfish, and wildlife; drinking water supply; or
agricultural, industrial, navigation, or other uses (ASDWA, 2014). It is not unusual for one waterbody to have several designated uses. To protect the designated uses of waterbodies and ensure that impaired or threatened waters are being accurately identified, the CWA requires states to assess the quality of their surface waters, usually through the collection and analysis of water quality data. Results are compared with state-established water quality standards, which may be narrative or quantitative, to evaluate each waterbody’s condition relative to its designated use(s).
Under Section 303(d) of the act, states are required to develop a list of waters that do not meet established water quality standards and are therefore considered “impaired” for their designated use(s). States must also list waters that currently meet their water quality standards but may exceed a standard in the next reporting cycle; these waters are considered “threatened.” States must then develop Total Maximum Daily Loads (TMDLs) for the waterbodies on their Section 303(d) lists to determine the maximum amount of a pollutant that can be present in the waterbody and still meet water quality standards. As part of the TMDL, the state allocates this loading capacity among the point sources and nonpoint sources in the watershed. Conditions of NPDES or SPDES discharge permits should be consistent with the point source allocations of the TMDL. States must update their 303(d) list every two years until the applicable water quality standards have been met.
In New York State, the 303(d) list is developed by NYS DEC but must be approved by EPA. In 2012, EPA partially disapproved NYS DEC’s 303(d) list, specifically because of the NYS DEC decision not to list the Lower Esopus Creek as impaired. After a public comment period, EPA made a final determination that the Lower Esopus Creek was impaired and should be on the 2012 303(d) list. The Lower Esopus Creek continues to be listed as impaired for turbidity on New York State’s most recent (2016) 303(d) list.
Catalum4 SPDES Permit
A SPDES permit was issued to NYC DEP on January 1, 2007, in order to permit the addition of alum (aluminum sulfate) into the Catskill Aqueduct, and essentially, in turn, to Kensico Reservoir. The purpose of alum addition is to enhance the deposition in Kensico Reservoir of turbidity-causing suspended solids from the Catskill Aqueduct source water. NYS DEC required NYC DEP to apply for a SPDES permit because the state agency determined that alum addition was violating the narrative standard for suspended and settleable solids in Kensico Reservoir. This water quality
___________________
4 Catalum refers to Catskill alum.
standard states “none from sewage, industrial wastes or other wastes that will cause deposition or impair the waters for their best usages” (New York Compilation of Codes, Rules, and Regulations, 6 CRR-NY 703.2). NYS DEC has determined that alum floc and turbidity from the Catskill Aqueduct fall into this category.
SPDES requirements can have many provisions, including discharge restrictions, monitoring, studies, and plans, and the Catalum SPDES is no different. Among other provisions, it requires NYC DEP to evaluate structural, operational, and erosion control measures that will reduce turbidity in the incoming water and hence reduce the need for alum. These measures are discussed in the Catskill Turbidity Control Study reports and in Chapter 3.
In 2005 and 2006, there was extreme weather and exceptionally high turbidity in Ashokan Reservoir. In addition to using alum for water entering the Kensico Reservoir from the Catskill system, the NYC DEP also dealt with the turbidity problem by releasing highly turbid Ashokan Reservoir waters to the Lower Esopus Creek. The response from those living downstream of Ashokan along the Lower Esopus was very negative, which placed increased critical inquiry on the release strategies and the terms of the SPDES permit. Because of this controversy (and others not mentioned here), a Consent Order was issued by the NYS DEC to the NYC DEP on October 4, 2013, requiring the preparation of an environmental impact statement (EIS) surrounding proposed modifications to the SPDES permit. The Consent Order included a requirement to follow the Interim Release Protocol for the Ashokan Release Channel, specifying constraints on releases based on Ashokan turbidity and the purpose or goal of the release. The EIS, including use of the Interim Release Protocol, is the subject of Chapter 4.
Shandaken SPDES Permit
In March 2000, the Catskill Mountains Chapter of Trout Unlimited and other environmental groups sued New York City, alleging that the Shandaken Tunnel diversions of Schoharie Reservoir water to the Upper Esopus Creek required a permit under the CWA. The plaintiffs alleged that the Shandaken Tunnel was discharging pollutants in the form of suspended solids, turbidity, and heat into the Upper Esopus Creek, a popular trout stream. The U.S. Court of Appeals determined that a SPDES permit was necessary for this point source discharge and the City submitted an application for a SPDES permit to NYS DEC on December 30, 2002; NYS DEC issued a draft permit in February 2004. Because of extensive criticism from stakeholders, NYS DEC withdrew the draft permit and issued a revised draft for public comment in August 2004. Following administrative proceedings in 2005, in July 2006 the NYS DEC Commissioner directed
staff to issue a final permit for the Shandaken Tunnel consistent with the most recent draft. The Shandaken Tunnel SPDES permit was issued with an effective date of September 1, 2006.
In late 2006, the Catskill Mountains plaintiffs challenged the Shandaken Tunnel SPDES permit again, claiming it contained unlawful exemptions and there was insufficient public participation in its review and approval of turbidity control measures. After further litigation, the court decided that a water quality variance was required. In 2010, the City submitted an application for variances from three water quality-based effluent limitations for turbidity difference, turbidity shutdown, and temperature. This application is still pending before NYS DEC.
The Shandaken Tunnel SPDES permit contains limits for turbidity, flow, phosphorus, temperature, and solids. The permit required the City to prepare progress reports, create an upstream monitoring location on Esopus Creek, prepare an annual monitoring data summary, and hold semiannual public meetings. The City also had to prepare a report on structural and nonstructural measures to reduce turbidity, with an associated implementation schedule.
The resulting Catskill Turbidity Control Study (see Box 1-1) produced two reports (Phase II Final Report and Phase II Final Implementation Plan; NYC DEP, 2006a,b) that recommended modified operations and the development of OST as methods for managing turbidity within and from the Schoharie portion of the Catskill system. OST was completed in November 2013, and modified operations to reduce turbidity in the Shandaken Tunnel diversions and increase cold water storage in Schoharie reservoir have been implemented.
The Nonstructural Modifications Report (NYC DEP, 2008b) contained a comprehensive evaluation of the sources of turbidity in the basin and the potential impacts of the watershed programs. The report concluded that upland sources contribute little to the turbidity at the permitted location, as contrasted with in-stream sources (i.e., stream bed and bank materials and resuspension of previously deposited sediment from upstream) that account for over 70 percent of the turbidity. It also concluded that stream management programs do not significantly affect turbidity levels at very high flows—the critical circumstances when turbidity levels most affect the Shandaken Tunnel. NYC DEP also committed to additional activities and funding levels above and beyond the specific requirements in the 2002 FAD and the 1997 MOA. Those projects were complete as of September 2012.
New York Codes, Rules and Regulations
Part 670 of the New York Codes, Rules and Regulations (NYCRR) provides New York State’s reservoir release regulations for Schoharie Reservoir,
the Shandaken Tunnel, and Esopus Creek. These requirements regulate the diversions from the Schoharie Reservoir through the Shandaken Tunnel into Esopus Creek. They are in place to protect and enhance recreational uses of Esopus Creek in a way that is consistent with and also protective of recreational uses of the Ashokan and Schoharie reservoirs, while ensuring an adequate supply of water for power production or for drinking and other purposes.
Under these regulations, New York City’s use of the Shandaken Tunnel is limited in the following ways:
- During all times of the year, the city shall divert enough water through the Shandaken Tunnel that when added to the flow of Upper Esopus Creek, as measured at the Shandaken gaging station, the combined flow is at least 160 million gallons per day (MGD). (Note: this provision is not applicable when water is spilling from the Ashokan Reservoir.)
- Between June 1 and October 31, the City cannot divert any water through the Shandaken Tunnel when the flow of Esopus Creek, or the amount of the diversion combined with the flow of Esopus Creek, exceeds 300 MGD.
These restrictions do not apply in an emergency situation when there is a threat to public health, safety, or to the safe operation of water management facilities.
Part 672 of the NYCRR implements New York State’s policy regarding releases from Ashokan, Kensico, Rondout and Schoharie reservoirs as well as the Croton system reservoirs and others. The purpose of Part 672 is to protect and enhance the recreational use of rivers and streams affected by those releases, while ensuring, and without impairing, an adequate supply of water for power production or for drinking and other purposes.
Flexible Flow Management Program
A final legal requirement affecting the New York City water supply stems from the fact that the watersheds of the Delaware system drain to the downstream states of Pennsylvania and New Jersey. Thus, releases from Pepacton, Cannonsville, and Neversink reservoirs are managed under the terms of a 1954 U.S. Supreme Court Decree that settled an interstate water dispute between New York State and New York City and the lower Delaware River Basin states. The states of New York, Pennsylvania, New Jersey, Delaware, and New York City recently approved a new Flexible Flow Management Program (FFMP) to meet water supply demands, protect downstream fisheries, enhance flood mitigation, and control upstream
intrusion of saltwater in the Delaware Estuary. The new ten-year FFMP went into effect October 20, 2017, and it relies on the subject of this report, the OST, to manage water forecasted to be available and to inform decisions related to reservoir release rates.
OVERVIEW OF SYSTEM OPERATIONS
The City is responsible for maintaining a safe and reliable water supply under a potentially wide range of operating conditions. The Bureau of Water Supply manages the system so that reservoirs are full at the beginning of the drawdown period, around June 1 of each year, to be able to meet demand for the coming year. Reservoir levels are drawn down as late as possible in the hydrologic year, defined as the 12-month period from the beginning of October to the end of September, to meet summer demands while also accommodating fall floodwaters. Operators forecast the range of inflow to each reservoir and estimate the probability of drawing the reservoirs down to undesirably low levels during the drawdown period and the probability of refilling the system by the beginning of the next drawdown period.
The reservoir system is also managed to reliably meet water quality standards. In the event that contaminants in the water rise to unacceptable concentrations, appropriate physical and/or chemical treatment strategies are undertaken.
Diversions and Releases
The City seeks to manage its operations to increase its probability of delivering sufficient water at acceptable quality to meet all demands throughout the year and minimizing the probability of unnecessarily spilling or wasting its highest-quality water. These objectives are met through a daily series of decisions on how much water to send from the reservoirs in each of the three systems (Croton, Catskill, and Delaware) to the aqueducts and how much water from each system to use to meet downstream demands and water quality standards. Decisions are driven and constrained by flow and quality targets at selected points throughout the system. If the waters from the three systems were of comparable quality at all times of the year, the City’s decision making would be based solely on flows. However, because of differences in water quality among the three systems, primarily arising from higher turbidity in the Catskill system as a consequence of storm events, system operations require decisions that account for both water-supply and water-quality targets and constraints. Figure 1-5 shows how the contribution from the three water supply systems has varied between 2006 and 2016. Operators generally seek to divert about the same
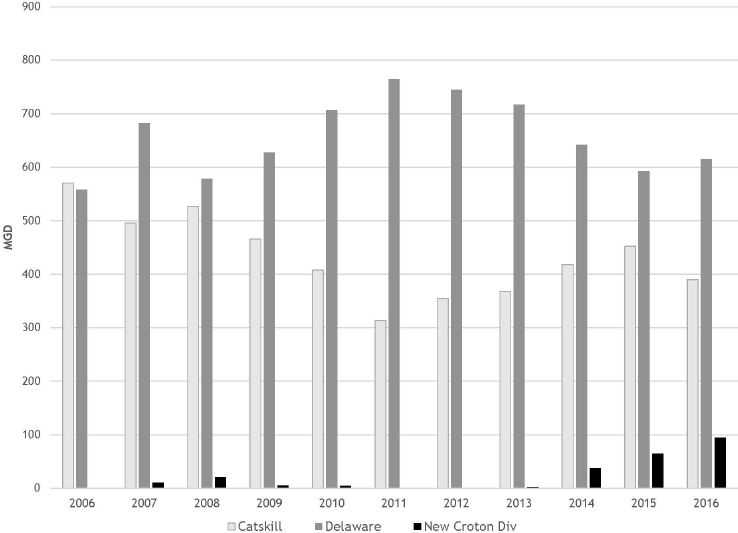
amount of water from the Delaware and Catskill systems, as was generally the case between 2006 and 2009. However, between 2010 and 2013, the Croton system was shut down for construction of the Croton Water Filtration Plant (discussed in the following section). To compensate for the loss of the Croton diversion, the City substantially increased diversions from the Delaware system, favoring it over Catskill waters when the latter’s turbidity levels were elevated as a consequence of intense storm events.
Drinking Water Treatment
The City meets drinking water requirements using many watershed management practices and programs followed by appropriate disinfection practices. Among the distinctive features of New York City’s water supply is its avoidance of the need to filter the raw water to remove suspended sediment and other contaminants coming from the Catskill and Delaware watersheds. Although EPA drinking water standards generally require filtration, New York City is the largest of the few cities in the country with a surface water supply that does not use filtration, due to the normally high
quality of the source water from its watersheds. It is the largest unfiltered water supply in the United States. The water, however, is treated using two forms of disinfection: chlorine and ultraviolet (UV) treatment. Chlorine is a common disinfectant added to kill pathogens and stop bacteria from growing in pipes. UV light inactivates potentially harmful microorganisms, such as Cryptosporidium and Giardia. The Catskill–Delaware UV Disinfection Facility, completed in 2013 and located in the towns of Mount Pleasant and Greenburgh in Westchester County, is the largest of its kind in the world. The City also adds orthophosphate via food-grade phosphoric acid, sodium hydroxide, and fluoride to the water before sending it into distribution. Orthophosphate enhances creation of a protective film on pipes that significantly helps to decrease corrosion that causes the release of metals, such as lead and copper, from service lines and household plumbing. Sodium hydroxide is added to raise the pH and reduce corrosivity, which also reduces the potential for hazardous metals to occur in the drinking water. Fluoride is added to help reduce tooth decay.
The Croton Water Filtration Plant, located underground in the Bronx, provides chemical treatment and filtration of all water from the Croton system. It has the capacity to produce up to 290 million gallons of drinking water each day, which increases the reliability of the whole system to respond to shortages created by drought or future changes in precipitation patterns. The treatment process helps to decrease disinfection byproduct formation, color levels, and the risk of microbiological contamination. As with the Catskill/Delaware supply, Croton water is also treated with phosphoric acid to control corrosion of pipes, sodium hydroxide to reduce acidity, and fluoride to prevent tooth decay.
Two other large U.S. cities that do not filter their water are sometimes compared with New York. Boston disinfects its unfiltered drinking water with ozone, chlorine, and UV. San Francisco disinfects water from its Sierra mountain watersheds with chlorine and UV, but provides full treatment with ozone and filtration for water that is stored in local reservoirs (similar to Kensico), even though the local reservoir watersheds are largely undeveloped.
Turbidity Control
The principal sources of the silt and clay that constitute the extremely high turbidity in the eastern Catskills are the ice-age deposits created in “pro-glacial” lakes that formed at the southern margin of the glaciers that repeatedly covered this region over the last 1.6 million years (NYC DEP, 2008a). Storms result in periodic high flows that cause in-stream turbidity to spike. To control turbidity in the Catskill system, the system operators use the settling capability in Schoharie Reservoir, Ashokan West
Basin, Ashokan East Basin, and the upper reaches of Kensico Reservoir. Under most circumstances, the extended detention time in these reservoirs, combined with source water protection programs, allows water quality goals for turbidity to be met. Indeed, as shown in Chapter 3, the turbidity levels in the Esopus Creek upstream of Ashokan Reservoir average about 100 nephelometric turbidity units (NTU) (with significant variability), while the turbidity in the diversion from Ashokan averages around 3 NTU and the turbidity in the diversion from Kensico averages around 1 NTU. However, following extreme storm events, and if the City declares that there is a potential imminent development of a public health hazard (raw water turbidity exceeds 5 NTU at the Kensico outflow), the City has used chemical treatment (i.e., the addition of aluminum sulfate or alum, with or without sodium hydroxide) to control high turbidity levels. Alum is added to the Catskill Aqueduct at the Pleasantville plant just prior to water reaching Kensico Reservoir, where the precipitated aluminum hydroxide and aggregated clay particles settle to the bottom. This practice has been effective in controlling the infrequent peaks of turbidity in the Catskill source water.
The City’s ongoing aqueduct system improvements, which when finished will allow blending of lower turbidity water from the Delaware system with the infrequent peaks of turbidity from the Catskill system, should minimize or eliminate the need to use alum to treat the Catskill Aqueduct input to Kensico Reservoir. The City has been committed to reducing its dependence on alum by embarking on a program to identify and implement operational strategies and infrastructure improvements to minimize the occurrence of and therefore treatment for turbidity (see Chapter 3 discussion of the Catskill Turbidity Control Study).
ORIGIN OF THE STUDY
New York City has avoided filtering the Catskill/Delaware portion of the water supply by establishing and implementing a comprehensive watershed protection plan, overseen by the NYS DOH in consultation with EPA and other state agencies. The watershed protection plan as it existed in 1999 was extensively reviewed by a committee of the National Academies, which called the watershed plan a model for communities nationwide (NRC, 2000). The National Academies’ report was pivotal in the NYC DEP’s efforts to extend its FAD from EPA.
The FAD continues to be renewed, allowing the City to deliver unfiltered water from the Catskill/Delaware portion of the supply. Because the 2007 FAD calls for the NYC DEP to further examine its control of turbidity in the Catskill portion of the water supply, the NYC DEP has been studying alternatives to minimize the use of alum prior to water reaching Kensico Reservoir to control turbidity, including both structural
improvements to the system and operational changes. The resulting reports from the Catskill Turbidity Control Study determined that certain Catskill Aqueduct improvements (e.g., improvements to existing stop-shutter installation locations) and modified operations (e.g., an increase in West Basin diversions during low turbidity and optimizing operation of the existing Ashokan Release Channel) would be the most effective and cost-effective ways to reduce dependence on alum. Implementation of these alternatives was designed to be aided by the OST, which was developed as part of the Catskill Turbidity Control Study. Indeed, OST was originally conceived as one of six recommended steps toward improving control of turbidity in the Catskill system.
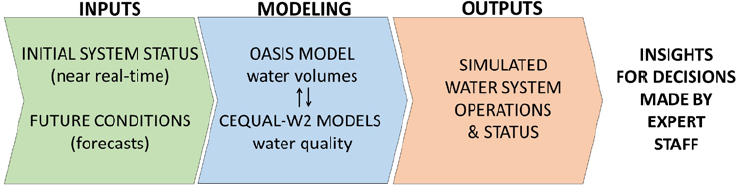
OST couples computer models of reservoir operations and water quality; it uses real-time data on streamflow, snow pack, water quality, reservoir levels, diversions, and releases; and it incorporates specialized streamflow forecasts. OST then applies all of the operating rules and laws governing reservoir operations to predict future reservoir levels, water delivery to customers, and water quality throughout the system. These predictions inform the deliberations of the system operators, who then make diversion and release decisions based on the most current data and forecasts. This sequence of data, information processing, model output, and informed operational decision making is shown in Figure 1-6.
By running OST, system operators can account for changing environmental conditions and streamflow forecasts, allowing for modification of reservoir operations, if required. In contrast to NYC DEP’s past practice of single-point hydrologic forecasts and “spreadsheet” analysis of impacts of alternative operational strategies, OST is intended to be a forecast-driven simulation and analysis tool that will provide City operators and managers with probabilistic predictions of future system status based on simulation scenarios.
To better understand why a system such as OST is needed, consider the following potential situation. Suppose that Ashokan Reservoir is rela-
tively full. The weather forecast gives a high probability of a large rainfall event taking place in the Ashokan and Schoharie Reservoir watersheds, suggesting that a very large turbidity input could occur in the Ashokan Reservoir shortly after this storm. Managers would like to avoid having this event cause the diversion of highly turbid water to Kensico or spilling large amounts of highly turbid water to the Lower Esopus Creek. The managers will want to consider, for the next few days, making maximum use of water from Ashokan to deliver water to Kensico and limiting the delivery of water from the other reservoirs. This has the advantage of providing a large amount of additional storage volume in Ashokan if this large rain event materializes. Then, they may be able to make minimal use of Ashokan water for several days after the input of the highly turbid water from that storm and draw much more of the water they need from other parts of the system. Finally, after much of the turbidity in Ashokan has settled, they could return to a more balanced delivery of water from all the reservoirs.
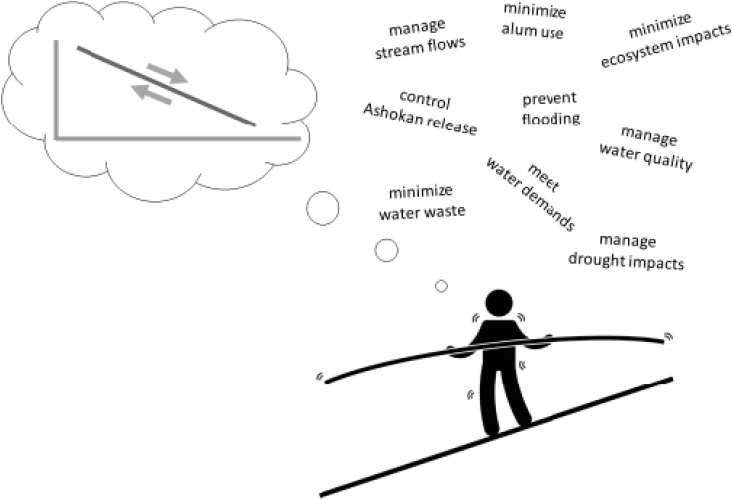
Taking this type of action in anticipation of a possible storm is likely to result in some increase in the probability of spills in other parts of the watershed. Deciding what to do in this situation is a complex task, because of these competing risks: risk of a turbidity event in water released to Lower Esopus Creek in the near term, risk of high turbidity in water diverted to Kensico in the near term, and risk of water shortage from the whole system in a time frame of many months. OST provides a formal approach to evaluating the risks of all of these outcomes (see Figure 1-7), so that water managers can make decisions that balance these various risks. OST provides information to help managers “fine-tune” their strategy for the operations in the near term, but also provides the option to revisit such decisions on a daily basis as stream and reservoir conditions change and as weather forecast information changes. This kind of analytical tool has great value in the operations of such a highly complex water resources system as the New York City water supply.
In its efforts to manage this complex system at a high level of reliability and quality and meet its many regulatory requirements and operational constraints, NYC DEP has sought outside expert review as it developed new tools or improved on existing methods. Since the City’s announcement regarding the use of OST to control turbidity in the Catskill system, the National Academies was approached to convene an independent group of experts to review the use of OST in current and future reservoir operations. The statement of task for the Academies’ study is given in Box 1-2. The results of this study, this report, include conclusions and recommendations for improving the use and utility of OST for water supply operations within the NYC DEP. This report is intended to be useful to the NYC DEP, other water supplies, EPA and state regulators, academic and consulting communities, and other stakeholders.
Report Roadmap
Chapter 2 describes and analyzes OST, discussing its strengths and weaknesses and making suggestions for how it could be improved for decision-making purposes. Chapter 3 addresses the Catskill Turbidity Control Program, particularly metrics that could be used to determine the performance of measures undertaken as part of the program. Chapter 4 considers the City’s plan to use OST as it develops an EIS for modifications to the Catalum SPDES permit. Chapter 5 discusses how future climate change in the New York region will affect the ongoing use of OST in water supply operations. Finally, Chapter 6 considers future uses of OST that go beyond its use as a daily operations decision support tool. Each chapter ends with conclusions and recommendations that synthesize more technical and specific statements found within the body of the chapter. The most important conclusions and recommendations are repeated in the summary.
Three appendices accompany the main chapters to provide the reader with details about important concepts related to OST. First, Appendix A contains the Committee’s analysis of several decades of streamflow data from seven gages in the New York City watershed. This analysis supports recommendations in Chapter 2 and is also used to provide evidence of
recent trends in climate and hydrology discussed in Chapter 5. Appendix B contains a discussion of the chain-of-models approach to conducting climate change studies. The strengths and weaknesses of this approach are the focus of two recommendations in Chapter 5. Finally, Appendix C contains a glossary of terms relevant to OST.
REFERENCES
ASDWA (Association of State Drinking Water Administrators). 2014. Opportunities to Protect Drinking Water Sources and Advance Watershed Goals Through the Clean Water Act: A Toolkit for State, Interstate, Tribal and Federal Water Program Managers. http://www.gwpc.org/sites/default/files/CWA-SDWA_11_10.pdf.
Blake, N. F. 1956. Water for the Cities: A History of the Urban Water Supply Problem in the United States. Syracuse, NY: Syracuse University Press.
Craun, G. F., S. A. Hubbs, F. Frost, R. L. Calderon, and S. H. Via. 1998. Waterborne outbreaks of cryptosporidiosis. Journal of the American Water Works Association 90(9):81–91.
EPA (U.S. Environmental Protection Agency). 2017. Water Efficiency for Water Suppliers. https://www.epa.gov/sustainable-water-infrastructure/water-efficiency-water-suppliers.
NRC (National Research Council). 2000. Watershed Management for Potable Water Supply: Assessing the New York City Strategy. Washington, DC: National Academy Press.
New York City Department of City Planning. 2013. NYC Population Projections by Age, Sex and Borough, 2010-2014. December. https://www1.nyc.gov/assets/planning/download/pdf/data-maps/nyc-population/projections_report_2010_2040.pdf.
New York City Independent Budget Office. 2000. The Impact of Catskill/Delaware Filtration on Residential Water and Sewer Charges in New York City. http://www.ibo.nyc.ny.us/iboreports/waterreport.pdf.
New York City Office of the Mayor. 2017. High Quality NYC Tap Water Receives New Filtration Waiver. Press Release. http://www1.nyc.gov/office-of-the-mayor/news/779-17/high-quality-nyc-tap-water-receives-new-filtration-waiver.
NYC DEP (New York City Department of Environmental Protection). 2006a. Phase II Final Report. Catskill Turbidity Control Study. September 30.
NYC DEP. 2006b. Phase II Implementation Plan. Catskill Turbidity Control Studies. December 31.
NYC DEP. 2008a. Evaluation of Turbidity Reduction Potential Through Watershed Management in the Ashokan Basin. November 15. http://catskillstreams.org/wp-content/uploads/2018/04/CAT_IC-_SPDES_Permit_TR_Report.pdf.
NYC DEP. 2008b. Schoharie Watershed Turbidity Reduction Report: Evaluation of Watershed Management Programs. September 1, 2007. Revised November 15, 2008.
NYC DEP. 2014 Water Demand Management Report Update. June. http://www.nyc.gov/html/dep/pdf/conservation/water_conservation_report2013.pdf.
NYC DEP. 2016. Long-Term Watershed Protection Plan. December. http://www.nyc.gov/html/dep/pdf/reports/2016_long-term_watershed_protection_program_plan.pdf.
NYC DEP. 2017. 2016 Watershed Water Quality Annual Report.
NYC DEP. 2018. One Water NYC: 2018 Water Demand Management Plan.
Rush, P. V., T. Murphy, R. A. Mayer, T. Johnstone, D. Olivio, and H. J. Woods, Jr. 2011. New York City Department of Environmental Protection Water System Safe Yield Calculation, p. 3. http://www.nyc.gov/html/dep/pdf/ffmp/water_system_safe_yield_calculation_2011.pdf.
Weidner, C. H. 1974. Water for a City. New Brunswick, NJ: Rutgers University Press.
This page intentionally left blank.


