


Below is the uncorrected machine-read text of this chapter, intended to provide our own search engines and external engines with highly rich, chapter-representative searchable text of each book. Because it is UNCORRECTED material, please consider the following text as a useful but insufficient proxy for the authoritative book pages.
1 Opening Session Welcome from the transportation research Board Neil J. Pedersen Neil Pedersen provided a welcome from the Transporta- tion Research Board (TRB) and the National Academies of Sciences, Engineering, and Medicine. He noted that TRB was pleased to host the fifth EU-U.S. Transpor- tation Research Symposium. He reviewed the topics addressed at the first four symposia, which included urban logistics, research implementation, automated road transport, and transportation resilience and adap- tation to climate change and extreme weather events. This fifth symposium builds on the resilience topic by examining the decarbonization of transport for a sus- tainable future. Pedersen noted that the topics of sustainability and resilience are important to the National Academies and TRB. He stressed the importance of the partnership between the United States and the European Union in conducting the symposia, which have enhanced trans- Atlantic cooperation, information sharing, and coordi- nation in transportation research. The symposia have provided the opportunity for individuals from public agencies, industry, and academia to discuss key issues, challenges, potential strategies, research needs, and joint activities. Pedersen reported that the results from this symposium will be used by TRB, the European Union, and other organizations in the development and conduct of critical research projects. Pedersen recognized and thanked the members of the symposium planning committee, including Cochairs Steven Cliff of the California Air Resources Board and Simon Edwards of Ricardo. Pedersen noted that Cliff was not able to attend the symposium and thanked Kate White of the California State Transportation Agency for filling in as cochair in Cliffâs absence. Pedersen praised the hard work of the planning committee in developing the scope of the symposium, identifying the white paper authors, and preparing the exploratory topic papers for the discussion groups. Additionally, he thanked Bill Anderson and Brittney Gick of TRB and Frank Smit of the European Commission for their assistance in orga- nizing the symposium. Pedersen invited symposium participants to attend the 2018 TRB Annual Meeting in Washington, D.C., on January 7 to 11. He reported that the 2017 Annual Meet- ing attracted approximately 13,300 attendees. One-fifth of the participants were international. He noted that the EU-U.S. symposia are a key part of TRBâs expanding international activities and stated that there will be a ses- sion at the 2018 Annual Meeting highlighting the topics covered at this symposium. Pedersen reported that TRB would publish the sym- posium proceedings, with Katie Turnbull from the Texas A&M Transportation Institute (TTI) acting as the rap- porteur. The proceedings summarize the presentations Neil J. Pedersen, Transportation Research Board, Washington, D.C., USA Robert Missen, Directorate-General for Mobility and Transport, European Commission, Brussels, Belgium Kate White, California State Transportation Agency, Sacramento, USA Simon Edwards, Ricardo, Shoreham-by-Sea, United Kingdom Axel Friedrich, International Council on Clean Transportation, Washington, D.C., USA David L. Greene, University of Tennessee, Knoxville, USA Graham Parkhurst, University of the West of England, Bristol, United Kingdom Seleta Reynolds, City of Los Angeles Department of Transportation, California, USA Helle Søholt, Gehl Architects, Copenhagen, Denmark
2 d e c a r b o n i z i n g t r a n s p o r t f o r a s u s t a i n a b l e f u t u r e and highlight the research topics discussed in the work- ing groups. Welcome from the european commission Robert Missen Robert Missen extended a welcome from the European Commission. He recognized the planning committee members for their hard work in organizing the sympo- sium and thanked the authors of the white paper for helping frame the topics for discussion during the break- out groups. He also thanked the participants for taking time from their busy schedules to share their ideas, expe- riences, and expertise. Missen stressed the value of the trans-Atlantic partner- ship and the interaction of researchers, scientists, agency personnel, and industry representatives from Europe and the United States. He discussed the symposium theme focusing on decarbonizing the transport system for a sus- tainable future and noted the importance of the topic in the European Union. Missen reviewed the symposium format of keynote presentations and breakout group discussions. He noted that the symposium goal was to foster dialogue and inter- action among participants. He highlighted the major objective of identifying critical research topics, including those appropriate for trans-Atlantic collaboration. Mis- sen discussed the importance of factual information for policy development and decision making. He noted that the symposium results would be of benefit and use to the European Union and to member countries. opening comments By the symposium cochairs Kate White and Simon Edwards Kate White and Simon Edwards welcomed participants on behalf of the symposium planning committee. They reviewed the purpose, scope, format, and agenda of the symposium and also discussed potential follow-up activ- ities. White and Edwards covered the topics discussed below in their presentation. White provided a welcome from Steven Cliff, Cochair of the planning committee, who was not able to attend the symposium. She noted the recent Paris Agreement and the importance of decarbonizing the transportation sector and reducing greenhouse gas (GHG) emissions. White suggested that numerous strategies are needed to accomplish these goals, including cleaner fuels, cleaner vehicles, and reduction of the demand for driving. White noted the challenge of reducing the use of private vehi- cles given the convenience, social status, and economic opportunity they provide. She suggested that a new para- digm that focuses on cleaner transportation was needed. White reviewed the symposium agenda. The first morn- ing included an opening keynote presentation, a sum- mary of the white paper prepared for the symposium, and two speakers who addressed current activities in Europe and the U.S. The morning concluded with presentations on the first two exploratory topics. The afternoon was spent in breakout group discussions of the two explor- atory topics. The second day included presentations on the final two exploratory topics, breakout group discus- sions of the topics, summary reports from the breakout groups, and a concluding keynote presentation. Edwards recognized the hard work of the planning committee in organizing the symposium. He noted that the committee, which was formed in October 2016, used two meetings and twice-monthly conference calls to identify the white paper authors, review the white paper, and develop the four exploratory topic papers. The committee also identified the keynote speakers and developed the symposium agenda. Edwards discussed the anticipated symposium fol- low-up activities. He noted that TRB would publish the symposium proceedings by the end of the year. Further, a workshop highlighting key elements from the sympo- sium would be held at the 2018 TRB Annual Meeting in January in Washington, D.C. The research topics iden- tified during the symposium would be used to develop projects in both the European Union and the United States, including those appropriate for twinning and other methods of trans-Atlantic cooperation. Edwards encouraged participants to share their ideas, experiences, and issues during the breakout groups. He further encouraged participants to identify good prac- tices and research needs, including those suited for trans- Atlantic collaboration. Keynote address transport emissions after the 21st conference of the parties Axel Friedrich Axel Friedrich discussed changes in the global climate, more frequent extreme weather events, and sea-level rise. He described potential strategies to reduce emis- sions from the transport sector. Friedrichâs presentation covered the topics outlined below. Friedrich described recent changes in the global cli- mate. He noted the increases in the global mean tem- perature estimates based on land and ocean data from 1880 to 2020. These estimates indicated that the global
3o p e n i n g s e s s i o n temperature has been increasing over the past 140 years, with increases accelerating over the past 20 years. He said that these increases are not due to natural causes, but are attributable to human actions. Friedrich described different climate change models, which all show similar general trends. He said that the similar outcomes of different models provide some con- fidence in scientistsâ projections of climate change in the future. Friedrich discussed the impact of changing tem- perature on the Arctic, noting that the Arctic summer sea ice has decreased by 40% since 1979, accompanied by increasing discharge from the Greenland ice sheet. While natural variability may explain some of the changes, the overall trend toward warming and melting has been attributed primarily to human-induced climate change. He noted this recent activity suggests a link between Arc- tic sea ice melt and increased glacier runoff in Greenland. It has been projected that if these trends continue, the Arctic could be ice-free by summer 2040. Friedrich said that the changes under way in the Arc- tic have wide-ranging consequences for the Arctic eco- systems and people living and working in the Arctic. He noted that the Arctic also plays an important role in global climate and weather, sea-level rise, and world commerce. As a result, the impacts in the Arctic reso- nate far south of the Arctic Circle. A recent economic analysis of the global costs of Arctic climate change esti- mated the cumulative cost at $7 to $90 trillion over the period from 2010 to 2100 (http://www.amap.no/docu ments/doc/Snow-Water-Ice-and-Permafrost-for-Policy- makers/1532). Friedrich reviewed elements of the United Nations World Meteorological Organization Statement on the Status of the Global Climate in 2016 (WMO 2017). WMO reported that 2016 was the warmest year on record, at about 1.1°C above the preindustrial period. Furthermore, carbon dioxide (CO2) in the atmosphere reached new levels, the extent of global sea ice declined, and global sea levels rose. Additionally, global ocean heat was the second highest on record and severe droughts and floods displaced hundreds of thousands of people. Friedrich reviewed elements of the Paris Agreement, which emphasized the urgent need to address the sig- nificant gap between the aggregate effect of partiesâ miti- gation pledges, in terms of global annual emissions of GHGs by 2020, and the aggregate emissions pathways consistent with holding the increase in the global aver- age temperature to well below the target of 2°C above preindustrial levels and with pursuing efforts to limit the temperature increase to 1.5°C above preindustrial levels. He said that it is his personal belief that it will be neces- sary to stop GHG emissions by 2025 to meet the goals, which is not likely. Friedrich noted that the increases in temperature are not evenly distributed around the globe. While a few areas are getting colder, most are getting warmer. For example, temperatures at the Arctic continue to increase. The National Snow and Ice Data Center reported that the extent of the average monthly arctic sea ice declined from 1978 to 2008. In addition, he reported, the Green- land ice mass is melting. Friedrich discussed that gla- ciers are receding rapidly worldwide, including in the Rockies, Andes, Alps, and Himalayas. He illustrated the changes in Rongbuk, the largest glacier on Mount Ever- estâs northern slopes, from 1968 to 2007. Friedrich described the increase in extreme weather events throughout the world, noting the destruction and the economic impacts of these events. He reported that for dramatic damage to be avoided, the temperature rise must be limited to the target of 2°C compared with the preindustrial level. He said that to lower the risk for exceeding the 2°C limit below 30%, CO2 reductions of 50% to 60% as compared with 1990 levels would be necessary until 2050. For industrial countries, this would mean reductions of 90% to 95% in CO2 emissions. For the European Union, this would mean a reduction from 7.4 tons per capita to 1.0 to 1.5 tons per capita of CO2 emissions per year until 2050. Friedrich discussed the difficulty of achieving these targets. He described the growing demand for oil and energy worldwide and further noted that GHG emis- sions from the transport sector continue to increase in most countries, with the largest increases being in China, India, the Middle East, and Africa. He said that continu- ing along this path would have severe consequences. Friedrich described the increase in global marine fuel consumption, noting that GHG emissions from marine transport are not covered under the Paris Agreement. He noted similar trends in increased GHG emissions in the aviation sector. Friedrich discussed the current situation in Europe, including baseline and future projections for CO2 emis- sions. He reviewed the 2050 EU GHG emissions reduc- tion targets for the transport sector, noting that GHG emissions in other sectors decreased by 15% between 1990 and 2007, while emissions from the transport sec- tor increased 36% during the same period. Even with improved vehicle efficiency, this increase resulted from an increase in personal and freight transport. Fried- man noted that GHG emissions from transport began decreasing in 2009. Despite this trend, transport emis- sions in 2012 were still 20.5% above 1990 levels and would need to decline by 67% by 2050 to meet the Euro- pean Unionâs target reduction of 60% as compared with 1990, as discussed in the European Commissionâs 2011 white paper, âRoadmap to a Single European Transport Area: Towards a Competitive and Resource Efficient Transport Systemâ (EC 2011). He said that a goal of 100% reduction of GHG emissions in the transport sec- tor was needed if the Paris Agreement target of limiting
4 d e c a r b o n i z i n g t r a n s p o r t f o r a s u s t a i n a b l e f u t u r e the increase in global average temperature to less than 2°C above preindustrial levels was to be achieved. In closing, Friedrich said that on the basis of current knowledge, emissions reductions from the freight trans- port sector could not be achieved by a continuing reli- ance on trucks that use fossil fuels. He further said that the only realistic alternative is through the major modal shift of freight transport to railroads and the complete electrification of the railway system with 100% renew- able electricity. presentation of the symposium White paper decarBonizing transport for a sustainaBle future: mitigating impacts of the changing climate David L. Greene and Graham Parkhurst David Greene and Graham Parkhurst presented the white paper prepared for the symposium, âDecarbonizing Transport for a Sustainable Future: Mitigating Impacts of the Changing Climate.â The complete text of the white paper is provided in Appendix A. Greene and Parkhurstâs presentation covered the topics summarized below. Greene suggested that the necessity of protecting the global climate system has created an unprecedented chal- lenge for transportation that poses new questions for researchers. He noted that the recent Paris Agreement reaffirmed scientistsâ long-standing view that it is criti- cal to keep increases in climate temperatures to less than 2°C to preserve current socioeconomic conditions. A 2014 report by the Intergovernmental Panel on Climate Change identified that the current trajectory of global emissions would increase the average global tempera- ture beyond the 2°C goal. Reductions in GHG emissions of 80% to 90% by the United States and the European Union by 2050 are necessary to constrain the increase in global average temperature to less than 2°C. Greene described four fundamental approaches to mitigating transportationâs GHG emissions: improving vehicle energy efficiency, reducing the carbon intensity of energy sources, reducing the level of motorized transport activity, and improving the efficiency of the transport system. He suggested that all of these approaches are needed to reduce GHG emissions. Greene noted that the Intergovernmental Panel on Climate Change defines mitigation as human interven- tion to reduce the sources of GHGs. He suggested that mitigation is essential to prevent dangerous anthropo- genic interference with the climate system. Greene noted that transportation is a major and grow- ing source of GHG emissions. The white paper provides a systems perspective, examining well to wheel, cradle to grave, and the logistics chain. The paper also describes current commitments, policies, and projected outcomes and highlights two technological solutions that focus on energy efficiency and lowcarbon energy. The white paper concludes by highlighting some of the challenges in reducing GHG emissions in the transportation sec- tor, potential measures for more radical reductions, and research questions. Greene noted that transportationâs proportion of GHG emissions in the European Union and the United States is larger than its global proportion. Transporta- tionâs GHG emissions consist almost entirely of CO2 from the combustion of petroleum fuels. Road transport is the dominant source of emissions in both the European Union and the United States. Greene reported that avia- tion and marine transport produce a larger proportion of GHG emissions in the European Union than in the United States. Greene discussed that transportationâs GHG emis- sions are linked to the entire economy. He noted that including these linkages allows for a more comprehen- sive comparison of alternatives. The well-to-wheels comparison examines the impact of the supply chain for various fuel sources, including biofuels. The cradle- to-grave comparison is a more comprehensive life-cycle analysis that includes the performance of vehicle com- ponents. The logistics chain comparison examines the energy and emissions used by different modes and facili- ties in the chain. Greene reviewed some of the different international commitments related to reducing GHG emissions. He noted that the Under2 Memorandum of Understand- ing (MOU) is a voluntary commitment by subnational jurisdictions to pursue emissions reductions consistent with a goal of reducing GHG emissions by 80% to 95% below 1990 levels by 2050, with an interim goal of 40% by 2030. The MOU also states that the parties agree to take steps to reduce GHG emissions from passenger and freight vehicles, with the goal of broad adoption of zero-emissions vehicles and the development of related zero-emissions infrastructure. The MOU also includes an agreement to encourage land use planning and devel- opment that supports public transit, biking, and walk- ing. As outlined in its 2011 white paper, the European Commission has set a goal of 60% reduction in trans- portation sector emissions from 1990 levels by 2050 and a pathway to zero-emissions transport beyond. During President Obamaâs administration, the United States had an economywide goal of a 17% reduction from 2005 levels by 2020. California has a goal of a 40% reduction from 1990 levels by 2030. Greene noted that official projections indicate that these goals will not be met in the transportation sec- tor under current policy frameworks, partially due to the projected continued growth of transportation activ-
5o p e n i n g s e s s i o n ity. He further noted that Global Energy Assessment: Toward a Sustainable Future reported that the single most important area of action was energy efficiency improvement in all sectors (IIASA 2012), adding, how- ever, that energy efficiency alone would not be enough. He reported that studies indicate that for freight and air passenger travel, greater energy efficiency is likely only to restrain the growth of GHG emissions. Greene described the estimated costs and benefits of transitioning to electric drive light-duty vehicles as reported in the National Research Councilâs Transitions to Alternative Vehicles and Fuels (NRC 2013). He sug- gested that energy transition presents a new problem for transportation policy. Potential challenges include the long transition timeframe, the uncertainty for future technologies and market conditions, and the need for policies to directly or indirectly subsidize the transition that may need to be sustained for decades. Additionally, he noted that early costs are likely to exceed potential benefits. He suggested that co-benefits can be critical to positive social benefits. Greene suggested that there are reasons for opti- mism. First, battery system costs have been dramatically reduced while energy density has increased. Further, fuel cell vehicles have moved from experimental to commer- cial products over the past 20 years. Greene emphasized that the transition to low-GHG energy systems requires answers to new research ques- tions. He suggested that a new policy paradigm for large-scale energy transition is needed to address the long transition period and the uncertainties. He described examples of transition barriers to creating strong positive feedback and tipping points. These examples included scale economies and learning by doing, majority risk aversion and lack of diversity in choice of make or model, refueling infrastructure and vehicle sales, and institu- tional and regulatory infrastructure to support markets. Greene further suggested that new methods of analysis for planning investments in vehicles and infrastructure were needed and should focus on possible government and private-sector roles in managing the co-evolution of fuel and vehicle markets and in improving the reliability of estimating the costs and benefits of a transition. Parkhurst reviewed the demand forecast to 2050 in the European Union and the United States for road trans- port, aviation, and waterborne transport. He noted that behavior change is a key to mitigating climate change. Parkhurst discussed how the difficulty of changing behavior makes achieving GHG reductions in the trans- port sector so challenging. He considered how behavior change could be increased more quickly and suggested that a better understanding of the behavior change potential of different strategies would be beneficial. Parkhurst described the CO2 emissions at the aver- age occupancy for various transport modes, noting that mode choice is critical to achieving targeted goals but that other strategies are also needed. He described the dependence on the automobile and commented that society and auto mobility represent a coevolution over decades. He noted that technological change must be part of the solution, as it is difficult to reverse the auto- mobile-oriented infrastructure and the mindset of the population. Further, progress toward the more difficult behavior change targets would also be essential. Parkhurst reviewed the portion of the white paper that examines the challenges associated with achieving GHG reductions in the transport sector. He described how the three elements of social practice theoryâmate- rials, competence, and meaningârelate to the transport sector. Parkhurst noted that access to the automobile is not equally shared. He described the use of differ- ent modes by different income levels, with higher auto- mobile use at the higher income levels. He stressed the importance of the sociocultural links to the automobile, with the obtaining of a driverâs license considered a rite of passage in many countries. Parkhurst noted that walking is the major mode of travel for destinations within 1 to 2 kilometers. He sug- gested that increasing short trips that can be made by walking or bicycling is critical for increasing low-carbon mode choice. He noted that trips over this short distance are made predominantly by automobiles and suggested that with changes in the built environment occurring relatively slowly, reducing middle-distance automobile- oriented trips, which generate most of the GHG emissions, will continue to be a challenge. Parkhurst further noted that many of these middle-distance trips are made for work, school, and other regular activities. He suggested that the planning process may overfocus on journey-to- work trips, whereas as a whole range of journey types contributes to vehicle GHG emissions. Compounding the issue is that many of these trips are not well suited for public transport. Parkhurst discussed the costs associated with own- ing and operating personal vehicles. He noted that the real cost of purchasing an automobile has decreased in Europe. He further noted that operating costs, which are largely dependent on fuel costs, have also been trending downward recently. The costs associated with passenger travel by rail, air, and water are all trending upward. Parkhurst described possible rebound effects and unintended consequences from policies and programs. He cited an example from the United States, where improvements in fuel economy driven mostly by regu- latory standards have reduced fuel consumption but appear to have increased vehicle miles of travel by a rela- tively smaller amount. Parkhurst described current knowledge about the impacts of the three options for reducing motorized transportâreducing the need to travel, encouraging
6 d e c a r b o n i z i n g t r a n s p o r t f o r a s u s t a i n a b l e f u t u r e modal shifts to higher-occupancy vehicles, and encour- aging modal shifts to zero- and ultralow-GHG vehicles. He noted that there has been less focus recently on strat- egies to reduce the need to travel. Parkhurst discussed the importance of examining experiences with different strategies in different countries. He highlighted walk- ing and bicycling rates in the European Union and the United States, which vary considerably, and noted the higher levels of cycling in Denmark and the Netherlands compared with other European countries. Parkhurst described Evidence, a 3-year EU-funded proj- ect examining the quality of information about the effects of the 22 measures recommended for local authorities implementing the European Unionâs Sustainable Urban Mobility Plan (http://evidence-project.eu/). He noted that the literature review found a good range of high-quality and high-quantity evidence for seven measures of sustain- able urban transportation, high-quality evidence for one measure, and limited quantity or quality of evidence, or both, for 14 measures. He commented that many of the measures are relevant to climate change mitigation. Parkhurst reported that the measures in the EU Sus- tainability Urban Plan that he thinks have good quantity and quality of evidence included cleaner vehicles, park- ing management, site-based travel plans, and personalized travel planning. Other measures with good quantity and quality of evidence were enhancements to public transport systems, new public transport systems, bicycling infra- structure, and environmental zones. Parkhurst noted that measures in the EU Sustainable Urban Mobility Plan that had methodologically weak or limited evidence included batteryâfuel cell electric vehicles, urban freight, access restrictions, road space reallocation, and congestion charges. The evidence for measures that addressed mar- keting and rewarding the integration of modes, e-ticketing, traffic management, travel information, new models of car use, walking, bikesharing, and inclusive urban design was also limited or methodologically weak. Parkhurst stressed that in some cases, the evidence was limited because the measure had only recently been adopted and evaluation information had not yet emerged. Parkhurst highlighted examples of the impacts identi- fied with a few measures. He noted that Measure 8, which addresses the use of parking policy as a tool for managing car traffic in and around urban areas, has been widely researched, with approximately 2,000 studies reviewed. Parkhurst reported that, on balance, the findings sug- gested that parking management itself does not have nega- tive economic impacts, but that efficiency is enhanced by cash-out programs, pricing, and tax policies. He noted that the UK had the best-quality studies on Measure 9, which focuses on mobility management strategies for an organi- zation and its site or sites. This measure seeks to reduce single-occupancy automobile use to, from, and around a site and to increase use of alternative modes. Evidence from the UK studies indicates that single-occupant auto- mobile trips may be reduced by up to 18%, with indirect economic benefits from increased active travel. Parkhurst noted that one of the best studies addressing Measure 20, which focuses on new bicycle lanes on roadways and new off-road paths, was from North Carolina, where a large, 10-year investment in a new bicycling network returned a benefitâcost ratio of 9:1. Parkhurst described the emergence of smart mobility or transportation network companies (TNCs), such as Uber and Lyft. He suggested that more research is needed on the impacts of these services but observed that UberPool in San Francisco reported recently that 50% of trips are shared. He noted that the impact of bikesharing also needs further research; the most successful of these programs indicate an automobile substitution rate of approximately 20%. Noting that urban areas produce only 23% of total EU transportation GHG emissions, Parkhurst suggested that research and policies may also need to consider mobility management and behavior change for long dis- tances and international freight transport and air travel. He noted that further discussions on the impacts of these modes would be beneficial. Parkhurst discussed the potential impacts of autono- mous vehicles on GHG emissions. He noted that the 2015 EU-U.S. Symposium was on automated road transport. He described the shared vehicle delivery model, which in theory, in optimal conditions, might require only 10% to 20% of the vehicles currently in operation. Parkhurst described the results of a recent study conducted in Bris- tol, UK, that asked automobile users about their willing- ness to use autonomous vehicles in different modalities. Approximately half the respondents reported they would use an autonomous vehicle. However, 65% reported a normal automobile as their first preference, and 25% reported an exclusive use, private autonomous vehicle as their first choice. The shared options attracted few first preferences. Parkhurst suggested more research was needed on the behavioral impacts of autonomous vehicles. Parkhurst concluded by noting that the evolving con- text of mobility choices creates opportunities and threats that research could illuminate. He presented the follow- ing research questions from the white paper for discus- sion in the breakout groups: ⢠How do citizens and organizations respond to changes in the mobility context? Can the connections between choices and consequences be strengthened? ⢠How can the new private-sector mobility solutions be integrated effectively into a public policy framework? What is the future role of traditional public transport? ⢠How will changing mobility options alter the met- rics for monitoring and validating GHG reductions? ⢠What are the GHG mitigation options for managing travel behavior for extraurban and intercontinental travel?
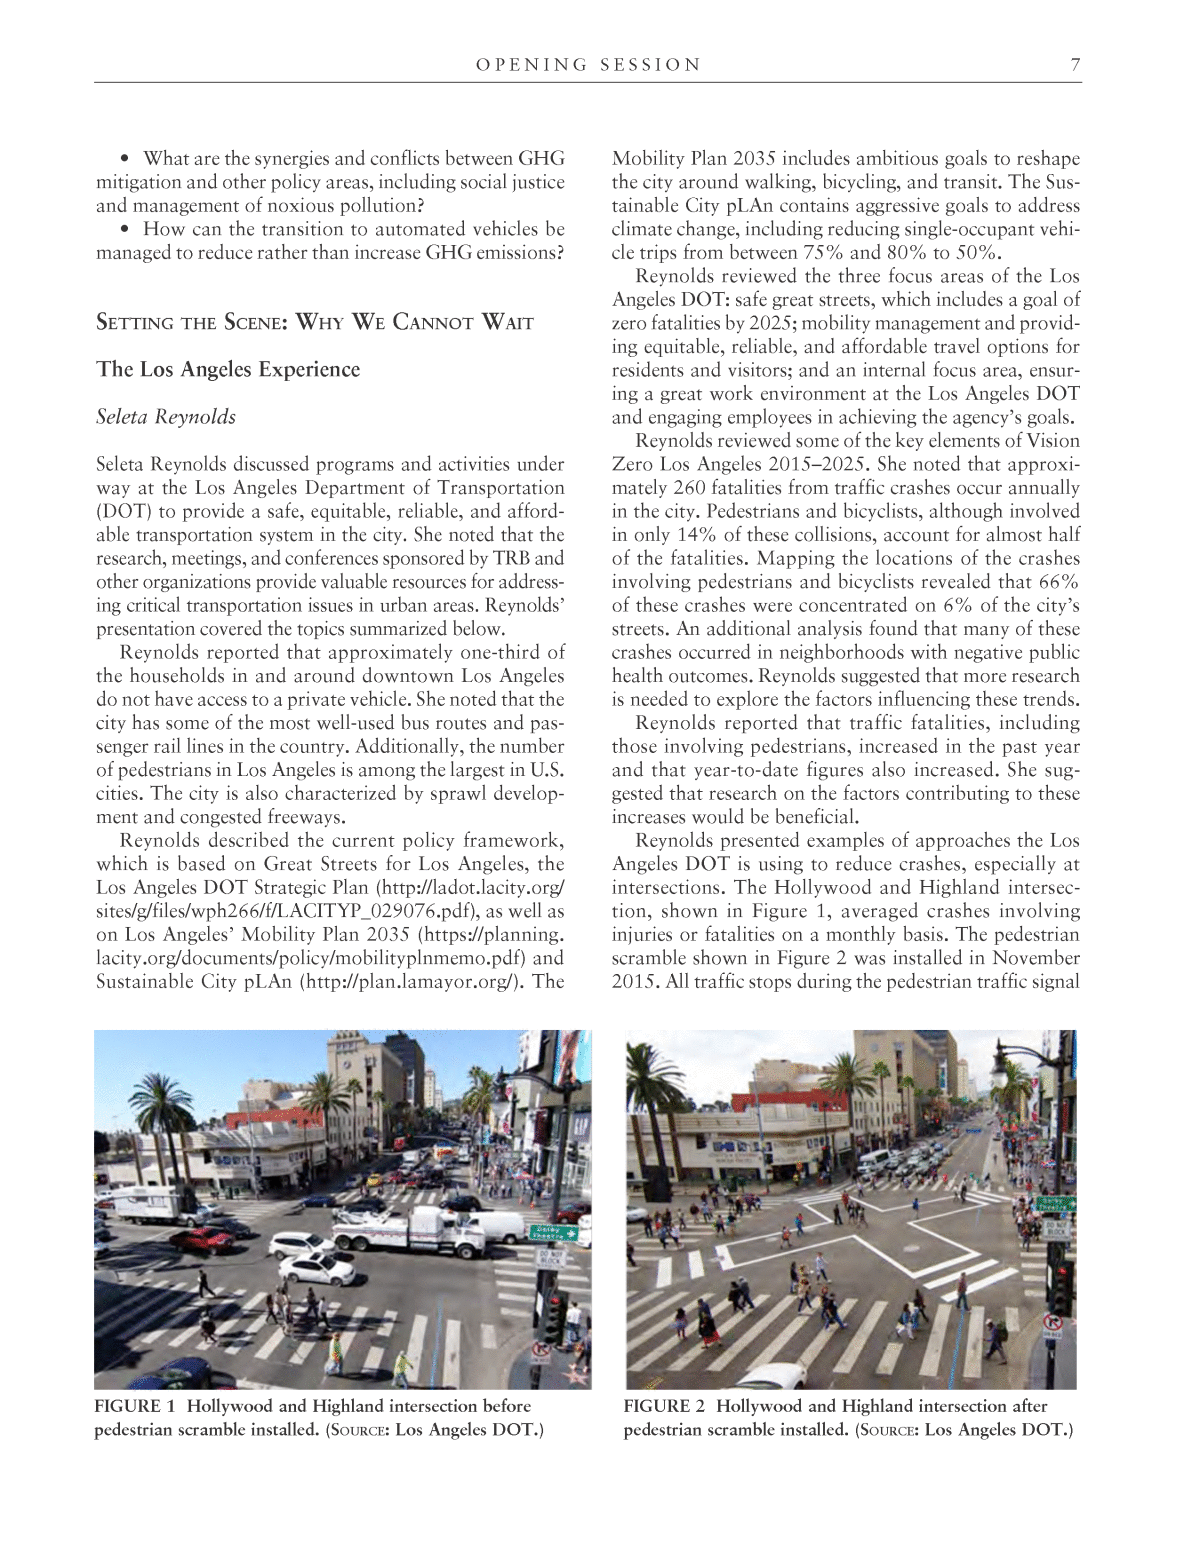
7o p e n i n g s e s s i o n ⢠What are the synergies and conflicts between GHG mitigation and other policy areas, including social justice and management of noxious pollution? ⢠How can the transition to automated vehicles be managed to reduce rather than increase GHG emissions? setting the scene: Why We cannot Wait The Los Angeles Experience Seleta Reynolds Seleta Reynolds discussed programs and activities under way at the Los Angeles Department of Transportation (DOT) to provide a safe, equitable, reliable, and afford- able transportation system in the city. She noted that the research, meetings, and conferences sponsored by TRB and other organizations provide valuable resources for address- ing critical transportation issues in urban areas. Reynoldsâ presentation covered the topics summarized below. Reynolds reported that approximately one-third of the households in and around downtown Los Angeles do not have access to a private vehicle. She noted that the city has some of the most well-used bus routes and pas- senger rail lines in the country. Additionally, the number of pedestrians in Los Angeles is among the largest in U.S. cities. The city is also characterized by sprawl develop- ment and congested freeways. Reynolds described the current policy framework, which is based on Great Streets for Los Angeles, the Los Angeles DOT Strategic Plan (http://ladot.lacity.org/ sites/g/files/wph266/f/LACITYP_029076.pdf), as well as on Los Angelesâ Mobility Plan 2035 (https://planning. lacity.org/documents/policy/mobilityplnmemo.pdf) and Sustainable City pLAn (http://plan.lamayor.org/). The Mobility Plan 2035 includes ambitious goals to reshape the city around walking, bicycling, and transit. The Sus- tainable City pLAn contains aggressive goals to address climate change, including reducing single-occupant vehi- cle trips from between 75% and 80% to 50%. Reynolds reviewed the three focus areas of the Los Angeles DOT: safe great streets, which includes a goal of zero fatalities by 2025; mobility management and provid- ing equitable, reliable, and affordable travel options for residents and visitors; and an internal focus area, ensur- ing a great work environment at the Los Angeles DOT and engaging employees in achieving the agencyâs goals. Reynolds reviewed some of the key elements of Vision Zero Los Angeles 2015â2025. She noted that approxi- mately 260 fatalities from traffic crashes occur annually in the city. Pedestrians and bicyclists, although involved in only 14% of these collisions, account for almost half of the fatalities. Mapping the locations of the crashes involving pedestrians and bicyclists revealed that 66% of these crashes were concentrated on 6% of the cityâs streets. An additional analysis found that many of these crashes occurred in neighborhoods with negative public health outcomes. Reynolds suggested that more research is needed to explore the factors influencing these trends. Reynolds reported that traffic fatalities, including those involving pedestrians, increased in the past year and that year-to-date figures also increased. She sug- gested that research on the factors contributing to these increases would be beneficial. Reynolds presented examples of approaches the Los Angeles DOT is using to reduce crashes, especially at intersections. The Hollywood and Highland intersec- tion, shown in Figure 1, averaged crashes involving injuries or fatalities on a monthly basis. The pedestrian scramble shown in Figure 2 was installed in November 2015. All traffic stops during the pedestrian traffic signal FIGURE 1 Hollywood and Highland intersection before pedestrian scramble installed. (source: Los Angeles DOT.) FIGURE 2 Hollywood and Highland intersection after pedestrian scramble installed. (source: Los Angeles DOT.)
8 d e c a r b o n i z i n g t r a n s p o r t f o r a s u s t a i n a b l e f u t u r e phase and pedestrians may cross in any direction. Reyn- olds reported that there have been no injury collisions or fatalities at the intersection since the pedestrian scramble was installed. Reynolds described a second approach in which painted strips and a bollard are added to an intersection to create more visible space for pedestrians. Figures 3 and 4 show the application of this approach on Cesar Chavez Street in the Boyle Heights neighborhood. Reyn- olds noted that crash reductions have been realized at this intersection, but not to the same extent as achieved with the pedestrian scramble treatment. Reynolds sug- gested that more research is needed to compare the results of different treatments and identify keys to suc- cessful implementation. Reynolds reviewed the results from recent focus groups and surveys examining the perceptions of trans- portation projects in the city, including bicycle facilities. She noted that there has been âbikelash,â or backlash against bike lanes in some areas. In one survey, a total of 50% of the survey respondents strongly agreed that bike lanes were beneficial to the city, with only 9% strongly disagreeing. The responses changed, however, when respondents were asked if bike lanes were benefi- cial for them, with only 39% strongly agreeing and 17% strongly disagreeing. Further, while 61% of the respon- dents strongly agreed, and 7% strongly disagreed, that government should make biking safer for everyone, only 46% strongly agreed that bike lanes should be added to more streets, while 15% strongly disagreed. Suggesting that transportation professionals needed a new language to communicate with the public, Reynolds described some of the negative words people associate with responses to climate change and possible mitigation measures. She noted that using terms related to orga- nized, comfortable, and safe streets seems to resonate bet- ter with the public. She also stressed the need to listen to people, to understand their concerns, and to learn what improvements and changes they would like. Reynolds described the Los Angeles DOT People Street program, which can transform underutilized streets into parks and other activities on the basis of community input. Figures 5 and 6 illustrate one example of this approach in Leimert Park in South Los Angeles. She also described the Play Streets Program, which temporarily closes streets to traf- fic and sets up play equipment. She reported that the response to both programs has been very positive. Reynolds described job accessibility by transit and by automobile in the city. Currently, 12 times as many jobs can be reached by automobile in an hour as by transit. She stressed that transportation has to provide people with connections to opportunities. She compared the reach of the Metrorail system with the service areas of Uber and other transportation network companies (TNCs). Much of the TNC service area also has frequent bus and rail service. She noted that research is needed to examine the impact of TNCs on transit use, bicycling, and walking. Although there is a lot of anecdotal evidence, accurate information on the possible impacts of TNCs on these modes and on traffic congestion is lacking. Reynolds also discussed the possible impacts of auto- mated vehicles on the city. A transportation technology strategy for Los Angeles has been developed. This strategy, presented in the report Urban Mobility in a Digital Age: A Transportation Technology Strategy for Los Angeles, presents a framework or platform for innovation (Hand 2016). The platform focuses on setting public policy and structuring investments to prepare for the arrival of con- FIGURE 3 Cesar Chavez Street before installation of treatment. (source: Los Angeles DOT.) FIGURE 4 Cesar Chavez Street after installation of treatment. (source: Los Angeles DOT.)
9o p e n i n g s e s s i o n nected, automated, shared, and electric vehicles. The five elements include building a solid data foundation, lever- aging technology and designing for a better transporta- tion experience, creating partnerships for more shared services, supporting continuous improvement through feedback, and preparing for an automated future. The platform also includes data as a service, infrastructure as a service, and mobility as a service. Reynolds described possible elements of data as a ser- vice, which focuses on the rapid exchange of real-time data on transportation conditions. Information may be exchanged between customers, service providers, gov- ernment agencies, and the infrastructure to optimize safety, efficiency, and the transportation experience. Data-sharing agreements with Waze and other similar companies are one example of this approach. Infrastructure as a service focuses on a dynamic pay- as-you-go approach to more closely align the costs of providing infrastructure with how it is used. Providing improved information on on-street parking schedules and costs, along with more convenient payment meth- ods, is an example of the approach cited by Reynolds. Reynolds suggested that temporary infrastructure, such as creating temporary pop-up bike lanes, may play a more important role in the future. Reynolds described the mobility-as-a-service approach, which includes access to a suite of transporta- tion mode options through a single platform and payment to simplify access to mobility choices. The LA Promise Zone will provide one example of this approach. Using funding from several sources, the LA Promise Zone will include car-sharing services in a low-income community and building mobility hubs that bring together carshar- ing, bikesharing, taxis, and transit. It will also include community enhancements and treating residents with respect. Reynolds noted that all of these approaches will help mitigate climate change and improve safety, equity, mobility, and quality of life in the region. She also noted the importance of ensuring that current residents can continue to afford to live in neighborhoods that experi- ence these improvements. The Importance of the Social Infrastructure in Cities Helle Søholt Helle Søholt discussed the influence of the built environ- ment and the social infrastructure on behavior change and mobility in cities. She provided examples of projects in Copenhagen and New York City to enhance streets and public spaces. Søholtâs presentation covered the top- ics summarized below. Søholt noted that Gehl approaches projects both as social scientists and as designers. She described the importance of using surveys, focus groups, and other methods to gain better insights into peopleâs travel behavior, especially walking and bicycling trips. With cities accounting for approximately 97% of new trips globally, Søholt stressed the challenge of building cities for all segments of society. She described the fabric of cities, including public spaces. Streets, sidewalks, and parks are all part of the public space. Søholt highlighted some of the keys to success in the mobility approaches used in Copenhagen, including incremental change, focusing on hardware and soft- ware, single-agency oversight, and the use of metrics that reflect local values. She suggested that elements of public life in the city include equity and health. Public space FIGURE 5 Leimert Park before plaza treatment. (source: Los Angeles DOT.) FIGURE 6 Leimert Park after plaza treatment. (source: Los Angeles DOT.)
10 d e c a r b o n i z i n g t r a n s p o r t f o r a s u s t a i n a b l e f u t u r e elements focus on streets, parks, playgrounds, and the harbor. Walking, bicycling, transit, and passenger rail are key elements of an integrated transport system that provides mobility to all groups. Søholt noted that vehicle emissions have been reduced by 50% in Copenhagen. She described the incremen- tal changes and continual improvements in bicycle and pedestrian facilities in the city. The steady increase in the bicycle lane network since the 1930s is one example of this incremental approach. The network is consistent with the bike lanes and bike track always located on the right-hand side of the roadway. Søholt described the culture of cycling in Copen- hagen. She summarized information from a document called Copenhagen City of Cyclists: Bicycle Account 2010, including the results from surveys of bicyclists in the city. One of the questions asked respondents why they cycled. The most frequently cited reason, reported by 63% of the respondents, was that cycling was easy, fast, and convenient. Other responses were exercise (17%), financial reasons (15%), and the environment (5%). In addition, 70% of the respondents reported that they continue to bike in the winter. Søholt discussed the importance of developing a shared understanding of roadway use among motor- ists and bicyclists. She noted that approximately 66% of all motorists in Copenhagen are also cyclists and that 33% of cyclists are also motorists. Søholt reported that although there was a 50% increase in automobile ownership over the past 10 to 15 years, there also was an increase in cycling. Additionally, she reported that approximately 25% of families with two or more chil- dren own a cargo bicycle. Søholt described the integra- tion of the bicycle network with other modes, including allowing bicycles on local trains. Søholt outlined the benefits of having a single agency responsible for the bicycle network. The City of Copen- hagen has control over the design, development, and operation of the roadway system, including the bicycle network. She compared this approach with areas in Miami, where agencies at the city, county, and state lev- els have responsibility for different aspects of the road- way and bicycle systems. Søholt described some of the policies, plans, and met- rics used in Copenhagen that reflect community values. Goals focus on increasing walkability, increasing the amount of time people spend using public spaces, and increasing satisfaction with urban life. Søholt provided examples of transferring the Copen- hagen model to New York and other cities. She described projects in New York City to transform streets from focusing solely on automobiles to focusing also on pedestrians and bicyclists. She highlighted the change in Times Square from 89% road space and 11% peo- ple space to 100% people space. She noted that design can change behavior and urban culture. She described some of the benefits from the Times Square project, which include a 17% improvement in travel time, an 11% increase in pedestrian numbers, a 63% decrease in pedestrian injuries, and 80% fewer pedestrians walk- ing in the street. Additionally, 74% of individuals who completed a survey reported that Times Square had improved dramatically. Søholt discussed the link between mobility and affordability. She noted that approximately 75% of the 100 largest cities in the U.S. do not meet the 15% open space guideline. Further, many low-income and minor- ity neighborhoods lack open space. Søholt described the New York City Plaza Program, which provides funding through a competitive appli- cation process to transform underutilized streets into plazas and public spaces. The program partners with community groups that commit to operate, maintain, and manage the public space. She noted that over the past 10 years, the program has created more than 60 plazas in the city. She reported that surveys conducted by the Gehl Institute indicate that lower-income indi- viduals are more likely to make new connections with other people through the plazas. In closing, Søholt presented four challenges for the future and possible solutions: ⢠The infrastructure built in the 1960s, which cre- ates barriers rather than connections in communities and which is in need of repair. A possible solution is to remove and renovate this infrastructure to enable social and physical connectivity and to enhance mobility. ⢠The lack of low-carbon infrastructure (i.e., infra- structure that, for example, reduces carbon emissions and decreases urban congestion). The absence of low- carbon infrastructure contributes to urban health con- cerns. A possible solution to this challenge would be connecting public health policies to the creation of low- carbon infrastructure. ⢠Action driven by top-down decision making. Søholt suggested addressing this challenge by reversing the trend so as to establish action driven by bottom-up input. ⢠The fracturing of communities by regulatory boundaries. A possible solution would be for federal agencies to act as facilitators to promote coordina- tion between cities and counties. Søholt commented that a better method for enabling input from citizens, community groups, advocacy organizations, and local agencies was needed for developing future urban trans- port systems. Søholt suggested that addressing these four challenges would make cities livable, equitable, and connected places for people.
11o p e n i n g s e s s i o n references Abbreviations EC European Commission IIASA International Institute for Applied Systems Analysis NRC National Research Council WMO World Meteorological Organization EC. 2011. Roadmap to a Single European Transport Area: Towards a Competitive and Resource Efficient Transport System. Brussels, Belgium. https://ec.europa.eu/transport/ themes/strategies/2011_white_paper_en. Hand, A. Z. 2016. Urban Mobility in a Digital Age: A Trans- portation Technology Strategy for Los Angeles. City of Los Angeles, Office of the Mayor and Department of Transportation, Calif. IIASA. 2012. Global Energy Assessment: Toward a Sustain- able Future. Cambridge University Press, Cambridge, UK, and New York, and the International Institute for Applied Systems Analysis, Laxenburg, Austria. NRC. 2013. Transitions to Alternative Vehicles and Fuels. National Academies Press, Washington, D.C. https://doi .org/10.17226/18264. WMO. 2017. Statement on the Status of the Global Climate in 2016. https://public.wmo.int/en/resources/library/wmo- statement-state-of-global-climate-2016.
12 Presentation of Exploratory Topics and Suggested Research Needs Daniel Kreeger, Association of Climate Change Officers, Washington, D.C., USA Malin Andersson, Urban Transport Administration, City of Gothenburg, Sweden Timothy Sexton, Office of Environmental Stewardship, Minnesota Department of Transportation, Saint Paul, USA Oliver Lah, Wuppertal Institute for Climate, Environment, and Energy, Wuppertal, Germany Ray Toll, U.S. Navy (ret.) and Old Dominion University, Norfolk, Virginia, USA Delia Dimitriu, Manchester Metropolitan University, Manchester, UK Kate White, California State Transportation Agency, Sacramento, USA Simon Edwards, Ricardo, Shoreham-by-Sea, United Kingdom This section summarizes the presentation of the exploratory topic papers by the symposium planning committee members. The summaries of suggested research topics discussed in the breakout groups, as presented by the planning committee mem- bers, are also highlighted. The presentations and break- out groups followed a common format. The exploratory topic papers were presented in general sessions. Sym- posium participants discussed challenges and opportu- nities and potential research needs in breakout groups, which were facilitated by the planning committee mem- bers. There was no intent to rank or rate the research ideas discussed, nor was there any attempt to prioritize the potential research topics. The planning committee members presented summaries of the breakout group discussions in the general session prior to the closing speaker. exploratory topic 1 BreaKing silos and human cocreation on multiple levels: the Key to transforming the current sociotechnical transport system regime? Daniel Kreeger and Malin Andersson Daniel Kreeger and Malin Andersson discussed the first exploratory topic area, which focused on breaking down silos and on human cocreation on multiple levels as a key to transforming the current sociotechnical transport system regime. The paper on this exploratory topic is provided as Appendix B. Kreeger and Anderssonâs pre- sentation covered the points summarized below. Andersson discussed that the transportation system is essential for peopleâs daily lives. Automobiles, buses, trams, passenger rail, walking, bicycling, ferries, and other modes provide people with mobility throughout the world. She noted that although it is known that vehi- cles burning fossil fuels contribute to global warming and have other negative impacts, people continue to use them. Additionally, she questioned why new solutions are not penetrating the transport system and why change is so difficult. Andersson described the sociotechnical system of transportation, which includes transport regulations and policies, the maintenance and distribution system, the production and industry structure, markets and user practices, the fuel infrastructure, the road infrastructure, and cultural and symbolic meanings. She noted that thinking outside the box challenges current perspectives and challenged symposium participants to think outside the box during the breakout group discussions. Andersson discussed the importance of supporting elements for successful policies and changes in behavior. She noted the challenge of overcoming the status quo and the difficulty of identifying the main obstacles for change in the transport system. She compared the poten- tial obstacles to Russian nested dolls, noting that for
13p r e s e n t a t i o n o f e x p l o r a t o r y t o p i c s each obstacle you overcome, there is another obstacleâ or dollâat another level. Andersson reviewed the four areas identified in the exploratory topic paper that may present obstacles and opportunities for change: leadership and human capital, the effects of bold political action, the valley of death for new business opportunities, and the power of conve- nience paired with a fear of the unknown. Andersson discussed needed leadership and human capital for innovation in the transport sector. Kreeger asked participants to consider the following situation: in 30 years, gravity is either 30% stronger or 30% weaker. He noted that either change would have significant impacts on the world as known today. Kreeger suggested that the transport system has been built on the basis of the notion that everything about the world is predict- able, stable, and consistent. Any variance is assumed to be within an acceptable range. He further suggested that these assumptions are no longer valid. Kreeger identified the changes in leadership and human capital that will be needed to adjust to this new situation as one topic for discussion in the breakout groups. Andersson described a second area for discussion in the breakout groups that focused on the need for bold political action, citing the example of removing parking spaces in city centers. She noted the difficulty of intro- ducing new and innovative strategies and programs in the transport sector. Kreeger suggested that all political actions require public understanding. He further sug- gested that policies addressing greenhouse gas (GHG) emission reductions are unsustainable without a public understanding of climate change. He identified a ques- tion for discussion in the breakout groups that related to methods for developing public understanding of climate change and support for changes in behavior. Andersson discussed approaches for new business opportunities to bridge the valley of death in introduc- ing innovative transport products and services. She cited Uber as one example, noting that some customers have expressed satisfaction that, in some markets, local regula- tions have excluded Uber from operating. She suggested that the solution does not âfit in the Russian doll.â Kreeger noted the importance of addressing the poten- tial for unintended consequences when new programs are implemented, for example, the consequences of transpor- tation network companiesâ use of high-emissions vehicles. Andersson discussed the final area for discussion in the breakout groups: identifying ways to overcome the potential inconvenience and unknowns of new services and program. She used the introduction of electric buses in the city of Gothenburg and the unknowns associated with the charging requirements of electric buses as one example of addressing new technologies. In closing, Andersson and Kreeger stressed the need to address innovation in the transport sector as a complex problem that requires a diversity of solutions. They also highlighted the importance of the participation of pub- lic- and private-sector groups in the development and implementation of new policies and programs. Suggested Future Research The participants in the breakout groups identified ideas for future research related to Exploratory Topic 1, breaking down silos and transforming the current socio- technical transport system. These ideas are listed below. The research ideas were detailed in the closing session by the planning committee members responsible for the exploratory topic. In addition, the rapporteur reviewed notes from the breakout groups in developing the fol- lowing list. ⢠Explore the travel behavior of the millennial and the digitalized generations. Identify changes from the travel behavior of older generations and assess the poten- tial impacts on mode use, vehicle miles traveled, and GHG emissions. Examine decarbonizing policies and programs that may appeal to these younger generations. ⢠Examine the co-benefits from transport decarbon- ization policies and programs and how they relate to fac- tors that people value, such as quality of life and livable communities. Explore messages that focus on the co- benefits rather than the mitigation programs themselves. ⢠Examine whether areas that are prone to flooding or other impacts of extreme weather events are more pro- active in developing and implementing mitigation poli- cies and programs. The research could include assessing the perceptions of residents and policy makers, the actual mitigation policies and programs implemented, and les- sons that could be shared with other areas. ⢠Examine current public knowledge of climate change, GHG emissions, and policies and strategies for decarbonizing transport. Identify the most effective com- munication messages and techniques for addressing the need for mitigation strategies and the potential benefits. Identify best practice examples and develop approaches for use in different situations and with different groups. ⢠Examine policies and programs supporting bicycle use and identify the most effective approaches for dif- ferent areas and situations. The analysis could include policies and programs, such as bikesharing, and infra- structure, including bike lanes, bike paths, bike stations, and other facilities. ⢠Assess the potential impacts on current jobs and possible training and retraining needs associated with different elements of decarbonizing the transport sector. Examine changing workforce skills associated with elec- tric vehicles, other alternative fuels, mitigation strategies, and assessment techniques.
14 d e c a r b o n i z i n g t r a n s p o r t f o r a s u s t a i n a b l e f u t u r e ⢠Examine stakeholder involvement techniques used with transport mitigation strategies. Identify methods to actively engage all groups in the discussion of reduc- ing GHG emissions and the development of mitigation policies and programs. Explore ways to break down silos and work across agencies, organizations, and the private sector. Share best practice examples. ⢠Conduct pilots and demonstrations of different mitigation strategies. Document the results and share best practices and lessons learned with others. ⢠Explore the role of different leadership styles, including inclusive leadership, in developing and imple- menting mitigation programs. ⢠Collect and share best practice examples of miti- gation programs between the European Union and the United States. Use information and databases developed for recent projects, such as the Evidence Project, and col- lect recent experiences. ⢠Examine the steps and actions needed to transi- tion to a mostly electric or renewable fuels transport system. Consider the roles of the public and private sectors, publicâprivate partnerships and other finan- cial models, and implementation methods. Analyze potential transition paths, scalability, and uncertainty. Explore the infrastructure, policy changes, funding, and other resources needed in the transition. ⢠Assess current forecasting methods for transport GHG emissions and mitigation strategies. Explore the use of backcasting methods for application in transport planning. Examine the use of economic analyses with mitigation strategies. ⢠Examine the impact on funding from changes to electric vehicles and renewable fuels. Explore how these changes will influence the reliance on fuel taxes and iden- tify other potential funding sources. ⢠Assess how changes to electric vehicles and renew- able fuels will influence different industries and the pos- sible social impacts and consequences for consumers. Explore potential unintended consequences. exploratory topic 2 the influence of policy environment factors on climate change mitigation strategies in the transport sector Timothy Sexton and Oliver Lah Timothy Sexton and Oliver Lah discussed the second exploratory topic, which addressed the influence of policy factors on climate change mitigation strategies in the transport sector. They discussed building coalitions and developing policies with co-benefits to help promote actions to reduce GHG emissions and offered questions to help frame the breakout group discussions on this topic. The paper on this exploratory topic is provided as Appendix C. Sexton and Lahâs presentation covered the points summarized below. Lah described the different policy environments in the United States and the European Union. He noted a previ- ous comparison of the United States and the European Union that drew on the fable of the tortoise and the hare. The United States was the hareâfast and agile, moving quickly in one direction and then quickly moving in a different direction, with periodic naps. The European Union was the tortoiseâsteady, slow, and headed in one direction. He commented that sharing policy approaches and results was still beneficial, even with these different environments. Lah described concerted policy integration and con- sensus-driven governance. He outlined a conceptual approach based on concerted or fragmented policy inte- gration and minimal majority or multiactor coalition governance: ⢠Concerted policy integration with a minimal majority results in limited mitigation actions through a comprehensive and ambitious policy agenda and mini- mal majority coalitions for specific actions that are based on political support from progressive parties. ⢠Concerted policy integration with multiactor coali- tions provides integrated polices, including local- and national-level measures, implemented by multilevel, multiactor coalitions based on broad consensus. ⢠Fragmented policy integration with a minimal majority would result in some efficiency gains, but very little mitigation. There would be little action beyond incremental technology improvements, with no majori- ties for climate change mitigation actions. ⢠Fragmented policy integration with multiactor coalitions would result in limited mitigation actions through singular measures at the local or national levels or both, with implementation depending on the author- ity of the actors and minimal majorities, as well as coali- tions between some political actors. Lah discussed coalitions for implementing long-term climate change and mobility strategies. He noted that consensus is required on the need for policy measures and on specific strategies. Additionally, he noted the benefits of a strategic, coherent, and stable operating environment. Lah cited the importance of a strong political com- mitment to a policy agenda, even when investments are only cost-effective over the mid- to long-term. He noted that linking and packaging policies can generate synergies and co-benefits between measures, including linking GHG reductions with other sustainable devel- opment goals. He further suggested that an integrated
15p r e s e n t a t i o n o f e x p l o r a t o r y t o p i c s policy approach with coalitions of diverse stakeholders can help overcome implementation barriers, minimize rebound effects, and motivate people, businesses, and communities. Lah noted that low-carbon fuels play a key role in the decarbonization of the transport system but that other strategies reflect a broader sustainable transport perspective. He described the GHG mitigation poten- tial and some of the possible co-benefits with different strategies. For example, compact cities and mixed-use developments may reduce trip distance and travel times, provide more equitable access to all groups, and improve air quality, public health, and safety. Lah described some of the governance factors for the success of sustainable development and climate change policies. One factor was political continuity and societal consensus to enable policy considerations and ensure sta- bility. A second factor was an integrated policy approach combining various measures to provide a basis for politi- cal coalitions. He also noted that political continuity and policy integration efforts are affected by the institutional context and the policyâoperating environment. Lah outlined possible elements of a multimodal, multi- level sustainable transport package. Examples of measures at the national level included fuel taxes, vehicle fuel effi- ciency regulation, and vehicle taxes based on fuel efficiency or carbon dioxide emissions. Complementary measures included vehicle standards to ensure a supply of efficient vehicles, taxation to help steer consumer behavior, and fuel taxes to encourage efficient use of vehicles. Examples of local and state measures included compact city design and integrated planning, public transport, walk and bike infrastructure, and parking pricing. Possible complemen- tary benefits included shorter trips, affordable access, and increased revenues. Lah discussed policy continuity and consensus. He noted that interactions between different levels of gov- ernment on climate change policy may vary between key political and societal actors. He suggested that shared methods and values can help mitigate political volatil- ity and that knowledge communities can play important roles in generating consensus on major policy issues. Lah discussed policy integration and coalition build- ing. He suggested that combining policy measures can create a basis for coalitions and long-term climate action strategies. He also noted that synergies between socio- economic and political objectives can help overcome opposition. Lah described the benefits of involving all groups, including those who may not favor an approach, and incorporating their policy objectives into the process. Sexton provided an example from the United States. He noted that the Minnesota Department of Transporta- tion (DOT) recently adopted a statewide goal to reduce GHG emissions from the transportation sector by 30%. He noted that one of the challenges in meeting this goal is that the Minnesota DOT does not have authority over county and local roads. The Minnesota DOT also does not have control over all federal and state transporta- tion funding. To achieve the 30% reduction in GHG emissions, Sexton reported, the Minnesota DOT real- ized the need to form coalitions horizontally with other state agencies and vertically with local and federal agen- cies. He suggested that while forming and maintaining these coalitions takes time and resources, it is critical for achieving the desired goal. Lah suggested that characteristics of both the tortoise and the hare are needed in policy making. He noted that steadiness is beneficial in policy approaches but that quickness and agility are also needed to respond to rapidly changing conditions and to take advantage of opportunities as they arise. Sexton reviewed the following questions for discus- sion in the breakout groups on this topic: ⢠What factors influence the policy environment in which transport policies for mitigating climate change can be successful over the long term? ⢠What policies have been effective at decarbonizing transportation in the European Union and the United States? ⢠What types of policiesâtaxes, incentives, and other approachesâare most effective at the different levels of government? ⢠What specific policy and governance challenges exist for decarbonizing transportation? ⢠Are there examples of jurisdictions overcoming these obstacles and can their experiences be transferred to other jurisdictions? ⢠How can policies be designed to create a basis for broad political and societal coalitions? ⢠How can policy and institutional frameworks be improved to be more resilient? ⢠Where is research needed to support governance efforts or models to decarbonize transportation? Suggested Future Research The participants in the breakout groups identified ideas for future research related to Exploratory Topic 2, the influence of policy environment factors on climate change mitigation strategies in the transport sector. These ideas are listed below. The research ideas were detailed in the closing session by the planning committee members responsible for the exploratory topic. In addi- tion, the rapporteur reviewed notes from the breakout groups in developing the following list. ⢠Examine the effectiveness of different mitigation policies in different policy environments. Identify the
16 d e c a r b o n i z i n g t r a n s p o r t f o r a s u s t a i n a b l e f u t u r e policies that are likely (a) to be adopted and (b) to be successful in various policy settings. ⢠Examine the influence of different organizational structures on mitigation planning policies. A traditional organizational structure focuses on separate agencies at the national, state, and local levels. Regional organiza- tions represent a newer approach. Assess the benefits and limitations of different organizational structures and of approaches that fit best with different structures. ⢠Assess the potential equity impacts of low-carbon transport systems. Explore questions associated with access, cost, and other impacts on low-income groups, disabled individuals, minority populations, and other disadvantaged groups. ⢠Identify and analyze any unintended consequences from climate mitigation measures and programs. Develop responses to resolve these unintended consequences. ⢠Assess the time lag and the cost of various mitiga- tion actions. ⢠Develop policies and programs to accelerate tech- nology transfer and the adoption of low-carbon trans- port technologies. Conduct pilots and tests of different technologies and strategies. Monitor and assess the results of different approaches. ⢠Develop improved communication methods, strat- egies, and messages to describe the benefits of sustainable transportation to policy makers, the public, and indus- try. Assess the policies needed for an integrated approach to mitigation, including technology and incentives and disincentives to promote behavior change. exploratory topic 3 megaregions: policy, research, and practice Ray Toll and Delia Dimitriu Delia Dimitriu and Captain Ray Toll presented the third exploratory topic, which addressed megaregions. They described the need for common solutions to address decar- bonization in megaregions. Examples from Europe focused on metropolitan areas, while those from the United States addressed both mitigation and adaptation strategies simul- taneously in megaregions. The paper on this exploratory topic is provided as Appendix D. Dimitriu and Tollâs pre- sentation covered the points summarized below. Dimitriu noted that the International Transport Forum (ITF) ITF Transport Outlook 2017 states that the transportation sector will not achieve the international communityâs climate ambitions of zero emissions by the year 2050 (1). She suggested that megaregions provide the geographical scale for addressing a mix of policies and strategies to reduce transport emissions. Dimitriu defined megaregions as large networks of metropolitan areas that share transport infrastructure, settlement, land use, and economic patterns. She noted that megaregions can provide the focus for integrated, inclusive, seamless, and low-carbon transportation sys- tems. She suggested that rapid urbanization requires equally rapid measures. Further, incorporating land use development concepts into regional transportation plan- ning in the early stages would be beneficial. Dimitriu noted that it may be easier to identify mega- regions in the United States than in Europe because of development patterns and geographic scales. She discussed some of the possible low-carbon transport solutions appropriate at the urban and regional levels, including transit, ride sharing, and electric vehicles. She noted that solutions need to be integrated, address all transport modes, and embrace a new mobility culture. Additionally, these solutions will require a substantial paradigm shift and a comprehensive strategy that focuses on more than just vehicles. She suggested that behavioral change will be needed to address the decarbonization of transport in megaregions. Dimitriu reviewed the EU approach to megaregions, noting that by 2020, cities are expected to host 80% of the EUâs population, which will put pressure on urban transportation systems. She commented that metropoli- tan areas in Europe are linked together for passenger and freight movements, with the aim of economic growth. This system is recognized by the European Union as the Trans-European Transport Network, or TEN-T, which includes roads, railways, railway terminals, inland water- ways, inland and maritime ports, airports, and associ- ated infrastructure. The 2016 European strategy for low-emissions mobility focuses on the right policy mix for addressing the network. She noted decarbonization and air quality are two challenges with similar solutions. Dimitriu discussed the paradigm shift toward cleaner urban mobility focusing on a multimodal transport systems approach, which prioritizes captive fleets and shifting fleets from diesel-based engines to fuel cell or electricity. She noted the need for safe and secure Euro- pean standards and tools to accurately measure vehicle pollution emissions. She highlighted the development of sustainable urban mobility plans along with the combi- nation of active mobility and healthy lifestyle. Dimitriu discussed two European case studies focusing on decarbonization through integrated regional mobility. The first case study was the Blue Banana: The European Megalopolis or Manchester (United Kingdom)âMilan (Italy) Axis, with a focus on the Transport for the North and the Manchester region as the selected case study. The second case study was the Golden Banana: The Sun Belt of Valencia, Spain, in the west and Genoa, Italy, in the east. This case study includes the Barcelona Metro- politan Region. Both of the case studies were presented
17p r e s e n t a t i o n o f e x p l o r a t o r y t o p i c s at a March 2017 workshop in Manchester that included representatives from several European cities. The north of England is part of the Blue Banana case study. The north of England is home to 16 million people and contributes approximately £290 billion toward the UK economy. It is home to multiple world-class universi- ties and is a key contributor to the freight and logistics industry. The Manchester region has approximately 2.7 million residents. Transport for Greater Manchester is leading an innovative multiagency approach that includes smart mobility solutions such as flexible on-demand transport, which connects users to shared mobility ser- vices for door-to-door, door-to-employer, and door-to- public-transit services. Linking rural and urban areas is also covered in this type of flexible transportation-on- demand service, which builds on existing services such as Ring and Ride and LocalLINK. The Greater Manchester Transport Strategy 2040 provides a sustainable urban mobility plan for the region (2). Dimitriu described ele- ments of the plan presented at the Reimagining Public Transport Workshop in March 2017. Elements included technology, place, data analytics, and behavior. In describing the Golden Banana case study, Dimitriu focused on the Barcelona Metropolitan Region, which includes 164 municipalities and 5.2 million residents. The intergovernmental consortium is focusing on pro- moting a modal shift to more efficient modes, promot- ing efficient and less-polluting mobility, and fostering electric mobility. Nine master mobility plan proposals address passengers and freight in the region and include 75 measures. A focus of the mobility plan is on avoid- ing, shifting, and improving trips and services. Both of the case studies presented impressive goals for carbon reductions. Toll described a case study focusing on the Hampton Roads region of the U.S. state of Virginia. The Hamp- ton Roads Sea Level Rise Preparedness and Resilience Intergovernmental Pilot Project was facilitated by Old Dominion University. The Hampton Roads region includes the largest naval base in the world, the third- largest commercial harbor on the eastern seacoast, com- mercial fisheries, manufacturing facilities, tourism, and residential and commercial developments. Toll noted that the development of the intergovern- mental blueprint for community resiliency was one of three White House National Security Council climate change pilots and one of three Department of Defense pilots responding to the 2013 Presidential Executive Order on Preparing the United States for the Impacts of Climate Change. The pilot included the cities of Nor- folk and Virginia Beach, Virginia, four Virginia cabi- net departments, 11 federal agencies, the Virginia Port Authority, three nonprofit organizations, and several businesses. Old Dominion University facilitated the pilot project. Toll reviewed the mission of the pilot project, which was to establish a regional whole-of-government and whole-of-community organizational framework and procedures in the Hampton Roads area that could also be used as a template for other regions. A 15-member steering committee and a federal liaison provided over- all coordination. The main focus areas were legal issues, infrastructure, land use planning, citizen engagement, and public health. Committees on economic impacts, private infrastructure, and municipal planning sup- ported the pilot project, and senior advisors and science teams also assisted in the process. Toll noted the unique role of Old Dominion Univer- sity as a trusted partner and its ability to provide a test bed for ideas and strategies. Toll highlighted examples of the recommendations from the pilot, including linking infrastructure interdependencies by sharing maps, plans, and other resources among jurisdictions and municipali- ties. Examples of follow-up activities Toll cited were a joint land use study, institutionalizing the whole-of- government and whole-of-community relationships, and synchronizing and integrating federal and nonfederal resilience planning and implementation. Toll described the importance and interrelationship of adaptation and mitigation measures. He noted that the transportation network was a key infrastructure back- bone for the Hampton Roads case study. He commented that an integrated network for monitoring climate change for any region or megaregion was a requirement for both mitigation and adaptation. Further, he suggested that both mitigation and adaptation measures must be con- sidered in any megaregion plan. Toll concluded the presentation by outlining the fol- lowing questions for consideration in the discussion groups: ⢠What will it take to create an integrated megare- gion climate framework for the transport sector that considers mitigation and adaptation measures at the same time? ⢠What steps are needed to promote regions working together toward an integrated low-carbon system? ⢠What policy scenarios can be used to address a pro- jected doubling of passenger traffic by 2030 and 2050? ⢠What topics should be considered for a joint EU- U.S research program on transport and climate change? Suggested Future Research The participants in the breakout groups identified ideas for future research related to Exploratory Topic 3, megaregion policy, research, and practice. These ideas are listed below. The research ideas were detailed in the closing session by the planning committee members
18 d e c a r b o n i z i n g t r a n s p o r t f o r a s u s t a i n a b l e f u t u r e responsible for the exploratory topic. In addition, the rapporteur reviewed notes from the breakout groups in developing the following list. ⢠Develop and test a framework for assessing adap- tation and mitigation strategies in megaregions, identi- fying barriers to implementation, and presenting best practice examples. Table 1, which presents a starting point for developing a framework was discussed in one of the breakout groups. ⢠Develop and assess spatial planning scenarios focusing on different measures to reduce the transpor- tation carbon footprint in megaregions. The scenarios could be used to provide information to policy makers and the public on the impacts of different measures on land use and carbon reduction. ⢠Assess the impacts on the transportation network and GHG emissions from new services, such as Ama- zon and IKEA deliveries in short time frames. Examine approaches to better monitor the impacts and to identify possible policies to reduce unintended consequences and possible negative impacts. ⢠Explore the concept of developing a policy umbrella for megaregions with a mix of policies for consideration and adoption in individual regions. The research could define the concept and develop multiple scenarios with different policies, projects, technologies, and land uses. The scenarios could focus on how to address increasing passenger traffic in megaregions in the future, target- ing 2030 and 2050. The scenarios could be tested and refined in different megaregions in the United States and Europe. ⢠Assess the barriers and the opportunities for trans- ferring existing policies and practices on decarbonizing the transportation sector from one megaregion to other megaregions or between areas within a megaregion. ⢠Examine the impact of three-dimensional printing and other technologies on changes in industry and freight transport within megaregions and possible changes in GHG emissions. ⢠Assess the potential to reuse or repurpose aging transport infrastructure in megaregions to support decarbonized travel modes. ⢠Examine methods to promote, encourage, and incentivize the use of low-carbon transport modes within megaregions. ⢠Examine the impact of energy production in mega- regions on possible approaches to decarbonizing the transportation system. ⢠Explore ways to develop political support for low- carbon transportation options across the multiple juris- dictions and governmental units in megaregions. ⢠Share best practice examples of decarbonizing strategies among megaregions in Europe and the United States. exploratory topic 4 decarBonizing the logistics and long- distance transportation of freight Kate White and Simon Edwards Kate White and Simon Edwards presented the fourth exploratory topic, which addressed decarbonizing the logistics and long-distance transportation of freight. They described the complexity of long-distance freight trans- portation and logistics, highlighted some of the challenges associated with reducing GHG emissions from freight transport, and summarized two case studies for discussion in the breakout groups. The paper on this exploratory topic is provided as Appendix E. White and Edwardsâ presentation covered the points summarized below. Edwards noted that long-distance freight transpor- tation has been identified as one of the most difficult socioeconomic activities to decarbonize. In addition, its share of total transportation GHG emissions is predicted to rise from 42% in 2010 to 60% in 2050. The car- bon intensity of freight movement in Europe would have to drop to about one-fifth of its 1990 level to meet the European Commissionâs 2011 target of a 60% reduction in carbon dioxide emissions from passenger and freight transport between 1990 and 2050. Edwards discussed the logistical elements of long- distance freight transportation, which includes the activi- TABLE 1 Starting Point for Developing a Framework for Assessing Adaptation and Mitigation Strategies Topic Area Information and Research Need Land use planning Assess the impact of carbon footprint reduction, infrastructure, legal barriers, and regulations and policies on different urban development patterns. Stakeholder consultation based on whole-of- government and whole-of-community concept Develop awareness and communicate needs and benefits. Investigate the adaptability of this concept in different megaregion settings in the United States and Europe. Assessment and management Consider all elements: planning, infrastructure, operations, market-based measures, technol- ogy, and communication. Best practice examples Assess barriers and opportunities for implementation in other megaregions.
19p r e s e n t a t i o n o f e x p l o r a t o r y t o p i c s ties of all the vehiclesâtrucks, locomotives, aircraft, and harbor craftâand all types of equipment used to move freight at seaports, airports, rail yards, warehouses, and distribution centers. He noted that long-distance freight transportation also includes the use of oceangoing freight and intercontinental airfreight as well as the first- and last-mile components of freight. Long-distance freight transportation involves the use of the road networks, land ports of entry, railways, airports with their airways, inland waterways, freight hubs, and other infrastructure. Edwards noted that population growth, increas- ing demand for goods, sudden changes in commodity demand and movement patterns, the need to remain com- petitive in an increasingly complex global marketplace, and the aging transportation infrastructure are strain- ing freight transportation systems around the world. He commented that the level of investment in freight-specific transportation has not kept pace with growing econo- mies in some areas, which has added to this strain. Given the inherent importance of global and regional freight logistics, Edwards suggested that it was important to establish substantial, continuing, multimodal, reliable, and dedicated funding in order to decarbonize the freight system. Additionally, he suggested that freight funding should not be limited to vehicles and equipment alone. It should also include transportation and energy infrastruc- ture as well as workforce development to help workers transition to a decarbonized transportation system. He suggested that freight funding should recognize future needs and constraints to support projected population and economic growth. Edwards discussed the complexity of long-distance freight transportation and the need to include numer- ous stakeholders in the development and deployment of strategies to reduce GHG emissions. He noted that some groups argue that future advances will reduce the inten- sity of freight transportation in the global economy. Some of these advances include the reshoring of manufacturing activity, the relocalization of food supplies, miniaturiza- tion, digitization, and localized additive manufacturing. He suggested that as the global population continues to increase, more freight movement can be expected. Edwards briefly described five parameters that help determine the carbon intensity of logistics and freight transportation: ⢠Structure of the logistics chain, ⢠Freight modes, ⢠Utilization of facilities and vehicles, ⢠Energy efficiency of facilities and vehicles, and ⢠Carbon basis of the energy consumed. The structure of the logistics chain, said Edwards, deter- mines the amount of freight movement per unit of deliv- ery. Vertical integration of productionâthe combination in one company of two or more stages of production normally operated by separate companiesâhas reduced the number of links in the logistics chain in some sectors. Edwards noted that this has not happened in the manu- facturing sector, where supply lines have usually length- ened. Further, larger single-market regions have tended to centralize distribution, increasing transport-related emissions while reducing inventories in a just-in-time world. He suggested that, if climate change mitigation targets are to be approached, there is a need to reexam- ine the balance of carbon intensity across the logistics supply chain versus the cost.. Edwards discussed the modalities of freight trans- portation, noting that the average carbon intensity of freight transport modes varies enormously. Globally, there are opposing trends in changes between modalities for a wide variety of reasons. For example, the European Commission has set ambitious targets to change from road to rail or water modes. Edwards noted that the car- bon cost of the investment and maintenance needed to achieve these modal shifts and the net societal economic costs are not always well understood. It is also important to note that rail is efficient in terms of GHGs per unit of freight moved but tends to emit more particulate matter and nitrogen oxides that affect air quality and under- mine other sustainability goals. Edwards described the utilization of facilities and vehicles, noting that improving utilization in all aspects normally results in a reduction in carbon intensity with relatively few downsides. He suggested that it was important to consider infrastructure and facilities first. While these factors are complex and involve public and private players, there are often good practice guidelines to increase utilization. Edwards also noted that business practices may play a positive role in improving utiliza- tion. Because business is driven by commercial consid- erations, there is often a positive correlation between economic and carbon costs. This correlation results in practices such as just-in-time delivery or facility collab- oration, which have a net benefit on carbon intensity. Edwards further noted that there are typically oppor- tunities to improve vehicle utilization, which naturally reduces carbon intensity. He suggested that quantifying underutilized capacity can be difficult, however. In addressing the energy efficiency of facilities and vehicles, Edwards reported that while improvements in vehicle technology have significantly improved energy efficiency over the past decades, compromises with other emissions-related aspects have not necessarily been made. He suggested that significant improvements in vehicle efficiency are still possible, even at the ultralow emissions levels now being achieved. Edwards noted that this is true particularly for on-road transportation. He commented that the challenge is to encourage the com- mercial application of these fuel-saving technologies. He
20 d e c a r b o n i z i n g t r a n s p o r t f o r a s u s t a i n a b l e f u t u r e also noted the improvements in the energy efficiency of logistic hubs being made in many areas. Edwards discussed the carbon basis of energy con- sumed, noting that it had not been a major focus of this symposium. Freight transportation is a fossil fuelâ intensive operation, and the repowering of logistics operations with low-carbon energy is at a very early stage. The possibility to electrify freight, for example, is mode dependent, with the mass and volume energy density requirements at the vehicle level being the deter- minant, and the benefit therefrom constrained by the local electrical energy supply mix. In the short term, Edwards suggested, the decarbonization of liquid fuels for long-distance transport is the main option for air- craft, ships, freight trains, and heavy-duty commercial road vehicles. The electrification of the highway road network, together with increasing levels of electric hybrid vehicles, is one possible medium-term option. White described the two scenarios included in the paper, which address online shopping for shoes and manufacturing Tesla electric vehicles. The scenarios were developed to help focus decisions during the break- out sessions. Figure 7 illustrates the online shopping scenario, in which a consumer orders five pairs of shoes online with a request for delivery within a 2-hour window. The con- sumer keeps one pair of shoes and returns the other four pairs. Major steps in the supply chain include producing the shoes in China, loading the shoes into a container and transporting the container by truck to a seaport, and shipping the container by an ocean vessel to a California port, where the container is unloaded and placed on semi- trailer truck. The semi-trailer truck travels to a distribu- tion center where the container is unpacked. These steps occur before the consumer orders the shoes. Once the online order is made, the shoes are transferred to a smaller truck and delivered to the consumer. In the scenario, the consumer keeps one pair and travels to a local package delivery store to return four pairs, which are transported back to the distribution center by a medium-sized truck. The second scenario, which addresses the manufacture of Tesla electric vehicles, is illustrated in Figure 8. The supply chains for vehicle parts include shipping alumi- num sheets from Japan, battery materials from Asia, and other components from throughout the United States to the Tesla manufacturing factory in Fremont, California. The assembled vehicles are loaded onto trucks for deliv- ery to consumers throughout the country. White offered the following framing questions for dis- cussion in the breakout groups: ⢠How do other trends interact with the decarbon- ization of freight transportation? ⢠What additional policy options for decarbonizing freight transportation are there? ⢠What other ideas for the decarbonization of freight transportation should be considered? ⢠What are the correct measures for evaluating the decarbonization of freight? ⢠How may infrastructure solutions be developed in time? ⢠What other social or political difficulties associated with the decarbonization of freight can be foreseen? Suggested Future Research The participants in the breakout groups identified ideas for future research related to Exploratory Topic 4, decar- bonizing the logistics and the long-distance transporta- tion of freight. These ideas are listed below. The research ideas were detailed in the closing session by the plan- ning committee members responsible for the exploratory topic. In addition, the rapporteur reviewed notes from the breakout groups in developing the following list. ⢠Examine technologies to decarbonize long-distance freight transportation modes. Connected, automated, and autonomous vehicle technology should be included in the assessment. Rail electrification, fuel cells on ships, and other technologies should also be examined. ⢠Develop, conduct, and analyze pilots and demon- strations of different technology applications to decar- bonize long-distance freight transport. Monitor and evaluate the pilots and share the results. ⢠Analyze the use of big data in long-distance freight transport and logistics. Examine the use of big data ana- lytics to obtain greater efficiency in supply chains and to reduce the carbon footprint of freight transport. ⢠Assess the viability of disruptive technologies, such as the Hyperloop and intermodal hubs in the air, and analyze their potential impact on decarbonizing long- distance freight transportation. ⢠Examine the forecast changes in the future economy and the impact of these changes on freight transporta- tion and supply chains. Assess the nature of the changes, the likelihood of the changes actually occurring, and the impact of the changes on meeting targets to decarbonize long-distance freight transportation. ⢠Assess the advantages and the limitations of dif- ferent fiscal instruments and policies, such as a carbon added tax and incentives for reducing GHG emissions, to promote or require decarbonization in long-distance freight transportation. ⢠Analyze the effectiveness of different mixes of poli- cies to reduce GHG emissions in long-distance freight transport. Model the short- and long-term impacts of different combinations of policies and identify support- ing infrastructure elements needed to ensure the success of these policies.
21p r e s e n t a t i o n o f e x p l o r a t o r y t o p i c s FIGURE 7 Online shopping scenario. THE FOUR PAIRS OF SHOES ARE UNLOADED AND STORED, UNTIL ORDERED AGAIN. THE CONSUMER DRIVES THE UNSELECTED FOUR PAIRS TO A LOCAL PACKAGE DELIVERY STORE. THE LARGE TRUCK DRIVES TO A DISTRIBUTION CENTER AND THE SHOES ARE UNLOADED USING A FORKLIFT. THE CONTAINER IS UNLOADED FROM THE VESSEL AND PLACED ON A LARGE TRUCK USING A VARIETY OF CARGO HANDLING EQUIPMENT. THE CONTAINER IS TRANSPORTED TO THE NEAREST PORT BY A LARGE TRUCK AND PLACED ON A CONTAINER VESSEL USING A VARIETY OF CARGO HANDLING EQUIPMENT. A CONSUMER ORDERS FIVE PAIRS OF SHOES ONLINE AND REQUESTS DELIVERY WITHIN A TWO- HOUR WINDOW. THE SHOES ARRIVE ON TIME. THE CONSUMER KEEPS ONLY ONE PAIR OF SHOES. THE FOUR PAIRS OF SHOES ARE PLACED ONTO A MEDIUM- SIZED TRUCK AND TAKEN TO A DISTRIBUTION CENTER. THE SHOES ARE PLACED INTO A MEDIUM-SIZED TRUCK AND THE TRUCK DELIVERS THE FIVE PAIRS OF SHOES TO THE CONSUMER WITHIN A TWO-HOUR WINDOW. THE LARGE TRUCK TAKES THE CONTAINER TO A TRANSLOADING FACILITY WHERE A FORKLIFT TRANSFERS THE SHOES INTO A LARGE TRUCK WITH A 53â TRAILER. THE VESSEL TRANSPORTS THE CONTAINER TO A PORT IN CALIFORNIA. THE SHOES ARE LOADED ONTO A SHIPPING CONTAINER USING A FORKLIFT. FIVE PAIRS OF SHOES ARE PRODUCED & PACKAGED AT A FACTORY IN CHINA.
22 d e c a r b o n i z i n g t r a n s p o r t f o r a s u s t a i n a b l e f u t u r e FIGURE 8 Manufacturing of Tesla electric vehicles. ALUMINUM SHEET FOR CHASSIS AND BODY PANELS IS SHIPPED FROM JAPAN TO SOUTH COAST PORT. ROLLS ARE TRANSPORTED BY RAIL AND TRUCK TO FREMONT FACILITY. MATERIALS ARE LOADED ONTO A TRUCK AND ARE TRANSPORTED TO FREEMENT FACILITY. BATTERY CATHODE AND MATERIALS ARE LOADED ONTO A TRAIN A SHIPPED TO BATTERY MANUFACTURING FACILITY IN NEVADA. ASSEMBLED VEHICLES ARE LOADED ONTO TRUCKS FOR DIRECT DELIVERY ACROSS THE UNITED STATES. TESLA IS BUILDING ONE OF ITS ELECTRIC VEHICLES. IT RECEIVES MATERIALS FROM DIFFERENT PARTS OF THE WORLD AND ASSEMBLES THE VEHICLE AT ITS FREMONT FACILITY. THE NEWLY MADE CARS ARE DISTRIBUTED TO CUSTOMERS ACROSS THE USA. ROLLS ARE LOADED ONTO TRUCKS BY CRANE FOR TRANSFER TO OFF-DOCK RAIL. MULTIPLE MATERIALS AND INTERIOR COMPONENTS ARRIVE BY SHIP TO THE PORT OF OAKLAND. BATTERY AND CATHODE MATERIALS ARE SHIPPED FROM PROPRIETARY LOCATION IN ASIA TO SOUTH COAST PORT. BATTERIES MANUFACTURED IN NEVADA ARE SHIPPED BY TRUCK TO FREEMONT.
23p r e s e n t a t i o n o f e x p l o r a t o r y t o p i c s ⢠Examine the impacts of decarbonizing long- distance freight transportation on different market seg- ments, ownership groups, and industries. For example, one beneficial research project could assess the impacts of different decarbonization strategies, including the impact of electric vehicles on truck ownerâoperators, large trucking firms, and business-owned trucking fleets. Other research projects could examine potential impacts by market segments and industry types. ⢠Examine new approaches for measuring the energy impacts of freight transport and defining convenience. For example, product kilometers traveled may be one possible measure. ⢠Explore the viability of different fuel sources, including electric, for long-distance freight transporta- tion. Elements to examine in the research include assess- ing the availability, feasibility, economic viability, and transition time of different low-carbon fuels. ⢠Assess the impact of truck platooning on reducing GHG emissions through actual pilots and demonstrations. Conduct research on the impacts of combining other strat- egies and approaches with truck platooning and additional automated and connected vehicle technologies. ⢠Examine the potential need for, and benefits from, the international standardization of freight transport systems and the development of standard measures of carbon reduction. references Abbreviation ITF International Transport Forum 1. ITF Transport Outlook 2017. International Transport Forum, Organization for Economic Co-operation and Development, Paris, 2017. http://www.oecd.org/regional/ itf-transport-outlook-2017-9789282108000-en.htm. 2. Greater Manchester Transport Strategy 2040. http:// www.tfgm.com/2040/Pages/default.aspx.
24 Closing Session José Viegas, International Transport Forum, Organisation of Economic Co-operation and Development, Paris Neil J. Pedersen, Transportation Research Board, Washington, D.C., USA Robert Missen, Directorate-General for Mobility and Transport, European Commission, Brussels, Belgium concluding Keynote presentation decarBonizing transport: to life in a sustainaBle WorldâWhat did We learn, What can We do? José Viegas José Viegas provided the closing keynote presentation. He described recent studies by the International Trans- port Forum (ITF) and highlighted strategies to reduce greenhouse gas (GHG) emissions in the transport sector. Viegas covered the following topics in his presentation: Viegas reviewed information from ITF Transport Outlook 2017 (http://www.oecd.org/about/publishing/ itf-transport-outlook-2017-9789282108000-en.htm). He noted that global transport volumes are projected to continue to increase. Passenger transport is forecast to more than double by 2050. Global vehicle stock is projected to increase from 1 billion in 2015 to 2.4 bil- lion in 2050. Freight transport is projected to triple by 2050. The report suggested that if unchecked, transport carbon dioxide (CO2) emissions could increase by 60% by 2050. The report notes that new technologies will not be enough to reduce freight CO2 emissions. While higher fuel efficiency and alternative fuels can reduce freight CO2 emissions by 40%, new technologies alone cannot curb the trend of growing freight emissions. Strategies such as truck sharing, route optimization, relaxing deliv- ery windows, and more operational efficiency generally can hold 2050 emissions at 2015 levels. Viegas suggested that a new approach to urban mobil- ity that focuses on more than technology was needed. He outlined two guidelines for this new approach. The first guideline was to focus on access to jobs, public facili- ties, and social interaction as the key objective. He noted that mobility was a way to gain access, not the objective. The second guideline Viegas suggested was to leverage the upcoming radical changes affecting transport supply to radically reorganize the mobility system. Examples he cited of these radical changes included digital connectiv- ity, electrification, and automated vehicles. Viegas described more of the anticipated technology changes. He noted that due to advances in computation, information technology, and material science, digital connectivity will be available everywhere and at any time. Other changes he cited included the electrification of vehicle power trains and automated driving. He fur- ther suggested that these technologies will force radical change in the fiscal regime of automobiles and will be accompanied by an evolution of consumersâ preferences, with car sharing becoming prevalent and vehicle owner- ship no longer necessary. Viegas discussed some of the first-order impacts of these changes. He noted that electric vehicles would pro- vide cleaner air and lower GHG emissions and that they would also likely lower operating cost per kilometer. He reported that automated vehicles should enhance safety, but that by allowing better use of an individualâs in- vehicle time, they may also induce longer trips. Further, he noted that automated vehicles may lower the cost of professional services such as taxis and buses. Viegas suggested that the acceptance of car sharing reduces the
25c l o s i n g s e s s i o n pressure to own an automobile, which releases highly underutilized capital for other uses. He cautioned that the simple combination of these impacts might lead to even higher levels of congestion and asymmetry of acces- sibility. As a result, he commented that other strategies are needed. Viegas discussed ways to make changes acceptable and appealing to the public. He noted that the urban landscape and lifestyles have been aligned with the pri- vate vehicle paradigm for the past 70 years and thus represented an entrenched sociotechnical system. He suggested that changes beyond technology must be made in directions that still provide a good match with those settings. For car owners, this approach might mean pro- viding the essential features of the private automobile, including availability, comfort, and speed. New public transport that provides direct rides to avoid transfers will also be needed. He noted that costs will need to be reduced in both cases. Viegas described an example of a radical organiza- tional change focusing on shared mobility solutions. He summarized the approaches, which included shared taxis and taxi buses (a simpler name for demand-responsive microbuses). He noted that this approach provides a high quality of service at a much lower cost than the types of services in operation today. Further, he noted, the public policy impacts of better and more equitable accessibil- ity, a reduction of traffic volumes and emissions, and the release of large quantities of parking spaces for use by pedestrians and cyclists would be realized. Viegas discussed an analysis focusing on this approach that was conducted for Lisbon, Portugal, by the ITF in 2016. The analysis was based on providing shared mobility with a fleet of six-seat shared taxis that pro- vided on-demand, door-to-door service in conjunction with a fleet of eight- and 16-person minibuses. The exist- ing rail and subway network continued in operation. For a 24-hour period, the simulation results showed that the same number of trips could be provided with only 3% of the current vehicles. Further, there was a 34% reduction in CO2 emissions and a 95% reduction in the number of parking spaces needed. He also noted that the use of small, demand-responsive buses provided improved and more equal access for residents. Viegas highlighted a more recent analysis conducted in 2017 for the Lisbon metropolitan area in which an attraction decay curve calibrated for the region was used to estimate accessibility impacts. He reported that taxi buses alone or in combination with suburban rail improved access to jobs over the current public transport system. He noted that ITF was currently studying simi- lar schemes for Helsinki, Finland; Dublin, Ireland; and Auckland, New Zealand. Viegas described a potential smarter fiscal regime for road transport. He noted that currently in the European Union, fuel duties represent on average about 8% of the total fiscal revenue of the member states. He noted that the fuel duties were created as an instrument to fund road construction, but have evolved to also fund main- tenance, upgrades, and off-transport uses in Europe. He suggested that replacing the fuel duties with a smart distance-based charge was logical. Digital connectivity would make it possible to assign higher tariffs in cen- tral areas with priority use by active modes for vehicles providing exclusive rides, and for vehicles with higher emissions. Viegas discussed spatial and urban planning, not- ing that it should ensure a more equitable distribution of opportunities without the need for motorized trans- port. He suggested that density and functional diversity were important elements of urban areas, along with the quality design of public areas. He commented that good design for use of active modes (walking and cycling) encourages their safe use. He noted that bicycles were increasingly replacing automobile trips in some areas and suggested that parking spaces released by the wide adoption of shared mobility could be allocated for active modes and public amenities. Viegas provided suggestions for managing change. He noted that people prefer stability, but with a bit of change. He commented that a ratio of 80% stable and 20% new fit this approach. He commented that the upcoming technological revolution provides a natural turbulence that facilitates introducing other changes, including shared mobility solutions and new fiscal treat- ment of road transport. He suggested that a critical mass of measures was needed to obtain visible results, to gen- erate positive feedback, and to gain public support. Viegas suggested that a new style of regulation may be needed, as digitally connected systems will generate large amounts of data, and part of that data must be supplied unfiltered to authorities for performance assess- ment and planning purposes. He further suggested that regulations should evolve in consonance with key objec- tives and constraints, so as to define acceptable ranges for parameters while allowing innovation and data-led approaches. Viegas discussed that major changes will occur in the transport sector over the next 15 years. These changes will occur across all modes, especially in urban areas. Technological evolution will make transport cleaner and safer, but it will not necessarily provide a better quality of life. He suggested that other instruments will be nec- essary to address congestion, promote better and more equitable accessibility, and accelerate the reduction of GHG emissions. He noted that the number of options available provides opportunities but that the multiplic- ity of objectives and of decision makers adds complex- ity. He suggested that inclusive political leadership was essential to lead, explain, include, and share data.
26 d e c a r b o n i z i n g t r a n s p o r t f o r a s u s t a i n a b l e f u t u r e Viegas provided several concluding thoughts. He sug- gested that faster progress was likely to be made in urban areas through the adoption of electric vehicles for pas- sengers and freight. He noted that the focus would be on providing access rather than on mobility, with land use policies used in tandem with transport strategies. He commented that shared mobility options may have the best potential to relatively quickly reduce congestion and emissions, as well as to release public space from parking to active modes and amenities and to provide improved and more equitable accessibility. Viegas further suggested that smarter fiscal regimes for road transport can stimulate behavioral alignments. He noted that decarbonizing transportation in rural areas and in long-distance travel was a bigger challenge. He suggested that ridesharing in rural areas was possible, but that a different paradigm was needed. He said that clean fuels are needed in aviation and shipping, and that long-distance transport also requires new managerial practices related to logistics, road sharing, and rail ser- vice quality. He stressed that a combination of measures is needed to decarbonize transport. According to Viegas, providing coherence across actions, players, and time will continue to be a challenge. Viegas concluded by outlining the following potential directions for research: ⢠Research on propulsion and information tech- nologies. ⢠Exploration of key aspects of the sociotechnical system blocking change and their low-carbon surrogates. ⢠Identification of key scarce resources for deploying those surrogates. Viegas cited legislation, capital, space, and skills as examples of such resources. ⢠Development of viable business models that would be able to support the value propositions based on those features. ⢠Identification of public governance schemes that would be less likely to create blockages to the evolution of the business models. Viegas commented that since there will be a 15- to 20-year period of radical changes, these research topics should be revisited every 5 years. closing comments from the transportation research Board Neil J. Pedersen Neil Pedersen provided closing comments from the Transportation Research Board (TRB) and the National Academies. Noting the high energy level and excel- lent discussions, he thanked the planning committee, speakers, and participants for their active involvement throughout the symposium. Pedersen reported that the information presented at the symposium and breakout group discussions pro- vided numerous research ideas and issues that TRB can pursue. He noted that suggestions on research topics, information sharing, and collaboration opportunities will be shared with TRB committees, the TRB Execu- tive Committee, and the cooperative research programs. He discussed opportunities to twin on research projects between the European Union and United States. Pedersen stressed the importance of ongoing trans- Atlantic cooperation and collaboration. Noting that there is much to be learned from the different approaches and experiences in Europe and the United States, he encour- aged participants to continue the dialog initiated at the symposium. To support this ongoing discussion, Peder- sen reported that there would be a session at the 2018 TRB Annual Meeting highlighting the key topics from this symposium. He extended an invitation to all sym- posium participants to attend the 2018 Annual Meeting. Pedersen thanked the white paper authors and the keynote speakers for their insightful presentations. He expressed his gratitude to the planning committee mem- bers for their hard work in planning the symposium, developing and presenting the exploratory topic papers, and facilitating the breakout discussion groups. He rec- ognized Bill Anderson and Brittney Gick of TRB and Frank Smit of the European Commission, for their assis- tance in making the symposium a success. closing comments from the european commission Robert Missen Robert Missen provided closing comments on behalf of the European Commission. He thanked TRB for host- ing the symposium. He noted the productive discussions in the breakout groups and thanked the participants for sharing their ideas, experiences, insights, and issues. Missen stressed the value to the European Union of the information presented at the symposium and the identi- fied research topics. He noted that the research topics will be considered in the Horizon 2020 program, including projects that may be appropriate for twinning with U.S. projects. Missen noted the importance of objective facts and knowledge for developing policies and the benefits of ongoing collaboration and cooperation between the European Union and the United States. He invited par- ticipants to attend the next Transport Research Arena (TRA) in Vienna, Austria, on April 16â18, 2018.
27 Potential Portfolio for EU-U.S. Research on Decarbonizing Transport for a Sustainable Future Katherine F. Turnbull, Texas A&M Transportation Institute, College Station, Texas, USA, Rapporteur Katherine Turnbull served as the rapporteur for the symposium. She summarized the keynote speakers, exploratory topic presentations, and breakout group reports. She also attended the breakout groups to gain a better understanding of the challenges and research topics discussed by participants. Several common cross-cutting challenges and research topics emerged from the symposium. The rapporteur developed a potential portfolio for EU-U.S. research on the symposium theme: decarbon- izing transport for a sustainable futureâmitigating impacts of the changing climate. The potential research topics are grouped below by the following subject areas: transport policies, planning, and projects; technology and innovation; communication strategies and methods for stakeholders involvement; and logistics and long- distance freight transportation. These research topics may be considered by the Euro- pean Commission, the cooperative research programs managed by the Transportation Research Board (TRB), and other groups. The potential research projects are also appropriate for twinning. The opportunity also exists to build on the research ideas identified in the 2015 and 2016 EU-U.S. symposia addressing road transport auto- mation and transportation resilience. In addition, oppor- tunities for ongoing trans-Atlantic information sharing and coordination activities are highlighted. transport policies, planning, and projects The following possible research topics related to trans- port policies, planning, and projects were discussed dur- ing the symposium. Research on these topics can consider different geographical levels, including international, national, megaregions, states, and local communities. ⢠Collect and share best practice examples of miti- gation programs between the European Union and the United States. Use information and databases developed for recent projects, such as the Evidence Project, and col- lect recent experiences. ⢠Examine the co-benefits from transport decarbon- ization policies and programs and how they relate to fac- tors that people value, such as quality of life and livable communities. Explore policies and messages that focus on the co-benefits rather than the mitigation programs themselves. ⢠Assess current forecasting methods for transport greenhouse gas (GHG) emissions and mitigation strate- gies. Explore the use of backcasting methods and eco- nomic analyses with planning and mitigation strategies. ⢠Examine the impact on funding from changes to electric vehicles and renewable fuels and how these changes will influence the reliance on fuel taxes. Identify other potential funding sources. ⢠Assess how changes to electric vehicles and renew- able fuels will influence different industries. ⢠Examine the effectiveness of different mitigation policies in different policy environments. Identify the policies that are likely to be adopted and be successful in various policy settings. ⢠Examine the influence of different organizational structures on mitigation planning policies, including tra- ditional organizational structures and new approaches. Assess the benefits and limitations of different organiza-
28 d e c a r b o n i z i n g t r a n s p o r t f o r a s u s t a i n a b l e f u t u r e tional structures, and approaches that fit best with dif- ferent structures. ⢠Assess the potential equity impacts of low-carbon transport systems. Explore questions associated with access, cost, and other impacts on low-income groups, disabled individuals, minority populations, and other disadvantaged groups. Identify and analyze any unin- tended consequences from climate mitigation measures and programs. Develop responses to resolve these unin- tended consequences. ⢠Develop and test a framework for assessing adap- tation and mitigation strategies in all areas, identifying barriers to implementation, and presenting best practice examples. Develop and assess spatial planning scenarios that focus on different measures to reduce the carbon footprint of transportation in all areas. The scenarios could be used to provide information to policy makers and the public on the impacts of different measures on land use and carbon reduction. ⢠Assess the barriers and the opportunities for trans- ferring existing policies and practices on decarbonizing the transportation sector from one area to other areas. ⢠Examine policies and programs supporting bicycle use and identify the most effective approaches for dif- ferent areas and situations. The analysis could include policies and programs, such as bikesharing, and infra- structure, including bike lanes, bike paths, bike stations, and other facilities. ⢠Examine the use of big data to assist in all aspects of planning for mitigation strategies to reduce GHG emissions at all geographic levels and transport modes. technology and innovation The following possible research topics were considered by some participants to be related to new technologies and innovative approaches for monitoring and respond- ing to extreme weather events as well as evolving trans- port technologies: ⢠Explore the travel behavior of the millennial and the digitalized generations. Identify changes from the travel behavior of older generations and assess the poten- tial impacts on mode use, VMT, and GHG emissions. Examine decarbonizing policies and programs using new technologies and innovative approaches that may appeal to these younger generations. ⢠Develop policies and programs to accelerate tech- nology transfer and the adoption of low-carbon trans- port technologies. Conduct pilots and tests of different technologies and strategies. Monitor and assess the results of different approaches. ⢠Assess the impacts of new services on the trans- portation network and GHG emissions. Examine approaches to better monitor the impacts and to identify possible policies to reduce unintended consequences and possible negative impacts. ⢠Examine the impact of three-dimensional print- ing and other technologies on changes in industry and freight transport within all areas and possible changes in GHG emissions. communication strategies and methods for staKeholder involvement Several participants believed that the following research topics could enhance communication and stakeholder involvement, including breaking down silos within and between agencies, organizations, and the private sector to develop and implement mitigation strategies and programs: ⢠Examine current public knowledge of climate change, GHG emissions, and policies and strategies to decarbonize transport. Identify the most effective com- munication messages and techniques for addressing the need for mitigation strategies and their potential benefits. Identify best practice examples and develop approaches for use in different situations and with different groups. ⢠Examine stakeholder involvement techniques used with transport mitigation strategies. Identify methods to actively engage all groups in the discussion of reduc- ing GHG emissions and the development of mitigation policies and programs. Explore ways to break down silos and work across agencies, organizations, and the private sector. Share best practice examples. ⢠Explore the role of different leadership styles, including inclusive leadership, in developing and imple- menting mitigation programs. ⢠Develop improved communication methods, strat- egies, and messages to describe the benefits of sustainable transportation to policy makers, the public, and indus- try. Assess the policies needed for an integrated approach to mitigation, including technology and incentives and disincentives to promote behavior change. ⢠Develop case studies of publicâprivate partnerships and multiagency coordination in planning, implement- ing, and assessing different mitigation strategies. ⢠Develop support tools to facilitate multiagency and multilevel coordination and cooperation. logistics and long-distance freight transport One of the exploratory topics focused on logistics and decarbonizing long-distance freight transport. Several research ideas were discussed in the breakout groups and additional suggestions were provided in the open ses-
29p o t e n t i a l p o r t f o l i o f o r e U - U . s . r e s e a r c h sion. Opportunities may exist to coordinate with twin- ning projects and research activities identified during the Third EU-U.S. Transportation Research Symposium, Towards Road Transport Automation (1). The follow- ing research topics related to logistics and decarbonizing long-distance freight transport discussed during the sym- posium may be appropriate for twinning: ⢠Explore the viability of different fuel sources, including electric vehicles for long-distance freight trans- portation. Elements to examine in the research include assessing the availability, feasibility, economic viability, and transition time of different low-carbon fuels. ⢠Examine technologies to decarbonize long-distance freight transportation modes. Include connected, auto- mated, and autonomous vehicle technology in the assess- ment, along with rail electrification, fuel cells on ships, and other technologies. Consider the role of the public and private sectors in implementing these technologies. ⢠Develop, conduct, and analyze pilots and demon- strations of different technology applications to decar- bonize long-distance freight transport. Monitor and evaluate the pilots and share the results. ⢠Assess the impact of truck platooning on reduc- ing GHG emissions through actual pilots and demon- strations. Conduct research on the impacts of combining other strategies and approaches with truck platooning and additional technologies for automated and con- nected vehicles. Coordinate with existing research proj- ects in the European Union and the United States. ⢠Examine the impacts of decarbonizing long-distance freight transportation on different market segments, own- ership groups, and industries. ⢠Examine the possible changes in the future econ- omy and the impact of these changes on freight trans- portation and supply chains. Assess the nature of the changes, the likelihood of the changes actually occur- ring, and the impact of the changes on meeting targets to decarbonize long-distance freight transportation. ⢠Assess the advantages and the limitations of dif- ferent fiscal instruments and policies, such as carbon added taxes and incentives for reducing GHG emissions, to promote or require decarbonization in long-distance freight transportation. ⢠Analyze the effectiveness of different mixes of poli- cies to reduce GHG emissions in long-distance freight transport. Model the short- and long-term impacts of different combinations of policies and identify support- ing infrastructure elements needed to ensure the success of these policies. ⢠Analyze the use of big data in long-distance freight transport and logistics, including using big data analyt- ics to obtain greater efficiency in supply chains and to reduce the carbon footprint of freight transport. information sharing and ongoing coordination Several opportunities for ongoing trans-Atlantic informa- tion sharing, coordination, and collaboration were sug- gested by individual participants during the symposium: ⢠Distribute the symposium proceedings to diverse stakeholders at the global, national, state, regional, and local levels. ⢠Provide presentations on the symposium by par- ticipants and agency staff at conferences and other appropriate venues, including those sponsored by the European Union and by TRB. A PowerPoint presenta- tion highlighting the symposium is available for use by all interested parties. ⢠Publish an article on the symposium in TR News as well as follow-up articles on related research and activi- ties as appropriate. ⢠Convene symposium participants at the 2018 TRB Annual Meeting for an information-sharing meeting. ⢠Develop a general session or workshop on the key topics addressed at the symposium for the 2018 TRB Annual Meeting and promote sessions at future annual meetings and specialty conferences and workshops. ⢠Pursue possible conferences, workshops, and meet- ings sponsored or cosponsored by the symposium hosts and other organizations and groups. ⢠Continue the involvement of the TRB Executive Committee task force, groups, sections, and committees in developing statements of research needs, coordinating research and outreach activities, and organizing Annual Meeting sessions, conferences, and workshops. ⢠Pursue twinning research projects and facilitate transatlantic research and sharing of results. Encour- age ongoing EUâUS dialogue and information sharing through a variety of mechanisms. ⢠Develop best practice case studies of mitigation efforts from throughout the world and share at confer- ences and meetings. reference 1. Conference Proceedings 52: Towards Road Transport Automation: Opportunities in PublicâPrivate Col- laboration. Summary of the Third EU-U.S. Transporta- tion Research Symposium. Transportation Research Board, Washington, D.C., 2015. http://dx.doi.org/ 10.17226/22087.
30 APPENDIX A: WHITE PAPER Decarbonizing Transport for a Sustainable Future Mitigating Impacts of the Changing Climate David L. Green, University of Tennessee, Knoxville, USA Graham Parkhurst, University of the West of England, Bristol, United Kingdom 1 introduction Mitigating greenhouse gas (GHG) emissions is essential to preventing dangerous anthropogenic interference with the climate system. The recent Paris Agreement reaffirmed the long-standing view of scientists that it is critical to keep the increase below 2°C to preserve the socioeconomic condi- tions of current civilization. The current trajectory of global emissions will increase the average global temperature beyond the 2°C goal (IPCC 2014a, p. 113). Reductions in GHG of 80% to 90% by the United States and the Euro- pean Union by 2050 are necessary to constrain the increase in global average temperature to less than 2°C. Therefore, additional mitigation actions, defined as âhuman interven- tion to reduce the sources or enhance the sinks of green- house gasesâ (IPCC 2014a, p. 142), will be necessary.1 Within this cross-sectoral objective, this paper clari- fies the importance of mitigating transportationâs large and growing share of anthropogenic GHG emissions as a critical contribution to moderating the dangerous impacts of climate change. There are four fundamental ways to reduce transportâs direct GHG emissions across the range of fossil fuelâdependent passenger and freight transport modes: 1. Improve vehicle energy efficiency, 2. Reduce the carbon intensity of energy sources, 3. Reduce the level of motorized transport activity, and 4. Improve the efficiency of the transport system. 1 âMitigationâ is distinguished from âadaptation,â which is â[t]he pro- cess of adjustment to actual or expected climate and its effects. In human systems, adaptation seeks to moderate or avoid harm or exploit benefi- cial opportunitiesâ (IPCC 2014b, p.117). Adaptation was the theme of the Fourth EU-U.S. Transport Research Symposium (TRB 2016). In addition, this paper discusses indirect means of reduc- ing emissions, such as through changes to spatial form and land use. However, none of these measures alone is sufficient. A comprehensive mitigation strategy for transport is required to achieve GHG reductions of 80% to 90% by 2050. The purpose of this paper is to provide context for the deliberations of the Fifth EU-U.S. Transportation Research Symposium, the topic of which is mitigat- ing the impacts of the changing climate. The paper is arranged as follows: ⢠Section 2 summarizes the problem of climate change and describes transportationâs role. ⢠Section 3 presents projections of future emissions under current policies. ⢠Section 4 considers the barriers to more radical change. ⢠Section 5 explores the kinds of policy strategies and behavioral changes that might achieve 80% to 90% reductions in transport emissions by 2050. ⢠Section 6 suggests key research questions for con- sideration by symposium participants. 2 the gloBal climate change proBlem and the role of transport This section considers how both global temperature and carbon emissions have shown marked increases over the past three to four decades and the main mechanisms for increased carbon emissions, notably fossil fuelâbased industrialization. It then considers some of the impacts and consequences and the importance of limiting the
31a p p e n d i x a : w h i t e p a p e r average increase in global temperature to 2°C before discussing the contribution of the transportation sector from three perspectives: tail pipe, well to wheels, and cradle to grave. Summary of Key Global Climate Change Evidence and Mechanisms The Earthâs lower atmosphere and surface are warm- ing at an increasing rate (Figure 1). While there have always been periods of cyclical fluctuations in tempera- ture and atmospheric carbon dioxide (CO2) concentra- tions, the extent of the increase in concentrations in the past 40 years is greater than any changes recorded in the past 800,000 years. Concentrations are now 25% higher than previous peaks, which is approximately double the historical average (Schwartz and Tavasszy 2016, p. 3). Indeed, the data since 1980 show a particu- larly clear increase in trend, with no annual observa- tions below the 1901 to 2000 average and new records set in the past 3 years (Figure 2). Looking to the future, the projections for potential increases would take aver- age global temperatures higher than humans have ever experienced. Following are the principal mechanisms for anthropo- genic GHG emissions: ⢠Extraction of hydrocarbon minerals, such as coal and oil, from subsurface deposits for energy and to pro- duce consumer goods; ⢠Deforestation for timber and fuel and to clear land for cultivation or development; ⢠Land cultivationâturning over the soil encourages decomposition of organic material and produces CO2 and methane (CH4); and ⢠Intensive animal husbandry, which increases CH4 emission from animal digestive tracts. The absolute contribution of industrialization to current CO2 concentrations since 1751 has been estimated at 400 billion metric tons of carbon from the consumption of fossil fuels and cement production. The period since 1850 is of main relevance, with half of that contribution having arisen in just the past 30 years (Boden et al. 2015) (Figure 3). The origins of industrialization, first in Western Europe then North America, mean the greatest ben- efits and socioeconomic changes have occurred on those continents. In this context, the European Union The 800,000-year record of admospheric CO2 from the EPICA Dome C and Vostok ice cores, and a reconstruction of local Antarctic temperature based on deuterium/hydrogen ratios in the ice. The current CO2 concentration of 392 ppmv is shown by the blue star. (Data from Lüthi et al., 2008, Nature, 453, 379â382, and Jouzei et al., 2007, Science, 317, 793â797.) FIGURE 1 Correlation between temperature and CO2 (ppmv = parts per million volume) (Shakun et al. 2012).
32 d e c a r b o n i z i n g t r a n s p o r t f o r a s u s t a i n a b l e f u t u r e -0.60 -0.40 -0.20 0.00 0.20 0.40 0.60 0.80 1.00 18 80 18 86 18 92 18 98 19 04 19 10 19 16 19 22 19 28 19 34 19 40 19 46 19 52 19 58 19 64 19 70 19 76 19 82 19 88 19 94 20 00 20 06 20 12 Va ri at io n in te m pe ra tu re fr om a ve ra ge ( °C ) FIGURE 2 Annual global (land and ocean) temperature variations since 1880 against average for 1901 to 2000. (Data source: NOAA 2017.) FIGURE 3 Cumulative carbon emissions from fossil fuel consumption and cement production since 1850 (Boden et al. 2015).
33a p p e n d i x a : w h i t e p a p e r and the United States have particular responsibilities to lead global action to counter climate change. Given that much of the future potential growth in GHG emissions will come from the industrializing nations, they also have vested interests in developing and sharing effective miti- gation strategies around the globe. Impacts and Consequences of Climate Change As identified by Schwartz and Tavasszy (2016, p. 4), four principal climate impacts are expected: 1. Sea level rise of at least 0.5 to 1.0 meters by 2100, as a result of ice sheet melt, notably that of Greenland. The increases will not have a uniform effect around the world because of localized land subsidence and rebound and varying atmospheric pressure. However, the U.S. Gulf Coast is one area expected to be particularly affected by subsidence. 2. Higher temperatures and longer heat waves, with average surface temperature increasing by 2.6°C to 4.8°C by 2100. Only part of this increase is still avoid- able, as summarized in Figure 4 below. 3. Changes in precipitation patterns. These changes are projected to result in greater drought in some loca- tions and higher rain and snowfall in others, as warmer air can carry more moisture. These effects are hard to quantify, but an increase in frequency of up to five times in severe drought or extreme precipitation is expected. 4. Increased wind intensity of storms and hurricanes. There is some uncertainty about the effect of climate change on hurricane frequency but more certainty about the intensity of storms and hurricanes increasing, with implications in terms of both wind damage and storm surges. The secondary consequences of these changes will be an increase in coastal flooding, wildfire, and landslidesâ events that will damage natural and built environments (infrastructure and property) and contribute to higher rates of injury and human loss of life. More than 1.5 billion people, from 2005 through 2015, were affected by disasters that caused more than 700,000 deaths and more than 1.4 million injuries and destroyed 23 million homes (Galperin and Wilkinson 2015). Transportation infrastructure, along with energy and telecommunications networks, is spatially extensive and often has coastal locations or follows coastal routes to take advantage of flat land or provide access to the sea. Such infrastructure is on the front line of exposure to cli- mate change. Reliance of modern transportation systems on energy and communications networks makes them both directly and indirectly vulnerable. Similarly, coastal communities can be regarded as high-risk areas because of their exposure to extreme weather events in the short run and sea-level rise in the future. The longer-term secondary consequences of climate change will be ecological, as the environmental range of ani- mal and plant species and diseases changes global distribu- tion as the zones of climatic tolerance for each shift toward the poles and to increased altitude. Human agriculture will also be affected, so that adaptation in farming practices or diet or both will be required. The worst scenarios envisage increased instances and extent of famine as the net avail- ability and productivity of agricultural land falls and also changing patterns of human infectious diseases, as many of these are dependent on vector species (e.g., malaria is depen- dent on the mosquito). As resources become scarcer and parts of the planet, such as parts of the Middle East, become physiologically intolerable for humans,2 mass migration and conflict can be expected to increase. On balance, transportation networks will be nega- tively affected by climate change. Road network man- agers in some regions may experience a reduction in winter treatment costs if the incidence of snow and ice falls, but this will be countered by an increase in dam- age from severe flooding events. While the Northwest Passage is now approaching commercial viability for nonspecialized shipping (Hennig 2016), there are threats to pipelines and railways built across permafrost (Guo and Sun 2015). Commercial aviation economics will be negatively affected by higher temperatures reducing sur- face air pressures and reducing takeoff payloads, while changing jet stream patterns will increase fuel burn and reduce schedule reliability (Williams and Joshi 2013). The potential for growing disruption linked to geopoli- tics remains unclear, but potentially may close infra- structure such as the Suez Canal or sections of airspace. The consequences of climate change will not be equally distributed. Many of the states expected to suf- fer the greatest consequences currently lack the financial, technical, or political capital to adapt. However, there will be considerable variation in the effects of climate change even within the European Union and the United States. Figure 5 shows the broad range of effectsâsome already observed, others expectedâassociated with the different geoclimatic regions in Europe. Importance of the 2°C Limit On November 4, 2016, the first legally binding global agreement to limit climate change was ratified (the Paris Agreement of 197 parties). The principles of that agree- 2 Wet bulb temperature (WBT) is a combined measure of temperature and humidity. Above a WBT of 35°C, for example, 46°C air temperature and 50% humidity, survival is limited to a few hours. However, for less than fully fit people, the fatal WBT is lower. WBTs of 35°C are already close to being reached in the Middle East (Pal and Eltahir 2016).
34 d e c a r b o n i z i n g t r a n s p o r t f o r a s u s t a i n a b l e f u t u r e Coupled Model Intercomparison Project Phase 5 (CMIP5) multimodal mean projections (i.e., the average of the model projections available) for the 2081â2100 period under the RCP 2.6 (left) and RCP 8.5 (right) scenarios for (a) change in annual mean surface temperature and (b) change in annual mean precipitation, in percentages, and (c) change in average sea level. Changes are shown relative to the 1986â2005 period. The number of CMIP5 models used to calculate the multimodal mean is indicated in the upper right corner of each panel. Stippling (dots) on (a) and (b) indicates regions where the projected change is large compared to natural internal variability (i.e., greater than two stan- dard deviations of internal variability in 20-year means) and where 90% of the models agree on the sign of change. Hatching (diagonal lines) on (a) and (b) shows regions where the projected change is less than one standard deviation of natural internal variability in 20-year means. (WGI Figure SPM.8, Figure 13.20, Box 12.1) RCP 2.6 RCP 8.5 FIGURE 4 Projections for 2100 global temperature, precipitation, and sea level changes over 1986 to 2005 average under Representative Concentration Pathway (RCP) 2.6 (1°C average increase) and RCP 8.5 (3.7°C increase) (IPCC 2014c).
35a p p e n d i x a : w h i t e p a p e r ment emphasize mitigation, with the goal of avoiding a large part of the potential global temperature increase. The agreement reaffirmed the importance of keeping the increase below 2°C from preindustrial levels and further agreed to the desirability of limiting increases to 1.5°C. The importance of early peaking and rapid reduction in global emissions was also reemphasized. A decade earlier, Stern (2006) considered the feasibility of GHG trajecto- ries from an economic perspective. Figure 6 exemplifies how the later and higher the peak, the more dramatic the necessary decline to achieve the 2°C goal. The eco- nomic costs of missing the target were estimated at 1% of annual global GDP by 2050 (ranging from a 1% gain to a 3.5% reduction), although the extensive application of carbon capture and storage was envisaged. Indeed, in both the power generation sector and the transportation sector, the key political challenge is how much to seek early reduction from behavior and con- sumer change and best available technologies and how much to rely on future technological change. Future technological change can be a politically attractive option, as it offers effective and affordable measures able to achieve greater total reductions and at a higher rate of reduction than the late peaks imply. The clear risk of such a strategy is that technologies that are as effective and affordable as hoped do not emerge, mean- ing that targets can only be met with more difficult behavioral change that may possibly require coercive measures such as rationing. Political consensus may break down under such conditions. FIGURE 5 Observed and projected climate change impacts for the main biogeographical regions in Europe.
36 d e c a r b o n i z i n g t r a n s p o r t f o r a s u s t a i n a b l e f u t u r e FIGURE 6 Illustrative emissions paths to stabilize at 550 ppm CO2e (Stern 2006, Figure 3). FIGURE 7 Global greenhouse gas emissions by economic sector (EPA 2017b, 2017c, using data from IPCC 2014a). Importance of Transportation to Global GHG Emissions Transportation is a large and growing source of global greenhouse gas emissions. Globally, transportation pro- duces about one-seventh of anthropogenic GHG emissions (Figure 7). This total includes developing and developed economies and emissions from agriculture, forestry and land use changes, and energy use. Transportationâs share is larger than the global average of 14% in the European Union (Figure 8a: 25%) and the United States (Figure 8b: 27%) because of higher levels of transportation activity and motorization (EEA 2016b; EPA 2017a). When inter- national bunker fuels are included, transportationâs share increases to 30% or more (Table 1). While total EU GHG emissions [4,282 metric tons carbon dioxide equivalent (CO2e) in 2014] have been declining and were 24% below 1990 levels in 2014, transportation was the only major sector whose GHG emissions in 2014 were higher than in 1990 (EEA 2016a). Electricity and Heat Production 25% Agriculture, Forestry, and Other Land Use 24% Transportation 14% Industry 21% Other Energy 10% Buildings 6% G lo b al E m is si on s (G t C O 2e )
37a p p e n d i x a : w h i t e p a p e r Total U.S. GHG emissions from transportation were 3% higher in 2015 than in 1990, but 9% lower than the peak level in 2005 (EPA 2017a). In the United States, transportationâs GHG emissions surpassed those of the electric power sector for the first time in 2016, making transport the largest source of CO2 emissions in the U.S. economy (EIA 2017a). Unlike other sectors of the economy, transportationâs GHG emissions consist almost entirely of CO2 from fos- sil fuel use in internal combustion engines (Figure 9). CO2 comprises 96% of transportâs GHG emissions in the United States and the European Union (EIA 2017a). The next largest component (<3%) consists of fluori- nated gases used in automotive air conditioners and mobile refrigeration. For the past half century, whether globally, in the European Union, or in the United States, approximately 95% of transportâs energy has come from petroleum (EIA 2017a). The lack of diversity in both energy use and GHG gases makes transportation unique among economic sectors. On-road vehicles create the majority of transporta- tionâs GHG emissions, producing 73% of transport GHG emissions in the European Union, followed by aviation and navigation at 13% each (EC 2017). Rail travel accounts for less than 1% (Figure 10). Because most modes rely predominantly on petroleum fuels for energy, emissions are strongly correlated with energy use, with the most notable exception of rail, whose share of GHG emissions is less than half its share of energy use owing to substantial electrification. In the United States, more than 85% of transporta- tionâs CO2 emissions comes from on-road vehicles, and three-quarters of that is from passenger cars and light trucks (Figure 11). Air travel is the next largest source, producing 9% of U.S. transportationâs CO2 emissions. Emissions by both freight and passenger rail consti- tute only 3% of the total, while domestic waterborne vessels are responsible for less than 2%. Neither the air nor the water mode numbers include international operations. 1.A.1.b - Petroleum Refining - CO2 3% 1.A.4.a - Commercial/ Institutional - CO2 4% 1.A.4.b - Residential - CO2 11% Other 10% 1.A.2 - Manufacturing Industries and Construction - CO2 15% 1.A.3.b - Road Transportation - CO2 25% Electricity Generation 29% Transportation 27% Industry 22% Agriculture 9% Commercial 6% Residential 6% U.S. territories 1% 1.A.1.a - Public Electricity and Heat Production - CO2 32% FIGURE 8 Greenhouse gas emissions by economic sector: (a) European Union 2014 (EEA 2016b, Figure 3.2) and (b) United States, 2015 (6,586 million metric tons CO2e) (EPA 2017a, Table ES-6). TABLE 1 Greenhouse Gas Emissions by Energy Subsector, 2013 Location Greenhouse Gas Emissions (millions of tons CO2e) by Energy Subsector Electricity and Heat Manufacture and Construction Transport Transport (%)a Other Fugitive Bunker Fuels Total EU-28 1,414 418 861 30 713 69 269 3,743 United States 2,380 441 1,688 32 649 338 117 5,612 World 15,301 6,110 7,383 23 4,141 2,585 1,105 36,626 aTransport percent includes bunker fuels. Source: EEA 2016. (a) (b)
38 d e c a r b o n i z i n g t r a n s p o r t f o r a s u s t a i n a b l e f u t u r e Fossil fuel combustion: carbon dioxide (96.0%) Fossil fuel combustion: other greenhouse gases (0.9%) Use of fluorinated gases (2.6%) Other transportation categories (0.5%) FIGURE 9 U.S. greenhouse gas emissions from the transporta- tion sector, 2014 (emissions in million metric tons CO2e) (EPA 2017b, 2017c). FIGURE 10 EU transport GHG emissions and shares by mode, 2014 (EEA 2016b). FIGURE 11 U.S. transport GHG emissions (metric tons CO2e) by mode, 2014 (Davis et al. 2016, Table 11.8). Air, 150.1 Water, 28 Heavy-Duty Road, 420.7 Light-Duty Road, 1,050.7 Rail, 45.8 Rail 1.6% Maritime 10.6%Other 0.8% Inland navigation 1.1% Aviation 12.6% Road transport 72.8% Civil aviation 13.1% Other 0.5% Navigation 13.0% Railways 0.6% Road 73.4%
39a p p e n d i x a : w h i t e p a p e r Well-to-Wheels Emissions Direct emissions from motor vehicles can understate the impact of transportation on the global environment. GHGs are produced at all phases of the exploration, extraction, transport, conversion, and delivery of the fuel for propelling motor vehicles. Well-to-wheels (WTW) analysis attempts to measure these upstream emissions in order to enable a more comprehensive comparison of fuel and vehicle systems. WTW analysis, like life-cycle analysis in general, has limitations: ⢠A boundary that limits what impacts are assessed must be drawn around the system. For example, WTW analysis excludes GHGs from the production and dis- posal of the vehicles themselves. ⢠When advanced technologies in a future economy are compared, assumptions must be made about the GHG intensity of linked economic sectors. For example, the WTW emissions of grid-connected electric vehicles depend strongly on the carbon intensity of the electricity grid. ⢠WTW analysis is geographically and temporally specific. For example, upstream emissions depend on the carbon intensity of electricity generation, the distances energy resources and fuels must be transported, and the modal structure of freight transport. Despite such limitations, WTW analysis provides a more complete basis for comparing fuels and vehicle tech- nologies and understanding their potential to mitigate transportationâs GHG emissions than tailpipe emissions alone. WTW GHG emissions for gasoline and diesel pas- senger cars for model years 2010 to 2020 are shown in Figure 12. A typical 2010 gasoline vehicle in the Euro- pean Union is estimated to emit about 185 grams CO2e/ kilometer on a WTW basis (about 295 grams CO2e/ mile)âsubstantially less than a similar vehicle in the United States, which is estimated at 409 grams CO2e/ mile or 254 grams CO2e/kilometer (Davis et al. 2016, Figure 11.4). In the European Union, diesel vehicles with 2010 technology emit about 145 grams CO2e/kilometer (about 235 grams CO2e/mile). By 2020, improvements in fuel economy are expected to enable hybrid gasoline vehicles in the European Union to emit less than 85 grams CO2e/kilometer and diesel hybrids less than 80 grams CO2e/kilometer. By 2020, all- electric vehicles in the European Union are expected to emit about 60 grams CO2/kilometer with electricity from the average EU generation mix, but essentially zero if electricity is generated entirely by wind or nuclear power. Cradle-to-grave analysis extends WTW analysis by including GHG emissions associated with the vehicleâs life cycle: 1. Raw material recovery and extraction, 2. Material processing and manufacturing, 3. Vehicle and component production and assembly, and 4. Vehicle disposal and recycling. For the United States, including the full vehicle life cycle adds about 10% to the WTW emissions for a con- ventional light-duty gasoline-powered vehicle, which increases estimated life-cycle emissions from 435 to 479 G H G e m is si on s (g ra m s CO 2e /k m ) Energy (MJ/100 km) FIGURE 12 WTW energy expended versus GHG emissions for conventional internal combustion engine and hybrid vehicles in the European context [DI = direct injection, PI = port injection, CI = compression ignition (i.e., diesel), SI = spark ignition (i.e., gasoline), Hyb = hybrid] (EC 2014, Figure 3.2.2-1).
40 d e c a r b o n i z i n g t r a n s p o r t f o r a s u s t a i n a b l e f u t u r e grams/mile (270 to 298 grams/kilometer) (Elgowainy et al. 2016). The potential for future 2025 to 2030 light- duty vehicles and fuels to reduce cradle-to-grave GHG emissions is illustrated in Figure 13 for gasoline and die- sel internal combustion engine vehicles (ICEVs), hybrid electric vehicles (HEVs), flex-fuel vehicles (FFVs) that run on gasolineâethanol blends of up to 85% ethanol (E85) , plug-in hybrid electric vehicles with a 35-mile electric range (PHEV35), hydrogen fuel cell electric vehi- cles (H2FCEVs), and battery electric vehicles with 90- and 210-mile ranges (BEV90 and BEV210, respectively). Efficiency improvements alone were estimated to reduce GHG emissions from about 450 grams CO2e/mile to 300 to 350 grams CO2e/mile for gasoline-powered vehicles. Substitution of biofuels, especially those produced thermo- chemically, appears to have the potential to reduce cradle-to-grave emissions to 75 to 150 grams CO2e/ mile. H2FCEVs and BEVs powered by solar- or wind- generated electricity are estimated to reduce GHG emis- sions to about 50 grams CO2e/mile, which is very close to the GHG emissions from vehicle manufacture and disposal alone. Comprehensive analysis of freight emissions considers five main determinants (Cliff et al. 2017): ⢠The structure of the logistics chain determines the amount of freight movement per unit of delivery. ⢠Modal carbon intensities vary greatly, making modal choices a critical determinant of freight GHG emissions. ⢠Utilization of facilities and vehicles incorporates factors such as vehicle loading and routing and recog- nizes the important role of facilities in the logistics chain. ⢠The energy efficiencies of facilities and vehicles determine the quantity of energy required by the utiliza- tion of vehicles and facilities. ⢠The carbon intensity of the energy used determines the quantity of GHGs per unit of energy used. Logistics, modal choice, and the integral role of freight facilities distinguish comprehensive analysis of freight GHG emissions from those of on-road passenger vehicles. Summary: Importance of Decarbonization in the Transportation Sector To conclude this first section, it is clear that mitigation rather than adaptation must be the priority in order to avoid climate change, as some of the consequences would be catastrophic for societies and economies. The requirement to mitigate within the transportation sector is also paramount, given that transportation is a major source of global GHG emissions and that, particularly in FIGURE 13 Cradle-to-grave GHG emissions of alternative fuel and vehicle technology pathways; analysis performed by using Greenhouse gas, Regulated Emissions, and Energy use in Transportation (GREET) 2014, and vehicle and fuel path- ways constrained to those deemed scalable to approximately 10% of LDV fleet (HRD = hydroprocessed renewable diesel; FTD = Fischer-Tropsch diesel; ACC = advanced combined cycle; CCS = carbon capture and storage; SMR = steam meth- ane reforming) (Elgowainy et al. 2016, Figure ES-1). G H G E m is si on s (g ra m s CO 2e /m ile )
41a p p e n d i x a : w h i t e p a p e r the United States and the European Union, the relative contribution of this sector is higher than the global aver- age. Transport sector technical solutions that theoreti- cally are able to make a major contribution to mitigation have been identified. The following sections consider the role of these solutions within the broader context of the evolving demand for mobility and transportation. 3 progress toWard agreed commitments in the u.s. and eu transport sectors Both the European Union and the United States have announced their intention to achieve large reductions in transportationâs GHG emissions by 2050. This sec- tion begins by reviewing the goals and what official pro- jections anticipate will be achieved by current policies. In the United States, new policy directions have been announced by the recently elected federal government that, if carried out, will diminish and delay GHG mitiga- tion. At the time of writing, the policy changes apply pre- dominantly to other sectors of the economy, particularly electric power generation. However, the U.S. administra- tion has also announced its intention to reconsider the existing fuel economy and GHG standards for light-duty vehicles, a cornerstone of U.S. transport GHG mitigation policy. The assessment below is based on studies done during the previous administration, which may render the results optimistic. The âUnder 2 MOUâ Commitment and the Transportation Sector Achieving the 2°C goal will require efforts by govern- ments at international, national, and subnational levels. The âUnder 2 MOUâ is a voluntary commitment by subnational jurisdictions to pursue emissions reductions consistent with a goal of reducing GHG emissions by 80% to 95% over 1990 levels by 2050, with an interim (2030) goal of 40%. The MOU observes that interna- tional efforts to date have been inadequate and that the leadership of provinces, states, and cities is needed. With respect to traffic and transportation, the Under 2 MOU commits signatories to comprehensive efforts to reduce GHG emissions: The Parties agree to take steps to reduce greenhouse gas emissions from passenger and freight vehicles, with the goal of broad adoption of âzero emission vehiclesâ and development of related zero emis- sion infrastructure. The Parties agree to encourage land use planning and development that supports alternate modes of transit, especially public transit, biking and walking. (SGCLMU 2017) Signatories to the MOU agree to collaborate and coor- dinate in a range of activities from scientific assessments to public outreach to monitoring and verifying progress. Notably, they agree to share what they learn from efforts to achieve the transition to nearly zero GHG economies. The European Commission published a strategy for transportation that calls for at least a 60% reduction in GHG emissions from transport by 2050 in comparison with 1990 and a clear pathway to zero emissions beyond (EC 2016a, 2016b). The communication to the Euro- pean Parliament identified three priority areas for action: 1. Increasing the efficiency of the transport system through digital technologies, pricing, and modal shifts; 2. Accelerating the deployment of low-emission energy such as biofuels, renewable synthetics, electricity, and hydrogen; and 3. Moving toward zero-emission vehicles. The transportation objectives and plans are part of a broader set of measures intended to transition Europe to a low-carbon economy. In June 2013, the United States published a cli- mate action plan that called for achieving a previously announced goal of a 17% reduction in U.S. GHG emis- sions below the 2005 level by 2020 (EOP 2013). The goal was conditional on all other major economies reducing their emissions as well. Strategies for transpor- tation focused on increasing fuel economy standards and developing and deploying advanced technologies such as biofuels, BEVs, and H2FCEVs. The plan also pledged to work to improve modal choice options at the state and local levels. The state of Californiaâs climate change plan is more ambitious and more comprehensive than the U.S. national plan (CARB 2017). It calls for a 40% reduc- tion in the stateâs GHG emissions over 1990 levels by 2030. Components of the plan include reduction of vehi- cle travel through land use and community designs that promote transit and nonmotorized travel, zero-emission vehicle sales mandates for manufacturers, low-carbon fuel standards, GHG emissions standards for light- and heavy-duty vehicles, a plan for sustainable freight trans- port, automated transportation and shared mobility, and reducing short-lived pollutants like methane and black carbon. Estimates of Mitigation Based on Current Initiatives The U.S. national goal of a 17% reduction in GHG emis- sions over 2005 by 2020 will almost certainly not be met by the transportation sector. Total transportation sector carbon emissions were 1,986 metric tons CO2 in 2005
42 d e c a r b o n i z i n g t r a n s p o r t f o r a s u s t a i n a b l e f u t u r e and are projected by the U.S. Energy Information Admin- istration (EIA) to be 1,872 metric tons CO2 in 2020 (EIA 2017b, Tables 7 and 19). EIAâs Annual Energy Outlook Reference Projection is intended to incorporate all cur- rent policies but no new policies (Table 2). For example, current U.S. fuel economy and GHG regulations through 2025 require approximately a 45% reduction in on- road passenger car and light truck energy intensity over 2005 levels by 2050 (EPA 2017a, 2017b).3 In the case of medium- and heavy-duty trucks, the U.S. Department of Transportation (U.S. DOT) and the Environmental Protection Agency have set fuel economy standards until 2027. The first phase of heavy-duty vehicle standards required emissions and fuel consumption reductions of 9% to 23%, depending on the type of truck, over a 2010 baseline by 2018 (EPA 2011). Phase 2 of the standards requires additional reductions of up to 25% by 2027 (EPA 2016). Together, the two phases are projected to reduce GHG emissions from medium and heavy-duty trucks by more than a billion tons of CO2. However, the EIA projection anticipates steady growth in transportation activity across most modes (Figure 14). Road traffic is projected to increase at just under 1% per year through 2050, with road freight traf- fic growing at 1.3% per year. Air travel is projected to grow at 2.2% per year until 2050. Steady improvement in the energy efficiencies of air travel and freight trucks, combined with rapid improvements in the fuel economy of light-duty vehicles that are expected to end in 2025 3 The estimate of 45% reduction was obtained by dividing the on-road fuel economy of passenger cars and light trucks of 20.2 miles per gallon in 2005 [according to U.S. DOT Federal Highway Administration Table VM-1 data (https://www.fhwa.dot.gov/policy- information/statistics/2013/vm1.cfm)] by the EIAâs projected on-road 2035 light-duty vehicle fuel economy of 36.5 mpg. (Figure 15), is the main cause of declining CO2 emissions until 2035 (Figure 16). The European Union expects to achieve its 2020 tar- get for reduction of GHG emissions (EEA 2016d). How- ever, beyond 2020, the reduction scenario requires an accelerated rate of reduction, whereas the current predic- tions show a declining rate of reduction, even with addi- tional measures. The transportation sector is a notable contributor to this problem, given it continues to follow a long-run trend increase (Figure 17). Current policies included in the Reference Scenario are summarized in Table 2. The performance of the EU transportation sector against climate change objectives is an important part of the European Environment Agencyâs (EEAâs) Trans- port and Environment Reporting Mechanism. The cur- rent strategy can be summarized as the transportation sector being expected to make a contribution to the overall reduction target of 60% reduction by 2050 even while transportation activity continues to grow. Indeed, growth rates comparable to those for the United States are forecast as follows: passenger transportation growth of about 40% (2010 to 2050), with aviation activity doubling, and freight transport growing by 58%. The EEAâs (2016a, 2016b) assessment was that some emis- sions reduction would occur over the next 15 years, but the 2011 EU Transport White Paper ambition of limiting 2030 emissions to an 8% increase over 1990 will not be achieved (EC 2011b). Beyond 2030, an increase to 2050 equivalent to 15% over 1990 is currently forecast. Figure 18 presents the trends from 1990 to 2014, highlighting the effect of the global recession of the late 1990s and, for overall transport, a return to growth in recent years, also in the context of falling global oil prices. TABLE 2 Summary of Policies Included in EU and U.S. Reference Scenarios EU Policies in Reference Scenario 2016 U.S. Policies in Annual Energy Outlook 2017 Reference Case Regulation of CO2 from cars and vans GHG and Corporate Average Fuel Economy (CAFE) standards for light-duty vehicles to 2025 Euro VI standards for heavy-duty vehicles GHG emissions standards for medium- and heavy-duty vehicles through 2027 EU directive on renewable energy Renewable Fuels Standards (projected to fall short of goals) EU directives on vehicle charging and alternative fuels infrastructure Tax credits and CAFE credits for plug-in, fuel cell, and alternative fuel vehicles EU directives on freight, air, and rail operations Requirements for fleet purchases of alternative fuel vehicles International Maritime Organization regulations on ship efficiencies International Civil Aviation Organization convention on aircraft emissions Numerous national policies not specifically listed, promoting alterna- tive fuel vehicles and infrastructure, road pricing, and more. State policies: Californiaâs Zero Emission Vehicle program; CA SB-32 requiring statewide GHG reduction of 40% by 2030 Source: EC 2016b, Annex 4.1; EIA 2017b, Appendix A.
43a p p e n d i x a : w h i t e p a p e r FIGURE 14 Projected U.S. transportation activity to 2050 (EIA 2017b). Figure 16 Projected U.S. transportation CO2 emissions to 2050 (EIA 2017b). FIGURE 15 Projected U.S. modal fuel economy to 2050 (EIA 2017b). M et ri c to ns C O 2 Transport, excluding aviation and shipping (Historic emissions) Buildings (Historic emissions) Agriculture (Historic emissions) Industry (Historic emissions) Waste (Historic emissions) Transport, excluding aviation and shipping (Projections âwith existing measuresâ) Buildings (Projections âwith existing measuresâ) Agriculture (Projections âwith existing measuresâ) Industry (Projections âwith existing measuresâ) Waste (Projections âwith existing measuresâ) Transport, excluding avaiation and shipping (Projections âwith additional measuresâ) Buildings (Projections âwith additional measuresâ) Agriculture (Projections âwith additional measuresâ) Industry (Projections âwith additional measuresâ) Waste (Projections âwith additional measuresâ) 1,200 1,000 800 600 400 200 0 1990 1995 2000 2005 2010 2015 2020 2025 2030 FIGURE 17 EU GHG emissions trends and projections by sector (EEA 2016d, Chart 2.4). M et ric t on s C O 2e
44 d e c a r b o n i z i n g t r a n s p o r t f o r a s u s t a i n a b l e f u t u r e 1,200 1,000 800 600 400 200 0 Transport including aviation Target 2030 total International maritime transport Target 2050 total Target 2050 maritime 2030 transport target (+ 8% on 1990 levels) 2050 transport target (60% reduction on 1990) 2050 maritime target (40% reduction on 2005) FIGURE 18 EU-28 Transport GHG emissions and targets (2014 data) (EEA 2016c, Figure 2.2). A key aspect of the EU strategy, particularly given that passenger cars and vans account for 55% of all EU transport carbon emissions, is for the average emissions performance of new light vehicles sold to fall toward regulated targets. The sales and official emissions data showed a reduction in average emissions from new pas- senger cars of nearly 15% from 2010 to 2015, with the 130 grams CO2/kilometer target for 2013 having been met 2 years early. Light-goods vehicles are a growing share of road traffic that is linked to the rise in small businesses and delivery services. The average emissions of new vans registered in the European Union already meet the 2017 target of 175 grams CO2/kilometer by a margin of around 10% (Figure 19). These achievements need to be set in the context of the concern that the official carbon emissions test data are very optimistic, and less accurate than those in the United States, although this is less of an issue for the monitoring FIGURE 19 Average emissions (grams CO2/kilometer) for new passenger cars and vans in the EU-27 (EEA 2016c, Figure 2.11). Tailpipe emissions (grams CO2/km) Tailpipe emissions (grams CO2/km) 2015 target for new passenger cars (130 grams CO2/km) 2017 target for new vans (175 grams CO2/km) 2020 target for new vans (147 grams CO2/km) 2020 target for new passenger cars (95 grams CO2/km)
45a p p e n d i x a : w h i t e p a p e r of relative improvement over time (Mock et al. 2014). In any case, the next target, for 2021, of a 95 grams CO2/kilometer new sales average requires a further 21% reduction, and uncertainties remain as to how this could be achieved. Low-Carbon Fuel Standards The state of California employs a low-carbon fuel stan- dard that requires a 10% reduction in the carbon inten- sity of transportation fuels by 2020. Similarly, according to the Renewable Energies Directive 2009/28/EC, each EU member state must achieve a market share of 10% for renewable energy consumed in the transport sector by 2020. By 2015, two member states (Finland and Sweden) had achieved this requirement by more than double. The main policy measures behind this success are tax incen- tives for the fuels and a high market penetration of alter- native (ethanol or biogas) vehicles and vehicles capable of operating on multiple fuels. Although the other member states showed much lower take-up, average market share in the European Union was 6% and growing, although with considerable variability (EEA 2016c). Alternative Fuel Vehicles In the United States, in contrast to the substantial increases in energy efficiency for all road vehicles required by the Corporate Average Fuel Economy and GHG Emissions Standards, the growth of alternative, low-carbon vehi- cles and fuels is projected to increase slowly. BEVs are projected to reach 3% of vehicles in use by 2030 and plug-in hybrids will not make up 3% of vehicles on the road until about 2040 (Table 3). H2FCEVs are projected to constitute less than 1% of light-duty vehicles even in 2050. In 2050, less than 15% of the light-duty vehicles on U.S. roads are projected to employ alternative, low- carbon technologies. The European Union does not have a target for the adoption of alternative fuel vehicles, although policies to promote them are widespread among member states and the rate of adoption is monitored. The registrations of plug-in hybrids have shown linear but sharp growth to more than 100,000 vehicles by 2015. Electric vehicles show a less-steep but steady growth to 50,000. In con- trast, from a peak of half a million vehicles in the late 2000s, liquid petroleum gas is in decline as an alterna- tive fuel, owing to safety constraints on its use and as incentives are switched to cleaner alternatives. Natural gas remains attractive for specific applications, notably in city buses. However, both of the main gas fuels are fossil fuels with little or no carbon reduction benefit and are primarily promoted for reasons of air quality. Summary: Current Policies Are Insufficient Although the United States and the European Union show some differences with respect to mitigation targets and the projected impacts of current policies (listed in Table 2), both currently committed policy measures will lead to significant overshooting of the 2050 objective according to the reference scenario projections of the EC and EIA. Greater mitigation efforts will be required to achieve the 2°C goal. 4 Why is achieving ghg reduction in the transport sector so challenging? The transportation sectorâand in particular the private carâhas been fundamental to the postwar prosperity of the Western democracies. The automobile industry has been a key generator of jobs and profits, while its products have led to greater labor market flexibility and accessibility generally, as well as a key factor bringing a sense of well-being to citizens as part of the social con- tract of Fordist capitalism. However, automobility has resulted in societies and economies oriented around the car. This coevolution is not easily unpicked in a way comparable with retrofitting the building stock with bet- ter insulation or converting grid electricity from fossil to renewable sources. Whereas the latter changes might not be noticed or even bring comfort and cost benefits TABLE 3 Projected U.S. Alternative Energy Vehicles in Use to 2050 Vehicle Type 2015 2020 2030 2040 2050 Battery electric vehicle (BEV) 0.29 1.19 7.91 13.62 17.23 Plug-in hybrid electric vehicle (PHEV) 0.25 1.13 5.51 8.76 10.36 Hybrid electric vehicle (HEV) 3.60 5.06 8.27 10.96 12.66 Natural gas vehicle (NGV) and liquefied petroleum gas (LPG) 0.31 0.56 0.63 0.66 0.70 Hydrogen fuel cell electric vehicle (H2FCEV) 0.00 0.08 0.88 1.44 1.70 Total alternative 4.45 8.02 23.20 35.44 42.65 Total light-duty vehicle stock 239.88 250.45 266.25 280.01 294.80
46 d e c a r b o n i z i n g t r a n s p o r t f o r a s u s t a i n a b l e f u t u r e to consumers, intervention in the transportation market can imply change, and even disruption, for citizensâ and businessesâ established and valued practices. This section reviews some of the principal factors that pose a chal- lenge to radical reduction of GHGs. Insufficient Strength of the Knowledge Base, Policy Frameworks, and Infrastructure The ability to implement public policies to mitigate transportâs GHG emissions requires an understanding not only of how to formulate effective policies, but of how much can be accomplished, what the costs and benefits will be, and how policies will interact. Much is known about energy efficiency policies that have been employed for more than four decades, yet some contro- versy still remains. Urgently and efficiently accomplishing large reduc- tions in motorized vehicle use and its associated green- house gas emissions presents a new and complex challenge. The knowledge base for reducing motorized transportation and improving system efficiency also has a long history and has been extensively studied. On the other hand, the subject is more complex, as it depends strongly on the systemic interactions of geography, behavior, infrastructure, technology, economics, and social systems. Some changes, like parking fees or motor vehicle exclusion zones, can be implemented relatively quickly. Others, like urban densification and redesign, require decades to accomplish. Future technological changes, particularly connected and automated vehicles, are likely to have profound impacts. Previous efforts to replace petroleum fuels have had little success, with only a few exceptions (McNutt and Rodgers 2004). The barriers to large-scale energy tran- sitions are substantial, complex, and generally not well understood. On the other hand, much has been learned and will continue to be learned from experience promot- ing grid-connected electric vehicles and H2FCEVs. Accomplishing a large-scale energy transition for transportation presents public policy with novel chal- lenges. The time constants for large-scale, fundamental changes in vehicle and fuel technology are measured in decades rather than years (NRC 2013). Lead times for profound changes in motor vehicle manufacturing are at least 5 to 10 years. Engineering and capital constraints require that not all models can be redesigned at the same time and that a minimum of 5 years is requiredâand much more when there are market and technological risks. With the expected life of a new vehicle at 15 years or longer, turning over the majority of the vehicle stock takes another 15 years or so. For new fuels like hydro- gen and electricity, a refueling infrastructure must be coevolved with the vehicle fleet. When this is added up, the accomplishment of an energy transition for transpor- tation by 2050 is a daunting task on the basis of the time constants alone. Over such a time frame, there is great uncertainty about technology and market conditions. Differences between social and market discounting of future costs and benefits can be substantial. Lack of fuel availability is a major barrier to vehicle sales during the early tran- sition and, at the same time, the lack of fuel demand discourages investments in an alternative fuel infrastruc- ture. Risk aversion and unfamiliarity with novel tech- nologies are important barriers to consumer acceptance. Institutional unfamiliarity, reflected in inappropriate codes and standards, can also hinder the deployment of refueling infrastructure. Lack of diversity of choice of makes, models, and vehicle types restrains demand for alternative vehicles. On the vehicle supply side, costs for alternative vehicles and fuels can be inflated by lack of scale economies and by learning by doing. In the case of the leading zero-emission vehicle technologies, there is also a need for continued technological progress to reach a stage of development at which they could capture the majority of the motor vehicle market. The complexity of these barriers argues for a com- prehensive, multidimensional policy strategy. The bar- riers to energy transition diminish as markets for new vehicles and fuels develop. As a consequence, the process of energy transition contains strong positive feedback that create path dependencies and, potentially, tipping points. When uncertainty about conditions decades in the future is added, it becomes clear that public policy must learn from experience and adapt to changing con- ditions in order to successfully bring about the coevolu- tion of vehicle markets and fuel infrastructures. When these factors are combined with substantial uncertainty, it becomes clear that public policies must be comprehen- sive, adaptable, operate at all geographical scales, and be informed by a continuously improving understanding of the barriers to the transition to low-carbon energy.4 Constraints: Economic and Spatial Structural Factors Limiting Change As outlined in Section 2, both the United States and the European Union envisage significant growth in transpor- tation demand. Carbon intensity is an indicator of the extent to which an activity, or indeed an entire economy, relies on CO2-emitting processes or, in principle, GHGs more generally, in its accomplishment. Stern (2006, p. xi) observed that reduction of GHG emissions would need to be achieved in the context of perhaps fourfold global 4 Further consideration is given to the issues of systemic transition toward a low-GHG transportation system in Appendix B of this volume.
47a p p e n d i x a : w h i t e p a p e r economic growth. Hence, emissions per unit GDP would need to fall by 75% just to achieve stable emissions in the context of maximum likely growth. For a 60% to 70% real-terms reduction to be achieved while this level of growth is allowed for, overall carbon intensity would need to fall by more than 90% per unit GDP. However, the economy has until now remained highly dependent on low-cost high-carbon transportation sys- tems to reduce economic transaction costs and there- fore lubricate GDP growth. Much of the emphasis on decoupling the economy from high-carbon transporta- tion has focused on the carbon aspect of the relationship. However, the reliance on transportation itself could potentially be addressed. In this context it is important to recognize that forms of spatial development differ in their carbon intensity, principally because they are more or less attractive to different forms of mobility, which in turn differ in their efficiency. A key example in this regard is the car-oriented residential suburbs. The low density of the suburbs means average walking distances to destinations or to public transportation are high. The design of the local road network encourages relatively fast travel by car, which bus services can compete with, while the penetrability of the residential neighborhoods is often difficult for large vehicles. Minibus services, perhaps on demand, may be possible but tend to be expensive to operate. Differences in the extent of car- dependent development are one of the explanations for the rates of walking and cycling observed in Figure 20. The critical importance of walking distance is revealed by Figure 21, which is based on data from the UK: for all trips less than 1 mile in length, more than three-quarters are already made on foot, and around a fifth are made by car. Walking rates drop to less than one-third for jour- neys between 1 and 2 miles, while the car dominates. Therefore, if residential developments were to offer a wider range of facilities closer to peopleâs homes, then more of those trips would become walkable. Second, some patterns of production and consump- tion are more carbon intensive than others. The global- ization of world economic relationships has resulted in increases in freight demand for both raw materials and consumer goods, with production increasingly concen- trated in Asia, while North America and Europe repre- sent key consumer markets. However, such effects can also be observed at the local and regional scale. Analysis for the United King- dom showed the importance of medium-range commut- ing by car (Figure 22). Nevertheless, aside from their carbon intensity, those forms often remain problem- atic in terms of accessibility performance. Having been developed originally as efficient forms for societies that P er ce nt ag e of t rip s b y cy cl in g an d w al ki ng FIGURE 20 Cycling and walking share of daily trips in Europe, North America, and Australia, 1999â2009 (Buehler and Pucher 2012, Figure 1). (Note: The lat- est available travel surveys were used for each country; the year of the survey is noted in parentheses after each countryâs name. The modal shares reflect travel for all trip purposes except for those countries marked with an asterisk, which only report journeys to work derived from their censuses. Dissimilarities in data collec- tion methods, timing, and variable definitions limit the comparability of the modal shares shown.)
48 d e c a r b o n i z i n g t r a n s p o r t f o r a s u s t a i n a b l e f u t u r e were intentionally becoming car dependent, they have at many times and places become overwhelmed with the traffic they have generated, which is often beyond that predicted by deterministic forecasts and which did not allow for the flexible response of human behavior. Car-dependent urban forms and societies have cre- ated winner and loser groups. Holding of a car license is in fact far from ubiquitous among the eligible popu- lation, and many citizens cannot drive a motor vehicle on grounds of age, ability, or health. Access to a car is also scarcer than patterns of license-holding suggest, as some households do not own cars and there may be competition for access to vehicles in those that do. Gen- der and ethnic differences are observed in the ownership and access statistics, with women and ethnic minorities underrepresented. In some cases, this underrepresenta- tion leads to disadvantageous access to employment and social opportunities. Moreover, studies of gender and <1 mile 1â2 miles 2â5 miles 5â10 miles 10â25 miles 25+ miles 16 14 12 10 8 6 4 2 0 Under 1 mile 1 mile to under 2 miles 2 to under 5 miles 5 to under 10 miles 10 to under 25 miles 25 to under 50 miles Over 100 miles Other leisure Holiday or day trip Visiting friends elsewhere Visiting friends at private home Other personal business or escort Shopping Education or education escort Business Commuting 50 to under 100 miles FIGURE 21 Critical importance of walking distance (DfT 2014, Table NTS0308, for England in 2014). M ill io n to nn es o f C O 2 FIGURE 22 Delivering sustainable low-carbon travel (DfT 2009, Figure 2.1). <1 mil 1â2 il s 2 iles iles 10â25 il s > miles Walk Bicycle Car/Van Local bus Rail Other transport P er ce nt ag e of t rip s (m ai n m od e)
49a p p e n d i x a : w h i t e p a p e r access to motor vehicles indicate that access to motor vehicles in households can be influenced more by per- ceived status than objective need, with women more often having complex journeys with multiple purposes linked together (Bianco and Lawson 1996). Opportunities to address structural car dependence are considered in Section 5. Transportation Choices Often Favor High-Carbon Options While many transportation decisions are constrained, consumers and producers alike do often have choices. These choices can be critical for carbon dependence, as shown in Figures 23 and 24, which consider intensity in terms of emissions per unit distance traveled, as this is relevant for comparing substitute transportation modes. When typical vehicle occupancy and energy sources are allowed for, travel in large cars and taxis emerges as particularly carbon intensive per unit distance, whereas long-haul aviation lies in the range exhibited by high- speed rail services (Figure 23). What this comparison does not consider is the typical speed of travel by the mode, which is important, as personal travel time budgets are relatively stable across cultures (Marchetti 1994). That is to say, it is not distance that is the primary influence on total desired mobility, but costs and travel time. As the United States and the European Union have increasingly invested in high-capacity, high-speed transportation systems, affordability and acceptability for long-dis- tance travel have increased, leading to the phenomenon referred to as âhypermobility.â The result is that, while emissions per kilometer from a typically full passenger car are similar to those from a typically full airplane, the distance covered means a single transatlantic return trip can in some cases contribute more to a personal carbon budget than an entire yearâs automobile use. A similar account exists for the comparison of freight modal intensity. Aviation is particularly carbon inten- sive, and even domestic shipments tend to be relatively long haul compared with surface modes. Modern con- tainerized sea freight is highly carbon efficient per ton- kilometer, but the quantities of tons and kilometers involved are enormous and rising in the context of eco- nomic globalization (Figure 24). While time is more important than distance for many transportation and mobility decisions, cost is the other key logistical element in the decision. It is clear that pri- vate car travel continues to be a financially attractive solution, even for those who can make choices. The EU-28 price index shows a decade-long trend in the fall- ing cost of investing in a private car, which is the only indexed transportation price seen to have fallen in Fig- ure 25. Personal transportation operating costs have fluctuated, while public transportation costs show trend increases. So rather than signaling the high external costs of car use, as recommended by many environmental and trans- portation economists, prices have reinforced the struc- tural elements of decision. Finally, it should be noted that choices reflect not only logistical factors but also social and psychological fac- tors. For many, car travel and long-distance, high-speed travel in general are signals of personal economic prog- ress, social esteem, and even personality. To regard these factors as the irrational side of rational decision-making factors is mistaken. While social presentation is some- times conscious and other times unconscious, for both individuals and organizations it is a highly important matter and entirely rational and represents good value for money in that context. While low-carbon transpor- tation choices are becoming more important for organi- zations concerned with the triple bottom line and with particular consumer segments that are environmentally aware, many transportation choices continue to reflect Air (long haul) Air (short haul) Bus (well-used service) Rail (high speed) Rail (normal, suburban) Car (Large, SUV, etc.) Car (medium size) Car (most efficient) CO2e per kilometer FIGURE 23 Relative GHG intensity of passenger trans- port modes (CO2e/pass-kilometers) (EEA 2008, Figure 13.1). Air, short Air, long Road, rigid Road, articulated Rail Water, container Water, general Water, bulk Note: All figures are kilograms carbon dioxide equivalents per tonne kilometer (kgCO2e/t.km). Figures based on a WTW analysis of fuel used and average loading per vehicle. For air freight, long is greater than 3,700 km while short is less than that; no radiative forcing index multiplier is used. Road vehicles are based on UK diesel truck averages. Rail is based on UK diesel and electric trains. All water vessels are ships, not ferries. FIGURE 24 Freight transport intensity (CO2e/tonne- kilometers). (Source: UK Department for the Environment, Food and Rural Affairs, emissions data.)
50 d e c a r b o n i z i n g t r a n s p o r t f o r a s u s t a i n a b l e f u t u r e individual aspirations and the importance of projecting an image of wealth consumption in a social arena. The Difficulty of Effecting Behavior Change and Rebound Effects Travel behavior shows strong response to circumstances in which supply is interrupted by strikes, fuel shortages, and natural phenomena such as volcanic eruptions, earthquakes, and weather events. Individual and collec- tive adaptation in these circumstances can be dramatic. However, those changes are typically involuntary and tend to be reversed once conditions allow. Initiatives for voluntary behavior change are complex to deliver and often intensive in their human resource demands. The outputs and outcomes are generally less tangible than those from infrastructure provision and may be hard to confirm through evaluation. Although behavior can be hard to influence through policy, change does occur, and there is already signifi- cant variation between individuals in the same society that is not explained solely by differences in constraints or purchasing power. The resurgence in cycling in many developed countries in large part reflects the decisions of individuals who have the economic means to use private motor vehicles, and often do own cars, but choose to cycle for reasons such as health and well-being benefits. However, past expectations about the benefits of behavior change have sometimes emerged as optimistic because of rebound effects. These typically occur when a change toward a more efficient technology is analyzed without taking sufficient account of the reductions in consumer cost that stimulate greater use of the good. For example, in the United States, fuel economy improve- ments driven largely by regulatory standards have reduced fuel consumption by more than a trillion gallons since 1975. However, improved fuel economy has also increased vehicle use somewhat, the rebound effect being the difference between the dark blue line (actual traffic) and the dotted line in Figure 26, which represents the estimated vehicle travel that would have evolved in the absence of the fuel economy improvement. Summary: A Holistic Response Is Required to Maximize Change As was demonstrated in Section 3, reducing transport GHG emissions by 80% to 90% by 2050 will require addressing the transportation system holistically, that is, considering all modes of transportation and all practical means of GHG reduction. Assessments of the potential to reduce global GHG emissions by 80% or more by 2050 conclude that âdeep cuts in emissions will require a diverse portfolio of policies, institutions and technolo- gies as well as changes in human behavior and consump- tion patternsâ (IPCC 2014a, p. 114). The Global Energy Assessment, probably the most comprehensive analysis of alternative global energy futures, concluded Without question a radical transformation of the present energy system will be required over the coming decades. Common to all pathways will be very strong efforts in energy efficiency improve- ment for buildings, industry and transportation, offering much needed flexibility to the energy sup- ply system. (IIASA 2012) FIGURE 25 Real change in transport prices by mode in the EU-28 (EEA 2016c, Figure 2.9). 1996 1997 1998 1999 2000 2001 2002 2003 2004 2005 2006 2007 2008 2009 2010 2011 2012 2013 2014 2015 EU-28 â Index (2005 = 100) 130 125 120 115 110 105 100 95 90 85 80 Purchase of motor cars Passenger transport by air Passenger transport by road Operation of personal transport equipment Overall transport Passenger transport by railway Passenger transport by sea and inland waterway Note: Real change in passenger transport prices by mode, relative to average consumer prices based on the United Nations classification of individual consumption by purpose (COICOP). Passenger transport by road includes exclusively transport of individuals and groups of persons and luggage by bus, coach, taxi and hired car with driver.
51a p p e n d i x a : w h i t e p a p e r However, energy efficiency alone is not nearly sufficient. Greatly increased use of renewable energy also appears to be an essential component of a low-GHG future. However, whereas in some economic sectors technologi- cal substitution can play a dominating effect, the goal of reducing GHG emissions by 80% to 90% requires com- prehensive system change. Options to reduce emissions through behavioral change, land use and development patterns, modal structure, pricing, and system efficiency must all be taken into consideration. These various potentials are considered in the next section. 5 mitigation measures for deeper, sWifter change The IPCC (2014a, p. 603) concluded that four funda- mental dimensions must be included to have a reason- able chance of successfully reducing emissions by 80% to 90% by 2050: ⢠Improving vehicle energy efficiency, ⢠Reducing the carbon (GHG) intensity of energy sources, ⢠Reducing the level of motorized transport activity, and ⢠Improving the efficiency of the transport system. This section is structured around these dimensions. Improving Vehicle Energy Efficiency The U.S. energy efficiency regulations for light-duty vehicles noted in Section 2 are a critical and important step but by themselves are not nearly enough to meet the 80% to 90% reduction goal. A recent assessment of the potential to reduce GHG emissions from U.S. passenger cars and light trucks by 80% by 2050 concluded that a tripling of efficiency for internal combustion engine vehi- cles over 2010 levels was feasible and would probably be cost-effective, given future advances in technology (NRC 2013), but that even this would not be nearly enough to reach an 80% reduction. Further, reductions in U.S. transportation GHG emissions of 80% to 90% cannot be accomplished without addressing the approximately 40% of emissions that come from heavy-duty vehicles and nonroad modes. However, the improvements dis- cussed in Section 2 are already included in the Annual Energy Outlook Projections, and are expected only to restrain the growth of GHG emissions from heavy-duty vehicles. The case of the European Union is similar: with high growth forecast to 2050, much rests on a per-vehicle improvement in energy efficiency. Indeed Figure 27 indi- cates transportation intensity scarcely falling for both passenger and freight transportation in the context of an increase in GDP of more than 50%, whereas energy intensity for passenger transportation actually falls and that for freight increases only by around 10%. 3,000,000 2,500,000 2,000,000 1,500,000 1,000,000 500,000 0 225,000 200,000 175,000 150,000 125,000 100,000 75,000 50,000 25,000 0 V eh ic le M ile s (m ill io ns ) G al lo ns (m ill io ns ) Miles of Travel and Fuel Use by Light-Duty Vehicles: 1965â2014 FIGURE 26 Fuel economy improvement: disconnected U.S. vehicle travel and fuel use.
52 d e c a r b o n i z i n g t r a n s p o r t f o r a s u s t a i n a b l e f u t u r e Therefore, the strategies of both jurisdictions place great importance on the delivery of efficient technolo- gies and a stabilized energy demand provided from low- carbon sources. Reducing the GHG Intensity of Energy Sources To date, policies to reduce the carbon intensity of fuels have had less impact than policies to increase energy efficiency, an indication of the barriers to large-scale energy transitions. However, energy efficiency improve- ments alone will not be able to reduce transportationâs GHG emissions by 80% to 90% by 2050. Every anal- ysis that has demonstrated the potential to meet the reduction goal has included a transition to electric drive, BEVs, H2FCEVs, and low-life-cycle GHG fuels, as well as measures to reduce demand and improve system efficiency (e.g., NRC 2013; Yang et al. 2015). Further- more, transportationâs energy transition would need to be complemented by reductions in GHG emissions from electricity generation and the production of hydrogen. The transition to low-carbon fuels could be enhanced in the short term through the introduction and advance- ment of regulations such as the existent mandatory targets in California and the European Union for low- carbon fuels. Explicit targets for alternative fuel vehicles might be considered to assist in creating the market for the low-carbon fuels. In addition, governments could expand sponsorship of substantial research and devel- opment efforts to develop life-cycle (low) GHG biofuels. Aviation is considered a particularly difficult mode to decarbonize because of the dependence of aircraft on fuels with high-energy densities. However, the U.S. Federal Aviation Administration (FAA) and the avia- tion industry have estimated that a 40% reduction in life-cycle aviation GHG emissions over 2005 could be accomplished by a combination of alternative fuels, airframe and engine efficiency improvements, and operational improvements (FAA 2015). A 40% reduc- tion reflects the FAAâs most aggressive GHG reduc- tion scenario, which faces substantial technological challenges in all three areas but particularly the avail- ability of large quantities of low-life-cycle carbon jet biofuel (Figure 28). Without demand reduction, even greater GHG reductions would require much larger quantities of low-carbon biofuels for aviation. Noting that marine shipping is already the most energy-efficient form of cargo transportation, McCollum et al. (2009) concluded that emissions reductions of 60% from business-as-usual forecasts would be possible. The International Maritime Organization (IMO), on the other hand, projected maritime CO2 emissions to increase by 50% to 250% by 2050 under business-as-usual and current policy scenarios, even when a 40% improvement in energy efficiency is assumed (IMO 2015). The IMO study estimated that maritime GHG emissions could be returned to the level of 2012 by 2050 with a com- bination of a 60% improvement in energy efficiency and substitution of liquefied natural gas for 25% of heavy fuel oil. 240 220 200 180 160 140 120 100 80 60 240 220 200 180 160 140 120 100 80 60 Index 1995 = 100 Index 1995 = 100 1995 19952010 20102020 20202030 20302040 20402050 GDP Passenger transport activity Energy for passenger transport GDP Freight transport activity Energy for freight transport 2050 FIGURE 27 Projected EU transport energy intensity to 2050 (EEA 2016c, Figure 3.1).
53a p p e n d i x a : w h i t e p a p e r Reducing the Level of Motorized Transport Activity As introduced in Section 4, motorized vehicle travel can be reduced through pricing policies, regulations, invest- ments in infrastructure, and changes in land use and the density of development, as well as through behavioral change. If the goal of an 80% to 90% reduction in GHG emissions by 2050 is to be achieved, restraining the growth of motorized transport will be necessary. The U.S. DOT (2010) examined a comprehensive set of mitigation measures that included technology and policy options and covered all modes of transpor- tation; it concluded that improvements in system effi- ciency could make only a modest contribution by 2030: about 3% to 6% reduction in GHG emissions. Reducing carbon-intensive travel by pricing policies, investments in infrastructure for nonmotorized transportation, land use densification, diversification, and improved neigh- borhood design were found to have a much greater potential impact by 2050, up to a 20% reduction. Simi- larly, the state of Californiaâs plan for GHG mitigation targets a 15% reduction in vehicle miles traveled in 2050 (CARB 2017, p. 105). The European Commissionâfunded project EVI- DENCE (2014 to 2017) reviewed the effects of 22 types of sustainable urban mobility interventions. Of these 22 interventions, four focused directly on behavior change: personalized travel planning, site-based travel planning, marketing and rewards, and travel information provi- sion. Many of the others required behavior change toward the modes of public transportation, cycling or walking, or the sharing of assets in order to use them more efficiently (private cars, public bicycles, or urban freight consolidation). Some of the measures were asso- ciated with important changes in behavior (Black et al. 2016). For example, a review of UK implementation of organization-based travel planning that involved a range of interventions to make solo car use less attrac- tive showed single-occupant car trips reduced by a range of 4% to 18%. Such initiatives also resulted in more efficient use of site space and roads and created indirect economic benefits in terms of health and productivity that arose from increased active travel. North American studies of introducing workplace parking and cashing out parking privileges showed reductions of single- occupant car trips of 20 to 27% (Feeney 1989; Shoup 1997). Mean vehicle kilometers driven per year by car- sharing club members decreased by 27% after they joined (Martin and Shaheen 2011). Modal Shift Away from Motorized Travel As discussed in Section 3, the nature of the built envi- ronment represents a considerable constraint for walk- Li fe -C yc le C O 2 E m is si o ns (a s p er ce nt o f 20 05 le ve l) FIGURE 28 Projected impacts of life-cycle CO2 emissions on aviation GHG emissions: aggressive system improvement scenario (OIS = ophthalmic imaging system) (FAA 2015). 2005 2010 2015 2020 2025 Year 2030 2035 2040 2045 2050 200 150 100 50 0 Baseline ScenarioOperational Improvements Airframe and Engine Improvements Alternative Fuels Combustion/ tailpipe CO2 Benchmark: Baseline Scenario with âBusiness Case for NextGenâ OIS effect Feedstock production, transportation, and fuel production CO2
54 d e c a r b o n i z i n g t r a n s p o r t f o r a s u s t a i n a b l e f u t u r e ing. However, the range of trips realistically possible on a daily basis by bicycle is considerably greater. Cycling can also provide an access mode to public transporta- tion nodes, thereby increasing the effective penetration of fixed-line systems. Although cycling is undergoing a renaissance in some urban areas of the United Kingdom, it continues to account for a very small share (2%) of trips. However, some other European Union member states have managed to recover and enhance their shares of cycling since the previous peak in the 1950s (Figure 29). As in the case of walking, cycling flourishes in mixed- used developments (medium or high density), road sys- tems that accommodate different modes of travel with a fair balance of power, and cultures that have positive associations toward cycling. Flat terrain is a factor that is permissive to cycling, but modern lightweight, mul- tigear bicycles with the option of electric assistance are reducing this factor. The relative importance of cycling in northern-European countries indicates cold weather is not a major influence on cycling rates. The recent dou- bling (or more) of cycling rates in cities such as Paris; London; Seville, Spain; and Bristol, England, indicates the considerable contribution that can be possible in diverse localities. Restraining the Increase in Travel Reducing demand for transportation not only can lower the cost of other strategies, but it can increase their potential for GHG reduction as well (Yang et al. 2015). Positive externalities may arise; as observed in Section 4, labor market flexibility is important for an efficient economy. Nonetheless, policies that make the option of living closer to work easier and more desirable could influence structural emissions without necessarily impos- ing economic costs. Indeed, given the personal strain of commuting experienced by many, quality of life and pro- ductivity might increase. However, while demand restraint on motorized travel might be easier to deliver in urban areas, it needs to be emphasized that the contribution of urban transporta- tion to GHGs is less than a quarter of the total in the European Union (Figure 30). Moreover, growth in urban road traffic is often constrained by congestion, so the substantial forecast growth will mostly occur outside urban areas, and the relative importance of extra-urban transportation to emissions will also grow.5 This growth is predicted despite the promised technological devel- opments in terms of telecommunication as a potential substitute for passenger travel and remote, three-dimen- sional printing for freight consignments.6 One reason for the importance of a holistic approach for GHG reduction is the long-established principle that behavior change is more likely to occur when encour- 5 Further consideration of the future dynamics of megaregions in the United States and European Union is provided in Appendix D of this volume. 6 Further consideration of long-distance freight logistics initiatives is provided in Appendix E of this volume. Kilometers per person per year FIGURE 29 Cycling rates in 15 EU member states in 2000 (EEA 2008, Figure 11.2, based on data from Eurostat).
55a p p e n d i x a : w h i t e p a p e r aged through regulatory and fiscal measures. Parking management and pricing and restrictions on private vehicle access to city centers have generally been effec- tive in influencing transportation choices and usually good for the local economy (Black et al. 2016). More- over, a holistic approach emphasizes co-benefits, mean- ing that the objectives of sustainable mobility concern far more than the important matter of carbon mitiga- tion, including congestion reduction, equity of access, the elimination of noxious pollution, and enhancing the quality of life. There are therefore important reasons to pursue behavior change initiatives in urban areas, and there can also be modest carbon mitigation ben- efits. However, more needs to be understood about the potential of behavior change initiatives to effect carbon mitigation, the potential of three-dimensional printing, and the relevance to interurban and intercontinental travel. Improving System Efficiency Policies for reducing the level of motorized transporta- tion and improving system efficiency are more varied and implemented at a variety of scales. They include various pricing policies, from vehicle registration fees to parking fees or tolls. They also include land use planning and controls, investments in infrastructure for nonmotorized transportation, public transit and intermodal infrastruc- ture, and restrictions on motorized vehicle use. Price Levers Greene and Plotkin (2011) concluded that the addi- tion of policies such as carbon pricing, pay-at-the-pump insurance, feebates, and traffic flow improvement to technology-based energy efficiency and alternative fuels increased the potential to reduce transport GHG emis- sions by 6% to 21%. In contrast, IPCC (2014a, p. 604) concluded that over the period from 2030 to 2050, vehi- cle travel reduction measures such as urban redevelop- ment, transit-oriented development, and more compact urban forms that promote cycling and walking, together with supporting infrastructure investments, had the potential to reduce GHGs by 20% to 50% below a 2010 baseline by 2050. Both the European Union and the state of Cali- fornia have carbon cap-and-trade systems in place that induce price increases for carbon-intensive fuels, although the EU Emissions Trading System does not yet apply to the transportation sector; the European Commission proposed its inclusion in July 2016. The approach might be introduced or further developed in both jurisdictions. Efficiency, Vehicle Occupancy, and the Potential of Connected Autonomous Vehicle Systems While policies to reduce trip length and increase oppor- tunities for walking and cycling are highly desirable, the extent of past investment in car-dependent development is significant. Those localities that cannot readily be den- sified or made more heterogeneous in their activities also generally cannot readily be retrofitted with traditional public transportation solutions. However, new forms of collective mobility that are based on the sharing of small- to medium-sized passenger vehicles are showing consid- erable promise. These include informal and organized carpooling, ridesharingâliftsharing, and commercial taxi sharing. Such forms, however, should be distinguished FIGURE 30 EU transport CO2 emissions: all modes by range (EC 2011a, Figure 2).
56 d e c a r b o n i z i n g t r a n s p o r t f o r a s u s t a i n a b l e f u t u r e from the high-profile smart taxi services,7 about which there is uncertainty to date as to whether they offer car- bon efficiency over the owner-driven automobile or in fact result in higher vehicle miles traveled and emissions (Rayle et al. 2016). Indeed, much emphasis is currently placed on the potential for automation in the road transportation sector to improve environmental performance. Auton- omous or driverless vehicles represent a range of technol- ogies that are broadly divisible into levels of increasing automation on the one hand and, on the other, greater connectivity between vehicles and between vehicles and a road infrastructure system. When technical constraints alone are considered, the transition to completely driver- less road vehicles is predicted to take decades (KPMG 2015). Limited-access highways are seen as the least complex environment because of the limited set of vehicle interactions and their exclusive use by powered vehicle traffic. They are followed by urban areas, where there is some segregation of flows on streets but road- user interactions, particularly in shared spaces, remain problematic. Rural roads, which have higher speeds than those in urban areas, often lack pavements and represent the toughest challenge. Indeed, such are the complexities of the latter categories that it is not certain that the entire existing public road network in all countries can be made suitable for driverless operation. Government departments, technology developers, and industrial strategy advisors across the globe have identified numerous potential benefits from the introduc- tion of connected autonomous vehicles (CAVs). These include Vision Zero levels of road safety by eliminating human driver error, greater social inclusion in the case that people without driving licenses or driving skills can gain access to cars, and reduced congestion and emis- sions if vehicle progress is smoother because the motion is being managed with respect to the road conditions and coordinated with other vehicle movements. The business model under which such benefits would arise is not clear but tends toward one of business as usual, with most vehicles being provided on the ownerâ user basis. Under these circumstances, some potential for carbon savings might arise. Individual vehicle progress and overall network flow are likely to be smoother. Tar- get speeds in free-flow conditions may fall in a regime of autonomous driving in order to give optimal fuel efficiency. The optimal amount of time may no longer be the minimum travel time but might become the time necessary to undertake a desired activity, such as sleep 7 hours, particularly in the case of a commercial driver 7 Taxis that are booked solely via a web app and use real-time spatial information to route the nearest available vehicle to the cus- tomer. Some business models vary the supply of services to real-time demand. The services also exist in a shared taxi modality, but that option is currently limited to specific locations. requiring a statutory rest break, or matched to the length of a film a family wishes to watch together. The pros- pect of a greater variety of in-vehicle activities becoming possible may have implications for the demand for sur- face public transportation and even short-haul air travel. Some of these switches might have carbon benefits, while others may have carbon costs. Moreover, the prospect of connected vehicles increases the likelihood that the road network will become an increasingly managed system; traveling at different times and perhaps at dif- ferent speeds might attract differential pricing to match demand efficiently to capacity to encourage optimization of carbon emissions. However, increased demand for car travel as a con- sequence of CAVs is a risk for climate change mitiga- tion. Removing the limits created by the current needs for driving skills, satisfactory health and physical abil- ity, and being fit to be in charge of a vehicle (e.g., suf- ficient sleep, absence of intoxicants) would be expected to create travel demand from new travelers. Remov- ing other deterrents such as the requirement to find a parking space or navigate and drive in unfamiliar loca- tions would increase demand from existing users. In the highest-traffic scenarios, existing demand may be increased by travelers choosing to summon privately owned CAVs to and from the origin and destination to avoid parking charges at the location. An increase in CAVs above normal automotive use would likely be associated with a decrease in other types of travel, including walking. An alternative sustainable mobility regime would envisage highly efficient shared taxis dynamically routed by using predictive algorithms to meet demand. Shared CAVs might complement a mixed-mobility lifestyle that would include public transportation, walking, and cycling. However, whether the new culture of sharing, as found in some examples of the new generation of urban mobility services, can become mainstream remains to be seen. The approach would represent a major change in mobility practices, which hitherto has been hard to achieve as an outcome of policy. More needs to be known about the following: ⢠Deliverability of technology, ⢠Travelersâ willingness to share rides, ⢠Potential rebound effects, and ⢠Implications of higher car availability. Uncertainty about the impacts of CAVs on vehicular travel is enormous. A study by the U.S. Department of Energyâs National Laboratories concluded that wide- spread adoption of CAVs with extensive ridesharing could reduce personal vehicle travel by as much as 60% compared to a baseline forecast (Stephens et al. 2016). The study found that without any increase in rideshar-
57a p p e n d i x a : w h i t e p a p e r ing, CAVs could increase vehicle travel by as much as 200%. Summary: Fundamental Policy Strategies Required Comprehensive assessments of pathways to achieving deep reductions in transportation GHG emissions invari- ably conclude that there are no simple solutions. A variety of strategies that address the transportation system and its social, economic, and geographical context as a whole must be used (e.g., Yang et al. 2011). Governments at all levels have a variety of policy options available to pursue these strategies, including pricing, regulation, research development and demonstration, and information dis- semination. Determining which combinations of policies will be most effective for different mitigation strategies and different circumstances is an important and ongoing function for research.8 6 research to enaBle reduction of ghg emissions from transportation By 80% to 95% By 2050 Because transportation is the source of roughly one- fourth of EU and U.S. GHG emissions, dramatic reduc- tions in transportationâs contributions are essential to meet global climate change goals. Reductions of 80% to 90% by 2050 are needed to hold the increase in global average temperatures to 2°C. This task presents unique challenges and opportunities for public policy at all lev- els of government. Improvement in energy efficiency is an important part of the strategy yet far from suffi- cient. A comprehensive strategy addressing all modes of transportation at all scales and including all of the major opportunities for emission reduction is required. Clearly, research will play a critical role in inform- ing and guiding strategy and decision making. Because of the scale, scope, and novelty of the GHG mitigation challenge, a great deal is missing from the knowledge base needed to support decision making. The following high-level questions illustrate the enormity of the chal- lenge for research: ⢠What should transportationâs GHG reduction goals be (by 2050) â For passenger and freight modes? â For public and private transport? â For different movement purposes? â At different geographical scales? 8 Further consideration of policy governance issues is provided in Appendix C of this volume. ⢠How can progress toward the goals be reliably monitored and validated? ⢠How can the public and private sectors collaborate to achieve transportationâs mitigation goals? ⢠How much can be achieved by each of the four main strategies and, therefore, how far should policy strategy rely on each of the following? â Improving energy efficiency, â Reducing the carbon intensity of energy, â Reducing motorized travel, and â Improving system efficiency. ⢠What policy actions and technological advances will be necessary to achieve a transition to low-carbon energy for transportation? ⢠How can the transition to CAVs be managed so as to reduce rather than increase GHG emissions? The task of this symposium, identifying the critical research needs and formulating the questions that must be answered, is immensely challenging and enormously important. references Abbreviations CARB California Air Resources Board DfT Department for Transport EC European Commission EEA European Environment Agency EIA Energy Information Administration EOP Executive Office of the President EPA Environmental Protection Agency FAA Federal Aviation Administration IIASA International Institute for Applied Systems Analysis IMO International Maritime Organization IPCC Intergovernmental Panel on Climate Change NOAA National Oceanic and Atmospheric Administration NRC National Research Council SGCLMU Subnational Global Climate Leadership Memorandum of Understanding TRB Transportation Research Board U.S. DOT U.S. Department of Transportation Bianco, M., and C. Lawson. 1996. Trip-Chaining, Childcare, and Personal Safety: Critical Issues in Womenâs Travel Behavior. In Proceedings from the Second National Con- ference on Womenâs Travel Issues, Federal Highway Administration, U.S. Department of Transportation. https://www.fhwa.dot.gov/ohim/womens/wtipage.htm. Accessed April 27, 2017.
58 d e c a r b o n i z i n g t r a n s p o r t f o r a s u s t a i n a b l e f u t u r e Black, C., G. Parkhurst, and I. Shergold. 2016. The EVI- DENCE Project: Origins, Review Findings, and Prospects for Enhanced Urban Transport Appraisal and Evaluation in the Future. World Transport Policy and Practice, Vol. 22, No. 1/2, pp. 6â11. Boden, T. A., G. Marland, and R. J. Andres. 2015. Global, Regional, and National Fossil-Fuel CO2 Emissions. Car- bon Dioxide Information Analysis Center, Oak Ridge National Laboratory, Oak Ridge, Tenn. http://dx.doi. org/10.3334/CDIAC/00001_V2015. Buehler, R., and J. Pucher. 2012. Walking and Cycling in West- ern Europe and the United States: Trends, Policies, and Lessons. TR News, Vol. 280, MayâJune, pp. 34â42. CARB. 2017. The 2017 Climate Change Scoping Plan Update: The Proposed Strategy for Achieving Californiaâs 2030 Greenhouse Gas Target. https://www.arb.ca.gov/cc/ scopingplan/2030sp_pp_final.pdf. Accessed March 3, 2017. Cliff, S. S., P. T. Dube, and S. Edwards. 2017. Decarboniz- ing the Logistics and Long-Distance Transportation of Freight. In Decarbonizing Transport for a Sustainable Future: Mitigating Impacts of the Changing Climate. Summary of the Fifth EU-U.S. Transportation Research Symposium. Transportation Research Board, Washing- ton, D.C., pp. 84â92. Davis, S. C., S. E. Williams, and R. G. Boundy. 2016. Trans- portation Energy Data Book: Edition 35. ORNL-6992. Oak Ridge National Laboratory, Oak Ridge, Tenn. http:// www.cta.ornl.gov/data/index.shtml. Accessed March 2, 2017. DfT. 2009. Delivering Sustainable Low Carbon Travel. DfT, London. DfT. 2014. National Travel Survey. DfT, London. EC. 2011a. Commission Staff Working Document Accompa- nying the White Paper Roadmap to a Single European Transport AreaâTowards a Competitive and Resource- Efficient Transport System. European Commission, Brussels, Belgium. http://eur-lex.europa.eu/legal-content/ EN/TXT/PDF/?uri=CELEX:52011SC0391&from=EN. Accessed Nov. 2, 2017. EC. 2011b. White Paper on Transport: Roadmap to a Single European Transport AreaâTowards a Competitive and Resource-Efficient Transport System. COM (2011) 144 final of 28 March 2011. Publications Office of the Euro- pean Union, Luxembourg. https://ec.europa.eu/transport/ sites/transport/files/themes/strategies/doc/2011_white_ paper/white-paper-illustrated-brochure_en.pdf. Accessed Nov. 2, 2017. EC. 2014. Well-to-Wheels Analysis of Future Automotive Fuels and Powertrains in the European Context. Well- to-Wheels Report Version 4.a. Joint Research Centre Report EUR 26236 EN. http://iet.jrc.ec.europa.eu/about- jec/sites/iet.jrc.ec.europa.eu.about-jec/files/documents/ wtw_report_v4a_march_2014_final_333_rev_140408. pdf. Accessed March 3, 2017. EC. 2016a. A European Strategy for Low Emission Mobil- ity. COM(2016) 501 final. Brussels, Belgium. https:// ec.europa.eu/transport/sites/transport/files/themes/ strategies/news/doc/2016-07-20-decarbonisation/ com%282016%29501_en.pdf. Accessed March 3, 2017. EC. 2016b. EU Reference Scenario 2016: Energy, Transport and GHG EmissionsâTrends to 2050. Publications Office of the European Union, Luxembourg. http://dx.doi. org/10.2833/001137. Accessed April 20, 2017. EC. 2017. Reducing Emissions from Transport. https:// ec.europa.eu/clima/policies/transport_en. Accessed March 2, 2017. EEA. 2008. Climate for a Transport Change: TERM 2007â Indicators Tracking Transport and Environment in the European Union. EEA Report 1/2008. Office for Official Publications of the European Communities, Luxembourg. https://www.eea.europa.eu/publications/ eea_report_2008_1Accessed Nov. 2, 2017. EEA. 2016a. Analysis of Key Trends and Drivers in Green- house Gas Emissions in the EU Between 1990 and 2014. Copenhagen, Denmark. EEA. 2016b. Annual European Union Greenhouse Gas Inven- tory 1990â2014 and Inventory Report 2016. EEA Report Number 15/2016. European Commission, Brussels, Bel- gium. EEA. 2016c. Transitions Towards a More Sustainable Mobil- ity System. TERM 2016: Transport Indicators Tracking Progress Towards Environmental Targets in Europe. Copenhagen, Denmark. EEA. 2016d. Trends and Projections in Europe 2016: Tracking Progress Towards Europeâs Climate and Energy Targets. Copenhagen, Denmark. EIA. 2017a. Monthly Energy Review, Feb. 24, Tables 12.2 to 12.6. http://www.eia.gov/totalenergy/data/monthly/index. php#environment. Accessed March 2, 2017. EIA. 2017b. Annual Energy Outlook 2017. http://www.eia. gov/outlooks/aeo/pdf/0383(2017).pdf. Accessed March 3, 2017. Elgowainy, A., J. Han, J. Ward, F. Joseck, D. Gohlke, A. Lindauer, T. Ramsden, M. Biddy, M. Alexander, S. Barnhart, I. Sutherland, L. Verduzco, and T. J. Walling- ton. 2016. Cradle-to-Grave Lifecycle Analysis of U.S. Light-Duty VehicleâFuel Pathways: A Greenhouse Gas Emissions and Economic Assessment of Current (2015) and Future (2025â2030) Technologies. ANL/ESD-16/7. Argonne National Laboratory, Argonne, Ill. https://greet. es.anl.gov/publication-c2g-2016-report. EOP. 2013. The Presidentâs Climate Action Plan. https:// obamawhitehouse.archives.gov/sites/default/files/image/ president27sclimateactionplan.pdf. Accessed March 3, 2017. EPA. 2011. EPA and NHTSA Adopt First-Ever Program to Reduce Greenhouse Gas Emissions and Improve Fuel Efficiency of Medium- and Heavy-Duty Vehicles. EPA- 420-F-11-031.
59a p p e n d i x a : w h i t e p a p e r EPA. 2016. EPA and DOT Finalize Greenhouse Gas and Fuel Efficiency Standards for Heavy-Duty Trucks. https://www.epa.gov/newsreleases/heavydutyaug162016. Accessed March 6, 2017. EPA. 2017a. Inventory of U.S. Greenhouse Gas Emissions and Sinks: 1990â2015. EPA-430-P-17-001. https://www.epa. gov/sites/production/files/2017-02/documents/2017_com plete_report.pdf. Accessed March 2, 2017. EPA. 2017b. Final Determination on the Appropriateness of the Model Year 2022â2025 Light-Duty Vehicle Green- house Gas Emissions Standards Under the Midterm Eval- uation. EPA-420-R-17-001. EPA. 2017c. Global Greenhouse Gas Emissions Data. https://www.epa.gov/ghgemissions/global-greenhouse- gas-emissions-data. https://www.epa.gov/sites/produc tion/files/2016-05/global_emissions_sector_2015.png. Accessed March 6, 2017. FAA. 2015. U.S. Aviation Greenhouse Gas Reduction Plan. Submitted to the International Civil Aviation Organiza- tion June 2015. https://www.faa.gov/about/office_org/ headquarters_offices/apl/environ_policy_guidance/pol icy/media/2015_US_Action_Plan_FINAL.pdf. Accessed March 6, 2017. Feeney, B. P. 1989. A Review of the Impact of Parking Policy Measures on Travel Demand. Transportation Planning and Technology, Vol. 13, No. 4, pp. 229â244. Galperin, A., and E. Wilkinson. 2015. Strengthening Disaster Risk Governance. United Nations Development Program Support During the HFA Implementation Period 2005â 2015, New York. http://www.undp.org/content/undp/ en/home/librarypage/crisis-prevention-and-recovery/ strengthening-disaster-risk-governance.html. Accessed January 2017. Greene, D. L., and S. E. Plotkin. 2011. Reducing Greenhouse Gas Emissions from U.S. Transportation. Center for Cli- mate and Energy Solutions, Arlington, Virginia. Guo, D., and J. Sun. 2015. Permafrost Thaw and Associated Settlement Hazard Onset Timing over the QinghaiâTibet Engineering Corridor. International Journal of Disaster Risk Science, Vol. 6, No. 4, pp. 347â358. Hennig, B. 2016. The Great Thaw: Mapping Arctic Sea Ice Thickness. Geographical Magazine, Dec. 2016. Royal Geographical Society, London. IIASA. 2012. Global Energy Assessment: Toward a Sustain- able Future. Cambridge University Press, Cambridge, UK, and New York, and IIASA, Laxenburg, Austria. IMO. 2015. Third IMO GHG Study 2014: Executive Sum- mary and Final Report. http://www.imo.org/en/Our- Work/Environment/PollutionPrevention/AirPollution/ Documents/Third%20Greenhouse%20Gas%20Study/ GHG3%20Executive%20Summary%20and%20Report. pdf. Accessed March 6, 2017. IPCC. 2014a. Climate Change 2014: Mitigation of Climate Change. Contribution of Working Group III to the Fifth Assessment Report of the Intergovernmental Panel on Cli- mate Change, Cambridge University Press, Cambridge, UK, and New York. IPCC. 2014b: Annex II: Glossary (K. J. Mach, S. Planton, and C. von Stechow, eds.). In Climate Change 2014: Synthe- sis Report. Contribution of Working Groups I, II, and III to the Fifth Assessment Report of the Intergovernmen- tal Panel on Climate Change (Core Writing Team: R. K. Pachauri and L. A. Meyer, eds.), Geneva, Switzerland, pp. 117â130. IPCC. 2014c. Climate Change 2014: Synthesis Report. Contri- bution of Working Groups I, II, and III to the Fifth Assess- ment Report of the Intergovernmental Panel on Climate Change (Core Writing Team, R. K. Pachauri and L. A. Meyer, eds.), Geneva, Switzerland. KPMG. 2015. Connected and Autonomous Vehicles: The UK Economic Opportunity. https://home.kpmg.com/uk/en/ home/insights/2015/03/connected-and-autonomous-vehi cles.html. Accessed April 27, 2017. Marchetti, C. 1994. Anthropological Invariants in Travel Behavior. Technological Forecasting and Social Change, Vol. 47, pp. 75â88. Internal Publication, International Institute for Applied Systems Analysis, Laxenburg, Aus- tria. Martin, E., and S. Shaheen, 2011. The Impact of Carsharing on Public Transit and Non-Motorized Travel: An Explo- ration of North American Carsharing Survey Data. Ener- gies, Vol. 4, pp. 2094â2114. McCollum, D. L., G. Gould, and D.L. Greene. 2009. Green- house Gas Emissions from Aviation and Marine Transpor- tation: Mitigation Potential and Policies. Solutions White Paper Series. Pew Center on Global Climate Change (now C2ES), Arlington, Va. McNutt, B. D., and D. Rodgers, 2004. Lessons Learned from 15 Years of Alternative Fuels Experience: 1988 to 2003. In The Hydrogen Energy Transition (D. Sperling and J. S. Cannon, eds.), Elsevier Academic Press, San Diego, Calif. Mock, P., U. Tietge, V. Franco, J. German, A. Bandivadekar, N. Ligterink, U. Lambrecht, J. Kühlwein, and I. Riemersma. 2014. From Laboratory to Road: A 2014 Update of Offi- cial and âReal-Worldâ Fuel Consumption and CO 2 Val- ues for Passenger Cars in Europe. International Council on Clean Transportation, Berlin. NOAA. 2017. Climate at a Glance: Global Time Series. National Centers for Environmental information. http:// www.ncdc.noaa.gov/cag/. NRC. 2013. Transitions to Alternative Vehicles and Fuels. National Academies Press, Washington, D.C. Pal, J. S., and E. A. B. Eltahir. 2016. Future Temperature in Southwest Asia Projected to Exceed a Threshold for Human Adaptability. Nature Climate Change, Vol. 6, pp. 197â200. Rayle, L., D. Dai, N. Chanc, R. Cervero, and S. Shaheen. 2016. Just a Better Taxi? A Survey-Based Comparison of Taxis, Transit, and Ridesourcing Services in San Francisco. Transport Policy, Vol. 45, pp. 168â178.
60 d e c a r b o n i z i n g t r a n s p o r t f o r a s u s t a i n a b l e f u t u r e Schwartz, H. G. Jr., and L. Tavasszy. 2016. Transportation Resilience: Adaptation to Climate Change and Extreme Weather Events. In Transportation Resilience Adaptation to Climate Change and Extreme Weather Events. Sum- mary of the Fourth EU-U.S. Transportation Research Symposium. Transportation Research Board, Wash- ington, D.C., pp. 40â60. http://www.trb.org/Main/ Blurbs/175488.aspx. SGCLMU. 2017. Global Climate Leadership Memorandum of Understanding. http://under2mou.org/wp-content/ uploads/2015/04/Under2-MOU-English.pdf. Accessed March 3, 2017. Shakun, J. D., P. U. Clark, F. He, S. A., Marcott, A. C., Mix , Z. Liu, B. L. Otto-Bliesner, A. Schmittner, and E. Bard. 2012. Global Warming Preceded by Increasing Carbon Dioxide Concentrations During the Last Deglaciation. Nature, Vol. 484, pp. 49â54. Shoup, D. 1997. Evaluating the Effects of Californiaâs Parking Cash-Out Law: Eight Case Studies. Transport Policy, Vol. 4, No. 4, pp. 201â216. Stephens, T., J. Gonder, Y. Chen, Z. Lin, C. Liu and D. Gohke. 2016. Estimated Bounds and Important Factors for Fuel Use and Consumer Costs of Connected and Automated Vehicles. NREL/TP-5400-67216. National Renewable Energy Laboratory, Golden, Colo. Stern, N. 2006. The Economics of Climate Change. HM Trea- sury, London. TRB. 2016. Transportation Resilience: Adaptation to Cli- mate Change and Extreme Weather Events. Summary of the Fourth EU-U.S. Transportation Research Sympo- sium. Washington, D.C., 2016. http://www.trb.org/Main/ Blurbs/175488.aspx. U.S. DOT. 2010. Transportationâs Role in Reducing U.S. Greenhouse Gas Emissions, Volume 1: Synthesis Report. Report to Congress, April 20, 2010. Williams, P., and M. Joshi. 2013. Intensification of Winter Transatlantic Aviation Turbulence in Response to Climate Change. Nature Climate Change, Vol. 3, pp. 643â648. Yang, C., D. McCollum, and W. Leighty. 2011. Scenarios for Deep Reductions in Greenhouse Gas Emissions. In Sus- tainable Transportation Energy Pathways (J. Ogden and L. Anderson, eds.), Institute for Transportation Studies, University of California, Davis, Calif. Yang, C., S. Yeh, S. Zakeriniea, K. Ramea and D. McCol- lum. 2015. Achieving Californiaâs 80% Greenhouse Gas Reduction Target in 2050: Technology, Policy, and Sce- nario Analysis Using CA-TIMES Energy Economic Sys- tems Model. Energy Policy, Vol. 77, pp. 118â130. The opinions and conclusions expressed or implied in this paper are those of the researchers who performed the research. They are not necessarily those of the program sponsors; the Transportation Research Board; or the National Academies of Sciences, Engineering, and Medicine. The information contained in this paper was taken directly from the submission of the authors.
61 APPENDIX B: EXPLORATORY TOPIC 1 Breaking Silos and Human Cocreation on Multiple Levels The Key to Transforming the Current Sociotechnical Transport System Regime? Malin B. Andersson, Urban Transport Administration, City of Gothenburg, Sweden Daniel Kreeger, Association of Climate Change Officers, Miami, Florida, USA Transportation systems are essential for creating communities of opportunity with broad-reaching impact on the structure of metropolitan and rural communities, job creation, commerce distribution, energy efficiency, housing stock, access to better schools and well- equipped doctors, economic opportunity for business, and more. These systems are used daily to transport peo- ple to work, school, and grocery stores and to transport goods and supplies to those places and more. Changes in transportation costs, accessibility, frequency, and mode options sometimes force us to alter our daily routine and sometimes force the governments and/or companies to alter their policies and practices. When an extreme event occurs, such as the eruption of the Eyjafjallajökull vol- cano in Iceland during April 2010 or the Snowmageddon blizzard in the United States during February 2010, trans- portation is diverted or shut down, which causes dramatic delays, increases costs, and increases risks for travelers, distributors, and the customers served. In those instances, mobility chaos has a cascading impact on other economic sectors and social life. For several decades planners and policymakers have been informed and educated about a need for local, state, and national transportation networks to be planned, designed, retrofitted, and constructed so that they are economically, socially, and environmentally sustainable. Transportation needs to transition toward a low-carbon, safe, affordable, accessible, and resilient system. Since the 1970s, scientists have warned of a need for a shift toward net zero emissions to occur in a matter of just a few decades. However, despite a multitude of policy, planning, and technological solutions that would support this transition, the transportation system remains deeply unsustainable while greenhouse gas (GHG) emissions continued to increase. It is not as though mass failures in sustainability programs occurred over the past 30 years. Positive changes have been made by agencies and busi- nesses, although a paradigm shift in communities and culture has not happened. Essentially, behavior patterns have not changed enough to support decision makers in making more-aggressive changes to address these needs. For example, public transit agencies in the United States are planning and building bus lines that use rapid transitâlike elements [e.g., bus rapid transit (BRT) lite]. BRT service increases transit efficiency, reduces travel time, and attracts choice riders away from their single- occupancy vehicles. Agencies commonly plan and build BRT lite systems to replace existing service to reduce congestion. Typically, the behavior of travelers in these communities does not alter. The BRT lite service does not attract enough choice riders to reduce congestion. ⢠Why are solutions not penetrating further than transportation system planning and design to influence the users of the system? ⢠Is it possible to redesign and implement transporta- tion systems and services so that people would change modes or purchase more energy-efficient vehicles? ⢠What are the obstacles to achieving zero GHG emissions in transportation? ⢠How can the obstacles be overcome without adversely affecting cultures and societies? ⢠Once action is taken, will it be quick enough to prevent the most severe impacts of climate change? ⢠How can the proposed revolutionary changes take place without creating severe societal effects?
62 d e c a r b o n i z i n g t r a n s p o r t f o r a s u s t a i n a b l e f u t u r e During the United Nations (UN) 21st Conference of the Parties (UN 2015b), the parties of the Kyoto Protocol made progress that led to the Paris Agreement and the 17 Global Sustainable Goals (UN 2015a) focused around the three principal concepts of transformation, integra- tion and universality. Societal systems need to transform thoroughly. All of the goals need to be addressed simul- taneously; they cannot be solved one by one by isolated actors, but need an inclusive effort involving all levels of government, the private sector, and residents. ⢠Who is the coordinator or what is the governance model? ⢠What authority is accorded to the entity or indi- vidual? ⢠What are the required skills, qualifications, and proficiencies of such a coordinator? ⢠To whom do they report? Enabling changes in transportation requires a capac- ity for sustainability-driven innovation, cocreation, and change management. The objective of this paper is to provide some brief context around the key questions that will be used to develop answers (and more questions) from participants in the Fifth EU-U.S. Transportation Research Symposium, Decarbonizing Transport for a Sustainable Future: Mitigating Impacts of the Changing Climate. The symposium discussions will orbit around political dilemmas, difficulties concerning emerging business models, knowledge gaps, and the need for tran- sition or change management. What factors prohiBit transition? understanding sociotechnical systems Societal functions such as transportation, communica- tion, and housing are fulfilled by sociotechnical systems, which consist of a cluster of aligned elements (e.g., arti- facts, knowledge, markets, regulation, cultural meaning, infrastructure, and maintenance and supply networks) (Geels 2005) (Figure 1). A transition is a shift from one sociotechnical system to another, meaning it is a system innovation. System innovations are coevolution processes, which involve technological changes. They also demand changes in manifold social groups that reinforce and reproduce the current system. The ideal outcome is for social groups to accept the current system integration with or in place of the innovation (Figure 2). innovation: a Question of leadership and human capital When addressing these sorts of institutional changes and practices, one needs to consider the decision-making driv- ers and capacities of transportation employees and users. In the UN 2030 Agenda for Sustainable Development (UN 2015a) three key words can be identified: transformation, integration, and universalityâtransformation in the sense that business-as-usual is no longer an option for achiev- ing sustainability in time because of lock-in effects and path dependencies; integration because the complexity of the issues means that work cannot be done in silos, one question at a time; and uni- versality in that the whole world must be consid- ered in the aim for solutions. FIGURE 1 Sociotechnical system for modern car-based transportation (Geels 2005; reprinted by per- mission of the author). Regulations and policies (e.g., traffic rules, parking fees, emission standards, car tax) Road infrastructure and traffic system (e.g., lights, signs) Culture and symbolic meaning (e.g., freedom, individuality) Fuel infrastructure (oil companies, petrol stations) Markets and user practices (mobility patterns, driver preferences) Production system and industry structure (e.g., car manufacturers, suppliers) Maintenance and distribution network (e.g., repair shops, dealers) Sociotechnical system for land-based road transportation Automobile (artefact)
63a p p e n d i x B : e x p l o r a t o r y t o p i c 1 In this paper, transportation employees are those who could influence behavior change for low-carbon emis- sions in transportation. Employees encompass a wide spectrum of job fields such as engineering, land archi- tecture, planning, policy making, program management, finance and pricing analysis, marketing, and more. Over- coming the mind-set that leans toward traditional prac- tices requires a combination of organizational change, education, training, and motivation. If technical experts do not possess competencies and knowledge to perform their functions differently than before, the capacity to drive forward-thinking and innovative designs and plans will be limited. Simply put, without the right people with the right skills in the right parts of institutions, how can meaningful and sustained change take place? Key ques- tions for catalyzing and building a sustainable transpor- tation workforce include the following: ⢠What skills and knowledge do practitioners in planning, engineering, and design need in the context of driving mitigation and resilient and low-carbon trans- port systems? How do those skills and knowledge dif- fer from the currently accepted competencies for those professions? ⢠How can policies, performance measures, profes- sional development, and hiring practices become tools for employing these skills in the essential fields? ⢠What role do academic institutions and profes- sional societies play in supporting this transition? ⢠What new (or revised) tools and resources are needed to support professional development or certifica- tion efforts? ⢠Are job descriptions written and the expectations for the position set to require these skills and proficien- cies? Should they be? ⢠How are performance and proficiency measured for these skills? ⢠What is the role of research and evidence in current policy-making processes? The challenge with respect to leadership is not wholly dissimilar. In the context of elected and appointed offi- cials, it is highly unlikely that these individuals have enough understanding or perspective to make indepen- dent, well-informed, and proper decisions given the lack of daily exposure and education fundamental to the needed transformation. In the case of elected, appointed, and hired leaders in agencies and businesses, similar challenges exist: ⢠Where do decision makers get their information regarding the consideration at hand? ⢠How do senior management and advisors effec- tively engage leaders on these considerations? ⢠What leadership development and engagement activities will help transform decision making at this level? ⢠What influences and motivations are driving deci- sion making at the highest levels of institutions (e.g., elected officials in government agencies, C-suite execu- tives in the private sector)? ⢠How can the public sector attract and maintain skilled individuals? ⢠How can public administration become more resil- ient to political change? FIGURE 2 Social groups that (re)produce sociotechnical systems (Geels 2005, p. 1230; reprinted by permission of the author). Finance, capital: â Venture capital suppliers â Insurance firms â Banks Reseach: â Universities â Technical institutes â R&D laboratories Public authorities: â Supra-national (European Commission, WTO, GATT) â National (government, Ministries, Parliament) â Local authorities and executive branches Societal groups: (e.g., Greenpeace, media) Users Supply chain: â Material suppliers â Component suppliers â Machine suppliers Production: â Firms â Engineers, designers
64 d e c a r b o n i z i n g t r a n s p o r t f o r a s u s t a i n a b l e f u t u r e Bold political action: the dilemma of our timeâreelected versus doing the right thing The ability to carry out public policies to mitigate trans- portationâs GHG emissions requires an understanding of how to formulate effective policies as well as an under- standing of how much can be accomplished, what the costs and benefits will be, and how policies will interact. An integrated policy approach that creates consensus and coalitions among diverse stakeholders and interests can help to overcome implementation barriers, minimize rebound effects, and motivate people, business, and communities to achieve a common objective. Still, pub- lic policy agenda setting and policy continuity are based on political consensus. In Europe and the United States, political consensus is usually built upon a broad and con- trolling public acceptance and is usually reinforced by strong incentives for the public. Government and transportation leaders can intro- duce strong incentives to decrease GHG emissions. Such incentives could or already do include having transit sub- sidies via employee benefits, investing in safer bike lanes and bike storage, implementing parking management, increasing bus and express bus service, adding passenger commuter rail services, having congestion and road pric- ing, and increasing and adding new fuel taxes to fund decarbonization or GHG reduction programs. However, the solutions may increase taxes, be more time consum- ing, and be less convenient for peopleâs busy and private lives; therefore, these measures are seldom popular. How do these weakly marketed incentives implicate businesses and people? How and when could policy makers use strong incen- tives or disincentives and still be appointed? When should policy makers use transportation right- sizing initiatives to create mode shift? Land use structures, regardless of whether they are natural, man-made, or spatially planned, influence options for commuting and can create car dependency. Studies on congestion charges in Stockholm and Gothen- burg show that even if a change in the mode of transpor- tation would not impact the cost per trip, it could affect commutersâ time budget. Then other aspects of life, such as the time available for parenting, extended family and friends, and leisure might be reduced (Berg and Karre- sand 2015). Growing regions may also have implications for social equality, as trip distances become longer and access to needed services changes. Studies show commut- ing patterns enable menâs career options but can impede womenâs options (Gil Solá 2016). A transit system must work for all communities, including those facing long commutes, dangerous streets, and crumbling physical infrastructure. For public administration, a complex question is, what incentives could be suggested for political decisions and in what timing? To speed up policy making answers are needed to other questions, such as ⢠How can transportation research be conducted to understand what public policy is and why it is accepted, and in what kind of situations? ⢠What actions could prepare the decision-making process prior to disruptive activities in the transport sector? ⢠Is it possible to create an exigency in logic in which decisions are able to be made? ⢠What is the effective role for public awareness and education in this political context? neW Business opportunities: moving out from the niches Transportation research and development is flooded with good solutions, but there are difficulties penetrat- ing the multilayered and rigid transportation system. The products of research get stuck in the âValley of Deathâ (Kemp et al. 1998). The transportation system is very strong and structured on a macrosociotechnical landscape. Material and spatial arrangements of cities foster global, regional, and local movement patterns. Macrosociotechnical landscapes cannot be changed at will in the short term (Geels 2005) and are beyond the direct influence of new research products. Transporta- tion research may develop a new brilliant solution that does not fit in the existing multimodal regime; therefore, an institutional barrier prevents implementation if the macrosociotechnical landscape is unaware of the change factors (Figure 3). The era of digitalization paired with the newer trends of shared economies and just-in-time service certainly introduce new opportunities for business and a redefin- ing of public transportation, such as Mobility as a Ser- vice (MaaS). These opportunities are usually driven by the private sector with support or cooperation from the government. The following quote highlights the poten- tial of publicâprivate partnerships: âRemoving all parking spaces in the center of Ljubljana was my most difficult political deci- sion of all time,â the mayor of Ljubljana stated at the Civitas Conference 2015. It was a very unpopular decision, but he was reelected and opinion turned in his favor.
65a p p e n d i x B : e x p l o r a t o r y t o p i c 1 FIGURE 3 Multiple levels as a nested hierarchy (Geels 2005, p. 1231; reprinted by permission of the author). Public Private Partnerships (PPPs) are a promising avenue that may offer both practical and concep- tual solutions to ensure productive interaction of public and private finance organizations. PPPs aim for public service delivery and, while they seek to benefit from mutually beneficial partnerships, they remain founded on public oversight. They there- fore provide frameworks to ensure public leader- ship and accountability in tackling climate change, while enabling the ownership of certain compo- nents of climate finance to be transferred to private hands. (Gardiner et al. 2015) Living labs on MAAS show that even with deep cus- tomer satisfaction, existing institutional frameworks prohibit or exclude new business opportunities (Karlsson et al. 2016, Strömberg 2015). For example, new ride- share businesses such as Uber are suspended from some national markets. Innovations and opportunities are emerging, but the market is still unformed. The City of Rotterdam, Neth- erlands, procured a public mobility management center that operates through a business-to-business model and delivers an impact comparable to congestion charges. The City of Milan, Italy, has recently procured a full carpooling system to decrease private car ownership and increase accessibility in the city center. These are examples of how the public sector has created a market opportunity. To speed up market opportunities, answers to the fol- lowing questions are needed: ⢠What mechanism could better support small-scale solutions to penetrate the current sociotechnical regime? ⢠How can public procurement connect with research and business to create markets for new business to emerge? ⢠What is needed to enable PPPs to contribute to a large reduction of GHG emissions? ingredients of a successful transition toWard sustainaBility In stable sociotechnical systems, innovation occurs incre- mentally and leads to âtechnical trajectoriesâ and path dependencies (Geels 2005). Thinking outside the box is the norm for driving change. However, the complexity of multimodal transportation requires thinking about com- pletely different boxes, boxes that fit into another socio- technical regime (Holmberg and Larsson 2017) (Figure 4). This is very difficult within existing transportation sociotechnical paths, which can be exemplified by the ElectriCity collaboration in Gothenburg, Sweden, and urban temporary design in New York City. The ElectriCity collaboration in Gothenburg, in which the city is changing from a fossil fuel bus system to an electric system, provides an example of the challenges associated with making changes in the transport sector. Public uncertainties with the new buses were diverse, including the fear of the new silent buses appearing dangerously from behind. Engineers and bus operators worried about liability and circulation times. Architects worried about unattractive charging stations. Bus driv- ers were uncomfortable with new vehicles and the dif- ferent technology. With change come uncertainties that can also be unknown possibilities. Against such clamor, it was difficult for leaders to make decisions concern- Increasing structuration of activities in local practices Landscape Patchwork of regimes Niches (novelty)
66 d e c a r b o n i z i n g t r a n s p o r t f o r a s u s t a i n a b l e f u t u r e ing procurement or investments. For 2 years, the Elec- triCity Living Lab (http://www.goteborgelectricity.se/ en) has been testing a new service with real customers and stakeholder engagement on a smaller but still com- mercial scale. Results show greater increases in trust and willingness toward a system shift on the part of both passengers and stakeholders. Gehl Architects became world famous for its model of turning roadways into livable urban space through sim- ple and short-term investments. In 2008, Gehl Architects assisted New York City in bringing a people-centered approach to urban design to its streets. By New Yearâs Eve, Times Square and Broadway were turned into pedes- trian plazas with new bike lanes. The results from these changes were mixed. Cross-town traffic became slightly more congested, but pedestrian safety improved by 39%, and the number of car collisions decreased. Overwhelm- ingly, New Yorkers were pleased with the changes. It appears that similar approaches may be considered in other areas of the city. To nurture courageous change agents, mechanisms for transition management need to be better understood to enable cocreation and challenge-driven innovation. ⢠How can people and decision makers be prepared for change rather than frightened and threatened by change? ⢠How could transition arenas, living labs, and vis- ible small-scale tests be stimulated and scaled up? ⢠How can communities cocreate with citizens (and vice versa) to change the social patterns that reinforce current regimes and create future innovations? ⢠What is the role of public leaders, chief sustainabil- ity officers, and chief resilience officers in managing the transition? references Abbreviation UN United Nations Berg, J., and H. Karresand. 2015. Ãr bilberoende och tidsbrist ett hinder för ökat kollektivtrafikresande? En kvalitativ aktivitetsbaserad studie. Mistra Urban Futu- res Report 2015:7. Mistra Urban Futures, Gothenbug, Sweden. Gardiner, A., M. Bardout, F. Grossi, and S. Dixson-Declève. 2015. Public-Private Partnerships for Climate Finance. Nordic Council of Ministers, Copenhagen, Denmark. https://norden.diva-portal.org/smash/get/diva2:915864/ FULLTEXT01.pdf. Geels, F. W. 2005. Processes and Patterns in Transitions and Sys- tem Innovations: Refining the Co-Evolutionary Multi-Level Perspective. Technological Forecasting and Social Change, Vol. 72, No. 6, pp. 681â696. http://doi.org/10.1016/j.tech fore.2004.08.014. , FIGURE 4 Dynamic multilevel perspective on system innovations (ST = sociotechnical) (Geels 2005, p. 1263; reprinted by permission of the author). Technological niches Socio- technical regime Landscape developments Landscape developments put pressure on regime, which opens up on multiple dimensions, creating windows of opportunity for novelties. New ST regime influences landscape. New configuation breaks through, taking advantage of âwindows of opportunity.â Adjustments occur in ST regime. Elements are gradually linked together, and stabilize into a new ST configuation which is not (yet) dominant. Internal momentum increases. Articulation processes with novelties on multiple dimensions (e.g., Technology, user preferences, policies). Via coconstruction different elements are gradually linked together. Time ST regime is âdynamically stable.â On different dimensions there are ongoing processes.
67a p p e n d i x B : e x p l o r a t o r y t o p i c 1 Gil Solá, A. 2016. Constructing Work Travel Inequalities: The Role of Household Gender Contracts. Journal of Trans- port Geography, Vol. 53, pp. 32â40. http://www.science- direct.com/science/article/pii/S0966692316301946. Holmberg, J., and J. Larsson. 2017. Transformative and Inte- grative Leadership in the Governance of Sustainability Transitions. Presented at International Sustainability Transitions Conference, June 19â21, 2017, Gothenburg, Sweden. Karlsson, M., J. L. Sochor, and H. Strömberg. 2016. Experi- ences from a Field Trial of UbiGo: The Case of Mobility as a Service. Presented at ITRL Conference on Integrated Transport 2016: Connected and Automated Transport Systems, Stockholm, Sweden, Nov. 29â30, 2016. Kemp, R., J. Schot, and R. Hoogma. 1998. Regime Shifts to Sustainability Through Processes of Niche Formation: The Approach of Strategic Niche Management. Technology Analysis & Strategic Man- agement, Vol. 10, No. 2, pp. 175â198. https://doi. org/10.1080/09537329808524310. Strömberg, H. 2015. Creating Space for Action: Supporting Behaviour Change by Making Sustainable Transport Opportunities Available in the World and in the Mind. PhD dissertation. Chalmers University of Technology, Gothenburg, Sweden. http://publications.lib.chalmers. se/publication/222635-creating-space-for-action-support ing-behaviour-change-by-making-sustainable-transport- opportunities. UN. 2015a. Transforming our World: The 2030 Agenda for Sustainable Development. New York: United Nations. https://sustainabledevelopment.un.org/post2015/trans formingourworld. UN. 2015b. 21st Conference of the Parties (COP) to the United Nations Framework Convention on Climate Change. http://www.un.org/sustainabledevelopment/cop21/. additional resources Andersson, D., and J. Nässén, J. The Gothenburg Conges- tion Charge Scheme: A Pre-Post Analysis of Commuting Behavior and Travel Satisfaction. Journal of Transport Geography Vol. 52, pp. 82â89, 2016. National Center for Sustainable Transportation. Exploring Unintended Environmental and Social-Equity Conse- quences of Transit Oriented Development. Institute of Transportation Studies, University of California, Davis. https://ncst.ucdavis.edu/project/ucd-ct-to-006/. Pike, C., M. Herr, and B. Doppelt. 2010. Climate Communi- cations and Behavior Change: A Guide for Practitioners. Resource Innovation Group. http://www.climateaccess. org/sites/default/files/Climate%20Communications%20 and%20Behavior%20Change.pdf.
68 APPENDIX C: EXPLORATORY TOPIC 2 Influence of Policy Environment Factors on Climate Change Mitigation Strategies in the Transport Sector Oliver Lah, Wuppertal Institute for Climate, Environment, and Energy, Wuppertal, Germany Timothy Sexton, Minnesota Department of Transportation, Saint Paul, Minnesota, USA The transportation sector accounts for about 14% of global carbon dioxide (CO2) emissions, as it lacks diversity and stands out by its almost com- plete dependence (95%) on oil. This historical depen- dence on a single energy source is one reason that transportation is likely the hardest sector to decarbon- ize (IEA 2011). However, cities, regions, and countries around the world are beginning to implement policies and projects that provide substantial reductions in green- house gas (GHG) emissions in addition to other benefits. Policy and governance at all levels of government play a critical role in supporting and promoting current and future efforts at GHG reduction. For purposes of this paper, governance is defined as the rules, norms, and actions that each governing body uses to produce, sus- tain, and regulate decisions. The objective of this paper is to provide some brief context around the key ques- tions that will be used to develop answers (and more questions) from the participants in the Fifth EU-U.S. Transportation Research Symposium, Decarbonizing Transport for a Sustainable Future: Mitigating Impacts of the Changing Climate. coalitions for the implementation of loW- carBon moBility measures Energy and climate change policies for the transporta- tion sector generally require consensus on the need for policy intervention and a strategic, coherent, and stable operating environment. Policy interventions, such as fuel and vehicle taxation, are highly visible and politically sensitive. They require strong political commitment to appear on the policy agenda and to remain in place as they rely on investments that are only cost-effective over the medium to long term (IEA 2010; IPCC 2014). Developing consensus can be difficult because trans- portation is complex and multifaceted, and policy inter- ventions can have unintended consequences. Linking and packaging policies is vital to generate synergies and co-benefits between measures, including linking GHG reduction goals with other sustainable development goals, such as the following: ⢠Reducing traffic and parking congestion, ⢠Mitigating climate change, ⢠Increasing energy security and traffic safety, ⢠Promoting public fitness and health, ⢠Reducing local air pollution, ⢠Improving equity and access, ⢠Improving affordability of transportation services, and ⢠Increasing economic productivity. These co-benefits are positive impacts of transportation policy that can align different players. In both the Euro- pean Union and the United States, an integrated policy approach that creates consensus and coalitions among diverse stakeholders and interests can help to overcome barriers to implementation, minimize rebound effects, and motivate people, businesses, and communities. This type of integrated policy approach is especially critical because current GHG reduction measures alone can make important contributions but cannot achieve the
69a p p e n d i x C : e x p l o r a t o r y t o p i C 2 levels of reduction needed to shift to a 1.5°C pathway (IPCC 2014). Vehicle efficiency and low-carbon fuels have a key role to play in decarbonizing the transportation sector and may provide the biggest potential climate change miti- gation (approach = improve, Table 1). However, these strategies alone do not fully reflect a broader sustainable transportation perspective. A multimodal and integrated policy approach can minimize rebound effects, overcome split incentives, and achieve a higher level of socioeco- nomic co-benefits (Givoni 2014). In particular, reducing the need for travel through compact city design and a shift to low-carbon modes (approach = avoid, shift) can mitigate GHG emissions and contribute to sustainable development (Table 1). Decision making on transportation policy and infra- structure investments is as complex as the sector itself. Rarely will a single measure achieve comprehensive impacts on climate change and also generate economic, social, and environmental benefits. Many policy and plan- ning decisions have synergistic effects, meaning that their impacts are larger if implemented together. It is therefore generally best to implement and evaluate integrated pro- grams rather than individual strategies. For example, by itself, a public transit improvement may cause minimal reductions in individual motorized travel and associated benefits such as congestion reductions, consumer savings, and reduced pollution emissions. However, the same mea- sure may prove very effective and beneficial if implemented with complementary incentives, such as efficient road and parking pricing that allows travelers to have an incentive to shift away from individual car travel (Lah 2015). In fact, the most effective programs tend to include a combi- nation of qualitative improvements such as the following: ⢠Alternative modes of transportation like walking, cycling, ridesharing, and public transit services; ⢠Incentives to discourage carbon-intensive modes through means such as efficient road, parking, and fuel pricing; ⢠Marketing programs for mobility management and the reduction of commuting trips; ⢠Reallocation of road space to favor resource-effi- cient modes; and ⢠Integrated transportation planning and land use development. Together, these improvements could create more compact, mixed, and better-connected communities in which there is less need to travel. A vital benefit of the combination of measures is the ability of integrated packages to deliver synergies and minimize rebound effects. For example, the introduc- tion of fuel efficiency standards for light-duty vehicles may improve the efficiency of the overall fleet but may also induce additional travel as fuel costs decrease for the individual users. This effect refers to the tendency for the total demand for energy to decrease less than was expected after the introduction of efficiency improve- ments because of the resultant decrease in the cost of energy services (Sorrell 2010, Gillingham et al. 2013, Lah 2015). Ignoring or underestimating this effect while planning policies may lead to inaccurate forecasts and unrealistic expectations of the outcomes, which, in turn, leads to significant errors in the calculations of policiesâ payback periods (WEC 2008, IPCC 2014). The expected rebound effect is around zero to 12% for household appliances such as refrigerators, washing machines, and lighting, while it is up to 20% in industrial processes and 12% to 32% for road transportation (IEA 2013). The higher the potential rebound effect and the wider the range of possible take-back, the greater the uncertainty of a policyâs cost-effectiveness and its effect upon energy efficiency (Ruzzenenti and Basosi 2008). TABLE 1 Greenhouse Gas Mitigation Potential and Co-Benefits Potential Approach Area of Focus Potential Impact Potential Synergies Avoid Activity (reduction and manage- ment: short distances, compact cities, and mixed use) Potential to reduce energy consumption by 10% to 30% (TfL 2007, Marshall 2011) Reduced travel times; improved air quality, public health, safety, and more equitable access Shift Structure (shift to more energy- efficient modes) Potential for energy efficiency gains varies greatly; 10%â30% reductions (IEA 2012, Fulton et al. 2013) Reduced urban congestion, more equitable access, improved freight reliability, reduced maintenance costs for roads Improve Intensity (vehicle fuel efficiency) Efficiency improvement of 40%â60% by 2030 feasible at low or negative costs (IEA 2012; IIASA 2012) Improved energy security, productivity, and affordability Fuel (switch to electricity, hydro- gen, compressed natural gas, biofuels, and other fuels) Changing the structure of energy con- sumption. Mitigation and efficiency potential uncertain. Diversification of transportation fuels con- tributes to climate, air quality, and energy security objectives Source: Adapted from IPCC 2014 and Figueroa et al. 2014.
70 d e c a r b o n i z i n g t r a n s p o r t f o r a s u s t a i n a b l e f u t u r e Several studies emphasize that an integrated approach is vital to cost-effective reduction of transportation GHG emissions (IPCC 2014, Figueroa et al. 2014). While emissions reductions can be achieved through several means, such as modal shift, efficiency gains, and reduced transportation activity, it is apparent that the combina- tion of measures is a key success factor in maximizing synergies and reducing rebound effects. For example, overall travel demand reduction and modal shifts would need to be substantially stronger if not accompanied by efficiency improvements within the vehicle fleet and vice versa (Figueroa et al. 2014, Fulton et al. 2013). A vital element for this strategy is a policy package, as summa- rized in Table 2. policy and governance considerations Analysis of recent research suggests that there are three vital factors for success of sustainable transportation policies: ⢠Political continuity and societal consensus, which enable the uptake of policies and ensure stability; ⢠An integrated policy approach that combines vari- ous measures to provide a basis for political coalitions; and ⢠Political continuity and policy integration efforts that are affected by the institutional context and the pol- icy operating environment. Policy Continuity and Consensus Policy agenda setting and policy continuity are affected by political consensus, which is a result of political and institutional relationships (Fankhauser et al. 2015, Mar- quardt 2017). These relationships, including the interac- tions between different levels of government (e.g., local, state, federal, supranational) and acknowledgement of scientific consensus on climate change policy vary greatly between key political and societal actors (Never and Betz 2014). Political environments vary by country and change over time, and these characteristics affect implementation of sustainable transportation solutions and other measures for mitigating climate change. They also result in significant differences between countriesâ progress in reducing GHG emissions from the transpor- tation sector. Changing political environments means that policy environments are also influenced by a level of political volatility. Hence, a shared set of methods and values is generally considered vital for setting the policy agenda, usually delivered through knowledge commu- nities. Support from diverse political and public stake- holders is vital for the long-term success of policy and infrastructure decisions. This support can often be tied to the level of trust between stakeholders and policy mak- ers and to the role that facts play in the decision-making process (Simmons 2016, Freitag and Ackermann 2016). Public perception and the influence of epistemic commu- nities also play an important role in political agenda set- ting and consensus on major policy issues such as climate change and energy efficiency (Hagen et al. 2016, Cook and Rinfret 2015). Policy Integration and Coalition Building The policy environment, or context in which decisions are made, is as important as the combination of policy deci- sions and infrastructure investments that make up a low- carbon transportation strategy (Justen et al. 2014). This policy environment includes socioeconomic and political aspects of the institutional structures of countries. These TABLE 2 Elements of a Multimodal, Multilevel Sustainable Transport Package Measure Complementarity of Measure National Measures Fuel tax Vehicle fuel efficiency regulation Vehicle tax based on fuel efficiency or CO2 emissions or both Vehicle standards and regulations ensure supply of efficient vehicles and taxation helps steer consumer behavior. Fuel taxes encourage more efficient use of vehicles, which helps minimize rebound effects that might occur if individuals and businesses drive more or if they drive less efficiently than if they were driving a vehicle with lower fuel efficiency standards. Local and State Measures Compact city design and integrated planning Provision of public transit, walking and cycling infrastructure and services Road-user charging, parking pricing, access restrictions, regis- tration restrictions and number plate auctions, eco-driving initiatives, urban logistics Compact and policy-centric planning enables short trips, and provision of model alternatives provides affordable access. Complementary measures at the local or state level help manage travel demand and can generate funds that can be redistributed to support low- carbon transportation modes.
71a p p e n d i x C : e x p l o r a t o r y t o p i C 2 structures help build coalitions but can also increase the risk that a policy package fails because one measure faces strong opposition (Sørensen et al. 2014). A core element of success is the involvement at an early stage of potential veto players and the incorporation of their policy objec- tives in the agenda setting (Tsebelis and Garrett 1996). Institutional Context The political and institutional context in which policies are pursued is a factor to be considered for the success or failure of implementation (Jänicke 1992). Institutional aspects, such as the presence or absence of an environ- ment ministry at the national level or local level, and their respective roles in the process are likely to have an effect on the implementation of climate-related trans- portation measures (Fredriksson et al. 2016). The legal power, budget, and political influence of these agencies are equally important (Jänicke 2002). Provided that technologies to reduce GHG emissions are available and policy mechanisms to support their uptake are proven to be effective, the factors that influ- ence transportation energy-efficiency policies can be suc- cessful over the long term and are the vital factors that enable their uptake. Energy and climate change policies for the transportation sector require a stable political operating environment to enable long-term investment decisions by industry and consumers (Lakshmanan 2011, Fais et al. 2016, Spataru et al. 2015). Consen- sus- focused governance and institutional structures may provide such a strategic, coherent, and stable operating environment. Policies to reduce energy consumption in the transportation sector require a strong political com- mitment to appear on the policy agenda and to remain in place, as they rely on investments that are only cost- effective over the medium to long term (ITF 2017). Pol- icy interventions, such as fuel and vehicle taxation, are highly visible and politically sensitive. To get a clearer picture of the feasibility of climate policy pathways, one can draw on well-established concepts from political sci- ence theory that aim to identify key institutional charac- teristics that influence policy processes. Considering the complexity of policy-making processes, it is challenging to draw direct conclusions from institutional settings to climate policy performance. The relationship between institutional structures and climate policy performance becomes obvious when the stability (or the lack thereof) of specific policies in different countries is being assessed. Institutional structures, policy continuity, and imple- mentation are vital to delivering global climate change goals in line with the Paris Agreement. The decarboniza- tion pathways across sectors are clearly outlined (IPCC 2014) and translated into actions in the transportation sector, which highlights that targets for mitigation of global climate change will not be reached without an appropriate contribution by the transportation sector (Fulton et al. 2013, Sims et al. 2014). The potential of specific measures to mitigate climate change has been well established and shows that the technological changes necessary to reduce transportation sector GHG emissions are readily available (Figueroa et al. 2014). An integrated policy approach that aims to generate synergies rather than trade-offs between policy objectives can help maxi- mize socioeconomic benefits and can help form coalitions that endure and are resilient to political volatility. Table 3 summarizes the main themes outlined in this paper relat- ing to policy and governance approaches. framing Questions Provided that technologies to reduce GHG emissions are available (Figueroa et al. 2014; IPCC 2014) and policy mechanisms to support the uptake of these technologies are proven to be effective (Gross et al. 2009) the follow- ing questions can help frame the conversation on policy and governance during the Fifth EU-U.S. Transportation Research Symposium, Decarbonizing Transport for a Sustainable Future: Mitigating Impacts of the Changing Climate: ⢠What factors influence the policy environment in which transportation policies to mitigate climate change can be successful over the long term? ⢠What policies have been effective at decarbonizing transportation in the European Union and the United States? TABLE 3 Pathways, Policy, and Governance Approaches for Low-Carbon Transport Pathway Policy Approach Governance Approach Toward decarbonization: 1.5°Câ2°C Integrated policies, including planning, modal shift, technology, and fuels Multilevel governance based on broad political and societal coalitions Limited mitigation action: 2.5°C â 3°C Singular measures at local or national level Minimal majority coalitions for specific actions Some efficiency gains but very little mitigation: 3.5°C â 6°C Little action beyond incremental technology improvements No majorities for climate change mitigation action
72 d e c a r b o n i z i n g t r a n s p o r t f o r a s u s t a i n a b l e f u t u r e ⢠What types of policy (taxes, incentives, other) are most effective at which levels of government? ⢠What specific policy and governance challenges exist for decarbonizing transportation? ⢠Are there examples of jurisdictions overcoming these obstacles? Are their experiences transferable? ⢠How can policies be designed to create a basis for broad political and societal coalitions? ⢠How can policy and institutional frameworks be improved to be more resilient? ⢠Where is research needed to support governance efforts and models to decarbonize transportation? references Abbreviations ECMT European Conference of Ministers of Transport IEA International Energy Agency IIASA International Institute for Applied Systems Analysis IPCC Intergovernmental Panel on Climate Change ITF International Transport Forum OECD Organisation for Economic Co-operation and Development TfL Transport for London WEC World Energy Council Cook, J., and S. Rinfret. 2015. Are They Really So Differ- ent? Climate Change Rule Development in the USA and UK. Journal of Public Affairs, Vol. 15, No. 1, pp. 79â90. doi:10.1002/pa.1512. Fais, B., N. Sabio, and N. Strachan. 2016. The Critical Role of the Industrial Sector in Reaching Long-Term Emission Reduction, Energy Efficiency and Renewable Targets. Applied Energy, Vol. 162, pp. 699â712. 10.1016/j.apen ergy.2015.10.112. Fankhauser, S., C. Gennaioli, and M. Collins. 2015. The Political Economy of Passing Climate Change Legislation: Evidence from a Survey. Global Environmental Change, Vol. 35, pp. 52â61. https://doi.org/10.1016/j.gloenv cha.2015.08.008. Figueroa, M. J., O. Lah, L. M. Fulton, A. C. McKinnon, and G. Tiwari. 2014. Energy for Transport. Annual Review of Environment and Resources, Vol. 39, pp. 295â325. http://www.annualreviews.org/doi/10.1146/annurev- environ-031913-100450. Fredriksson, P. G., A. Sauquet, and J. R. Wollscheid. 2016. Democracy, Political Institutions, and Environmental Policy. In Reference Module in Earth Systems and Envi- ronmental Sciences, Elsevier. https://www.researchgate. net/publication/312703637_Democracy_Political_Institu tions_and_Environmental_Policy. Freitag, M., and K. Ackermann. 2016. Direct Democracy and Institutional Trust: Relationships and Differences Across Personality Traits. Political Psychology, Vol. 37, No. 5, pp. 707â723. doi:10.1111/pops.12293. Fulton, L., O. Lah, and F. Cuenot. 2013. Transport Pathways for Light Duty Vehicles: Towards a 2° Scenario. Sus- tainability, Vol. 5, No. 5, pp. 1863â1874. doi:10.3390/ su5051863. Gillingham, K., M. J. Kotchen, D. S. Rapson, and G. Wagner. 2013. Energy Policy: The Rebound Effect Is Overplayed. Nature, Vol. 493, No. 7433, pp. 475â476. Givoni, M., 2014. Addressing Transport Policy Challenges Through Policy-Packaging. Transportation Research Part A: Policy and Practice, Vol. 60, pp. 1â8. https://doi. org/10.1016/j.tra.2013.10.012. Gross, R., P. Heptonstall, J. Anable, and P. E. Greenacre. 2009. What Policies Are Effective at Reducing Carbon Emissions from Surface Passenger Transport? A Review of Interventions to Encourage Behavioural and Techno- logical Change. UK Energy Research Centre, London, UK. Hagen, B., A. Middel, and D. Pijawka. 2016. European Cli- mate Change Perceptions: Public Support for Mitiga- tion and Adaptation Policies. Environmental Policy and Governance, Vol. 26, No. 3, pp. 170â183. doi:10.1002/ eet.1701. IEA. 2010. Cities, Towns and Renewable Energy: Yes in My Front Yard. OECD/IEA, Paris. http://www.iea.org/publi cations/freepublications/publication/cities2009.pdf. IEA. 2011. World Energy Outlook 2011. OECD/IEA, Paris. https://www.iea.org/publications/freepublications/publi cation/WEO2011_WEB.pdf. IEA. 2012. Energy Technology Perspectives 2012: Pathways to a Clean Energy System. OECD/IEA, Paris. https:// www.iea.org/publications/freepublications/publication/ ETP2012_free.pdf. IEA. 2013. Energy Technology Perspectives. OECD/IEA, Paris. IIASA. 2012. Global Energy Assessment: Toward a Sustainable Future. Cambridge University Press, Cambridge, UK, and New York, and IIASA, Laxenburg, Austria. IPCC. 2014. Climate Change 2014: Mitigation of Climate Change. Contribution of Working Group III to the Fifth Assessment Report of the Intergovernmental Panel on Cli- mate Change, Cambridge University Press, Cambridge, UK, and New York. ITF. 2017. ITF Transport Outlook 2017. Organisation for Economic Co-operation and Development, Paris. http://www.oecd.org/regional/itf-transport-outlook- 2017-9789282108000-en.htm. Jänicke, M. 1992. Conditions for Environmental Policy Suc- cess: An International Comparison. Environmentalist, Vol. 12, pp. 47â58. doi:10.1007/BF01267594.
73a p p e n d i x C : e x p l o r a t o r y t o p i C 2 Jänicke, M. 2002. The Political Systemâs Capacity for Envi- ronmental Policy: The Framework for Comparison. In Capacity Building in National Environmental Policy (H. Weidner and M. Jänicke, eds.), Springer, Berlin and Hei- delberg, Germany, pp. 1â18. Justen, A., J. Schippl, B. Lenz, and T. Fleischer. 2014. Assess- ment of Policies and Detection of Unintended Effects: Guiding Principles for the Consideration of Methods and Tools in Policy-Packaging. Transportation Research Part A: Policy and Practice, Vol. 60, pp. 19â30. http://dx.doi. org/10.1016/j.tra.2013.10.015 Lah, O. 2015. Sustainable Development Benefits of Low- Carbon Transport Measures: Guidance for Policy Makers on the Political Potential of Co-Benefits. Deutsche Gesell- schaft für Internationale Zusammenarbeit (GIZ) GmbH, Eschborn, Germany. Lakshmanan, T. R. 2011. The Broader Economic Conse- quences of Transport Infrastructure Investments. Journal of Transport Geography, Vol. 19, pp. 1â12. http://dx.doi. org/10.1016/j.jtrangeo.2010.01.001. Marquardt, J. 2017. Conceptualizing Power in Multi-Level Climate Governance. Journal of Cleaner Production, Vol. 154, No. 15, pp. 167â175. http://dx.doi.org/10.1016/j. jclepro.2017.03.176. Marshall, J. D. 2011. Energy-Efficient Urban Form. Environ- mental Science and Technology, Vol. 42, No. 9, 3133â 3137. Never, B., and J. Betz. 2014. Comparing the Climate Policy Performance of Emerging Economies. World Develop- ment, Vol. 59, pp. 1â15. http://dx.doi.org/10.1016/j. worlddev.2014.01.016. Ruzzenenti, F., and R. Basosi. 2008. The Rebound Effect: An Evolutionary Perspective. Ecological Economics, Vol. 67, pp. 526â537. http://dx.doi.org/10.1016/j.ecole con.2008.08.001. Simmons, R. 2016. Improvement and Public Service Rela- tionships: Cultural Theory and Institutional Work. Pub- lic Administration, Vol. 94, No. 4, pp. 933â952. http:// dx.doi.org/10.1111/padm.12257. Sims, R., R. Schaeffer, F. Creutzig, X. Cruz-Núñez, M. DâAgosto, D. Dimitriu, M. J. F. Meza, L. Fulton, S. Kobayashi, O. Lah, A. McKinnon, P. Newman, M. Ouyang, J. J. Schauer, D. Sperling, and G. Tiwar. 2014. Transport. In Climate Change 2014: Mitigation of Cli- mate Change. Contribution of Working Group III to the Fifth Assessment Report of the Intergovernmental Panel on Climate Change (O. Edenhofer, R. Pichs-Madruga, Y. Sokona, E. Farahani, S. Kadner, K. Seyboth, and A. Adler, I. Baum, S. Brunner, P. Eickemeier, B. Kriemann, J. Savolainen, S. Schlömer, C. von Stechow, T. Zwickel, and J. C. Minx, eds.), Cambridge University Press, Cambridge, UK, and New York. Sørensen, H., K. Isaksson, J. Macmillen, J. à kerman, and F. Kressler. 2014. Strategies to Manage Barriers in Policy Formation and Implementation of Road Pricing Packages. Transportation Research Part A: Policy and Practice, Vol. 60, pp. 40â52. http://www.sciencedirect.com/science/arti cle/pii/S0965856413002012. Sorrell, S. 2010. Energy, Economic Growth and Environmen- tal Sustainability: Five Propositions. Sustainability, Vol. 2, No. 6, pp. 1784â1809. Spataru, C., P. Drummond, E. Zafeiratou, and M. Barrett. 2015. Long-Term Scenarios for Reaching Climate Tar- gets and Energy Security in UK. Sustainable Cities and Society, Vol. 17, pp. 95â109. http://dx.doi.org/10.1016/j. scs.2015.03.010. TfL. 2007. Transport for London Annual Report and State- ment of Accounts. Transport for London, UK. Tsebelis, G., and G. Garrett. 1996. Agenda Setting Power, Power Indices, and Decision Making in the European Union. International Review of Law and Economics, Vol. 16, pp. 345â61. WEC. 2008. Assessment of Energy Policies and Practices. Lon- don. additional resources Delucchi, M. A. 2010. Impacts of Biofuels on Climate Change, Water Use, and Land Use. Annals of the New York Academy of Sciences, Vol. 1195, pp. 28â45. https://doi. org/10.1111/j.1749-6632.2010.05457.x. ECMT. 2007. Cutting Transport CO2 Emissions: What Prog- ress? OECD, Paris. https://www.itf-oecd.org/sites/default/ files/docs/07cuttingco2.pdf. Kahn Ribeiro, S., and M. J. Figueroa. 2012. Energy End-Use: Transportation. In Global Energy Assessment: Toward a Sustainable Future, Cambridge University Press, Cam- bridge, UK, and New York, and IIASA, Laxenburg, Aus- tria, pp. 575â648.
74 APPENDIX D: EXPLORATORY TOPIC 3 Megaregions Policy, Research, Practice Delia Dimitriu, Manchester Metropolitan University, Manchester, United Kingdom Ray F. Toll, U.S. Navy (ret.) and Old Dominion University, Norfolk, Virginia, USA The International Transport Forum (ITF) has released its ITF Transport Outlook 2017 report, which claims that the transportation sector âwill not achieve the international communityâs climate ambi- tionsâ of zero emissions by the year 2050 (ITF 2017). According to ITFâs General Secretary, José Viegas, âWe need to both accelerate innovation and make radical policy choices to decarbonize transportation.â Urban mobility in communities of high congestion is an area of great con- cern. Many of these cities have not taken steps to amend policies, such as integrating land use codes with trans- portation policies or transit-oriented development; intro- ducing road-pricing mechanisms, such as high-occupancy toll lanes, to better manage mobility patterns; investing in accessibility and reliability; and reducing greenhouse gas (GHG) emissions. This paper explores policy framework options that would enable international communities to achieve their climate ambitions. As stated in the white paper for this symposium, transportation is one of the highest emitters of GHGs of the economic sectors. The transportation sector, which represents 23% of all energy-related emissions, has a responsibility to reduce its emissions, as they are hav- ing a global impact on the climate. During the United Nations 21st Conference of the Parties, the parties of the Kyoto Protocol created a political pathway with 5-year reviews for national decarbonization commit- ments to begin in 2020. The framework establishes a common understanding of the needs for being prepared to address the challenges ahead. These needs include addressing policies, regulations, and standards. With the right policy mix, communities, even rapidly growing cit- ies, will be in a position to develop in a sustainable way and provide todayâs level of mobility at the near-term goal of 2030 and the long-term goal of 2050. Commu- nity leaders should consider policy options that would accomplish the following: ⢠Avoid unnecessary transportation or traffic, ⢠Shift to a sustainable transportation system, and ⢠Improve efficiency (carbon fuel or switch to elec- tricity or biofuels or both). Additional considerations might include market- based mechanisms or incentives, such as an offsetting scheme for international aviation, which was adopted by the International Civil Aviation Organization. The Kyoto Protocol includes three such mechanisms: a clean development mechanism; joint implementation; and emissions trading. In any case, the right policy mix will be agile, so as to incorporate future innovations in transportation. Technological innovations, such as electric and autonomous vehicles, and economic inno- vations, such as shared mobility (i.e., cars and bicycles) and electronic payment systems, need to be analyzed to remove barriers and enable implementation. Technologi- cal progress alone will not achieve a reduction of carbon dioxide (CO2) emission in cities. Advancements in transportation are expected to fundamentally change passenger and freight mobility patterns, particularly in urban communities of large metropolitan areas. Regional transportation planning that focuses on modal connectivity and coordination increases mobility and accessibility options for people
75a p p e n d i x d : e x p l o r a t o r y t o p i c 3 to live in one community while working in another. Meanwhile, travelers do not change their transporta- tion habits as quickly without being offered some sort of incentive. For example, consumers shop without leav- ing home or work, saving them money on transportation costs, which also means goods movements can be better coordinated and have a lower-carbon solution. Policies and planning should account for these types of changes in transportation usage and should account for reduc- tions to avoid building potentially unnecessary expen- sive infrastructure. Policies influencing behavior change, such as increased fuel taxes, low transit fares, congestion charges, or land use policies that limit urban sprawl, are needed to mitigate further GHG emissions (Polis 2016). Lower CO2 emissions from urban mobility are a posi- tive side effect of policies targeting air quality and con- gestion. Transportation stays at the heart of the economy and connects people with places and things, so integrated regional solutions are needed for an integrated, inclu- sive, seamless, low-carbon transportation system. To fully realize the benefits of land use and transportation planning, should regional transportation planning incor- porate land use development concepts as a central con- sideration from the early stages of local planning? For example, whenever new houses or retail areas are being planned, application of land use development approaches may be more capable of anticipating negative impacts from congestion caused by sustained economic growth (DfT 2011, para. 3.12). If regional transportation planning can be used as a policy, regulatory, and standards framework to include GHG reductions, there are many questions to ask. One of the most obvious questions is, how is âregionalâ defined? Many sustainability and resiliency experts believe a regional construct should be viewed as a build- ing block to a national mitigation and resilience plan. Great importance is placed on regions and on multi- agency governance structure. The Regional Plan Association (RPA), a New Yorkâ based planning organization, recommends regional plan- ning be based on communities depending on neighboring communities for essential functions and services. Com- munity dependencies reach farther than expected, into what RPA (2006) calls megaregions (in the United States) and metropolitan areas (in the European Union). (A megaregion is defined in several ways; here, it is a large network of metropolitan regions that share transporta- tion infrastructure, settlement, and land use patterns.) Reaching across state and national borders, megaregions are becoming the new competitive unit in the global economy. Megaregions are defined by communities con- nected through environmental systems, infrastructure systems, economic linkages, land use patterns, and cul- ture. Many of these areas of connection could address policies for the mitigation of GHG emissions that tar- get both air quality and congestion. To work effectively in the area of decarbonization, joint efforts are needed worldwide. Policy makers and dedicated stakeholders (e.g., transportation authorities, local authorities, indus- try, planners) would need to implement the right policy mix to mitigate carbon emissions. In reflection, one asks how governments could adopt the right policy mix by integrating regional plans and programs for a megare- gional policy framework to include mitigation of GHG emissions. european union approach to megaregions Urban mobility is at a critical stage in Europe. By 2020, cities are expected to host around 80% of EU citizens and thus put further pressure on urban transportation systems. The European Commissionâs Urban Mobility Package and the EU Low-Emission Mobility Strategy (EC 2016) both provide exigency for addressing the chal- lenges ahead. The situation in the EU is quite dramatic, as shown on PM10 interpolated maps (Figure 1). (The notation PM10 is used to describe particulate matter of 10 micrometers or less in size.) The illustration is selected to point out the EU aproach to policies that target both air quality and congestion. Figure 1 shows substantial pollution linked to heavy traffic in two expansive regional areas: ⢠Northern Italy, which is walled by the Alps and hampered by other meteorological conditions, and ⢠Eastern Europe, which lacks general restrictions on pollution. In Europe, metropolitan areas are bridged together by a long-distance transportation system for passenger and freight movements. This system is recognized as the Trans-European Transport Network (TEN-T network) by the European Commission and its member states. It comprises roads, railway lines, inland waterways, inland and maritime ports, airports, and railroad termi- nals throughout the 28 member states. This character- istic is a key factor for the networkâs efficient, safe, and secure operation and uses seamless transportation chains for passengers and freight. The comprehensive system includes a core network strategically selected according to vital importance for European and global transpor- tation flows. Conceptually developed by the European Commission and subjected to broad consultation among member states and other stakeholders, TEN-T is the first method of its kind. Considering that transportation is the backbone of national and global economies, as it connects people with places, is Europe ideally suited, with its regional and core network management of TEN-T, to integrate design
76 d e c a r b o n i z i n g t r a n s p o r t f o r a s u s t a i n a b l e f u t u r e and planning processes as well as implement the best air quality and CO2 reduction solutions to mitigate the cli- mate risks illustrated in Figure 1? The 2016 European Strategy for Low-Emission Mobility should be seen as one of the tools for modernizing the European economy and strengthening its internal market. The involvement of cities and local authorities is crucial for the delivery of this strategy, which also reiterates Europeâs commit- ment to pursuing global efforts to control emissions from international aviation and maritime transportation. What of the transportation systems that are outside the TEN-T? Connecting urban, suburban, and rural communities is equally considered in designing the Sus- tainable Urban Mobility Plan, or SUMP, for European cities and regions (Polis 2016). At the March 2017 Workshop on Decarbonizing the Transport System, held in Manchester, England, several strategic European cit- ies and areasâincluding Barcelona, Spain; Budapest, Hungary; the Emilia Romagna Region of Italy; Milan Italy; and Manchesterâpresented their work in process as case studies (as outlined below) and described their aspirations and research needs for cities to address their challenges. In conclusion, the right policy mix in Europe for reducing CO2 emissions in urban transportation should consider how to include all transportation modes and create an integrated, inclusive, and seamless transporta- tion system. This approach may be expected to be part of a new urban mobility culture and paradigm shift. european case study: decarBonization through integrated regional moBility In this section, two of the case studies presented during the workshop in Manchester are explored. These case studies were selected for their existing agglomerations of metropolitan areas that are working toward economic growth and improved quality of life. The case studies illustrate two European regions known as âBlue Bananaâ and âGolden Banana.â ⢠Blue Banana is also known as the âEuropean Mega- lopolisâ or the âManchesterâMilan Axis,â a discontinuous corridor of urbanization in Western Europe with a popula- tion of around 111 million (Figure 2) (Hospers 2003). ⢠Golden Banana, or the sun belt, denotes an area of higher population density lying between Valencia, Spain, in the west and Genoa, Italy, in the east along the coast of the Mediterranean Sea. This area was defined by European Commissionâs 1995 Europe 2000 report as being analogous to the Blue Banana (Hospers 2003). The region is an economic center for information technology and manufacturing (Figure 3). FIGURE 1 PM10 interpolated maps illustrating 2016 pollution levels from traffic volumes in the European Union (EEA 2016 and Transport for Greater Manchester workshop, March 2017; reprinted by permission of Giuseppe Lupino, Istituto Sui Trasporti e la Logistica Fondazione, giuseppe.luppino@regione.emilia-romagna.it).
77a p p e n d i x d : e x p l o r a t o r y t o p i c 3 Blue Banana Case Study: Transport for the NorthâIntegrated Seamless Transport The North of England is part of the ManchesterâMilan axis that constitutes the Blue Banana. It is home to 16 million people, 7.2 million jobs, and contributes more than £290 billion gross value added toward the UK econ- omy. It is home to multiple world-renowned universities and centers of excellence and is a key contributor to the freight and logistics industry. Transport for the North (TfN) aims to transform the transportation system of the North of England by con- necting the region with fast, frequent, and reliable trans- portation links that will help drive economic growth and create a northern powerhouse. By considering roads, rail, waterways, ports, and airports jointly, TfN will ensure that people and freight can move freely and easily around the entire region. The main aim is to plan and deliver the improvements needed to truly connect the North in an integrated, seamless, low-carbon system. TfN will connect the six cities of Liverpool, Manchester, Leeds, Sheffield, Hull, and Newcastle in an ambitious economic plan (Figure 4). An integrated approach through sustainable regional urban mobility planning could focus on a modal shift from single-occupancy vehicles to public transportation or shared mobility initiatives or both. Such an approach could obtain near-term benefits through increased effi- ciencies in freight mobility between rail and road net- works and could improve travel times, reliability, and affordability in public transportation. Increasing the effi- ciency of the transportation system by making the most FIGURE 2 European Blue Banana (https://en.wikipedia .org/wiki/Blue_Banana). FIGURE 3 European Golden Banana (https://en.wikipedia .org/wiki/Golden_Banana). FIGURE 4 Transportation for the North, cityâregion network (Transport for Greater Manchester workshop, March 2017; provided by Rafael Cuesta, Transport for Greater Manchester).
78 d e c a r b o n i z i n g t r a n s p o r t f o r a s u s t a i n a b l e f u t u r e of digital technologies, congestion and smart pricing, and low-carbon emission transportation modes is part of the regionâs 2017 and 2018 ambitions. Steps taken to inte- grate rail and road networks, in coordination with sus- tainability planning, have led to the formulation of six projects, including strategic road studies, rail franchising, and integrated and smart travel (Figure 5). The projects are all linked to achieving a low-carbon system in the TfN region. Manchester, the capital of Greater Manchester (part of the North region), has 2.7 million residents and 7 mil- lion people within 1 hour of the city center. The region is made up of 10 local authorities that have been working together since 2011 as part of the combined authority, with Transport for Greater Manchester (TfGM) being the transportation arm for the city region. Its economic potential exceeds that of all other UK city regions out- side of London. The environmental agenda is very ambi- tious, because transportation is responsible for a third of carbon emissions in the region. Like other cityâregions, TfGM is investigating the feasibility of clean air zones. These generally impose access restrictions on vehicles (typically heavy goods vehicles and buses) below certain emission standards. Careful evaluation is needed to ensure that benefits outweigh costs and that environmental protection would not have a negative impact on local and regional eco- nomic growth. By 2020, the city region aims to reduce CO2 emissions by 48% by implementing smart mobility solutions to fully integrate the transport network. One solution that links urban, suburban, and rural commu- nities is flexible on-demand transport (FDT). In testbed areas of Greater Manchester, a next-generation com- mon operating platform of FDT connects users to shared mobility services for door-to-door, door-to-employer, and door-to-public transit services. The next generation of FDT services builds on the TfGM programs currently operating door-to-door services. Ring and Ride has been providing a mobility service for the elderly and disabled persons for several decades. This service is complemented by 25 Local Link services operated by four different companies serving about 350,000 passengers annually. Building on this experience, the next generation of FDT is expected to deliver significant reductions in CO2 emis- sions by enabling more passengers to use public transit. The service will also provide more flexibility as part of integrated mobility as a service (MaaS). Golden Banana Case Study: Metropolitan Region of Barcelona The Metropolitan Region of Barcelona, an intergovern- mental consortium created to coordinate public trans- portation, includes 164 municipalities and 5.2 million residents. Nearly half of the region is sloped at or above a 20% grade, which restricts the area suitable for urban- ization and human inhabitants. Seventy-five percent of the surface is protected open space area. Most people live in the plains and corridors (Figure 6). The geographic challenges and congested living spaces impose several difficulties in the development of a regional master plan for transportation infrastructure. To plan all-modes mobility of passengers and freight in the Metropolitan Region of Barcelona that utilizes GHG- reducing solutions would require the right policy mix FIGURE 5 Transportation for the North, rail and road network (Transport for Greater Manchester workshop, March 2017; provided by Rafael Cuesta, Transport for Greater Manchester).
79a p p e n d i x d : e x p l o r a t o r y t o p i c 3 of regional planning, integrated transportation manage- ment, and pricing. These are channeled through 75 mea- sures that are part of nine mobility area (MA) programs to be adopted in 2017 (http://81.47.175.201/project-pro tocol/index.php/urban-and-metropolitan-strategies): MA1. Coordinating urban development and mobility; MA2. Fostering a safe and well-connected network of mobility infrastructures; MA3. Managing mobility and favoring modal transfer; MA4. Improving the quality of railway transportation; MA5. Achieving accessible, effective, and efficient bus service; MA6. Modernizing logistics activity and accelerating railway infrastructure for freight mobility; MA7. Guaranteeing sustainable access to job locations; MA8. Promoting energy efficiency and the use of clean fuels; and MA9. Carrying out participative management of the implementation of the Mobility Master Plan. The environmental goals are very ambitious, indicat- ing a 12.3% reduction of CO2 by 2013. To achieve those goals, it is necessary to speed up the decarbonization mobility plan for the region. The programs listed above will be grouped into the following categories: ⢠Promoting a modal shift to more efficient modes; ⢠Promoting efficient and less-polluting mobility; ⢠Fostering electric mobility (Figure 7); FIGURE 6 Metropolitan Region of Barcelona, 2016 (Transport for Greater Manchester workshop, April 2017; reprinted by permission of LluÃs Alegre Valls, lalegre@atm.cat). FIGURE 7 Joint strategy for the gradual replacement of a fuel vehicle fleet with an electric vehicle fleet (Transport for Greater Manchester workshop, April 2017; reprinted by permission of LluÃs Alegre Valls, lalegre@atm.cat). (a) (b)
80 d e c a r b o n i z i n g t r a n s p o r t f o r a s u s t a i n a b l e f u t u r e ⢠Placing people at the core of the decarbonization commitment as part of a participation strategy that is expected to turn some actions into powerful tools: â Communication and information, â MaaS, â Sharing the future, â Customer orientation to services, and â Agreement toward a decarbonized society (e.g., leaving the car, choosing clean vehicles, driving effi- ciently, using shared mobility services). Despite the explicit commitment and major improvements in decarbonization that have been made by the Catalan transportation system, there is considerable room for improvement and for the implementation of new projects to reduce greenhouse emissions in the region. u.s. case study: adaptation can help mitigation The selected case study from the United States aims to bridge a research gap. This case study focuses on the interference of adaptation actions with GHG mitiga- tion policies in the transportation sector in the Hampton Roads region of Virginia from 2014 to 2016. An inter- governmental blueprint for community resiliency, the Hampton Roads Sea Level Rise [SLR] Preparedness and Resilience Intergovernmental Pilot Project (convened by Old Dominion University and launched in June 2014) (Center for Sea Level Rise 2016), was one of three White House National Security Council pilots and one of three Department of Defense pilots in response to the 2013 Presidential Executive Order called âPreparing the United States for the Impacts of Climate Changeâ (EOP 2013). Background Boasting the largest natural coastline in the world, South- eastern Virginia has an economy and culture tied largely to the strength of its ports and waters. The Hampton Roads regionâs geography has attracted multiple mili- tary installations, including the largest naval base in the world, the third-largest commercial harbor on the east- ern seaboard, manufacturing facilities, commercial fish- eries, residential development, and tourism. Over the past 2 years, Hampton Roads localities including Virginia Beach and Norfolk, four state-level government departments, 11 federal agencies (including the Department of Defense), the Virginia Port Authority, a variety of private businesses, and three nonprofit orga- nizations worked together in a White Houseâannounced intergovernmental pilot project convened by Old Domin- ion University to figure out how to build coastal resil- ience in the face of increasing sea level rise (Figure 8). FIGURE 8 Project interaction map (ODU 2016). Department of Defense Facilities Other Federal Facilities Tide and water level gauges Operator NOA USGS Local/USGS VIMS NASA Continually Operating Reference Stations (CORS)
81a p p e n d i x d : e x p l o r a t o r y t o p i c 3 Whole of Government and Community The goal of this initiative was to establish an intergov- ernmental planning process to effectively coordinate SLR preparedness across multiple federal, state, and local government agencies as well as the private and nonprofit sectors while taking into account perspec- tives and concerns of the regionâs citizens (Center for Sea Level Rise 2016). Led by a steering committee, volunteers focused on legal issues, infrastructure requirements, citizen engage- ment, public health, science, and economic impacts. Sev- eral aspects are worth mentioning: ⢠Linking infrastructure interdependencies (on and off base) by sharing maps, plans, and so forth with neigh- boring jurisdictions and municipalities. ⢠Creating and maintaining an integrated regional network to observe impacts to the economy, storm water, public health, and infrastructure. These data could be used in real time but also archived to properly monitor longer-term changes at a greater level of spatial and temporal fidelity. ⢠Incentivizing whole-of-government practices for each municipality through grants, requests for proposals, and other federal and nonfederal acquisition practices. ⢠Integrating plannersâ and emergency managersâ plans and procedures to address real-time threats (such as Hurricanes Sandy and Matthew) and long-term trends like sea level rise. ⢠Improving scientific research methods through data integration and model improvement. Success story: an integrated right policy mix approach is an absolute requirement for any (mega)region, and thus entire governmentâcommunity practices are needed. The outcome of Hampton Roads can lead to greater inno- vation through emphasizing the integration of practices, science, and engineering solutions. It also shows the need to consider adaptation and mitigation measures at the same time when planning transportation infrastructure and systems. Upon completion of the pilot project, Hampton Roads will have laid the groundwork for a regional whole-of- government, whole-of-community organizational frame- work and procedures that effectively coordinate SLR preparedness and resilience planning. (Note: EU case studies do not tackle maritime issues.) An important next step would be a U.S. Department of Transportation ini- tiative to quantify climate change impacts. Federal trans- portation officials chose Hampton Roads for this work and were proactive partners throughout the 2-year pilot effort (2014 to 2016). Lessons about decarbonizing transportation include the following: ⢠Effective resilience planning requires consider- ation of land use planning, infrastructure, private-sector organizations, science and engineering, local, state, and federal agencies, military installations for mission assur- ance, citizen engagement, and the municipal planning committee or local metropolitan planning organization. These and additional stakeholders are part of the current operating structure. ⢠A whole-of-government, whole-of-community approach can be transferred from adaptation to miti- gation by showing how adaptation can help mitigation in tackling climate change in the transportation sec- tor (Bosello et al. 2013). The Hampton Roads region has the tools and resources to move forward with a collaborative process on measures toward zero-carbon transportation. The Research Gap: How Can Adaptation Help Mitigation? The literature review identified gaps and barriers in adaptation and mitigation (decarbonizing) paths and suggested policy actions to better align adaptation actions with long-term mitigation goals in transportation (TRB 2016). Adaptation focuses on the identification of actions that should be implemented in the short term and tends to adopt a local, project-specific aim. Mitigation (toward zero-carbon transportation) keeps a strategic, long-term perspective, and a global focus; transportation maintenance managers, operators, or service providers will typically be involved in adaptation actions, whereas planners and decision makers will dominate mitigation policy discussions. In short, the universe of interactions between adaptation and mitigation is currently perceived as quite limited. Research Question: How can the transportation sector be better helped to reduce impacts on cli- mate change? Given the regional approach presented in the Hampton Roads case study, the exploration of the need to include a path-dependency perspective to adaptation and miti- gation in transportation may be useful. When policies are addressed independently, there is a significant risk of optimizing one of the two dimensions (adaptation or mitigation), while obtaining poor, if any, improve- ments in the other. The current institutional framework would be a significant barrier to exploring an integrated approach that could find a fair compromise between adaptation and mitigation options. Figure 9 illustrates a proposed link between adaptation and mitigation mea- sured in transportation systems.
82 d e c a r b o n i z i n g t r a n s p o r t f o r a s u s t a i n a b l e f u t u r e Reviewing Key Approaches to Low-Carbon Transport Systems Technological innovation, modal change, infrastructure, and services related to information and communication technology (ICT) (including traffic management and usersâ information) will indicate where adaptation and mitigation can work together. Technological innova- tions and infrastructure deployment and upgrading are expected to maintain or improve the efficiency and per- formance of the transportation system and thus avoid disruptions in operations. The ICT category, however, can be understood as being closer to a system resilience approach, in which ICT tools would be able to facilitate quick recovery, to gain flexibility, and to redirect users toward other routes and modes, or even to review their transportation plans in case of disruptions. As for the modal change category, the robustness of the system as a whole and its various transportation modes is also taken for granted, although it can be argued that the concept of robustness is understood in a different way in the various transportation modes (Aparicio 2015). What to Expect? Certainly, the inclusion of future low-carbon traits of the transportation system in adaptation studies and actions is challenging. Mitigation strategies have not been explored in much detail with regard to how technological and nontechnological innovations would behave under a changed climate. Given that regions and megaregions face multiple impacts (e.g., weather, health, and trans- portation), the research community is facing the need to investigate both mitigation and adaptation pathways and the role of modal change, intelligent transportation sys- tems, MaaS, active travel, and more in a changed climate. conclusion and framing Questions There are several options and a range of policy tools for reducing carbon emissions in metropolitan areas and mega- regions by reducing congestion, improving vehicle flow, reducing unnecessary traffic, and creating the momentum for modal shift. However, the ultimate deployment and implementation of a selected right policy mix is a matter for cities and regions to determine. While some best practices (e.g., app-based mobility services, more stringent emission regulations, better charging facilities) have been successful in several metropolitan areas, they are not always transfer- able. Predicting how things will develop remains challeng- ing, as megaregions increase in complexity. The following questions may help prioritize policy tools and add to these opportunities while identifying areas for further research during this symposium: 1. What will it take to create an integrated megare- gion climate framework for the transportation sector while also considering mitigation and adaptation mea- sures at the same time? â What would be the most effective behavior- changing policies? â What policy barriers are expected in transferring best practices from one region to another? â What would be the phases toward an integrated climate monitoring network? â What steps can be taken to make the entire com- munity (government, community, industry) work for an integrated regional solution? (a) (b) FIGURE 9 Mitigation and adaptation paths (Aparicio 2015).
83a p p e n d i x d : e x p l o r a t o r y t o p i c 3 ⢠How can a whole-of-government approach be funded? ⢠What are the legal barriers that new legisla- tion could address? â How could this framework meet the United Nations sustainability goals? 2. How may several regions be brought together to work for an integrated, smart, and low-carbon transpor- tation system, given the challenge of multiple differences? 3. Given todayâs knowledge of the policy mix on decarbonizing urban and regional transportation, what policy mixes should be prepared to respond to the dou- bling of passengers in traffic (see Appendix A, Figure 27) by 2030? By 2050? 4. What topics should be considered for a joint EU- U.S. program on transportation and climate change? â Can the Old Dominion University (U.S.) case study be implemented in other regions by using other universities as the convenerâtrusted agent with appli- cable research and a firm understanding of the stake- holders in those regions? â Are there any other novel aspects, in research or practice, to be considered? references Abbreviations DfT Department for Transport, United Kingdom EC European Commission EEA European Environmental Agency EOP Executive Office of the President ITF International Transport Forum ODU Old Dominion University RPA Regional Plan Association TRB Transportation Research Board Aparicio, A. 2015. Is Adaptation Conflicting with Mitigation Policies in Transport? Presented at 43rd European Trans- port Conference, Goethe University, Frankfurt, Germany, Sept. 28â30, 2015. Bosello, F., C. Carraro, and E. De Cian. 2013. Adaptation Can Help Mitigation: An Integrated Approach to Post-2012 Climate Policy. Environment and Development Econom- ics, Vol.18, pp. 270â290. Center for Sea Level Rise. 2016. Old Dominion University. http://www.centerforsealevelrise.org/. DfT. 2011. Creating Growth, Cutting Carbon: Making Sus- tainable Local Transport Happen. Local Transport White Paper. https://www.gov.uk/government/uploads/system/ uploads/attachment_data/file/3890/making-sustainable- local-transport-happen-whitepaper.pdf. EC. 2016. A European Strategy for Low-Emission Mobil- ity. http://ec.europa.eu/transport/themes/strategies/ news/2016-07-20-decarbonisation_en. EEA. 2016. Air Quality Interpolated Maps. https://www.eea. europa.eu/themes/air/air-quality/map/airbase/air-quality- interpolated-maps. EOP. 2013. Executive Order: Preparing the United States for the Impacts of Climate Change. https://obamawhitehouse. archives.gov/the-press-office/2013/11/01/executive-order- preparing-united-states-impacts-climate-change. Hospers, G.-J. 2003. Beyond the Blue Banana? Structural Change in Europeâs Geo-Economy. Intereconomics, Vol. 38, No. 2, pp. 76â85. http://dx.doi.org/10.1007/BF03031774. ITF. 2017. ITF Transport Outlook 2017. Organisation for Economic Co-operation and Development, Paris. http://www.oecd.org/regional/itf-transport-outlook- 2017-9789282108000-en.htm. ODU. 2016. Hampton Roads Sea Level Rise Preparedness and Resilience Intergovernmental Pilot Project. Phase 2 Report: Recommendations, Accomplishments and Les- sons Learned. Norfolk, Virginia. Polis. 2016. Decarbonising Transport: The Perspective of Euro- pean Regions and Cities. Policy Paper. Brussels, Belgium. http://www.polisnetwork.eu/uploads/Modules/PublicDoc uments/decarbonisation_of_transport_polis_position.pdf. RPA. 2006. America 2050: A Prospectus. New York. http:// www.america2050.org/pdf/America2050prospectus.pdf. TRB. 2016. Transportation Resilience: Adaptation to Climate Change and Extreme Weather Events. Summary of the Fourth EU-U.S. Transportation Research Symposium. Transportation Research Board, Washington, D.C. http:// www.trb.org/Main/Blurbs/175488.aspx. additional resources 21st Conference of the Parties to the United Nations Frame- work Convention on Climate Change. http://www.un.org/ sustainabledevelopment/cop21/. Chapter 8: Transport. In Climate Change 2014: Mitigation of Climate Change. Intergovernmental Panel on Climate Change, Geneva, Switzerland, 2014. European Commission. Towards a Strategic Transport Research & Innovation Agenda (STRIA). Horizon 2020. http:// ec.europa.eu/programmes/horizon2020/en/news/towards- strategic-transport-research-innovation-agenda-stria. McKinsey & Company. Urban Mobility 2030: How Cities Can Realize the Economic EffectsâCase Study Berlin. McKinsey Berlin, 2016. https://www.mckinsey.de/files/ urban_mobility_english.pdf. Simply Connect. 2017. https://simply-connect.com/en. Tóth, G., à Kincses, and Z. Nagy. 2014. European Spatial Struc- ture. LAP LAMBERT Academic Publishing, Saarbrücken, Germany. http://dx.doi.org/10.13140/2.1.1560.2247.
84 APPENDIX E: EXPLORATORY TOPIC 4 Decarbonizing the Logistics and Long-Distance Transportation of Freight Steven S. Cliff, California Air Resources Board, Sacramento, California, USA Phillip T. Dube, California Air Resources Board, Sacramento, California, USA Simon Edwards, Ricardo, Shoreham-by-Sea, United Kingdom The long-distance transportation of freight and its logistics have been identified as one of the most difficult socioeconomic activities to decarbonize (1, 2). Freightâs share of total transportation greenhouse gas (GHG) emissions is predicted to rise from 42% in 2010 to 60% in 2050 (3). Yet the Intergovernmental Panel on Climate Change suggests that transporta- tion overall must achieve very significant reductions in GHG emissions to align with the provisions of the 21st Conference of the Parties to the United Nations Framework Convention on Climate Change. (4, 5); for example, the carbon intensity [e.g., grams carbon dioxide equivalent per tonne-kilometer (g CO2e/tonne- kilometer)] of freight movement in Europe would have to drop to about one-fifth of its 1990 level to meet the European Commissionâs 2011 target of a 60% cut in CO2 emissions from passenger and freight transport between 1990 and 2050 (6). The logistics and long-distance transportation of freight include the activities of all the vehicles (trucks, locomotives, aircraft, and harbor craft) and all types of equipment used to move freight at seaports, airports, rail yards, warehouses, and distribution centers. It also includes the use of other modes like oceangoing freight and intercontinental air freight, and the last-mile com- ponents of freight. However, these two modes are not the focus of this workshop scoping paper. The logistics and long-distance transportation of freight naturally involve the use of much infrastructure, such as freight hubs, which are considered to be facilities, along with the network of roads, land ports of entry, railways, airports with their airways, and waterways. This paper aims to provide context to the discussions on the decarbonization of freight in the United States and Europe. There are scenarios and discussion questions toward the end of the paper that are intended to inspire dialogue that ultimately identifies the research needs or knowledge gaps in our efforts to decarbonize freight. BacKground A growing population, increasing demand for goods, sudden changes in commodities and movement pat- terns (like the emergence of the Bakken oil), the need to remain competitive in an increasingly complex global marketplace, and an aging transportation infrastructure have placed freight systems around the world under seri- ous strain. In some regions, the level of investment in freight-specific transportation needs has not kept pace with a growing economy and thus has added to this strain. Given the inherent importance of having func- tioning freight logistics and long-distance transportation systems, both globally and regionally, it is important to establish development funding. This funding should be substantial, continuing, multimodal, reliable, and specifi- cally dedicated to freight transportation projects in order to decarbonize the freight system. Freight funding is not just limited to vehicles and equipment; it includes the transportation and energy infrastructure plus workforce development to help workers transition to a decarbon- ized transportation system. However, funding needs to be structured around future needs and constraints. For example, projected population and economic growth of
85a p p e n d i x e : e x p l o r a t o r y t o p i c 4 U.S. freight movements across all modes are expected to grow by roughly 42% by the year 2040. It is sometimes difficult to plan and implement freight projects because the priorities among global to local governmental and private organizations vary substantially. Publicly owned freight systems (apart from the waterway system) are pri- marily planned and managed by regional and local gov- ernments. At the same time, a local governmentâs control of land use and its dependence on property taxes may challenge broader regional transportation objectives. These effects result in fragmented decision making when it comes to projects of global, regional, and national sig- nificance (7). It is clear that decisions related to the future decar- bonization of long-distance freight transportation will be complex and need to include many stakeholders (see Figure 1). Future advances in technology and changes in supply chains could reduce the intensity of freight trans- portation in the global economy. It is also not enough to limit the discussion to the GHG emissions from the movement of freight; the focus includes particulate mat- ter (PM) and NOx emissions, which are detrimental to air quality and human health. Often GHGs and PM have an inverse relationship; therefore, focusing on one and ignoring the other can lead to a situation in which one problem is solved while another is created. The reshoring of manufacturing activity (i.e., the bringing of manufacturing to consuming countries), the relocalization of food supplies, and changes in trade restrictions may reduce long-distance freight transpor- tation and its carbon footprint. However, as the global population continues to grow, more freight movement is expected. Additionally, technologies such as miniaturiza- tion (the trend to manufacture ever smaller mechanical, optical, and electronic products and devices), digitization (the conversion of text, pictures, or sound into a digital form that can be processed by a computer), and local- ized additive manufacturing (technology processes that FIGURE 1 Complexity of logistics: import supply chain example (8). Step 4: Products delivered from the distribution center to retail stores and sold to consumers in California or Continental U.S. Step 3: Cargo transported by truck is transloaded from a 40â container to a 53â container before arriving at a distribution center. Step 2: Unloaded at seaport and loaded onto truck (likely in-state cargo) or train (likely out-of-state cargo). Step 1: Overseas commodity production and transport to California. Step 4: Products d livered from the distribution c nter to retail stores and sold t consumers in California or Continental U.S.
86 d e c a r b o n i z i n g t r a n s p o r t f o r a s u s t a i n a b l e f u t u r e build three-dimensional objects by adding layer upon layer of material) could remove the need for some local and global trade (9). However, political commitment to economic development is likely to mean that the growth in the global transportation of freight will be maintained. There is evidence to suggest that some of these factors, such as relocalization, may actually increase the carbon footprint of some products (10). A net reduction in the total ton-kilometers of freight seems almost impossible; for further sustainability and societal benefits to be real- ized, efforts should focus on driving down the average carbon intensity of freight logistics and transportation (2). These benefits may include reductions in other (toxic) emissions and related health effects. The carbon intensity of logistics and the transporta- tion of freight is determined by at least five parameters: the structure of the logistics chain, the modalities of the freight, the utilization of the facilities and vehicles, the energy efficiency of these facilities and vehicles, and the carbon basis of the energy consumed. Each of these parameters is considered below along with possible related needs for research. Structure of the Logistics Chain The structure of the logistics chain determines the amount of freight movement per unit of delivery. Vertical integration of process (the combination in one company of two or more stages of production normally operated by separate companies) reduces the number of links in the logistics chain. While this might have occurred in developed economies within the retail sectorâchain stores, for exampleâit is not true in the manufactur- ing sector, where supply lines have usually lengthened. Larger single-market regions have tended to centralize distribution, increasing transportation-related emis- sions while reducing inventories in a just-in-time world. The balance of carbon intensity across the logistics sup- ply chain versus the cost needs to be reinvestigated and future-proofed in relation to the circular economy if the climate change mitigation targets are to be approached. Freight Modalities The average carbon intensity of freight transportation modes varies enormously (2), as shown in Figure 2. Around the world there are opposing trends in changes between modalities for a wide variety of reasons (Fig- ure 3). For example, the European Commission has set ambitious targets to change from road to rail or water modes (11). The carbon cost of the investment and main- tenance needed to achieve these modal shifts and the net societal (economic) costs, such as for sustainability, are not always well understood. It is also important to note that rail is efficient in terms of GHGs per unit of freight moved but tends to emit more PM and NOx, which affects air quality and undermines other sustainability goals. Utilization of Facilities and Vehicles Improving utilization in all aspects normally results in a carbon intensity reduction with relatively few downsides. FIGURE 2 Average carbon intensity of freight transport modes (2, 4). Air (long haul)âfreighter Air (long haul)âbellyhold Medium-duty truck (diesel) Medium-duty truck (hybrid) Heavy-duty truck (diesel) Rail (diesel) Shipping (large container) Rail (electric) Shipping (bulk carrierâtanker) Grams CO2 per tonne-kilometer
87a p p e n d i x e : e x p l o r a t o r y t o p i c 4 Freight infrastructure and facilities are complex, with public and private players involved in their development and operation. There are often good practice guidelines on ways to increase utilization, however. For example, in the United States, practice suggests siting freight proj- ects to avoid greenfield development by enhancing exist- ing freight infrastructure or targeting infill development near compatible land uses. Other good practices are supporting local and regional efforts to improve trade facilities and corridors that achieve environmental goals and investing strategically to improve travel time reli- ability and achieve sustainable reduction in congestion at key bottlenecks on primary trade corridors. Expanding freight transport operating hours, to effectively reduce congestion during peak hours by rescheduling freight movement to off-peak hours, as done at the Port of Los Angeles and Long Beach, is another example of good practice. Business practices also have a positive role to play in improving utilization. A positive correlation between economic and carbon costs is often driven by commer- cial considerations, so that practices such as just-in-time delivery or facility collaboration have a net benefit on carbon intensity. Nevertheless, there is a need for these aspects to be better measured. There is always opportunity to improve vehicle uti- lization, which naturally reduces carbon intensity (12). However, quantifying underutilized capacity is difficult, as needed data are often not available. Here the possible benefits through improved information systems seem significant but remain to be determined and realized. Vehicle utilization may be improved not just through removing unused capacity but also by changing capac- ity discretization, that is, changing the size or shape of vehicles like trucks (13). Such changes can have many positive effects on carbon intensity, but the constraints FIGURE 3 Current and future projections for freight modality: (a) tonnage of U.S. shipments by mode and (b) multimodal nature of freight movement (7). (Source: Bureau of Transportation Statistics and Federal Highway Administration, U.S. Department of Transportation, Freight Analysis Framework, Version 3.6, 2015) (a) (b) Truck, 69.6% Other & unknown, 1.7% Pipeline, 7.7% Multiple modes, 7.7% Air, 0.1% Water, 4.0% Rail, 9.3% +35% +49% +32% +263%
88 d e c a r b o n i z i n g t r a n s p o r t f o r a s u s t a i n a b l e f u t u r e on infrastructure or logistics potential and the interac- tions across modalities, including emerging modes, need to be comprehensively understood. Energy Efficiency of Facilities and Vehicles While improvements in vehicle technology have signifi- cantly improved energy efficiency over the last decades, compromises with other emissions-related technolo- gies have not necessarily been made. Going forward, significant improvements in vehicle efficiency are still possible, even at ultralow emissions levels [see, for example, Dörr et al. (14)]. This is true particularly for on-road transportation as well as across other modes. The challenge is to encourage the commercial appli- cation of these fuel-saving technologies. The opera- tion of these vehicles is becoming more fuel efficient; in the future, digital technologies like electronic hori- zons that improve information in the vehicle (15), or automation that allows more efficient operation (16), will play an increasingly important role in improve- ments to vehicle fuel efficiency. Less headline grab- bing, but similarly important, are the improvements in the energy efficiency of logistic hubs (17). It is unclear whether emphasis for future research should be placed on further specific improvements in vehicle technology, or whether existing knowledge would be better trans- ferred across modes and facilities to realize the most effective reductions in GHG emissions. Carbon Basis of Energy Consumed Freight transportation is a fossil fuelâintensive opera- tion, and the repowering of logistics operations with low-carbon energy is at an early stage. The possibility of electrifying freight transport is mode dependent. The mass and volume energy density requirements at the vehicle level are the key determinants influenced by the local electrical energy supply mix. In the short term, the decarbonization of liquid fuels for long-distance trans- portation is the main option for aircraft, ships, freight trains, and heavy-duty commercial vehicles. The elec- trification of the highway road network, together with increasing levels of vehicle hybridization (electric), is one possible medium-term option. With each of these options, the carbon consequences of the infrastructure investment and the balance with other societal needs, such as for biofuels, need to be comprehensively understood. The move to non-carbon- based (liquid) fuels remains a possibility, especially in less energy-dense applications, but the balance of the optimal rate of change compared with the societal costs versus benefits must be determined. scenarios Scenario 1 A consumer orders five pairs of shoes online and requests delivery within a 2-hour window. The shoes arrive on time. The consumer keeps one pair of shoes and returns the others to the store. The following are the steps involved in the process (Figure 4): Step 1. Five pairs of shoes are produced and packaged at a factory in China and the shoes are loaded onto a shipping container with a forklift. Step 2. The container is transported to the nearest port (assume within 100 miles from the factory) by a large truck and placed on a container vessel by means of a variety of cargo-handling equipment (likely a crane, top handler, and yard truck). Step 3. The vessel transports the container to a port in California. Step 4. The container is unloaded from the vessel and placed on a large truck by means of a variety of cargo- handling equipment (likely a crane, top handler, and yard truck). Step 5. The large truck takes the container to a trans- loading facility (assume within 10 miles of the California port), where a forklift transfers the shoes into a large truck with a 53-foot trailer. Step 6. The large truck drives to a distribution center (assume within 100 miles of the transloading facility), and the shoes are unloaded with a forklift. Step 7. The shoes are placed into a medium-sized truck and the truck delivers the five pairs of shoes to the consumer (assume within 50 miles of the distribution center) within a 2-hour window. (Note: Step 7 occurs once the customer orders the shoes.) Step 8. The consumer drives, bikes, or walks the unselected four pairs to a local package delivery store (assume within 10 miles of the consumerâs home). Step 9. The four pairs of shoes are placed onto a medium-sized truck and taken to a distribution center (assume within 50 miles of the package delivery store). Step 10. The four pairs of shoes are unloaded and stored until ordered again. Scenario 2 The operation of the worldâs 700 million vehicles together with their manufacturing process contributes to about 5% to 6% of global GHG emissions. The produc- tion and sales of passenger vehicles are forecast to grow in most regional markets over the next two decades, with approximately 40% of the emissions associated with the supply chain of vehicle parts moving across an interna- tional border (Figure 5). While the life-cycle emissions per
89a p p e n d i x e : e x p l o r a t o r y t o p i c 4 FIGURE 4 Scenario 1: Online shopping. THE FOUR PAIRS OF SHOES ARE UNLOADED AND STORED, UNTIL ORDERED AGAIN. THE CONSUMER DRIVES THE UNSELECTED FOUR PAIRS TO A LOCAL PACKAGE DELIVERY STORE. THE LARGE TRUCK DRIVES TO A DISTRIBUTION CENTER AND THE SHOES ARE UNLOADED USING A FORKLIFT. THE CONTAINER IS UNLOADED FROM THE VESSEL AND PLACED ON A LARGE TRUCK USING A VARIETY OF CARGO HANDLING EQUIPMENT. THE CONTAINER IS TRANSPORTED TO THE NEAREST PORT BY A LARGE TRUCK AND PLACED ON A CONTAINER VESSEL USING A VARIETY OF CARGO HANDLING EQUIPMENT. A CONSUMER ORDERS FIVE PAIRS OF SHOES ONLINE AND REQUESTS DELIVERY WITHIN A TWO- HOUR WINDOW. THE SHOES ARRIVE ON TIME. THE CONSUMER KEEPS ONLY ONE PAIR OF SHOES. THE FOUR PAIRS OF SHOES ARE PLACED ONTO A MEDIUM- SIZED TRUCK AND TAKEN TO A DISTRIBUTION CENTER. THE SHOES ARE PLACED INTO A MEDIUM-SIZED TRUCK AND THE TRUCK DELIVERS THE FIVE PAIRS OF SHOES TO THE CONSUMER WITHIN A TWO-HOUR WINDOW. THE LARGE TRUCK TAKES THE CONTAINER TO A TRANSLOADING FACILITY WHERE A FORKLIFT TRANSFERS THE SHOES INTO A LARGE TRUCK WITH A 53â TRAILER. THE VESSEL TRANSPORTS THE CONTAINER TO A PORT IN CALIFORNIA. THE SHOES ARE LOADED ONTO A SHIPPING CONTAINER USING A FORKLIFT. FIVE PAIRS OF SHOES ARE PRODUCED & PACKAGED AT A FACTORY IN CHINA.
90 d e c a r b o n i z i n g t r a n s p o r t f o r a s u s t a i n a b l e f u t u r e car are projected to fall by around 50% in the medium term as a result of technology innovation, embodied emissions (rather than tailpipe emissions) will become the dominant source of life-cycle emissions within the next decade. These emissions drive significant differ- ences between production and consumption emissions in the automotive sector in many countries. The transpor- tation associated with the supply chain of vehicle parts in the vehicle manufacturing process contributes to CO2 emissions. Whereas significant reductions in embodied emissions (up to 50% of CO2e) may be possible through the optimization of current production processes, the benefit of improved transportation and logistics within the supply chain and production process has probably yet to be quantified (18). Examples of the supply chain for the primary components of a Tesla Electric Sedan for delivery in the continental United States are as follows (Figure 6): Step 1. Aluminum sheet for chassis and body panels is shipped from Japan to a south coast port. Step 2. Rolls are loaded onto trucks by crane for transfer to off-dock rail (~15 miles). Step 3. Rolls are transported by rail and truck to the Fremont, California, facility (~400 miles). Step 4. Multiple materials and interior components arrive by ship at Oakland, California, and are trans- ported by truck to the Freemont facility (~20 miles). Step 5. Battery and cathode materials are shipped from a proprietary location in Asia to a south coast port. Step 6. Battery cathode and materials are loaded onto a train and shipped to a battery manufacturing facility in Nevada (~500 miles). Step 7. Batteries manufactured in Nevada are shipped by truck to Fremont (240 miles). Step 8. Assembled vehicles are loaded onto trucks for direct delivery, including east coast destinations (dis- tance varies). conclusion and framing Questions The logistics and freight transportation share of global GHGs is likely to rise substantially in the coming decades, and the level of decarbonization needed for this mode to reach its global climate change mitigation targets seems almost impossible. However, mutually reinforcing opportunities to cut the carbon intensity of long-distance freight transportation are appearing; the realization of these opportunities should set governments and busi- nesses on a path to low-carbon logistics by 2050. The following questions may help prioritize and add to these opportunities during conversation within the Fifth EU-U.S. Transportation Research Symposium, Decarbonizing Transport for a Sustainable Future: Miti- gating Impacts of the Changing Climate: FIGURE 5 Major flows of emissions between the European Union and the United States that are embodied in the global auto sector (18). 115 70 65 60 55 50 45 40 35 30 25 20 15 10 5 0 112MtCO2 Other 10. Rest of Asia to Europe 9. North America to Europe 8. China to rest of Asia 7. Japan to rest of Asia 6. Rest of Asia to North America 3. Europe to North America 2. China to North America 1. Japan to North America 5. Japan to Eurpe 4. China to Europe Note 1: Includes Scope 1 emissions (direct), Scope 2 emissions (allocated electricity) and Scope 3 emissions (inputs to automotive manufacture). Note 2: Includes Scope 1âScope 3 emissions generated within the country of automotive production only (i.e., excludes flows between countries of inputs to automotive manufacture). Note 3: Exludes intra-regional flows. Source: Carbon Trust Analysis; CICERO/SEI/CMU GTAP7 EEBT (2004) model. 37% 4% 4% 4% 5% 5% 6% 6% 7% 11% 12%
91a p p e n d i x e : e x p l o r a t o r y t o p i c 4 FIGURE 6 Scenario 2: Manufacturing of Tesla electric vehicles. ALUMINUM SHEET FOR CHASSIS AND BODY PANELS IS SHIPPED FROM JAPAN TO SOUTH COAST PORT. ROLLS ARE TRANSPORTED BY RAIL AND TRUCK TO FREMONT FACILITY. MATERIALS ARE LOADED ONTO A TRUCK AND ARE TRANSPORTED TO FREEMENT FACILITY. BATTERY CATHODE AND MATERIALS ARE LOADED ONTO A TRAIN A SHIPPED TO BATTERY MANUFACTURING FACILITY IN NEVADA. ASSEMBLED VEHICLES ARE LOADED ONTO TRUCKS FOR DIRECT DELIVERY ACROSS THE UNITED STATES. TESLA IS BUILDING ONE OF ITS ELECTRIC VEHICLES. IT RECEIVES MATERIALS FROM DIFFERENT PARTS OF THE WORLD AND ASSEMBLES THE VEHICLE AT ITS FREMONT FACILITY. THE NEWLY MADE CARS ARE DISTRIBUTED TO CUSTOMERS ACROSS THE USA. ROLLS ARE LOADED ONTO TRUCKS BY CRANE FOR TRANSFER TO OFF-DOCK RAIL. MULTIPLE MATERIALS AND INTERIOR COMPONENTS ARRIVE BY SHIP TO THE PORT OF OAKLAND. BATTERY AND CATHODE MATERIALS ARE SHIPPED FROM PROPRIETARY LOCATION IN ASIA TO SOUTH COAST PORT. BATTERIES MANUFACTURED IN NEVADA ARE SHIPPED BY TRUCK TO FREEMONT.
92 d e c a r b o n i z i n g t r a n s p o r t f o r a s u s t a i n a b l e f u t u r e 1. Are there any additional trends in the decarboniza- tion of freight transportation that will affect the reduc- tion of emissions to 80% below 1990 levels by 2050? â How do other global trends (migration, settle- ment, technology) interact with the trends in the decarbonization of freight transportation? â Are there opportunities when these trends con- verge? For example, will it be more difficult to decar- bonize freight if more people shop online? â What possible disrupters might there be within this time frame? 2. Are there any additional policy options to address challenges or foster opportunities to decarbonize freight transportation over the coming years? What opportuni- ties to decarbonize freight have been missed in the past, and what policy options could have been adopted to avoid that? 3. What other ideas should be considered in the stra- tegic planning framework for decarbonization pathways that will advance the freight transportation system over the next 30 years? What other factors have hindered the decarbonization of the freight system? 4. What are the correct measures for evaluating the decarbonization of the logistics and long-distance trans- portation of freight, and what further research is needed to enable these measures to be used successfully across the complex stakeholder landscape? 5. Given that infrastructure has a lead time, how can freight infrastructure solutions be developed that do not use technology that will be obsolete by the time construc- tion is completed? 6. What are possible social or political problems that could arise from decarbonizing freight? references 1. Guérin, E., C. Mas, and H. Waismans (eds.). Pathways to Deep Decarbonization. Sustainable Development Solu- tions Network and Institute for Sustainable Development and International Relations, Paris, 2014. 2. McKinnon, A. Freight Transport in a Low-Carbon World: Assessing Opportunities for Cutting Emissions. TR News, No. 306, NovemberâDecember, 2016, pp. 8â15. http:// www.trb.org/Publications/Blurbs/175579.aspx. 3. ITF Transport Outlook 2015. International Transport Forum, Organisation for Economic Co-operation and Development, Paris, 2015. 4. Chapter 8: Transport. In Climate Change 2014: Mitiga- tion of Climate Change. Intergovernmental Panel on Cli- mate Change, Geneva, Switzerland, 2014. 5. United Nations. 21st Conference of the Parties (COP) to the United Nations Framework Convention on Climate Change. http://www.un.org/sustainabledevelopment/ cop21/. 6. EU Energy, Transport and GHG Emissions: Trends to 2050âReference Scenario 2013. European Commission, Brussels, 2014. 7. National Freight Strategic Plan. Draft for public comment. U.S. Department of Transportation. https://www.trans portation.gov/sites/dot.gov/files/docs/DRAFT_NFSP_for_ Public_Comment_508_10%2015%2015%20v1.pdf. 8. Sustainable Freight: Pathways to Zero and Near-Zero Emissions. Discussion Document. California Air Resources Board, Sacramento, USA. https://www.arb.ca.gov/gmp/ sfti/sustainable-freight-pathways-to-zero-and-near-zero- emissions-discussion-document.pdf. 9. McKinnon, A. C. Options for Reducing Logistics-Related Emissions from Global Value Chains. European Univer- sity Institute, Florence, Italy, 2014. https://papers.ssrn. com/sol3/papers.cfm?abstract_id=2422406. 10. Smith, A., P. Watkiss, G. Tweddle, A. McKinnon, M. Browne, A. Hung, C. Trevelen, C. Nash and S. Cross. The Validity of Food Miles and an Indicator of Sustainable Development. Department of the Environment, Food and Rural Affairs, London, July, 2005. 11. Roadmap to a Single European Transport Area: Towards a Competitive and Resource-Efficient Transport System. White paper. European Commission, Brussels, Belgium, 2011. 12. A Truly Integrated Transport System for Sustainable and Efficient Logistics. SETRIS Project, Brussels, Belgium, 2017. http://www.ectri.org/Documents/2017-03-13_ SETRIS_Truly%20integrated%20Final%20Edition%20 (WEB).pdf. 13. Transformers Project. http://www.transformers-project. eu/. 14. Dörr, H., P. Prenningner, A. Huss, B. Hörl, V. Marsch, Y. Toifl, C. Berkowitsch, M. Wanjek, A. Romstorfer, and S. Bukold. Eco-optimisation of Goods Supply by Road Transport: From Logistic Requirements via Freight Trans- port Cycles to Efficiency-Maximised Vehicle Powertrains. Transportation Research Procedia, Vol. 14, 2016, 2785â 2794. http://www.sciencedirect.com/science/article/pii/ S2352146516304823. 15. IMPERIUM Project. http://cordis.europa.eu/project/ rcn/204189_en.html. 16. SARTRE Project. http://www.roadtraffic-technology. com/projects/the-sartre-project/. 17. Rotterdam Energy Port. Fact Sheet. https://www.port ofrotterdam.com/sites/default/files/Factsheet-Rotterdam- Energy-Port.pdf. 18. International Carbon Flows. Automotive. Carbon Trust, London, May, 2011. https://www.carbontrust.com/ media/38401/ctc792-international-carbon-flows-automo tive.pdf.
93 APPENDIX F PROGRAM decarBonizing transport for a sustainaBle future: mitigating impacts of the changing climate Fifth EU-U.S. Transportation Research Symposium Organized by the European Commission Transportation Research Board May 17â18, 2017 National Academies of Sciences, Engineering, and Medicine Building Washington, D.C. Wednesday, may 17, 2017 7:30 a.m. Registration and Breakfast 8:30 a.m. Welcome and Opening Remarks Neil J. Pedersen, Transportation Research Board Robert Missen, Directorate-General for Mobility and Transport, European Commission Purpose and Scope for the Fifth EU-U.S. Symposium: Decarbonizing Transport for a Sustainable Future Kate White, California State Transportation Agency (standing in for Steven S. Cliff, California Air Resources Board) Simon Edwards, Ricardo 9:00 a.m. Opening Keynote Address Transport Emissions After the 21st Conference of the Parties Axel Friedrich, International Council on Clean Transportation 9:30 a.m. Presentation: White Paper Decarbonizing Transport for a Sustainable Future: Mitigating Impacts of the Changing Climate David L. Greene, University of Tennessee, Knoxville Graham Parkhurst, University of the West of England, Bristol 10:30 a.m. Morning Refreshment Break 10:45 a.m. Setting the Scene: Why We Cannot Wait! Seleta Reynolds, City of Los Angeles Department of Transportation Helle Søholt, Gehl
94 d e c a r b o n i z i n g t r a n s p o r t f o r a s u s t a i n a b l e f u t u r e 11:30 a.m. Review of the Two Exploratory Topics for Day 1 Exploratory Topic 1 Breaking Silos and Human Cocreation on Multiple Levels: The Key to Transforming the Current Sociotechnical Transport System Regime? Daniel Kreeger, Association of Climate Change Officers Malin Andersson, Urban Transport Administration, City of Gothenburg Exploratory Topic 2 The Influence of Policy Environment Factors on Climate Change Mitigation Strategies in the Transport Sector Timothy Sexton, Minnesota Department of Transportation Oliver Lah, Wuppertal Institute for Climate, Environment, and Energy 12:30 p.m. Networking Lunch 1:30 p.m. Working Group Discussion on Exploratory Topic 1 Breaking Silos and Human Cocreation on Multiple Levels: The Key to Transforming the Current Sociotechnical Transport System Regime? 3:00 p.m. Afternoon Refreshment Break 3:30 p.m. Working Group Discussion on Exploratory Topic 2 The Influence of Policy Environment Factors on Climate Change Mitigation Strategies in the Transport Sector 5:00 p.m. Wrap-up for Day 1 and Adjourn 5:30 p.m. Mix and Mingle: Networking Reception thursday, may 18, 2017 7:30 a.m. Breakfast 8:00 a.m. Review of the Two Exploratory Topics for Day 2 Exploratory Topic 3 Megaregions: Policy, Research, and Practice Ray F. Toll, U.S. Navy (ret.), and Old Dominion University Delia Dimitriu, Manchester Metropolitan University Exploratory Topic 4 Decarbonizing the Logistics and Long-Distance Transportation of Freight Kate White, California State Transportation Agency Simon Edwards, Ricardo 8:45 a.m. Working Group Discussion on Exploratory Topic 3 Megaregions: Policy, Research, and Practice 10:30 a.m. Morning Refreshment Break 11:00 a.m. Working Group Discussion of Exploratory Topic 4 Decarbonizing the Logistics and Long-Distance Transportation of Freight 12:30 p.m. Networking Lunch
95A P P E N D I X F : P R O G R A M 1:30 p.m. Report-Out on the Working Group Discussions Simon Edwards, Ricardo, Facilitator 2:30 p.m. Concluding Keynote Presentation Decarbonizing Transport: To Life in a Sustainable Worldâ What Did We Learn, What Can We Do? José Viegas, International Transport Forum 3:15 p.m. Last-Chance Assertions Timothy Sexton, Minnesota Department of Transportation, Facilitator 4:00 p.m. Adjourn
96 APPENDIX G Symposium Attendees Michele Acciaro Kühne Logistics University Hamburg, Germany William Anderson Transportation Research Board Washington, D.C., USA Malin Andersson City of Gothenburg Gothenburg, Sweden William Bird European Commission Brussels, Belgium Alasdair Cain U.S. Department of Transportation Washington, D.C., USA Lia Cattaneo U.S. Department of Transportation Washington, D.C., USA Robin Chase U.S. Department of Transportation Washington, D.C., USA Peter Chipman U.S. Department of Transportation Washington, D.C., USA Steven S. Cliff California Air Resources Board Sacramento, California, USA Erin Cooper World Resources Institute Washington, D.C., USA Paula Coussy IFP Energies Nouvelles Rueil-Malmaison Cedex, France John Davies Federal Highway Administration Washington, D.C., USA Thomas Day U.S. Postal Service Washington, D.C., USA Laura Delgado Consorcio Regional de Transportes de Madrid Madrid, Spain Delia Dimitriu Manchester Metropolitan University Manchester, U.K. Jos Dings Tesla Brussels, Belgium Mario Dogliani SEA Europe Brussels, Belgium Phillip Dube California Air Resources Board Sacramento, California, USA Amanda Eaken National Resources Defense Council Washington, D.C., USA Simon Edwards Ricardo Shoreham-by-Sea, UK Debra Elston U.S. Department of Transportation Washington, D.C., USA Axel Friedrich International Council on Clean Transportation Washington, D.C., USA
97a p p e n d i x G : s y m p o s i u m a t t e n d e e s Judy Gates Maine Department of Transportation Augusta, Maine, USA John German International Council on Clean Transportation Washington, D.C., USA Brittney Gick Transportation Research Board Washington, D.C., USA David Greene University of Tennessee, Knoxville Knoxville, Tennessee, USA Debbie Griner City of Fort Lauderdale Florida, USA Umberto Guida International Association of Public Transport Brussels, Belgium Heather Hamje CONCAWE Brussels, Belgium Shawn Johnson U.S. Department of Transportation Washington, D.C., USA Jesse Keenan Harvard University Cambridge, Massachusetts, USA Allie Kelly Ray C. Anderson Foundation Atlanta, Georgia, USA Malgorzata Kirchner Institute of Logistics and Warehousing Pozna, Poland Dan Kreeger Association of Climate Change Officers Washington, D.C., USA Oliver Lah Wuppertal Institute for Climate, Environment, and Energy Wuppertal, Germany Jon Lamonte Transport for Greater Manchester Manchester, UK Nathan Loftice BNSF Railway DallasâFort Worth, Texas, USA Cristina Marolda European Commission Brussels, Belgium Patrick Mercier-Handisyde European Commission Brussels, Belgium Robert Missen European Commission Brussels, Belgium Patrick Oliva Michelin Group Clermont-Ferrand, France Graham Parkhurst University of the West of England, Bristol, UK Neil Pedersen Transportation Research Board Washington, D.C., USA Sophie Punte Smart Freight Centre Amsterdam, Netherlands Seleta Reynolds City of Los Angeles Department of Transportation Los Angeles, California, USA Nancy Ryan Energy + Environment Economists (E3) San Francisco, California, USA Zisis Samaras Aristotle University of Thessaloniki Thessaloniki, Greece Jessica Sandsröm Volvo Group Gothenburg, Sweden
98 d e c a r b o n i z i n g t r a n s p o r t f o r a s u s t a i n a b l e f u t u r e Wolfgang Schade M-Five GmbH Mobility Futures, Innovation, Economics Karlsruhe, Germany Tim Sexton Minnesota Department of Transportation Saint Paul, Minnesota, USA Brendan Shane C40 Cities New York, New York, USA Karl Simon Environmental Protection Agency Washington, D.C., USA Lauren Skiver SunLine Transit Agency Thousand Palms, California, USA Frank Smit European Commission Brussels, Belgium Helle Søholt Gehl Architects Copenhagen, Denmark Henriette Spyra Federal Ministry for Transport, Innovation, and Technology Vienna, Austria Eric Sundquist University of WisconsinâMadison Madison, Wisconsin, USA Michael Tamor Ford Motor Company Detroit, Michigan Ray Toll Old Dominion University Norfolk, Virginia, USA Shin-pei Tsay Gehl Institute New York, New York, USA Karen Vancluysen POLIS Brussels, Belgium José Viegas International Transport Forum Organisation for Economic Co-operation and Development Paris, France Kate White California State Transportation Agency Sacramento, California, USA Kevin Womack U.S. Department of Transportation Washington, D.C., USA Kate Zyla Georgetown Climate Center Washington, D.C., USA
