
4
How the Labor Market, Family Structure, and Government Programs Affect Child Poverty
In response to the second element of the committee’s statement of task and to provide guidance for the committee’s deliberations on new initiatives that can reduce child poverty, in this chapter, we discuss how demographic factors, the labor market and economy, and major government assistance programs affect all child poverty in the United States. We begin with a brief review of the role that demographic factors, particularly single-parent family structure, play in child poverty, followed by an analysis of employment-related factors. We then focus on a key element of our statement of task: the structure and role of current federal government assistance programs as they affect child poverty. We close the chapter with a comparison of the poverty-reducing impact of assistance programs in the United States and in the four English-speaking countries whose selection was discussed in Chapter 2: Australia, Canada, Ireland, and the United Kingdom.
FORCES THAT SHAPE CHILD POVERTY
Three broad sets of forces affect child poverty: demographics, the economy and its labor markets, and government policy. Demographic factors include parental age, education, race, and ethnicity; number of children in the family; and family structure, such as single or married parent. For example, older and more educated parents generally command higher wages, leading to lower levels of family poverty. The presence of two parents in the household would be expected to reduce poverty because of higher earnings and the possibility of specialization as one partner focuses
on work and the other on family responsibilities (Becker, 1981). Additionally, whether it is headed by two parents or one, a household with fewer children is likely to experience less poverty because of the higher ratio of potential adult earners to children as well as the fact that the poverty line is lower for a smaller family. The patterns of child poverty across demographic groups shown in Chapter 2 are consistent with these expectations.
Labor market factors include the amount of parental work and the wages earned for every hour worked. Employment and earnings are influenced by secular forces such as macroeconomic growth, labor market forces such as technological change and globalization, and labor market factors such as minimum wage levels and unionization, as well as by cyclical forces such as unemployment.
The third factor is the primary focus of this chapter: government policies, such as tax and transfer programs. These three broad sets of factors are not independent of one another. A change in tax or transfer policy, for example, can affect work patterns and decisions about family structure.
To frame the discussion of the role of these three broad factors, Figure 4-1 illustrates how child poverty rates have evolved over the last five decades (1967 to 2016). The lower line in the figure reproduces the Supplemental Poverty Measure (SPM)-based poverty trend data shown in Figure 2-8. Periods of economic downturn are shown as shaded columns.1 As discussed in Chapter 2, because some Transfer Income Model, Version 3 (TRIM3) adjustments are unavailable for this entire historical period, the SPM trend in Figure 4-1 (and throughout this chapter) is not adjusted for underreporting of government programs.2
The upper trend line in Figure 4-1 illustrates what SPM-based child poverty would have been if market income (but no other source of income) were counted as family resources.3 Market income includes only earnings and income from savings and investments; it does not include any of the government tax and transfers that are included in the SPM resource measure. Importantly, these are “all else equal” poverty rate estimates; these
___________________
1 Recession dates are from the National Bureau of Economic Research at http://www.nber.org/cycles.html.
2 Consistent underreporting adjustments are not possible because TRIM3 data are available only for years 2012, 2014, and 2015. Consequently, the rates reported here are somewhat higher than they would be after such adjustments. The figures are drawn from original analyses commissioned by the committee and conducted by Christopher Wimer (2017, October). The SPM threshold is anchored in 2012 living standards and adjusted back to 1967 using the Consumer Price Index. The Census SPM threshold is not available for years prior to 2009.
3 Market income was calculated by taking total SPM resources and removing total taxes (tax credits and taxes paid), SNAP, WIC, School Lunch, LIHEAP, housing subsidies, TANF, SSI, Social Security, Unemployment Insurance, and a few smaller government insurance payments such as veterans’ assistance. For more on definitions of income, see Gornick and Smeeding (2018).
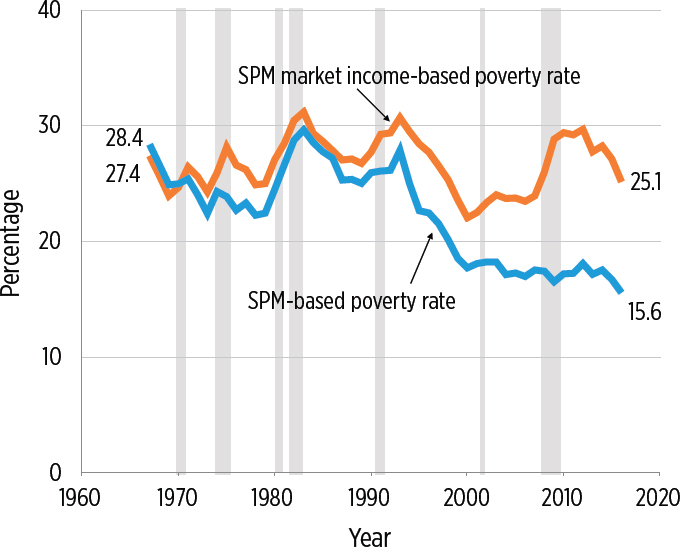
NOTES: The SPM poverty measure is anchored in 2012 living standards, adjusted back to 1967 using the CPI, and does not adjust for underreporting. Shaded areas indicate recession periods as determined by the NBER Business Cycles Dating Committee. SPM market income-based poverty rate includes labor market income but no other sources of income in its measure of family resources. SPM = Supplemental Poverty Measure, CPI = Consumer Price Index, NBER = National Bureau of Economic Research.
SOURCE: Original analyses commissioned by the committee from Christopher Wimer (2017).
data assume no change in market income (e.g., no change in labor market behavior) in response to the unavailability of tax and transfer income. As we discuss in greater detail below, eliminating pro-work government policies such as the Earned Income Tax Credit (EITC) could reduce market income and thereby increase market-based income poverty, while eliminating means-tested transfers such as food stamps (SNAP) could have the opposite effect.
Figure 4-1 shows that poverty is strongly related to the economy and business cycles, falling during periods of economic growth and rising during recessions and often for another year or two after the official end of a downturn. Many studies document this inverse relationship between
unemployment rates and poverty.4 It is clear from the trends shown in Figure 4-1 that market-income poverty is more cyclical than SPM poverty.5 Indeed, Figure 4-1 reveals that the Great Recession led to a 3.4 percentage point increase in market-income poverty (between 2008 and 2010), while SPM poverty fell slightly (by 0.2 percentage points). As discussed later in this chapter, this suggests that the tax and transfer programs included in SPM calculations were very successful at mitigating the negative impacts of the economic cycle on child poverty (Bitler and Hoynes, 2010; Bitler, Hoynes and Kuka, 2017; Blank, 1989; Blank and Blinder, 1986; Cutler and Katz, 1991; Freeman, 2001; Gunderson and Ziliak, 2004; Hoynes, Page, and Stevens, 2006; Meyer and Sullivan, 2011).
More generally, Figure 4-1 shows that there is no clear secular, long-term trend in market-income-based child poverty: Child poverty rates based solely on market income have improved only slightly over the 50-year period, falling from 27.4 percent in 1967 to 25.1 percent in 2016. This lack of improvement is particularly notable given that general living standards, as indicated by per-capita Gross Domestic Produce (GDP), more than doubled between the late 1960s and today.6 Holding other factors constant, market-income-based poverty rates should have fallen substantially if the improved economy had indeed boosted the financial situation of people living in poverty.
The lack of long-term declines in market-based poverty also implies that policy changes since the 1990s that were aimed at reducing poverty by increasing work and earnings—including the welfare reform of the 1990s, the EITC, and expanded access to child care, to name three changes—have not reduced child poverty rates, on net and in combination with changes in the economy. Disentangling the effects of these policy changes from changes in the economy over the period is difficult. To take one of these policy changes as an example, what evidence we have on 1990s welfare reform shows that it did have some short-term effects in reducing poverty rates and thus made a contribution to the decline in market-based poverty in the second half of the 1990s, as shown in Figure 4-1 (see Chapter 7 for a discussion of this evidence). However, the lower SPM child poverty rate in 2015 compared to that in 1996, for example, is almost entirely due to an increase in tax credits and transfers, not due to an increase in work and earnings.
___________________
4Bitler and Hoynes (2010, 2015); Bitler, Hoynes, and Kuka (2017); Blank (1989, 1993); Blank and Blinder (1986); Blank and Card (1993); Cutler and Katz (1991); Freeman (2001); Gunderson and Ziliak (2004); Hoynes, Page, and Stevens (2006); Meyer and Sullivan (2011).
5 Recent work by Bitler, Hoynes, and Kuka (2017) documents this using data from 2000 to 2014.
6 See data provided by the Federal Reserve Bank of St. Louis, at https://fred.stlouisfed.org/tags/series?t=gdp%3Bper+capita.
CONCLUSION 4-1: Despite economic growth over the past half century, child poverty rates calculated using only labor market income have remained high—ranging between 22 and 32 percent.
Many aspects of children’s demographic circumstances have undergone dramatic changes in the past four or five decades (Social Capital Project, 2017). For example, among children whose mothers had lower levels of education, the share of those living with a married parent has declined sharply (see Figure 4-2). Trends in women’s educational attainment (Appendix D, Figure D4-2) and fertility (Appendix D, Figure D4-3) show that there has been a steady increase in attainment since 1962 as well as a steady decrease in fertility among women overall since 1976. Linking some of these demographic changes to child poverty, we would expect the increasing incidence of single parenthood to push up rates of child poverty,
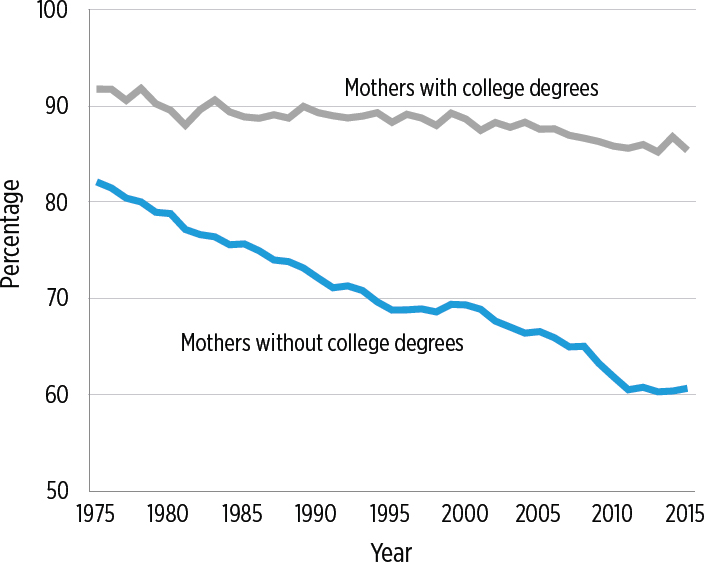
NOTES: Calculations based on Current Population Survey Annual Social and Economic Supplement 1976–2016. Data are restricted to mothers ages 25–54.
SOURCE: Adapted from Hoynes and Schanzenbach (2018).
while the increase in maternal education and the reduction in the number of children should lower them.7
There have also been important changes in the parental connections to the labor market. Large numbers of both single and married mothers have joined the workforce since 1975 (see Figure 4-3). The increase in employment among single mothers was particularly dramatic in the 1990s, and was accompanied by a rise in the amount of the EITC and in other work supports in the wake of welfare reform.8 Male employment, on the other hand, trended downward over this period (Appendix D, Figure D4-1). The increase in employment among single parents, particularly between the early 1990s and 2000, would also be expected to reduce child poverty over that period.
A number of studies have used a “what-if” approach to distinguish between the roles of demographic factors and the labor market in explaining trends in the Official Poverty Measure (OPM). Using poverty rates across different subgroups, such as married/single-parent families or working/nonworking parents, these decomposition studies calculate how overall child poverty rates would have changed if each group had experienced the observed poverty trend but the overall composition of the population (e.g., the share of children living with a single parent) had not changed. This approach is distinct from asking “does family structure matter” at any given point in time, and instead seeks to understand which factors explain changes in poverty over time.
Decomposition studies based on data from before the mid-1990s generally find that changes in family structure, most notably the increase in single parenthood, explain a large share of the observed increase in child (official) poverty between the 1970s and the mid-1990s (Danziger and Gottschalk, 1995; Lerman, 1996). After the employment of single mothers began to rise in the early 1990s, however, their families’ exposure to labor market fluctuations began to increase. The decomposition studies applied to poverty trends beginning in the 1990s have found that changes in employment, rather than in family structure, are the most important factor in explaining recent (official) poverty trends (Cancian and Reed, 2009; Chen and Corak, 2008; Lichter and Crowley, 2004; Nichols, 2013). This does not mean that family structure has no influence on child poverty, but rather that changes in family structure do not explain changes in child poverty during this later time period.
The shifting influence of family structure versus employment is evident in Nichols’ (2013) analyses of data spanning the period from 1975
___________________
7 Because of rising educational attainment among women (Appendix D, Figure 4-2) the composition of women in lower-education groups is changing over time. This should be kept in mind when examining trends for various low-education groups over time as in Figure 4-2.
8 Since 2000, the labor force participation of single mothers has been nearly identical to that of childless women (Black, Schanzenbach, and Breitwieser, 2017; not shown in Figure 4-3).
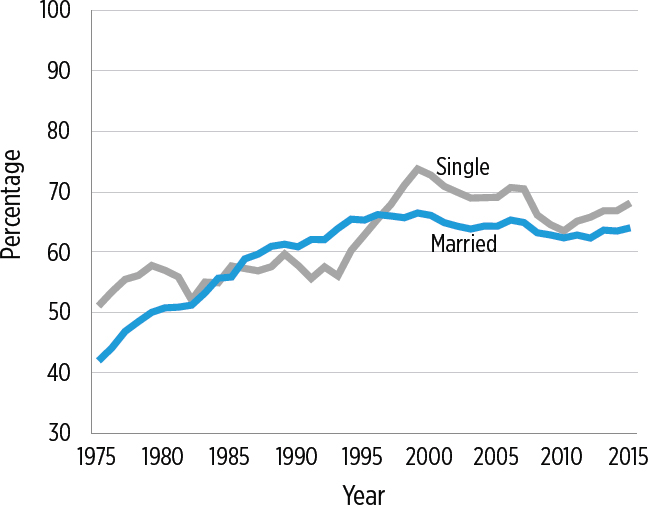
NOTES: Calculations based on the Current Population Survey Annual Social and Economic Supplement 1976-2016. Data are restricted to mothers ages 25 to 54.
SOURCE: Adapted from Hoynes and Schanzenbach (2018).
to 2011. Nichols (2013) finds that a large fraction of the trend in child (official) poverty between 1975 and 1993 is explained by changes in family structure (single parenthood, number of family members, multigenerational households) and age, while trends in child poverty between 1993 and 2011 are largely explained by increases in employment. This finding holds true for different subgroups of children, including White, Black, and Hispanic children (Appendix D, Figure D4-4). For example, Nichols (2013) shows that for White children, changes in family structure (and age of children) account for 85 percent of the actual change in child poverty between 1975 and 1993, and that changes in employment account for over 70 percent of the change between 1993 and 2011. Among Black children, the role of family structure was particularly important in the early period, explaining more than all of the actual increase in child poverty between 1975 and 1993.9
___________________
9Baker (2015) reaches a similar conclusion using a different approach, one that focuses on the changing associations between work, marriage, and poverty over time. Her work shows that the magnitude of the negative association between marriage and child poverty has declined, while the positive association between work and child poverty has increased.
CONCLUSION 4-2: The decline in two-parent family structure is the single biggest factor associated with the increase in child (official) poverty between the mid-1970s and the early 1990s. However, child poverty has fallen since the early 1990s, despite continuing increases in single parenthood. This more recent decline in child poverty is most strongly associated with increases in maternal employment.
To further explore the role of the labor market, the economy, and employment in explaining trends in poverty, Chen and Corak (2008) undertake a decomposition to examine the comparative roles of employment and earnings. They find that between 1991 and 2000, labor market factors reduced poverty. More than one-half of that reduction stemmed from the mother’s annual earnings (conditional on work), with the remainder of the effect split between the employment status of the father (20%), the employment status of the mother (17%), and the annual earnings of the father (less than 10%). That is, almost 70 percent of the reduction in poverty owing to labor market effects during the 1991–2000 period resulted from the increased employment and earnings of mothers.
Figure 4-4 provides a summary of the broader trends in earnings, plotting real median weekly wages between 1963 and 2012 for women working full time throughout the year, by education level (Autor, 2014). The 1963 earnings of each group serve as the baseline as the graph tracks the ratio of earnings in a given year relative to 1963 earnings. Women with no more than a high school education experienced much slower wage growth than women with more schooling. (The inflation-adjusted earnings of men with low levels of schooling, as shown in Appendix D, Figure D4-5, were actually lower at the end of the period than at the beginning.)
Beginning in the early 1980s, the wage patterns fan out and reflect increasing wage inequality across education levels.10 In the 5 years following 2012 (after the end of the series in Figure 4-4), inflation-adjusted wages started to increase, showing real gains for the lowest quintile of workers. This growth resulted from both continued recovery from the recession and increases in state minimum wages (Shambaugh et al., 2017). The main forces in the economy that have contributed to wage stagnation for low-skilled workers and higher wages as skills increase include skill-biased technological change (Juhn, Murphy, and Pierce, 1993; Katz and Murphy, 1992), globalization (Autor, Dorn, and Hanson, 2013), the decline in
___________________
10 This fanning out is even more dramatic if we include weekly wages for those with education beyond a college degree (Autor, 2014). Note, however, that the share of workers with a high school degree or less has declined over this time period, which may affect the composition of the group with low levels of education over time.
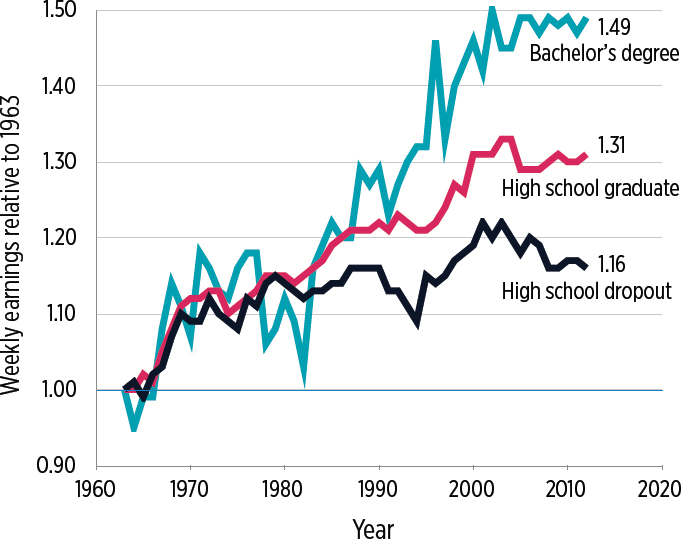
NOTES: Data for other education levels and for men are contained in the chapter appendix. Conversion to real 2012 dollars using CPI-U-Research Series.
SOURCE: Autor (2014).
unions (Farber et al., 2018), and the decline in the real value of the federal minimum wage (Autor, Manning, and Smith, 2016).
CONCLUSION 4-3: The earnings of more highly skilled workers have grown substantially in the past 50 years. By contrast, the earnings of men with a high school education or less have stagnated or declined since the early 1970s, and the earnings of women with a high school education or less have stagnated since 2000. Because the large majority of poor parents have completed less schooling than higher-income parents, this stagnation has meant that market income has not reduced child poverty over this period as much as it might otherwise have. Moreover, the stagnation of annual earnings for lower-skilled mothers has been among the most important factors in slowing the decline in market-based child poverty over the last two decades.
THE CHANGING ROLE OF GOVERNMENT TAXES AND TRANSFERS
The divergence between the 50-year child poverty trend based on a market-income measure and that based on the SPM measure, which is illustrated in Figure 4-1, underscores the increasing importance of government taxes and transfers in reducing child poverty. In this section, we detail the changing role of such taxes and transfers in reducing poverty. The section begins with a brief description of trends in federal spending on children and a review of major changes in policy during this period. This is followed by an analysis of the effects of government tax and transfer policy, based on an examination of the difference between trends in market-income child poverty rates and SPM child poverty rates.
Drawing on Isaacs et al. (2018), Figure 4-5 shows the trend between 1960 and 2017 in inflation-adjusted federal spending on programs that benefit children, most of which are counted as income in the SPM-based poverty measure (see also Appendix D, Table 4-1).11 The eight-fold growth in real spending between 1960 and 2010 is striking, and it is many times larger than the 15 percent increase in the number of children in the population.
It is little wonder that the trend in child SPM poverty, which is based on a conception of resources that subtracts taxes paid, adds tax credits such as the EITC and includes income from transfer programs such as the Supplemental Nutrition Assistance Program (SNAP) depicted in Figure 4-1, diverges steadily from the market-income-only poverty trend, especially after 1980. In 1960, spending was largely limited to cash assistance from the Aid to Families with Dependent Children (AFDC) and Social Security programs. The next five decades saw the introduction or expansion of major programs benefiting children. Food stamps (now called SNAP) and Medicaid—two major in-kind benefit programs serving children in low-income families—were rolled out in the 1960s and 1970s. Supplemental Security Income (SSI) was also introduced during this period; originally, the program provided cash benefits for low-income disabled and elderly individuals. Now the program also serves children meeting disability requirements.
Transfer programs changed markedly in the 1990s with the expansion of the EITC as well as federal welfare reform (in 1996), which eliminated the entitlement of cash welfare. The Child Tax Credit was introduced in
___________________
11 This includes cash transfers, nutrition programs (SNAP, WIC, and child nutrition programs), public housing benefits, tax credits, and other child-related tax benefits. Medicaid spending on children is also included in Figure 4-5 but is not counted in calculating SPM-based poverty.
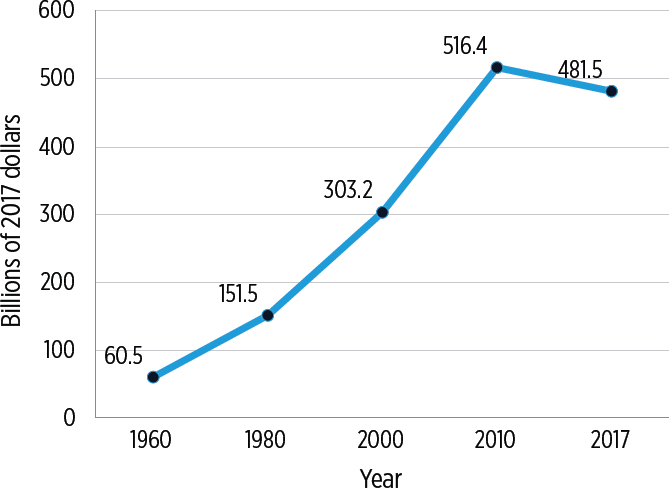
NOTE: In billions of 2017 dollars.
SOURCE: Isaacs et al. (2018, Table 3).
1997 and then expanded in the first decade of the 2000s.12 The spending decline between 2010 and 2016 was largely due to the decrease in transfers during the economic recovery that followed the Great Recession, coupled with the fact that no major new program initiatives directed at children were introduced or expanded during this period.
A comparison of Figure 4-1 and Figure 4-5 reveals that secular SPM poverty trends track expenditure patterns quite closely. In the late 1960s, the net effect of government transfers and the tax system was to increase poverty—on balance, the poor paid more in taxes than they received in benefits. In later decades, however, the benefits paid through the tax system have continued to grow; for example, between 1980 and 2000 there was a 10-fold increase in the inflation-adjusted value of refundable tax credits (see Appendix D, Table 4-1). Those benefits, combined with benefits received
___________________
12 Spending on Medicaid (for children) and the State Child Health Insurance Program expanded dramatically between 1980 and 2000 as a result of federal and state legislation (Gruber, 2003). But these expansions affect SPM poverty only through their effects on out-of-pocket medical expenses. In Chapter 7 we discuss possible changes to the SPM to better capture the resources provided through public insurance.
through income-tested programs, have been the major factor driving rates of SPM-based poverty as low as they are today.
While market-income poverty rates fell by 8 percentage points between 1993 and 2000, it is also apparent that the booming economy during that period played a substantial role in the 10-percentage point decline in SPM poverty rates over this period. But government policy changes during this period, which included the expansion of the EITC (1994–1996) and federal welfare reform (passed in 1996), also mattered. Indeed, it is the combination of the EITC expansion, welfare reform, and a strong labor market that contributed to a dramatic increase in employment for single mothers (Blank, 2006; Blank and Haskins, 2001; Grogger, 2003; Meyer and Rosenbaum, 2001; refer to Figure 4-3) and a consequent reduction in market-income and SPM poverty.
The role of policy in reducing poverty over and above labor-market earnings began to grow again in 2000, owing mainly to the introduction and expansion of the Child Tax Credit (Hoynes and Rothstein, 2017) and the expansion in eligibility for SNAP (Ganong and Liebman, 2013). Figure 4-1 also shows that government benefits effectively cushioned families from the effects of the Great Recession, since market-income-based poverty rates increased sharply between 2008 and 2010 but SPM-based poverty, which includes transfers, actually fell slightly. SNAP figured prominently as a source of countercyclical income protection during this period, as did temporary measures contained in the 2008 and 2009 stimulus packages (Bitler and Hoynes, 2016; Bitler, Hoynes, and Kuka, 2017).
In the final stage of this historical period—from 2011 to 2016—the combination of expanding employment and added work hours for those already employed pushed market-income-based poverty down sharply for families with children. The effects of refundable tax credits and SNAP were also substantial; for most low-income families with children, work alone was not enough to lift them out of poverty (Hardy, Smeeding, and Ziliak, 2018).
Children in all three of the largest racial/ethnic groups (Whites, Blacks, and Hispanics) have experienced declines in market-income poverty rates over the past 50 years.13 This is evident in Appendix D, Figures D4-6, D4-7, and D4-8, taken from Wimer (2017), which show market-income and SPM-income child poverty rates from 1967 to 2016. Children in all three groups have also experienced larger declines in SPM poverty rates than
___________________
13 These declines are larger than the overall decline in market child poverty rates shown in Figure 4-1 because the demographic composition of American children has changed; the share of White children has decreased and the share of those at greater risk for poverty has grown. Put another way, the changing racial/ethnic composition of American children obscures long-term progress within all three racial/ethnic groups.
in market-income poverty rates, and this difference has become especially large in the past 15 years.
Similarly, poverty rates have declined over this period for children regardless of family composition. Appendix D, in Figures D4-9, D4-10, and D4-11, also taken from Wimer (2017), shows market-income and SPM child poverty rates from 1967 to 2016, separately for single, cohabiting, and married parents. Although both market-income and SPM poverty rates are quite different for these three groups—highest for single parents and lowest for married parents—all three groups show similar trends, with a particularly large decline in SPM poverty for single-parent families. In short, from 1993 onwards the tax and transfer system was increasingly effective at reducing child poverty rates for all racial/ethnic groups and all family types, with especially large effects during the 2000–2016 period.
CONCLUSION 4-4: Government tax and transfer programs reduced the child poverty rate, defined by the Supplemental Poverty Measure (SPM), modestly between 1967 and 1993, but became increasingly important after 1993 because of increases in government benefits targeted at the poor and near poor. Between 1993 and 2016, SPM poverty fell by 12.3 percentage points, from 27.9 to 15.6 percent, more than twice as much as market-income-based poverty.
Figure 4-6 depicts the trends in deep child poverty (below 50 percent of the poverty line) based on market-income poverty and on SPM poverty. Like market-income poverty drawn at the 100 percent SPM line, market-income-based deep poverty is cyclical, rising in economic downturns and falling when the economy expands. Although there was a dramatic decline in SPM poverty (refer to Figure 4-1), less progress was made in reducing SPM deep poverty over this period.14 In 1967, 8.2 percent of children were in deep SPM poverty, compared with 4.5 percent in 2016.15 A large reduction was observed between 1967 and 1974, when AFDC benefits were increased and the Food Stamp Program was introduced, and again in the late 1990s because of a strong labor market, welfare reform, and the expansion of the EITC. There has been almost no net change in the deep poverty rate since that time. The impact of government programs on deep poverty (as measured by the difference between market-income deep poverty and SPM deep poverty) declined substantially in the 1990s,
___________________
14 Some of this lack of progress fighting SPM poverty may reflect the rising rates of underreporting in the Current Population Survey (Meyer and Mittag, 2015; Meyer, Mok, and Sullivan 2009).
15 The 5.0 percent rate of deep poverty differs from the 2.9 percent rate presented in Chapter 2 because it does not reflect adjustments for underreporting. It has proved impossible to make a consistent set of underreporting adjustments across the entire 1967–2016 period.
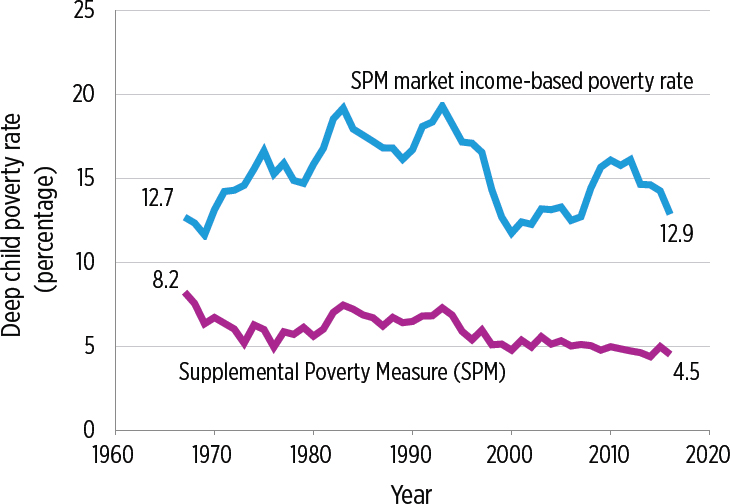
NOTE: The SPM poverty measure is anchored in 2012 living standards, adjusted back to 1967 using the Consumer Price Index, and does not adjust for underreporting. SPM market income-based poverty rate includes labor market income but no other sources of income in its measure of family resources.
SOURCE: Original analyses commissioned by the committee from Christopher Wimer (2017).
following welfare reform and the drop in cash assistance. In 1993, the tax and transfer system reduced deep poverty by 12 percentage points (from 19% for market-income deep poverty to 7% after taxes and benefits), and in 2000 it lowered deep poverty rates by only 7 percentage points. During the Great Recession, market-income deep child poverty rose sharply, but the safety net fully offset that increase.
A major shift occurred in the 1990s, as cash assistance declined (because of welfare reform) and work-dependent assistance (the EITC and, later, the Child Tax Credit) increased. Since about 2000, federal spending on the nonworking poor and the deep poor has remained stable or increased modestly; in contrast, spending on the working poor and those above the level of deep poverty has increased more substantially. Overall, then, spending has shifted away from the nonworking/deep poor and toward the working poor (Hoynes and Schanzenbach, 2018; Moffitt, 2015; Moffitt and Pauley, 2018).
Moreover, since the Great Recession the poorest individuals have experienced a sharp drop in support as temporary expansions of programs like SNAP expired, returning almost to pre-recession levels. The trend toward spending more on the working poor and proportionately less on the nonworking/deep poor has therefore continued to widen since the Great Recession (Moffitt and Pauley, 2018).
An examination of near poverty among children—drawing the poverty line at 150 percent of the SPM poverty line—shows a remarkable decline in SPM near poverty over the period in question. As shown in Figure 4-7, SPM near poverty fell from nearly 60 percent in 1967 to 36 percent in 2016. However, a comparison of market-income near poverty and SPM near poverty reveals a very different picture of the impacts of the tax and transfer system. Taxes (net of transfers) on the near poor exceeded government benefits during most of the past 50 years, and this pushed the rates of SPM-based near poverty for children above the near-poverty rates
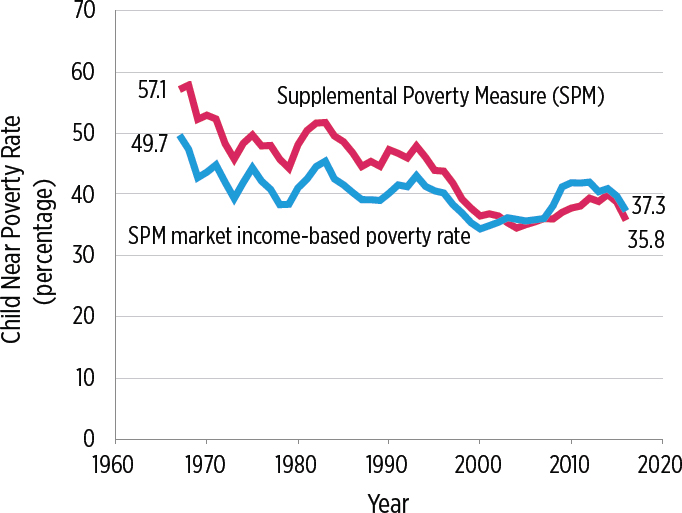
NOTE: The SPM poverty measure is anchored in 2012 living standards, adjusted back to 1967 using the Consumer Price Index, and does not adjust for underreporting. SPM market income-based poverty rate includes labor market income but no other sources of income in its measure of family resources.
SOURCE: Original analyses commissioned by the committee from Christopher Wimer (2017, October).
based solely on market income. The gap between the two rates narrows in the mid-1990s with the expansion of the EITC, and again in 1997 and 2000 with the introduction and expansion of the Child Tax Credit. During the Great Recession, market-income near poverty increased sharply, and the safety net partially offset this increase. By the end of the period, the fraction of children with total family resources below 150 percent of SPM poverty was nearly identical to rates based solely on market income, which suggests that, on balance, taxes and transfers had little net impact on the near-poverty thresholds among children.
CONCLUSION 4-5: Increasingly, anti-poverty programs have been geared toward working families. Increased government benefits have been less effective at reducing deep poverty (below 50% of the Supplemental Poverty Measure [SPM]) than at reducing poverty (100% of SPM), because fewer employment-based program benefits reach very low-income families with children. In the case of near poverty (income less than 150% of SPM), the net impact of government taxes and transfers on market income is now neutral, rather than negative, thanks to the expansion of work-based benefits for families above the 100 percent poverty line.
CHILD-RELATED INCOME TRANSFERS AND TAX BENEFITS
In this section, the committee addresses a key element of the statement of task: to provide an analysis of the poverty-reducing effects of the current set of major assistance programs directed at children and families in the United States. We begin with an overview of these programs and then analyze how child poverty rates in 2015 would have changed in the absence of each of these programs.
Although programs like SNAP and Temporary Assistance to Needy Families (TANF) may be among the most visible federal programs for children in low-income families, they are not the largest child-focused programs. The most comprehensive recent accounting of federal expenditures on all children is provided by Isaacs et al. (2018) and summarized in Figure 4-8 for 2017.16 It includes programs supported by federal budget expenditures as well as “spending” programs that take the form of tax reductions benefiting families with children. Some of the programs, most notably the dependent tax exemption, the deduction for employer-sponsored health
___________________
16 Only benefits or services provided either entirely or in some portion directly to children were counted. For benefits such as Medicaid and SSI that serve different age groups, the authors calculated the percentage of expenditures that goes to children (Isaacs et al., 2018).
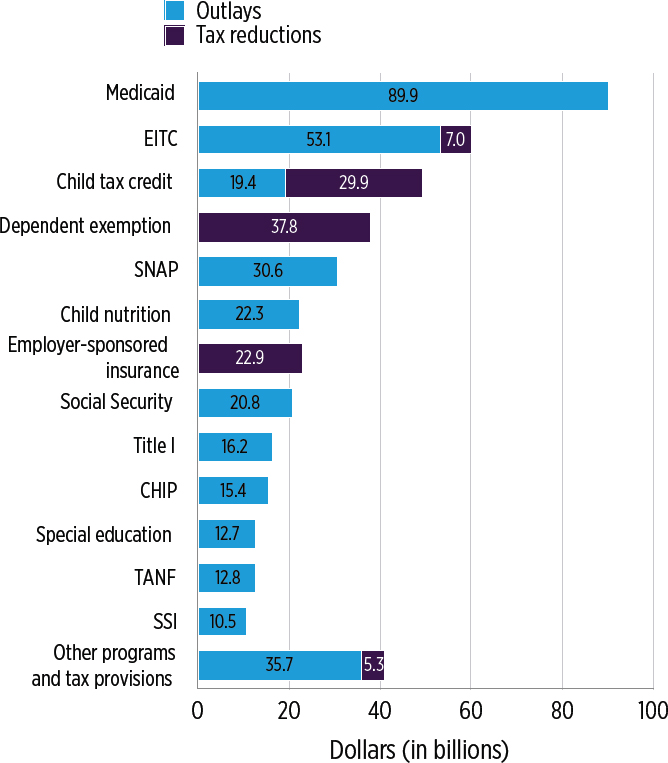
NOTES: Amounts in 2017 dollars. EITC = Earned Income Tax Credit, SNAP = Supplemental Nutrition Assistance Program, CHIP = Children’s Health Insurance Program, TANF = Temporary Assistance for Needy Families, SSI = Supplemental Security Income.
SOURCE: Isaacs et al. (2018).
insurance, and (to a lesser extent) the Child Tax Credit, provide considerably more benefits to middle- and high-income families with children than to poor families. Accordingly, they are less likely than benefits targeted toward the low-income population to reduce child poverty. Indeed, Isaacs et al. (2018) estimates that more than one-third (37%) of federal expenditures directed at children go to programs such as the Child Tax Credit
and income tax exemption for children, which do not restrict benefits to families with low incomes.
The Medicaid program, with expenditures of nearly $90 billion directed at children, is the federal program that spends the most on children. In 2017, low-income children received not only $90 billion in federal Medicaid payments, but also $15 billion from the government through the Children’s Health Insurance Program (CHIP), which provides health insurance to children through Medicaid as well as separate programs negotiated by states with the federal government. Total federal spending for health insurance for all children (including the $23 billion in tax expenditures for the deductibility of employer-provided health insurance, most of which benefits children in middle- and higher-income families) amounts to $128 billion. This amount represents 23 percent of all federal expenditures on children. Despite the crucial importance of health care spending for the future development of poor children, this spending has virtually no impact on SPM-based poverty because of the ways in which SPM-based poverty is defined (see Chapters 2 and 7).17
The second-, third-, and fourth-largest expenditures on children relate to provisions in the federal income tax: the EITC, the Child Tax Credit, and tax exemptions for dependent children living in a household (Isaacs et al., 2018). At $60 billion, the EITC is the largest of the three. Although available only to families with earned income, the EITC is refundable, so when a family’s income is too low to generate tax obligations, the family receives a refund from the IRS. In 2017, a single mother with two children who earned between $14,040 and $18,340 (a range that includes the earnings of a full-time, full-year minimum wage worker) would receive the maximum credit of $5,616.18 For the 2016 tax year, the average EITC for a family with children was $3,176.19 The EITC is not without flaws, however; Box 4-1 describes issues pertaining to noncompliance and overpayments.
The Child Tax Credit ($49 billion; refer to Figure 4-8) is a partially refundable tax credit for each child a working family is allowed to claim. Prior to the 2018 tax reform, the credit amounted to $1,000 per child; the 2018 reforms doubled that amount.20 The Child Tax Credit provides important benefits to some low-income families with children, but a substantial share of its federal funding goes to families much higher in the
___________________
17 See Chapter 9 for recommendations for incorporating public health insurance expenditures into the poverty measure.
18 See https://www.irs.gov/credits-deductions/individuals/earned-income-tax-credit/eitc-income-limits-maximum-credit-amounts for 2017 EITC limits.
19 See https://www.cbpp.org/research/federal-tax/policy-basics-the-earned-income-tax-credit.
20 For more information about the 2018 reforms, see https://www.irs.gov/newsroom/whats-new-with-the-child-tax-credit-after-tax-reform.
income distribution.21 In the case of the tax exemption for dependent
___________________
21 The refundable portion of the Child Tax Credit (CTC), known as the Additional Child Tax Credit (ACTC), is limited to 15 percent of earned income above $3,000. Here we refer to the combined CTC and ACTC simply as the CTC. In 2017, the $1,000 credit was phased out, starting at incomes of about $80,000 and $120,000 for single- and married-couple families, respectively. The credit was fully phased out at incomes of about $100,000 ($130,000) for single-parent (married-couple) families. Hoynes and Schanzenbach (2018) estimate that as of 2017, 40 percent of CTC spending goes to families with incomes above 200 percent of poverty.
children, little of the $38 billion in benefits from the dependent exemption goes to the families of poor children because of their low levels of taxable income. As shown below, both the EITC and Child Tax Credit target low-income families and play an important role in reducing child poverty.
Spending on nutrition-related programs (SNAP, school breakfast and lunch, food for children attending child care) totaled $58 billion in 2017 (Isaacs et al., 2018). Eligibility for SNAP ($31 billion; Isaacs et al., 2018), which provides vouchers for food assistance, is generally limited to those with gross monthly incomes below 130 percent of the federal poverty line. In 2018, the average monthly SNAP benefit was $125 per person.22
Social insurance spending, consisting of Survivors Insurance (part of Social Security) and benefits for child dependents of Disability Insurance beneficiaries, was next in size, at $21 billion (Isaacs et al., 2018). Neither is explicitly targeted at the poor or low-income families, but both benefit children who suffer the loss of a wage earner, thereby reducing the economic insecurity of children from all income classes. Because disability and death are more common among families in the bottom half than in the top half of the income distribution, however, these two forms of social insurance prevent a substantial number of children from falling into poverty.
Expenditures on each of the other programs listed in Figure 4-8 amounted to less than $17 billion. It is noteworthy that federal spending on the key cash assistance program that emerged from the 1996 welfare reforms (the TANF program) totaled only $13 billion in 2017 (Isaacs et al., 2018). SSI is a federal cash assistance program that provides benefits to low-income disabled and elderly persons. Following a court decision in 1990, the definition of disability was expanded to allow more children to receive SSI (Duggan, Kearney, and Rennane, 2016); in 2017 those expenditures totaled $11 billion.
EFFECTS OF INCOME TRANSFERS AND TAX BENEFITS ON CHILD POVERTY IN 2015
The degree to which federal programs reduce child poverty is a function of whether program benefits are counted as resources in the SPM poverty measure and, if they are counted, their overall size and the extent to which their benefits are targeted at the families of poor children.23 We use the TRIM3 microsimulation model to estimate how much rates of child
___________________
22 See https://fns-prod.azureedge.net/sites/default/files/pd/SNAPsummary.pdf.
23 The largest transfer program omitted from SPM resources is Medicaid, which as we saw above is the child program with the highest federal expenditures. Given the expansions to Medicaid in recent decades, the reductions in SPM poverty shown below would be greater if Medicaid were included. See Chapter 7 for a discussion of incorporating public health insurance expenditures into the poverty measure.
poverty (at 100%, 50%, and 150% of the TRIM3 SPM poverty line) would increase if benefits from each major support program were eliminated. As with the poverty estimates discussed in Chapter 2, these TRIM3 estimates adjust for the underreporting of transfers and apply to 2015.
Importantly, though, our estimates of the poverty-reducing impact of current programs do not account for the extent to which eliminating a given program might also affect work and other decisions that would in turn affect a family’s market incomes. As discussed in Chapter 5, these behavioral effects could either push the estimates of child poverty rates up (if the elimination of the EITC and its work incentives caused earnings to fall) or down (if the elimination of an important income source, such as SNAP, led to more work and earnings).
The two refundable tax credits—the EITC and the refundable portion of the Child Tax Credit—are the most successful at alleviating poverty, as shown in Figure 4-9.24 Starting from the 13.0 percent TRIM3 SPM child poverty rate in 2015, we estimate that the elimination of these tax credits would raise SPM child poverty to 18.9 percent, an increase of 5.9 percentage points, or 4.4 million children. Benefits from SNAP are next largest: In the absence of SNAP benefits, the SPM poverty rate is estimated to rise to 18.2 percent. Without the SSI program, it would rise from 13.0 to 14.8 percent. In the absence of Social Security, it is estimated to rise to 15.3 percent. The importance of Social Security in lowering child poverty stems mainly from the numbers of low-income children living in households with retired or disabled members.
An examination of the effects of program elimination on deep poverty reveals a different pattern of effects (see Figure 4-10). In contrast to their effects on 100 percent SPM poverty, tax credits play only a minor role in reducing deep poverty. This is consistent with the fact that families with incomes below 50 percent of the poverty line lack substantial earned income. SNAP is by far the single most important tax and transfer program for reducing deep poverty; our simulations indicate that eliminating SNAP would nearly double the fraction of children in deep SPM poverty (from 2.9 to 5.7%). Social Security has the next largest effect in reducing deep poverty; eliminating it would increase deep poverty from 2.9 to 4.3 percent.
Finally, an analysis of near poverty (150% of the SPM) shows that tax credits are by far the most important component in reducing near poverty among children (see Figure 4-11).
The most disadvantaged demographic groups—Blacks and Hispanics, single parents, and young and poorly educated parents—benefit disproportionately from both SNAP (Appendix D, Figure D4-12) and tax benefit programs (Appendix D, Figure D4-13). However, children who are not
___________________
24 See Appendix D, Table 4-2 for more information.
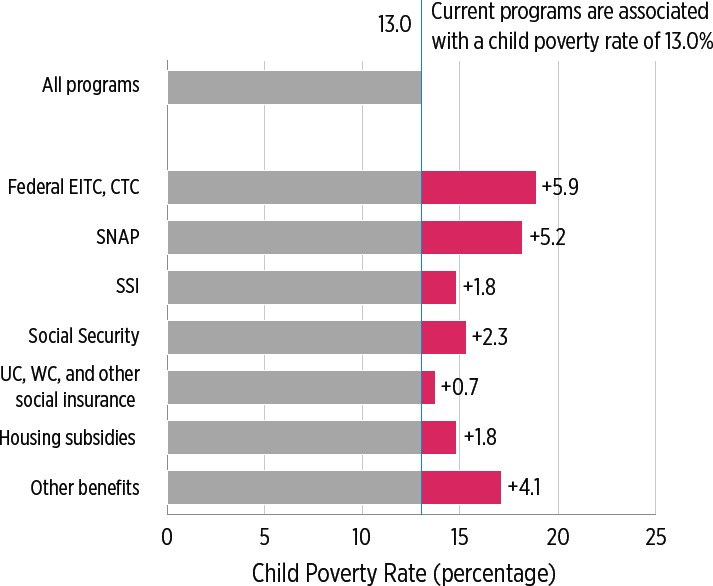
NOTES: Poverty defined as below 100 percent of the TRIM3 SPM poverty line. Estimates are for 2015 and adjust for underreporting but not for behavioral effects. Other benefits include Temporary Assistance for Needy Families, solely state-funded assistance, means-tested veterans benefits, means-tested education assistance, the Low Income Home Energy Assistance Program, the National School Lunch Program, and the Special Supplemental Nutrition Program for Women, Infants, and Children. EITC = Earned Income Tax Credit, CTC = Child Tax Credit, SNAP = Supplemental Nutrition Assistance Program, SSI = Supplemental Security Income, UC = Unemployment Compensation, WC = Workers’ Compensation.
SOURCE: Estimates from TRIM3 commissioned by the committee.
citizens benefit less from both programs, and children who live in families with no workers do not benefit at all from tax-related benefit programs.
CONCLUSION 4-6: The Earned Income Tax Credit, the Child Tax Credit, the Supplemental Nutrition Assistance Program (SNAP), and to a lesser extent Social Security are the most important programs for reducing Supplemental Poverty Measure (SPM)-based child poverty.
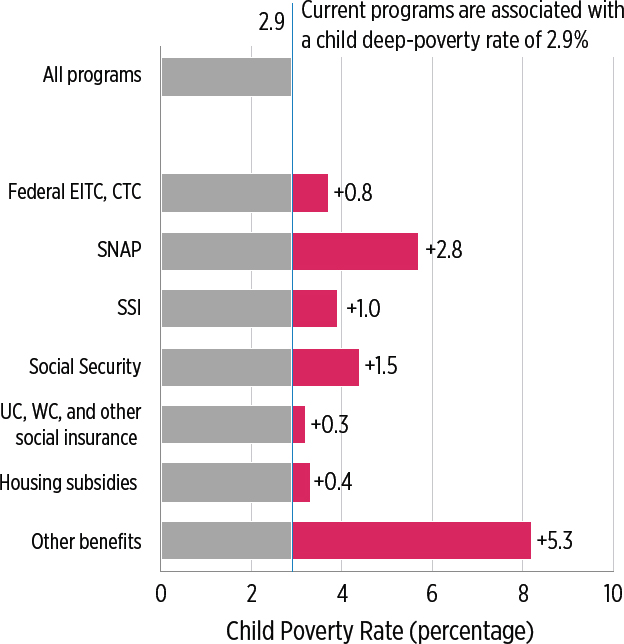
NOTES: Deep poverty defined as below 50% of the TRIM3 SPM poverty line. Estimates are for 2015 and adjust for underreporting but not for behavioral effects. Other benefits: See note to Figure 4-9. EITC = Earned Income Tax Credit, CTC = Child Tax Credit, SNAP = Supplemental Nutrition Assistance Program, SSI = Supplemental Security Income, UC = Unemployment Compensation, WC = Workers’ Compensation.
SOURCE: Estimates from TRIM3 commissioned by the committee.
SNAP and Social Security are the most important programs for reducing deep poverty among children. Tax credits are the most important means of keeping children above near poverty (150% of SPM poverty). Health care programs account for more than one-third of total federal expenditures on children but are not properly accounted for in the SPM poverty measure.
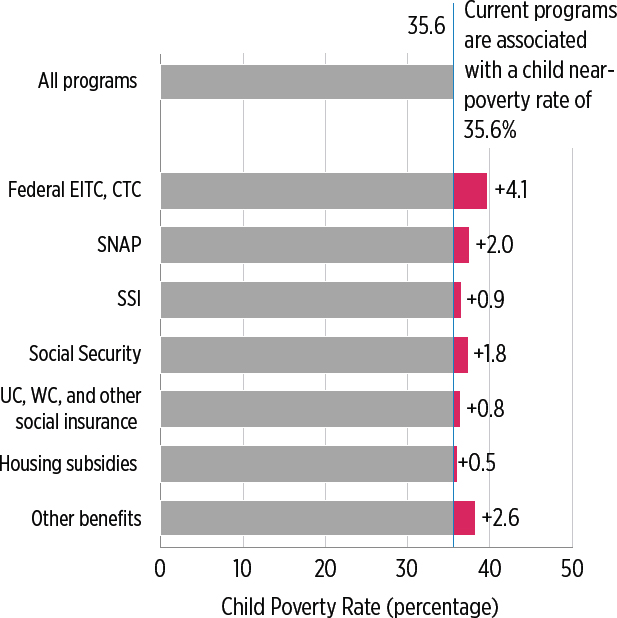
NOTES: Near poverty is defined as below 150% of the TRIM3 SPM poverty line. Estimates are for 2015 and adjust for underreporting but not for behavioral effects. Other benefits: See note to Figure 4-9. EITC = Earned Income Tax Credit, CTC = Child Tax Credit, SNAP = Supplemental Nutrition Assistance Program, SSI = Supplemental Security Income, UC = Unemployment Compensation, WC = Workers’ Compensation.
SOURCE: Estimates from TRIM3 commissioned by the committee.
EFFECTS OF GOVERNMENT BENEFITS ON CHILD POVERTY IN THE UNITED STATES AND OTHER ENGLISH-SPEAKING COUNTRIES
All nations allocate a portion of their budgets to programs that benefit children. Total family-related spending on financial supports, expressed as a percentage of a country’s Gross Domestic Product (GDP), is plotted in Figure 4-12 for Australia, Canada, Ireland, the United Kingdom, and the
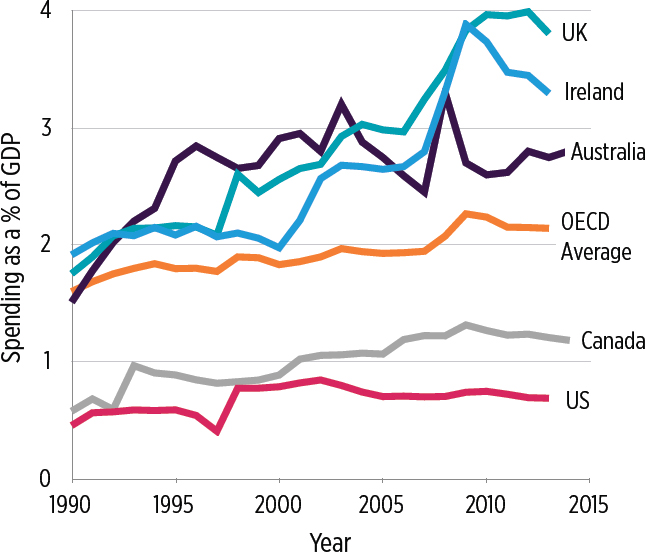
SOURCE: OECD, Social Expenditure database (see https://data.oecd.org/socialexp/family-benefits-public-spending.htm); and OECD (2017).
United States annually from 1990 through 2015.25 Although government spending on health and housing also assists families, it is not included in the figure. And while some state and even local governments in the United States spend significant amounts on child-specific programs, these amounts, too, are not included in the following figures.
Peer anglophone nations can be divided into those that spend relatively larger fractions of their national incomes on these family-related programs (Australia, Ireland, and the United Kingdom) and those that spend smaller fractions (Canada and the United States). Increases in spending over the 25-year period show a similar pattern: Spending rose from less than
___________________
25 These data come from OECD (2017) and use a spending measure based on the aggregate category of “public spending on family benefits, including financial support that is exclusively for families and children” used by OECD. See Appendix D, 4-1 for an explanation of how the OECD defines its spending categories.
2 percent of GDP in all countries to nearly 3 percent in Australia and more than 3 percent in Ireland and the United Kingdom. In contrast, spending on families never exceeded 1 percent of GDP in the United States over this period, and it rose to slightly over 1 percent in Canada. Although Canada and the United States have always remained below the OECD average, Canada planned to increase the share of its expenditures on families with children that is targeted specifically to children to 1.25 percent of GDP over the following 2 years (in 2017 and 2018), following the passage of its new Child Benefit26 (see Box 4-2).
The United Kingdom’s dramatic increase in spending beginning in the late 1990s was the result of its “War on Poverty” (see Box 4-3). The United Kingdom managed to fight child poverty effectively and consistently and was able to cut its poverty rate by one-half under an umbrella of policies designed both to promote work (with high-quality “sure start” child care readily available) and to make work more attractive than the cash welfare system. The cash welfare system remains available, and its scope was not reduced as much as the TANF system in the United States. However, since 2010 the United Kingdom has been retrenching and implementing cuts in benefits, capping the amount of benefits nonworking families could receive and cutting other benefits (United Kingdom, Department for Work and Pensions, 2015).
Government Spending and Its Effect on Child Poverty Rates
How has this public spending affected child poverty rates in peer English-speaking countries? To find out, we use an SPM line converted to other currencies using purchasing power parities (PPP). Figure 4-13 shows the effects of the tax and transfer system on child poverty based on the latest Luxembourg Income Study (LIS) data and defined in the same way as the absolute poverty (LIS-SPM-PPP) measure used in Chapter 2.
The far-right ends of the bars in Figure 4-13 show that the extent to which families’ market income alone is sufficient to raise a child above this poverty threshold varies widely across the five English-speaking OECD nations. With a 23.0 percent child poverty rate based on market income only, the United States is in the middle of the pack—with a poverty rate higher than that in Canada and Australia but much lower than that in the United Kingdom and Ireland.
As explained below, the types of transfers used for Figure 4-13 are broken down into two types: social insurance benefits, such as unemployment and Social Security benefits, along with universal benefits such
___________________
26 Authors’ calculations are based on https://www.fin.gc.ca/afr-rfa/2017/report-rapport-eng.asp#_Toc492557458.
as child allowances that are not means tested; and targeted means-tested tax and transfer programs. The combined reduction in poverty they bring about is shown by the gray and blue bars. Poverty rates after accounting for taxes and transfers are represented by the white portion of the bars. After accounting for the tax and transfer system, and as already seen in
Figure 2-12, the United States has the second-highest child poverty rate (12.5%), which is one percentage point below the UK rate of 13.5 percent, a little over a percentage point above Ireland’s rate, and much higher than the rates in Australia and Canada.
As a comparison of the combined widths of the gray and blue bars in Figure 4-13 shows, the United States is notable in that its government tax and transfer policies are the least successful at reducing poverty. Canada ranks next lowest in this regard, although its new Child Benefit (refer to Box 4-2) is expected to substantially reduce its child poverty rate; according to one estimate, it will cut child poverty by one-half (Corak, 2017). If Canada’s Child Benefit program meets expectations, the country’s child
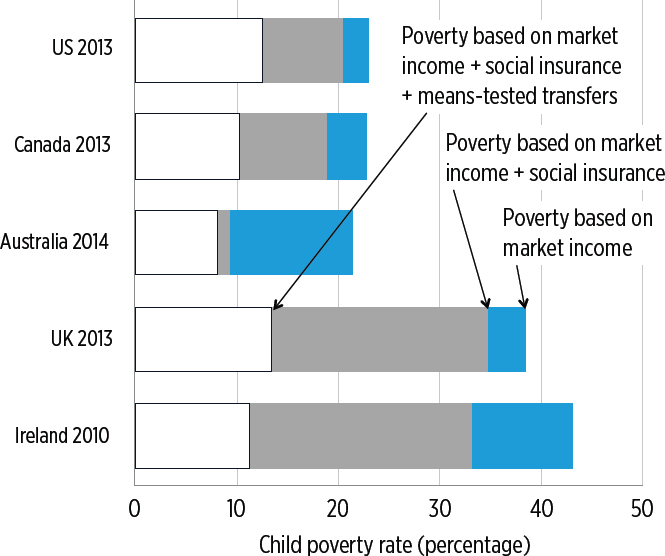
NOTES: The blue portion represents reductions in child poverty from social insurance and universal programs. Additional reductions from means-tested transfers, minus direct taxes (including refundable tax credits) are represented by the gray portion. Data are not adjusted for underreporting.
SOURCE: Original Luxembourg Income Study (LIS) analyses commissioned by the committee from the LIS Cross-National Data Center.
poverty rate will fall to the neighborhood of 5 to 6 percent, among the lowest rates in the entire OECD and the lowest among the anglophone nations shown in Figure 4-13. Moreover, it has been estimated that, if the Canadian Child Benefit were implemented in the United States as a replacement for the Child Tax Credit, U.S. child poverty would fall by more than one-half (Sherman, 2018). According to estimates from the TRIM3 model, a similar Child Benefit in the United States would reduce U.S. (SPM-based) child poverty by more than one-half and deep poverty (<50 percent SPM poverty) by more than two-thirds.
Australia has succeeded in reducing poverty more than Canada and the United States, while the United Kingdom and Ireland have achieved the
highest level of poverty reduction. Not surprisingly, the poverty-reduction rankings are similar to the spending rankings displayed in the previous figure.
Looking now at the relative importance of social insurance and universal benefits plus income-tested programs in Figure 4-13, it is evident that both types of programs have significant poverty-reducing effects in all countries. Most notable is the uniquely small role of social insurance programs (shown in blue) in the U.S. anti-poverty package. Social insurance programs in the United States reduce child poverty by only 2.5 percentage points, about one-quarter of the total reduction in U.S. poverty. Australia is at the other end of the continuum; in that country virtually all poverty reduction can be attributed to universal (social insurance) programs. In contrast, the United Kingdom and Ireland rely on both types of programs, and especially on income-tested programs, to reduce poverty in the years observed in this figure.
Figure 4-14 is constructed in the same fashion as Figure 4-13 but shows the effects of the safety net on deep child poverty and near child poverty in these same countries, using 50 percent of the same absolute SPM poverty line. Market incomes sufficient to raise family income out of deep poverty are more common in the United States than in other countries. In the United States, the 11.5 percent deep-poverty rate based on market income is somewhat lower than the corresponding rates in Canada and Australia and substantially lower than those in Ireland and the United Kingdom. But in the United States, the small relative amount of means-tested and, especially, social insurance transfers that go to children with very low family incomes translate into the highest rate of children in deep poverty (3.6%). After accounting for targeted benefits as well, all other nations have deep poverty rates that are under 2 percent. The U.S. finding is consistent with recent research showing that the U.S. safety net is increasingly likely to help the working poor while it excludes or minimizes spending on the deeply poor (Hoynes and Schanzenbach, 2018; Moffitt and Pauley, 2018).
Finally, Australia and Ireland are the only countries whose safety nets have an impact on near poverty (see Figure 4-15). The U.S. near-poverty line is very high relative to the income distributions in the United Kingdom and Ireland but fixed at about the same fraction of median income as in Canada and Australia. At these income levels, taxes paid tend to increase and targeted benefits tend to phase out. In Ireland and Australia, however, social insurance and universal transfers are strong enough to make a substantial impact.
CONCLUSION 4-7: The United States spends a somewhat smaller proportion of its Gross Domestic Product on child and family tax and transfer benefits than Canada does, and a much smaller proportion
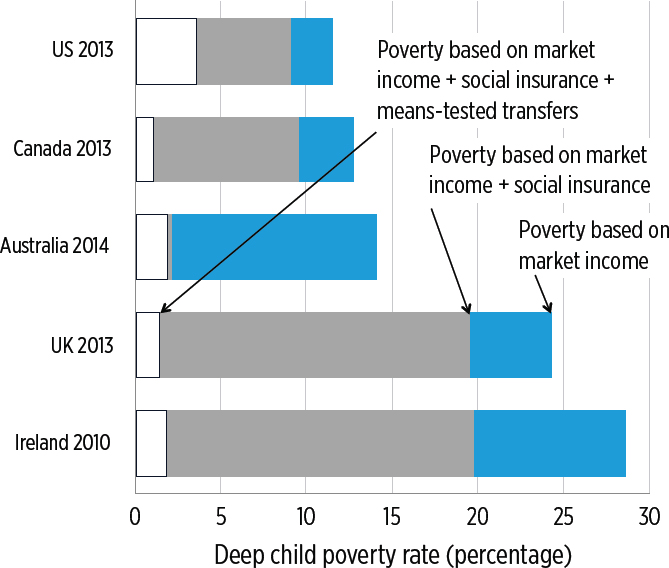
NOTES: Deep poverty defined as below 50 percent of poverty. The blue portion represents reductions in child poverty from social insurance and universal programs. Additional reductions from means-tested transfers, minus direct taxes (including refundable tax credits), are represented by the gray portion. Data are not adjusted for underreporting.
SOURCE: Original Luxembourg Income Study (LIS) analyses commissioned by the committee from the LIS Cross-National Data Center.
than Australia, Ireland, and the United Kingdom do. Consequently, government transfers do less to reduce poverty in the United States than in Canada and much less than in Australia, Ireland, and the United Kingdom. While U.S. benefits targeted at the poor and near poor reduce child poverty substantially, the United States does the least for children through the use of universal benefits like child allowances and social insurance programs such as Unemployment Compensation and Social Security survivors benefits. Such benefits have much bigger effects on child poverty in Australia, Ireland, and (with its new Child Benefit) Canada.
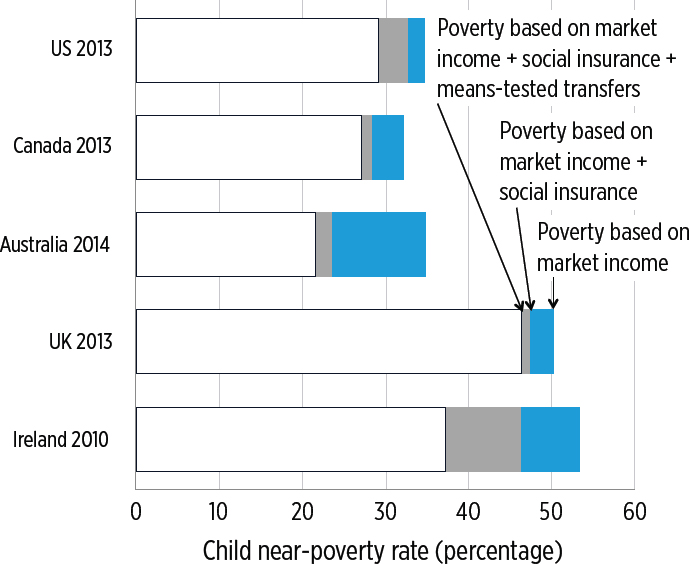
NOTES: Near-poverty is defined as below 150 percent of poverty. The blue portion represents reductions in child poverty from social insurance and universal programs. Additional reductions from means-tested transfers, minus direct taxes (including refundable tax credits) are represented by the gray portion. Data are not adjusted for underreporting.
SOURCE: Original Luxembourg Income Study (LIS) analyses commissioned by the committee from the LIS Cross-National Data Center.
REFERENCES
Autor, D.H. (2014). Skills, education, and the rise of earnings inequality among the “other 99 percent.” Science, 344(6186), 843–851.
Autor, D., Dorn, D., and Hanson, G. (2013). The China syndrome: Local labor effects of import competition in the United States. American Economic Review, 103(6), 2121–2168.
Autor, D., Manning, A., and Smith, C.L. (2016). The contribution of the minimum wage to U.S. wage inequality over three decades: A reassessment. American Economic Journal: Applied Economics, 8(1), 58–99.
Baker, R.S. (2015). The changing association among marriage, work, and child poverty in the United States, 1974–2010. Journal of Marriage and Family, 77(5), 1166–1178.
Becker, G.S. (1981). Altruism in the family and selfishness in the market place. Economica, New Series, 48(189), 1–15. Available: https://www.jstor.org/stable/pdf/2552939.pdf.
Bitler, M., and Hoynes, H. (2010). The state of the safety net in the post-welfare reform era. Brookings Papers on Economic Activity, 2(Fall), 71–127.
________. (2015). Heterogeneity in the impact of economic cycles and the great recession: Effects within and across the income distribution. American Economic Review Papers and Proceedings, 105(5), 154–160.
________. (2016). The more things change, the more they stay the same? The safety net and poverty in the Great Recession. Journal of Labor Economics, 34(S1, Part 2).
Bitler, M., Hoynes, H., and Kuka, E. (2017). The Great Recession and child poverty. Journal of Policy Analysis and Management, 36(2), 358–389.
Black, S.E., Schanzenbach, D.W., and Breitwieser, A. (2017). The recent decline in women’s labor force participation. In D.W. Schanzenbach and R. Nunn (Eds.), The 51%: Driving Growth Through Women’s Economic Participation (pp. 5-18). Washington, DC: The Brookings Institution. Available: https://www.brookings.edu/wp-content/uploads/2017/10/es_10192017_the51percent_ebook.pdf#page=10.
Blank, R. (1989). Disaggregating the effect of the business cycle on the distribution of income. Economica, 56(2), 141–163.
________. (1993). Why were poverty rates so high in the 1980s? In D. Papadimitriou and E. Wolff (Eds.), Poverty and Prosperity in the Late Twentieth Century (pp. 21–55). New York: St. Martin’s Press.
________. (2006). Was welfare reform successful? The Economists’ Voice, 3(4), Article 2. Available: https://www.usi.edu/BUSINESS/cashel/331/welfare%20reform.pdf.
Blank, R., and Blinder, A. (1986). Macroeconomics, income distribution, and poverty. In S. Danziger and D. Weinberg (Eds.), Fighting Poverty: What Works and What Doesn’t (pp. 180–208). Cambridge, MA: Harvard University Press.
Blank, R., and Card, D. (1993). Poverty, income distribution and growth: Are they still related? Brookings Papers on Economic Activity, 2. Washington, DC: Brookings Institution.
Blank, R., and Haskins, R. (Eds.). (2001). The New World of Welfare. Washington, DC: Brookings Institution.
Canada, Office of the Parliamentary Budget Officer. (2016). Fiscal Analysis of Federal Children’s Benefits, September 1. Ottawa, ON: Office of the Parliamentary Budget Officer.
Cancian, M., and Reed, D. (2009). Family structure, childbearing, and parental employment: Implications for the level and trend in poverty. In M. Cancian and S. Danziger (Eds.), Changing Poverty, Changing Policies. New York: Russell Sage Foundation.
Chen, W.-H., and Corak, M. (2008). Child poverty and changes in child poverty. Demography, 45(3), 537–553.
Chetty, R., Friedman, J., and Saez, E. (2013). Using differences in knowledge across neighborhoods to uncover the impacts of the EITC on earnings. American Economic Review, 103(7), 2683–2720.
Corak, M. (2017). Innovation in Cash Benefits to Families with Children: The Canada Child Benefit. Memo prepared for the Committee on Building an Agenda to Reduce the Number of Children in Poverty by Half in 10 Years.
Cutler, D., and Katz, L. (1991). Macroeconomic Performance and the Disadvantaged. Brookings Papers on Economic Activity, 1. Washington, DC: Brookings Institution.
Danziger, S., and Gottschalk, P. (1995). Unequal America. New York: Russell Sage Foundation.
Duggan, M., Kearney, M.S., and Rennane, S. (2016). The Supplemental Security Income program. In R. Moffitt (Ed.), Economics of Means-Tested Transfer Programs in the United States, Volume 2. Chicago: University of Chicago Press.
Farber, H.S., Herbst, D., Kuziemko, I., and Naidu, S. (2018). Unions and Inequality over the Twentieth Century: New Evidence from Survey Data. NBER Working Paper No. 24587. Cambridge, MA: National Bureau of Economic Research. Available: http://www.nber.org/papers/w24587.
Freeman, R. (2001). The rising tide lifts . . .? In S. Danziger and R. Haveman (Eds.), Understanding Poverty. Cambridge, MA: Harvard University Press.
Ganong, P., and Liebman, J.B. (2013). The Decline, Rebound, and Further Rise in SNAP Enrollment: Disentangling Business Cycle Fluctuations and Policy Changes. Cambridge, MA: National Bureau of Economic Research. Available: http://www.nber.org/papers/w19363.
Gornick, J., and Smeeding, T.M. (2018). Redistributional policy in rich countries: Institutions and impacts in non-elderly households. Annual Review of Sociology, 43.
Greenstein, R., Warwick, J., and Marr, C. (2017). Reducing Overpayments in the Earned Income Tax Credit. Washington, DC: Center on Budget and Policy Priorities. Available: https://www.cbpp.org/research/federal-tax/reducing-overpayments-in-the-earned-income-tax-credit.
Grogger, J. (2003). The effects of time limits, the EITC, and other policy changes on welfare use, work, and income among female-headed families. Review of Economics and Statistics, 85(2), 394–408.
Gruber, J. (2003). Medicaid. In R. Moffitt, (Ed.), Means-Tested Transfer Programs in the United States (pp. 15–78). Chicago: University of Chicago Press.
Gundersen, C., and Ziliak, J. 2004. Poverty and macroeconomic performance across space, race, and family structure. Demography, 41(1), 61–86.
Hardy, B., Smeeding, T., and Ziliak, J. (2018). The changing safety net for low-income parents and their children: Structural or cyclical changes in income support policy? Demography 55(1), 189–221.
Hoynes, H., and Rothstein J. (2017). Tax policy toward low-income families. In A.J. Auerbach and K. Smetters (Eds.), The Economics of Tax Policy. Oxford: Oxford University Press.
Hoynes, H., and Schanzenbach, D. (2018). Safety Net Investments in Children. Brookings Papers on Economic Activity, Conference Draft. Washington, DC: Brookings Institution. Available: https://www.brookings.edu/bpea-articles/safety-net-investments-in-children.
Hoynes, H., Page, M.E., and Stevens, A.H. 2006. Poverty in America: Trends and explanations. Journal of Economic Perspectives, 20(1), 47–68.
Internal Revenue Service. (2014). Compliance Estimates for the Earned Income Tax Credit Claimed on 2006–2008 Returns. Research, Analysis & Statistics Report Publication 5162. Washington, DC: Internal Revenue Service. Available: https://www.irs.gov/pub/irs-soi/EITCComplianceStudyTY2006-2008.pdf.
Isaacs, J.B., Lou, C., Hahn, H., Ovalle, J., and Steuerle, C.E. (2018). Kids’ Share 2018: Report on Federal Expenditures on Children Through 2017 and Future Projections. Washington, DC: Urban Institute. Available: https://www.urban.org/sites/default/files/publication/98725/kids_share_2018_0.pdf.
Juhn, C., Murphy, K.M., and Pierce, B. (1993). Wage inequality and the rise in returns to skill. Journal of Political Economy, 101, 410–442.
Katz, L., and Murphy, K.M. (1992). Changes in relative wages, 1963–1987: Supply and demand factors. Quarterly Journal of Economics, 107, 35–78.
Lerman, R.I. (1996). The impact of the changing US family structure on child poverty and income inequality. Economics, New Series, 63(250), S119-S139. Available: https://www.jstor.org/stable/pdf/2554812.pdf.
Lichter, D.T., and Crowley, M.L. (2004). Welfare reform and child poverty: Effects of maternal employment, marriage, and cohabitation. Social Science Research, 33, 385–408.
Meyer, B.D., and Mittag, N. (2015). Using Linked Survey and Administrative Data to Better Measure Income: Implications for Poverty, Program Effectiveness, and Holes in the Safety Net. NBER Working Paper No. 21676. Cambridge, MA: National Bureau of Economic Research. Available: http://www.nber.org/papers/w21676.
Meyer, B.D., and Rosenbaum, D.T. (2001). Welfare, the Earned Income Tax Credit, and the labor supply of single mothers. Quarterly Journal of Economics, 116(3), 1063–1114.
Meyer, B.D., and Sullivan, J. (2011). Consumption and income poverty over the business cycle. Research in Labor Economics, 32, 51–82.
Meyer, B.D., Mok, W.K.C., and Sullivan, J.X. (2009). The Under-Reporting of Transfers in Household Surveys: Its Nature and Consequences. NBER Working Paper No. 1581. Cambridge, MA: National Bureau of Economic Research. Available: http://www.nber.org/papers/w15181.
Moffitt, R. (2015). The deserving poor, the family, and the U.S. welfare system. Demography, 52(3), 729–749.
Moffitt, R.A., and Pauley, G. (2018). Trends in the Distribution of Social Safety Net Support after the Great Recession. Palo Alto, CA: Stanford Center on Poverty and Inequality.
Nichols, A. (2013). Explaining Changes in Child Poverty Over the Past Four Decades: Low-Income Working Families. Discussion Paper No. 2. Washington, DC: Urban Institute. Available: http://webarchive.urban.org/UploadedPDF/412897-Explaining-Changes-in-Child-Poverty-Over-the-Past-Four-Decades.pdf.
Organisation for Economic Co-operation and Development. (OECD). (2017). Basic Income as a Policy Option: Can It Add Up? Policy Brief on the Future of Work. Paris: OECD Publishing.
Rector, R. (2016). Reforming the Earned Income Tax Credit and Additional Child Tax Credit to End Waste, Fraud, and Abuse and Strengthen Marriage. Available: https://www.heritage.org/welfare/report/reforming-the-earned-income-tax-credit-and-additional-child-tax-credit-end-waste.
Saez, E. (2010). Do taxpayers bunch at kink points? American Economic Journal: Economic Policy 2, 180–212. Available: https://eml.berkeley.edu//~saez/course/SaezAEJ.pdf.
Shambaugh, J., Nunn, R., Liu, P., and Nantz, G. (2017). Thirteen Facts About Wage Growth. Washington, DC: The Hamilton Project, Brookings Institution. Available: https://www.brookings.edu/wp-content/uploads/2017/09/thp_20170926_thirteen_facts_wage_growth.pdf.
Sherman, A. (2018). Canadian-style Child Benefit Would Cut U.S. Child Poverty by More Than Half. Washington, DC: Center for Budget and Policy Priorities. Available: https://www.cbpp.org/blog/canadian-style-child-benefit-would-cut-us-child-poverty-by-more-than-half.
Smeeding, T.A., and Waldfogel, J. (2010). Fighting poverty: Attentive policy can make a huge difference. Journal of Policy Analysis and Management, 29(2), 401–407.
Social Capital Project. (2017). Love, Marriage and the Baby Carriage: The Rise in Unwed Childbearing. SCP Report No. 3-17. Available: https://www.lee.senate.gov/public/index.cfm/2017/12/love-marriage-and-the-baby-carriage.
United Kingdom Department for Work and Pensions. (2015, May). Policy Paper: 2010 to 2015 Government Policy: Welfare Reform. Available: https://www.gov.uk/government/publications/2010-to-2015-government-policy-welfare-reform/2010-to-2015-government-policy-welfare-reform.
Waldfogel, J. (2010). Britain’s War on Poverty. New York: Russell Sage Foundation.
Wimer, C. (2017). Child Poverty in the United States: Long-term Trends and the Role of Antipoverty Programs Using the Anchored Supplemental Poverty Measure. Commissioned by the Committee on Building an Agenda to Reduce the Number of Children in Poverty by Half in 10 Years, The National Academies of Sciences, Engineering, and Medicine, Washington, DC.
This page intentionally left blank.


