5
Ten Policy and Program Approaches to Reducing Child Poverty
The core of the committee’s congressional charge is to “identify policies and programs with the potential to help reduce child poverty and deep poverty (measured using the Supplemental Poverty Measure or SPM) by 50 percent within 10 years of the implementation of the policy approach.” Our analyses and conclusions regarding these policy and program proposals are presented in the next three chapters.
The current chapter summarizes our ideas in 10 different program and policy areas, all of which could be simulated using the Transfer Income Model, Version 3 (TRIM3) microsimulation model. Chapter 6 presents four policy and program packages containing two or more of the options presented in this chapter. We find considerable merit to a “package” approach to child poverty reduction because it provides an opportunity to combine options that generate complementary impacts on poverty reduction, work incentives, and other important criteria. Chapter 7 provides a discussion of potentially meritorious policies and programs that, for various reasons, could not meet the high evidentiary standard set by the committee for its simulations.
As explained in Chapter 1, the committee identified possible policies and programs by reviewing the evaluation literature and soliciting ideas from individuals and groups representing a broad range of political orientations and experiences in communities and in state and federal government (see Appendix C for a list of memo authors). As the committee sifted through dozens of policy and program ideas, it applied five key criteria to assess each policy or program it considered: (1) the strength of the research and evaluation evidence indicating whether the policy or program would
in fact reduce poverty; (2) the size and magnitude of any poverty reduction suggested by the evidence; (3) the policy’s or program’s success in reducing child poverty within high-risk subgroups; (4) its cost; and (5) its impact on work, marriage, opportunity, and social inclusion. As throughout this report, we focus on packages of policies and programs that could produce short-run reductions in child poverty, owing to the 10-year window dictated by the committee’s Statement of Task. Programs such as early childhood education and child development savings accounts therefore fell outside the committee’s purview.
The high evidentiary standard set by the committee played an important role in determining which program and policy ideas should be included in the current chapter and which should be relegated to Chapter 7 (which describes program areas the committee considered but did not simulate). To take a few examples, concerning marriage promotion, family planning, paid family and medical leave, block grants, and mandatory employment programs, the committee judged the evaluation evidence to be insufficient for estimating impacts on child poverty (see Chapter 7). In the case of expanding programs such as the Temporary Assistance for Needy Families (TANF) Program, evidence was lacking on the impacts of the freedom granted to states to spend their block grant funding in many different ways, and as a result we were unable to formulate options for enhancing TANF’s impacts on family income and child poverty. In the case of Medicaid, the committee was constrained primarily by the difficulty of incorporating health insurance into poverty measurement (see Chapter 7).
The scope of the current policy evaluation literature also limited our choice of options in the current chapter. In the case of the minimum wage, for example, there is a fairly robust research consensus concerning the impacts of modest changes to the minimum wage (U.S. Congressional Budget Office, 2014), but there is less agreement about the effects of some of the much larger increases now being implemented in a number of cities (Jardim et al., 2017). Accordingly, we identified minimum wage options that incorporated relatively small increases.
PROGRAM AND POLICY OPTIONS IN 10 AREAS
After reviewing a large number of program and policy options, the committee chose two program options in each of 10 program and policy areas. On the basis of research findings and other information on each program, the committee concluded that all 20 met at least some of its 5 criteria. All 20 could also be simulated with the TRIM3 microsimulation model.
The committee was guided by a number of considerations in setting benefit levels and other features of its programs and proposals. First, in many cases its benefit levels and other parameters had been suggested by
outside experts. Second, as mentioned above, the committee avoided benefit levels that far exceeded the ranges examined in the behavioral effects research literature. This was done out of a concern that the estimated poverty reductions, employment responses, and budgetary costs would be unreliable. Third, the committee used expected budgetary cost as a criterion when choosing generosity levels. It should be emphasized, however, that the committee chose its generosity levels before it was informed of the poverty reductions, budgetary costs, and other results generated by the TRIM3 simulations. Finally, to gauge the sensitivity of estimated poverty reduction and other impacts to program design features, the committee developed two options within each program proposal, differentiated mostly by level of benefits and therefore by cost.
Of the 10 general program areas selected by the committee, 4 of them focus on policies tied to work, namely:
- Modifications to the Earned Income Tax Credit (EITC)
- Modifications to child care subsidies
- Changes in the federal minimum wage
- A scale-up of a promising training and employment program called WorkAdvance
Three other program and policy areas involve modifications to existing safety net programs:
- Supplemental Nutrition Assistance Program (SNAP)
- Housing Choice Voucher Program
- Supplemental Security Income (SSI) Program
Two program ideas come from other countries:
- A child allowance (which can also be thought of as an extension of the federal child tax credit)
- A child support assurance program
Policy area (10) involves modifications to existing immigrant provisions in safety net programs. Finally, given recent interest in a Universal Basic Income policy, we also investigated two versions of this policy; these are discussed in Appendix D, 5-12.
Following our statement of task, at the heart of this chapter are estimates of the poverty-reducing impacts of these policies and programs, including impacts on the levels of 100 percent SPM poverty and 50 percent SPM poverty (“deep” poverty). We also present estimates for impacts on the level of 150 percent SPM poverty (“near poverty”). Our estimates
account for both the resource-enhancing impact of the policies and programs themselves as well as the families’ likely labor-supply responses to them (see Box 5-1).
Labor-supply responses can either magnify or lessen the poverty-reducing potential of programs and policies. An example of the former is the EITC: the policy acts as an earnings subsidy that is eventually phased out. The amount of the earnings subsidy is large—currently providing a 40 percent boost in earned income for a family with two children in the subsidy range. At the same time, the EITC’s structure decreases the credit amount as earnings increase for higher-income earners in the phase-out range. For some nonworkers, the earnings subsidy makes the monetary difference between working and not working large enough to induce them to begin
working. The research literature suggests that, on balance, the increases in work associated with the EITC are larger than the decreases (Hoynes and Rothstein, 2017; Nichols and Rothstein, 2016). The increase in earnings (along with the credit amount) therefore magnifies the poverty-reducing impact of the initial increase in income and can therefore, in some cases, bring a family over the poverty line.
On the other hand, programs like SNAP reduce benefits in response to additional earnings, which may lead some families to cut back on work hours or drop out of the labor market altogether. This response would lower families’ earnings, offsetting some of the initial increase in household resources that the program provided, thereby lessening the initial poverty-reducing impact. A more general explanation of the nature of work-related behavioral responses is provided in Appendix D, 5-1, with details on the relevant behavioral assumptions made for each of the 10 policy and program areas discussed elsewhere in Appendix D and in Appendix F. Complete details on the magnitude of behavioral responses are provided in Appendix E.
For each of our 10 programs, we surveyed the existing research literature and assessed the evidence on behavioral responses and their magnitudes. We first used TRIM3 to simulate the poverty reduction, cost, and other impacts of each policy, not taking into account behavioral responses. Then, based on estimates from the literature, we repeated these simulation taking into account likely labor supply responses. Featured in this chapter are the estimated impacts on poverty, employment, and budgetary cost that account for the estimated behavioral responses generated for the 10 program areas.
MODIFICATIONS EXAMINED FOR 10 POLICY AND PROGRAM AREAS
In this section, we describe proposed changes in the 10 different policy and program areas that we investigated.
1. Modifications to the Earned Income Tax Credit (EITC)
We examined two expansions of the EITC. One modification expands the schedule for the lowest earners, while the second increases the generosity of EITC payments across the entire schedule while maintaining the current range of the phase-out region:
EITC Policy #1: Increase payments along the phase-in and flat portions of the EITC schedule.
EITC Policy #2: Increase payments by 40 percent across the entire schedule, keeping the current range of the phase-out region.
Details on these EITC-based policy options are provided in Appendix D, 5-2.
The EITC is a refundable federal tax credit for low- and moderate-income workers. It was introduced under the Tax Reduction Act of 1975 and has since enjoyed bipartisan support, with expansions passed under each president beginning with Ronald Reagan. The EITC program has been highly successful at encouraging single parents to work1 and at reducing poverty. Our TRIM3-based simulations in Chapter 4 show that, in the absence of behavioral responses, the child poverty rate of 13.0 percent would have been 5.9 percentage points higher if EITC and other tax credits had not been distributed to qualifying families. Additionally, as described in Chapter 3, expansions of the EITC program appear to improve the longer-term health and human capital of children in families receiving the program benefits. All told, the EITC is one of the nation’s most popular and effective poverty-reduction programs.
The EITC has the potential to reduce child poverty in two ways: by supplementing the household incomes of low-earning parents and by encouraging work and thereby increasing the earned income of parents. For workers with low earnings, the value of the EITC grows with each additional dollar of earnings, which creates an incentive for people to enter employment and, for low-wage workers, to increase their work hours.
Our first option was proposed in Giannarelli et al. (2015), based on 2011 data. We adapt their proposal to our 2015 data. The revised credit would have a higher phase-in rate, reach the “plateau” region (where the credit does not increase with earned income) at an earlier point, and begin decreasing at a lower level of earnings (but at the same marginal tax rate). Our second option was chosen to gauge the poverty-reduction impacts of a substantial and uniform expansion of the credit.
2. Modifications to Child Care Subsidies
We examined two expansions of federal programs providing child care assistance, one involving the Child and Dependent Care Tax Credit
___________________
1 A large body of research shows that the presence (or the expansion) of the EITC leads to increases in employment rates of single mothers. For example, see reviews by Eissa and Hoynes (2006), Hotz and Scholz (2003), and Nichols and Rothstein (2016) and studies by Eissa and Liebman (1996), Hoynes and Patel (2017), and Meyer and Rosenbaum (2000, 2001). For example, Meyer and Rosenbaum (2001) find that the EITC raised annual labor force participation by 7.2 percentage points for single women with children relative to single women without children.
(CDCTC) and the other focused on the Child Care and Development Fund (CCDF):
Child Care Policy #1: Convert the CDCTC to a fully refundable tax credit and concentrate its benefits on families with the lowest incomes and with children under the age of 5.
Child Care Policy #2: Guarantee assistance from CCDF for all eligible families with incomes below 150 percent of the poverty line.
Details on these policy options are provided in Appendix D, 5-3.
Child care expenses can be an immovable barrier to employment for low-income parents, particularly when their children are too young to enroll in elementary school. In the United States, the cost of child care for children under age 5 averages about $8,600 per year (Child Care Aware of America, 2017a). This average cost masks considerable variation among states and among regions in what parents actually pay for child care (Child Care Aware of America, 2017b; NASEM, 2018). Costs also vary by age of child (infant care is more expensive than care for older children) and type of care (center-based, home-based, relative or informal care). Between 2012 and 2016, poor families with children under age 6 who paid for child care spent about 20 percent of their income on child care—more than double the national average (Mattingly, Schaefer, and Carson, 2016).
The federal government defrays the cost of child care to working families through two major programs, the CDCTC and the CCDF. The CDCTC is a nonrefundable tax credit that reimburses a portion of the qualifying child care expenses of working parents with children under age 13. Although the fraction of expenses that can be claimed with this credit declines as income increases, there is no income cap for eligibility. And because it is nonrefundable, the credit affects only tax filers with a positive precredit tax liability. In 2013, the largest average benefits of the CDCTC were received by families with annual incomes between $100,000 and $200,000 (Maag, 2013).
The federal CCDF helps to defray child care costs for approximately 1.4 million children and 823,600 families every month (Administration for Children and Families, 2016a). States have the flexibility to determine eligibility criteria, family copay, and provider payment levels, so the costs to families further vary by state. The CCDF comprised two funding sources: discretionary funding provided to states for child care assistance, most of which goes to families with parents working at low-wage jobs (the Child Care and Development Block Grant), and mandatory funding provided outside the annual appropriations process (Administration for Children and Families, 2018).
Existing research on child care programs suggests that any expansion of child care subsidies and vouchers would reduce child poverty, both because child care assistance adds to family resources and because that assistance can make it possible for families to increase their employment and earnings. In fact, higher child care subsidy expenditures by states are associated with increases in labor force participation rates among low-income mothers (Enchautegui et al., 2016), particularly in the case of mothers with young children (Morrissey, 2017) (other references to the research literature showing positive effects of child care subsidies on employment are included in Appendix D, Chapter 5 appendixes). In choosing its levels of expansion, the committee was influenced by proposals suggested by outside experts.
3. Modifications to the Minimum Wage
The committee simulated two minimum wage policy options:
Minimum Wage Policy #1: Raise the current $7.25 per hour federal minimum wage to $10.25 (moving from the current level over the course of 3 years, 2018–2021, and indexing it to inflation after that).
Minimum Wage Policy #2: Raise the federal minimum wage to $10.25 or the 10th percentile of the state’s hourly wage distribution, whichever is lower, and index it to inflation after that.
Details on these two policy options are provided in Appendix D, 5-4.
Increases in the minimum wage have the potential to boost the earned income of low-skilled workers, some of whom reside in families with children and below-poverty household incomes. But by raising the cost of low-skilled workers, minimum wage increases are generally predicted to reduce overall employment and thus also employment opportunities for some workers.
The federal minimum wage was set at $7.25 in 2009, but 30 states (or localities within states) now have higher minimum wages (U.S. Department of Labor, 2019). In 27 of these 30 states, the minimum wage exceeds $10 an hour (Neumark, 2017, Fig. 1). After studying the impact of raising the minimum wage to $10.10, in 2014 the Congressional Budget Office projected employment reductions, although the aggregate earnings losses from this loss of employment would be more than offset by the aggregate earnings gains of higher wages (U.S. Congressional Budget Office, 2014). Once a $10.10 federal minimum was fully implemented, the study projected that it would reduce total employment by about 500,000 workers, or 0.3 percent. But among workers whose earnings would increase to the $10.10 level, most of them—about 16.5 million workers in all—would experience
earnings increases totaling approximately $31 billion annually by the end of 2016.
Because of the untargeted nature of current minimum wage policies, it is difficult to draw conclusions about the distribution of impacts among workers in low- and higher-income families. Several recent trends, however, suggest a relative increase in impacts for workers in lower-income families. First, the share of lower-wage workers who are in their teens has fallen and, at the same time, the average age of low-wage workers has risen, having increased by 2.6 years between 1979 and 2011 (Schmitt and Jones, 2012). In addition, as shown in Chapter 4, there has been growth in the number of unmarried parents in the labor market who are supporting children.
A higher minimum wage could also reduce the federal cost of supporting people who are poor, because higher earnings would reduce outlays on SNAP and housing programs while increasing payroll and income taxes. Conversely, a higher minimum wage could increase the cost of programs like the EITC. The impact of the minimum wage also depends on the overall state of the economy. In tight labor markets, labor shortages and immigration restrictions can push the wages of low-skilled workers above legislated minimum levels. On the other hand, raising the minimum wage too much or too quickly in areas not yet at full employment would likely increase job losses and reduce wage gains.
When determining the level of minimum wage expansion, the committee largely chose to follow the general range of increase suggested by the Congressional Budget Office (U.S. Congressional Budget Office, 2014), which argued that research shows the strongest evidence for that level of expansion. Higher minimum wages have been suggested and have, in fact, been implemented in a number of cities, but the effects of such larger increases are much more uncertain (e.g., Jardim et al., 2017). The minimum-wage levels chosen were also influenced by other factors detailed in Appendix D, Chapter 5 appendixes.
4. Scaling Up the WorkAdvance Program
WorkAdvance is perhaps the leading example of the new “sectoral” training approach, in which program staff work closely with employers to place disadvantaged individuals with moderate job skills into training programs for specific sectors that have a strong demand for local workers.2 We examine two policy options for scaling up the WorkAdvance Program to a national level. Because the research evidence on WorkAdvance is much stronger for adult men than for adult women, our proposals and policy simulations focus on men, with the understanding that actual policy would
___________________
offer the program more broadly. Specifically, our simulations apply the program to all male heads of families with children and income below 200 percent of the poverty line.
WorkAdvance Policy #1: All male heads of families with children and income below 200 percent of the poverty line would be eligible for WorkAdvance programming. Training slots would be created for 10 percent of eligible men.
WorkAdvance Policy #2: All male heads of families with children and income below 200 percent of the poverty line would be eligible for WorkAdvance programming. Training slots would be created for 30 percent of eligible men.
Details on these policy options are provided in Appendix D, 5-5.
As shown by the rates of “market-income poverty” discussed in Chapter 4 (refer to Figure 4-1), earnings alone are insufficient for many families to lift themselves out of poverty. While one strategy for boosting the incomes of low-income working families focuses on benefit programs such as the EITC and the Child Tax Credit, another involves training and employment programs designed to increase the job skills and employability of low-skilled workers, thereby boosting the market wages they can earn.
Aside from programs that provide work incentives in the form of benefit payments, most governmental efforts at increasing work have involved training and employment programs, some associated with the receipt of benefits from a welfare program and some not (Barnow and Smith, 2016; Lalonde, 2003). The two best known among these programs are the Workforce Investment Act (WIA; now superseded by the Workforce Innovation and Opportunity Act, WIOA) and the Job Corps Program. Evaluations have shown that many of these programs have modest but positive impacts on employment and earnings among both youth and adults, but that neither the programs nor the evaluations focus on low-income parents with children.
The Career Academies Program was developed more than 40 years ago to keep high school students engaged in school and prepare them for postsecondary education and careers.3 Evaluations of the Career Academies Program have shown positive earnings impacts, but here again the program does not focus on the group of interest to this report—low-income families with children—and there are also doubts as to whether the Career Academies Program can be scaled up to be a national program (Schaberg, 2017).
___________________
3 For more information about MDRC’s evaluation of Career Academies, see https://www.mdrc.org/project/career-academies-exploring-college-and-career-options-ecco#overview.
Apprenticeship programs have frequently been mentioned in recent policy debates, but virtually none of them has been evaluated in a rigorous way. Mandatory employment programs for welfare recipients have been evaluated rigorously, but only in the context of the now-defunct Aid to Families with Dependent Children Program (see Chapter 7 for a more extensive discussion).
Despite that paucity of evidence, the committee judged that for one employment program—called WorkAdvance—the evaluation evidence was sufficiently encouraging that we could feature an expansion of it as one of the program and policy options in this chapter. The outside experts consulted by the committee recommended simulating the effects of implementing WorkAdvance.
The random-assignment evaluation of WorkAdvance showed that it increased work and earnings across most of its sites (Hendra et al., 2016; Schaberg, 2017; see details in Appendix D, 5-5). The evaluations of WorkAdvance tracked the outcomes for enrolled men in all four sites, but for significant numbers of women in only one of the four sites. Moreover, the earnings impacts for men in the training site that also included women were very different from the impacts among men enrolled at the other three sites. The results for women were therefore considered too statistically unreliable to be featured in this report. We have no evidence-based reason to want to limit the chapter’s program options to men, but the nature of the evidence required us to do so.
5. Modifications to the Supplemental Nutrition Assistance Program (SNAP)
We examine two alternative expansions of the current SNAP program.
SNAP Policy #1: Increase SNAP benefits by 20 percent for families with children, make adjustments for the number of children age 12 and above in the home ($360 more per teenager per year), and increase the Summer Electronic Benefit Transfer for Children (SEBTC) ($180 more per child per summer in prekindergarten through 12th grade).
SNAP Policy #2: Increase SNAP benefits by 30 percent, make adjustments for the number of children age 12 and above in the home ($360 more per teenager per year), and increase the Summer Electronic Benefit Transfer for Children (SEBTC) ($180 more per child per summer in prekindergarten through 12th grade).
Details on these two policy options are provided in Appendix D, 5-6.
Evidence reviewed in Chapter 3 suggests that receipt of benefits from SNAP (and its predecessor program, Food Stamps) improves outcomes for children, adults, and families in their nutrition, food security, and health. Child health outcomes show improvements right away, while adult health shows improvements in the longer term. Additionally, as shown in Chapter 4, SNAP lifts more children out of deep poverty than any other program, and only the EITC (and other tax credits) lifts more children out of 100 percent poverty than SNAP. SNAP is therefore of central importance for reducing child poverty.
The committee considered three policy elements regarding SNAP: adequacy of benefits, adjustment for ages of children, and children’s extra food needs in the summer months. Here we provide a brief review of these elements; a more complete literature review is provided in Appendix D, 5-6.
A growing body of evidence suggests that SNAP benefit levels are inadequate to provide most recipient families with food security. In 2017, more than one-half (58%) of families receiving SNAP reported food insecurity (Coleman-Jensen et al., 2018), and many families exhaust their SNAP benefits before the end of the month. A second rationale for increasing benefit levels is that the time required for food preparation is too burdensome for working families. SNAP benefit levels are based on the USDA’s “thrifty food plan,” which research has shown requires between 13 and 16 hours per week of food preparation (Ziliak, 2016).4 This is impossibly high for adults who are working full time; in fact, almost no parents currently spend anywhere close to that amount of time on food preparation. Adults who work must instead economize on their time, and this means purchasing more expensive, processed foods.
A second policy issue is that as currently designed, SNAP adjusts benefits to account for the age of the children in the home (Ziliak, 2017). Dietary requirements for teenagers are almost as high as for adults, and food insecurity has been shown repeatedly to be higher among families with teenagers (Nord, 2009). Anderson and Butcher (2016) suggest that an additional $30 SNAP benefit per month per teenager would meet those needs.
SNAP’s SEBTC is designed to address food gaps for children during the summer, when they lack access to school-based food assistance programs. USDA pilot tests have found that a $60 per eligible child per month increment in benefits reduced food insecurity among children by 26 percent (Collins et al., 2016).
The committee chose its levels of SNAP expansion based on several criteria. First, several outside experts recommended increasing the general range we had proposed, and much of the research literature on the positive
___________________
4 For more information about USDA’s food plans, see https://www.cnpp.usda.gov/USDAFoodPlansCostofFood.
effects of SNAP focused on increases within the proposed range. Another factor was expected budgetary cost; the committee believed that this should be considered in constraining the scope of our proposal increases. We also considered the range of behavioral responses estimated in the research literature, which the committee felt would not be sufficiently reliable at levels considerably higher than those it chose. The levels we ultimately chose were similar to those proposed to the committee by Ziliak (2017). Further considerations used in choosing the levels are detailed in Appendix D, Chapter 5 appendixes.
6. Modifications to Housing Programs
We examine two expansions of the Housing Choice Voucher Program:
Housing Voucher Policy #1: Increase the number of vouchers directed to families with children so that 50 percent of eligible families not currently receiving subsidized housing would use them.
Housing Voucher Policy #2: Increase the number of vouchers directed to families with children so that 70 percent of eligible families not currently receiving subsidized housing would use them.
Details on these two policy options are provided in Appendix D, 5-7.
The cost of housing plays a key role in the calculation of the SPM poverty thresholds, because adequate housing is essential to having an adequate standard of living for low-income families. Among low-income renters in the United States, 67 percent of their income went toward rent in 2012 (Collinson, Ellen, and Ludwig, 2016, Table 2.4), and such rising housing costs for poor families have resulted in a high rate of eviction and housing displacement among families with children (Desmond, 2016).
Despite the dozens of federal programs designed to help meet the housing needs of low-income families, only one-quarter of eligible households participate in them (U.S. Congressional Budget Office, 2014), the three largest being the Housing Choice Voucher Program, public housing, and the Low-Income Housing Tax Credit (LIHTC). Although public housing has been declining for many years, in terms of both the number of recipients and expenditures, the housing voucher program has been expanding. The housing voucher program served a little more than 2 million families with expenditures of $18 billion in 2014. The LIHTC has also increased in size, with almost 2 million units placed in service at a tax expenditure cost of $7 billion in 2014 (U.S. Congressional Budget Office, 2014).
The most vexing feature of housing programs is that only a fixed number of vouchers, public housing units, and LIHTC-built units are
available. This has led to long waiting lists for assistance from these housing programs—particularly in the case of housing vouchers—to the extent that in some cases the waiting lists have had to be closed to additional applicants. In 2012, 4.9 million households were on waiting lists for housing vouchers and 1.6 million households were on waiting lists for public housing (Collinson, Ellen, and Ludwig, 2016). About three-quarters of families who qualify for benefits do not receive them.
We limit the voucher take-up rate to 70 percent in Housing Voucher Policy #2, in keeping with a report by the U.S. Department of Housing and Urban Development (HUD), showing that a maximum of 70 percent of families who are offered vouchers end up finding an apartment and actually using the vouchers (Finkel and Buron, 2001). Our 50 percent simulation (Policy #1) is simply a smaller and less expensive version of the 70 percent policy. For both simulations, current income eligibility limits and rent payment formulas would remain as they were in 2015.
The committee chose to model expansions of voucher availability rather than other modifications, such as an increase in the level of housing subsidies, primarily because most experts agree that limited availability is currently the primary barrier preventing subsidized housing programs from having a larger impact on poverty reduction. As noted above, the 70 percent take-up rate chosen for simulation by the committee represents the maximum take-up rate possible, and hence no higher level could be simulated. In addition, there is as yet no consensus among researchers as to whether existing housing subsidy levels set by the government are sufficiently aligned with true market rents faced by low-income families; as a result, a simulation of changes in subsidy levels would produce uncertain results. The committee was also influenced by the recommendations of outside experts with respect to levels, as detailed in Appendix D, Chapter 5 appendixes.
7. Modifications to the Supplemental Security Income (SSI) Program
We examine two child-focused modifications to the SSI program, both of which involve increases to current child benefit levels:
SSI Policy #1: Increase by one-third the maximum child SSI benefit (to $977 per month from a current baseline of $733).
SSI Policy #2: Increase by two-thirds the child SSI benefit (to $1,222 from a current baseline of $733).
Details on these two policy options are provided in Appendix D, 5-8.
SSI is a federal assistance program designed for three categories of low-income individuals: the elderly, disabled nonelderly adults, and disabled children. In 2016, about 1.2 million children under age 18 received benefits from SSI, with an average monthly payment of $649.58 (U.S. Social Security Administration, 2017). As seen in Chapter 4, the SSI program plays a noteworthy role in alleviating both child poverty and deep child poverty.
Child SSI benefit levels are low relative to the additional out-of-pocket costs families incur when providing care for a disabled child (Kuhlthau et al., 2005). Families who care for a child with special health care needs also incur significant costs in the form of their own lost earnings. For instance, Romley and colleagues (2017) estimate that families provided 1.5 billion hours of health care annually to children with special health care needs, which in turn reduced their earnings by $17.6 billion (in 2015 dollars), or $3,200 per child per year.
Child SSI recipients are among the nation’s most vulnerable children, with diagnoses such as intellectual disability, Down Syndrome, cerebral palsy, and blindness (see Appendix D, Table 5-2, for a list of diagnostic groups of 2016 child SSI recipients). Only 1.7 percent of all children receive SSI benefits; to qualify, children need to meet stringent medical eligibility criteria based on a physician’s functional assessment (Romig, 2017).5 Moreover, family incomes need to be below 100 percent of the federal poverty line for a child to qualify for full benefits. Benefits decline as earnings rise, with eligibility phasing out completely at about 200 percent of the federal poverty level (Romig, 2017).6 In addition, family assets can be no higher than $2,000, if the child lives with one parent, and $3,000, if the child lives with two parents.
The levels of the benefit increases chosen by the committee are based on the recognition that current income eligibility levels in the child SSI program are only slightly above those for families without disabled children. Consequently, at present the program implicitly assumes that families with disabled children need very little in additional resources to care for such children. Increases in benefit levels would address that concern.
___________________
5 Child SSI eligibility rules have undergone several important changes in its history, including major changes in congressional legislation in the 1990s, that have generated extensive discussion regarding whether eligibility determinations should be altered (Daly and Burkhauser, 2003; Duggan, Kearney, and Rennane, 2016). We confine our recommendations to changes in benefit levels and do not consider possible change in eligibility rules, which would be quite complex.
6 This varies by a number of factors including whether it is a one- or two-parent family, the number of children in the family, and by earned or unearned income.
8. A Child Allowance Program
A child allowance is a monthly cash payment to families for each child living in the home. We consider two child allowance options:
Child Allowance Policy #1: Pay a monthly benefit of $166 per month ($2,000 per year) per child to the families of all children under age 17 who were born in the United States or are naturalized citizens. In implementing this new child allowance, we would eliminate the Child Tax Credit and Additional Child Tax Credit as well as the dependent exemption for children. The child allowance benefit would be phased out under the same schedule as the Child Tax Credit.
Child Allowance Policy #2: Pay a monthly benefit of $250 per month ($3,000 per year) per child to the families of all children under age 18 who were born in the United States or are naturalized citizens. (As with Child Allowance Policy #1, we would eliminate the Child Tax Credit and Additional Child Tax Credit as well as the dependent exemption for children.) The child allowance benefit would be phased out between 300 and 400 percent of the poverty line.
Details on these two policy options are provided in Appendix D, 5-9.
A child allowance is a monthly cash payment to families for each child living in the home. When offered universally (to all families with children), child allowances do not stigmatize low-income beneficiaries, but instead have the potential to integrate them into the social mainstream (Garfinkel, Smeeding, and Rainwater, 2010; Kumlin and Rothstein, 2005; and Rainwater, 1982). Because child allowance benefits are not reduced as earnings increase (at least not until incomes reach 300 percent of the poverty line in our Policy #2), they provide a more secure floor than means-tested benefits, one that does not penalize intermittent work. At least 17 rich nations (including all of the English-speaking countries discussed in Chapters 2 and 4, other than the United States) have some form of a child allowance.
The U.S. federal tax system’s current $2,000 child tax credit (up from $1,000 beginning in 2018) is akin to a once-a-year child allowance. Most families with children benefit from its $2,000 per child reduction in taxes. But these benefits are not universal: Families with no or very low incomes (and the very rich) are not eligible. We effectively convert the current Child Tax Credit into a nearly universal child tax credit by extending eligibility to receive the same ($2,000 per year) amount per child to include those with low or no earnings. Further, we convert the nearly universal child tax credit to a nearly universal child allowance by paying the benefit on a monthly basis, because doing so enhances a family’s economic security (see Chapter 8).
When determining the appropriate level of the child allowance, it is important to balance poverty reduction and expected cost (Schaefer et al., 2018). The levels we specify are modest relative to those in many other countries and are intended to limit budgetary costs. We propose two alternative levels and gauge their impact on the poverty reduction and cost.
9. A Child Support Assurance Program
The committee simulated two variants of a policy option proposed by Cancian and Meyer (2018):
Child Support Assurance Policy #1: Set guaranteed minimum child support of $100 per month per child.
Child Support Assurance Policy #2: Set guaranteed minimum child support at $150 per month per child.
Details on these two policy options are provided in Appendix D, 5-10.
More than one-half of today’s children will likely spend some time living with a single parent (Bumpass and Raley, 1995), mostly with a single mother (Vespa, Lewis, and Kreider, 2013), and increasingly with mothers who have never been married (Child Trends, 2016). Child support—financial support provided by the nonresident parent (most often the father)—is an important source of income for custodial parents (Administration for Children and Families, 2016b). However, the potential anti-poverty effectiveness of child support is undermined by the unstable employment of many nonresident parents and their failure to comply fully with child support orders. Our proposals here are for a publicly financed minimum child support benefit.
Single-mother households, and never-married mothers in particular, are much more likely to be poor than two-parent households (McLanahan, 2009). Children in single-parent families are disadvantaged compared with children in two-parent families precisely because there is only one parent and hence only one potential earner. In the United States, individual states and the federal government have already substantially strengthened enforcement of noncustodial child support orders (Garfinkel, 1994a). Enforcing private support is important because it reinforces social norms regarding the obligations of parents to provide financial support for their children.
As an anti-poverty tool, child support enforcement is inherently limited, because child support from fathers with low and irregular incomes tends to be low and irregular. This is not to say that all fathers of the children who live with low-income mothers are themselves poor or near poor or that child support enforcement has no role to play. In 2015, private child
support reduced the number of poor children by nearly 800,000 (Renwick and Fox, 2016). Despite improvements in child support enforcement over the last 40 years, however, it is still the case that fewer than one-half of all custodial parents who are supposed to receive child support receive all the support that is due to them, and more than a quarter receive nothing in a given year (Grall, 2018). An “assured child support benefit” would increase the amount and regularity of child support and also would likely reduce the dependence of single mothers on TANF and other safety net programs.
Drawing from the experience of Sweden (Garfinkel, 1994b), a publicly financed minimum child support benefit—one that is conditional on the custodial parent being legally entitled to receive private child support—reduces the poverty and insecurity of single mothers and their children. It also increases mothers’ incentives to cooperate in identifying the fathers of their children, establishing paternity, and securing a child support award (Cancian and Meyer, 2018; Garfinkel et al., 1990; Garfinkel, Meyer, and Sandefur, 1992; Schroeder, 2016). It may also reduce the father’s incentive to pay child support. Little is known about the magnitudes of these incentive effects.
The $150 guaranteed minimum per child we propose is based on Cancian and Meyer (2018), who argue that it would provide a minimum level of support for families with children, enabling them to meet monthly expenses in the absence of the same amount of support from noncustodial parents, but it would exceed the level of support based on other criteria. Cancian and Meyer also propose requiring a certain standard of support from noncustodial parents, but that part of their proposal is not directly related to our focus: the poverty rate of families with children. We also choose an alternative—slightly lower—level of minimum support, $100 per child, to gauge the effect of the level on costs and poverty reduction.
10. Modification to Immigrant Policies
Given the demographic importance of children of immigrants and restricted program eligibility for unauthorized and nonqualified immigrants, the following changes were simulated:
Immigrant Policy #1: Restore program eligibility for nonqualified legal immigrants. This option would eliminate eligibility restrictions for nonqualified parents and children in the SNAP, TANF, Medicaid, SSI, and other means-tested federal programs.
Immigrant Policy #2: Expand program eligibility for all noncitizen children and parents. This option would eliminate eligibility restrictions
for all noncitizen parents and children in the SNAP, TANF, Medicaid, SSI, and other means-tested federal programs.
Details on these two policy options, as well as more information on the policy background regarding immigrant eligibility for anti-poverty programs, are provided in Appendix D, 5-11.
Nearly one-quarter (24.7% as of 2014) of U.S. children live in an immigrant family, defined as a family where at least one parent is foreign-born and/or the child is foreign-born, and 10.2 percent of children live in noncitizen families, defined as families where at least one parent and/or child is not a U.S. citizen (Urban Institute, Children of Immigrants database). While the vast majority of children in the United States are themselves U.S. citizens, living in a mixed family (one where other members are not citizens) may affect children’s receipt or level of benefits, because noncitizen immigrants are ineligible for various programs.
The Personal Responsibility and Work Opportunity Reconciliation Act of 1996 (PRWORA) established restrictions to immigrant eligibility, such as requiring U.S. residence for at least 5 years, for various categories of immigrants lawfully residing in the United States (National Research Council, 1999; Siskin, 2016). (See Appendix D, Chapter 5 appendixes for details on immigrant eligibility before PRWORA and additional changes associated with PRWORA, such as the expanded definition of “public charge.”) Several of these restrictions were eliminated soon after welfare reform, but others remain (Singer, 2004). The programs affected are SNAP, TANF, Medicaid, SSI, and in general means-tested federal programs. Even when immigrants are eligible, they may fail to apply for benefits because of their limited awareness of their eligibility or due to a fear of deportation or of compromising their ability to apply for citizenship if they become a “public charge” (e.g., Alsan and Yang, 2018; Watson, 2014).
With children in immigrant families representing one-fourth of the U.S. child population and having higher poverty rates than children in nonimmigrant families, the committee proposed two changes to immigrant program eligibility with considerable potential for reducing poverty among children in immigrant families. These proposals were also chosen to address another criterion the committee set for itself: social inclusion. Under the current policy regime, restrictions to legal immigrants’ eligibility may increase poverty rates among children in immigrant families, the vast majority of whom are U.S. citizens. Additionally, some groups of legal immigrants who are income eligible are currently denied access to programs solely on the basis of their immigrant status.
IMPACTS ON POVERTY, COST, AND EMPLOYMENT
With two options for each of 10 program and policy areas, we have offered many different ideas for reducing child poverty. Several key questions remain: If implemented, how successful would they likely be at achieving that goal? How do the costs of the various programs compare? And what would be their impacts on earnings and employment?
This final section provides a summary of the projected impacts of these approaches along three key dimensions: (1) child poverty reduction; (2) budget cost; and (3) earnings and jobs. We conclude with a summary and comparison of each of these impacts for all 10 of our program areas, including information on social inclusion, which was part of one of the criteria identified in Chapter 1. Details on our simulation assumptions and results are provided in Appendixes E and F.
Child Poverty Reduction
The core of the committee’s statement of task is poverty reduction. Which of the program and policy options, individually or in combination, would reduce child poverty by one-half in 10 years? The committee has considered three poverty lines, all defined using the SPM: 100 percent of SPM (“poverty”), 50 percent of SPM (“deep poverty”), and 150 percent of SPM (“near poverty”). As with the data presented in prior chapters, our estimates of poverty reduction are based on the TRIM3 simulation model, which adjusts for underreporting of a number of important income sources.7
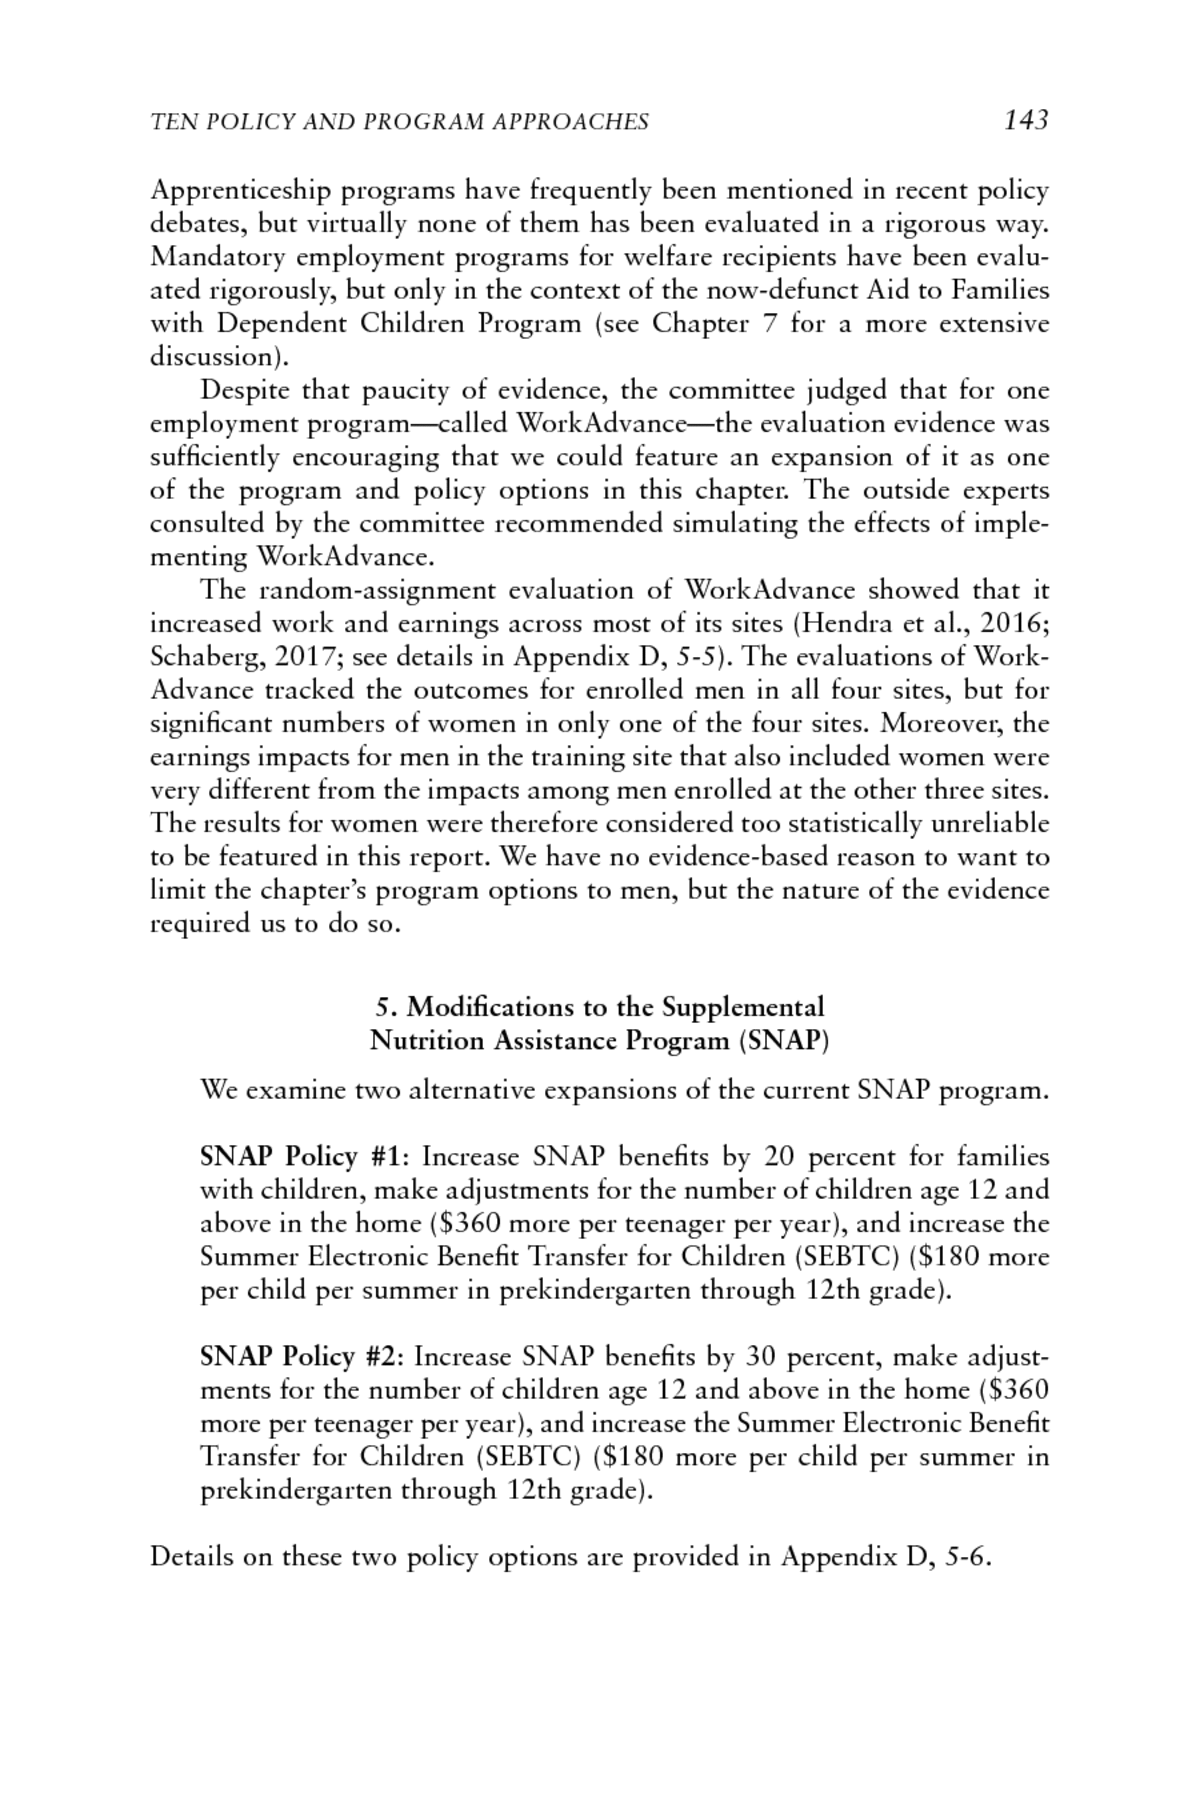
Figure 5-1 shows percentage point reductions in child poverty defined by 100 percent of the SPM threshold. While the committee’s goal of reducing child poverty by one-half would require a 6.5 percentage point drop (from 13.0 to 6.5%), it is clear that none of the program and policy options we discuss was estimated to achieve this goal on its own. The more substantial child allowance option, which would replace the child tax credit and child tax exemption with a universal $3,000 payment per child per year, comes closest. It would generate a 5.3 percentage point reduction in poverty. The less substantial child allowance option (with a $2,000 annual payment, lower maximum eligibility age, and different phase-out) is estimated to produce a 3.4 percentage-point poverty reduction.
Funding housing vouchers to the point that 70 percent of eligible nonparticipating families with children would receive them would produce a
___________________
7 Our poverty-reduction estimates are based on annual income. We therefore ignore issues related to the timing of income and benefits within the year as well as other administrative and implementation details surrounding each policy. See Chapter 8 for a discussion of the importance of intra-year income instability and of cumbersome enrollment procedures.
NOTE: EITC = Earned Income Tax Credit; SNAP = Supplemental Nutrition Assistance Program; SSI = Supplemental Security Income.
SOURCE: Estimates from TRIM3 commissioned by the committee.
3.0 percentage-point poverty reduction, while the less substantial housing voucher program and the more substantial EITC and SNAP policy options would each reduce poverty by at least 2 percentage points. The less substantial proposals for expanding the EITC, SNAP, the Child and Dependent Care Tax Credit, and immigration eligibility would all reduce child poverty by at least 1 percentage point.
These differential effects reflect the varying size of the proposed increases in benefits for the programs in question, the varying breadth of program coverage, and behavioral effects. The larger effects achieved by the child allowance, EITC, and SNAP programs result in part from the significant increases in benefits in our program proposals. Those benefit increases are much larger than the increases proposed in the child support assurance proposal or the earnings increases that would accrue from a higher minimum wage. But the greater poverty-reducing impacts of these three proposals, as well as the 70 percent housing voucher program, also reflect their near-universal coverage of low-income families with children. Much smaller fractions of the target population—children living in low-income families—would be affected by an increase in the minimum wage, an expansion of the WorkAdvance Program, or our proposed expansions of the SSI program.
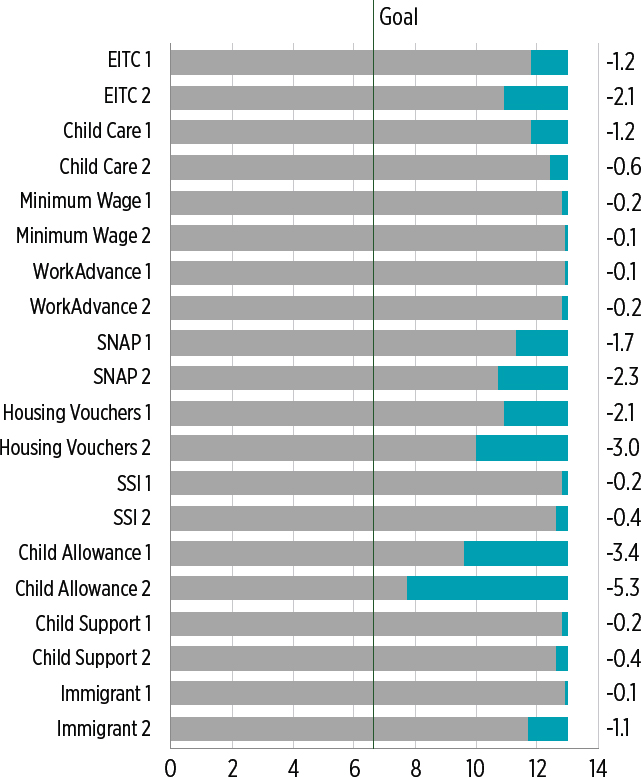
In the case of deep (under 50% of SPM) poverty (see Figure 5-2), the $3,000 child allowance option is estimated to produce the biggest impact by far. Reducing deep poverty by 1.4 percentage points would cut the estimated rate of deep poverty by one-half (from its initial level of 2.9%), thus all but meeting our mandated 50 percent reduction goal for deep poverty. The SNAP and housing voucher proposals, as well as the less generous child allowance proposal, would reduce deep poverty by at least one-half of a percentage point. The EITC and child care proposals have much smaller comparative impacts on deep poverty than on 100 percent poverty, because those programs are targeted toward workers, and families in deep poverty have less connection to the labor market. The minimum wage, WorkAdvance, SSI, and immigrant policy proposals would have little impact on the number of children living in deep poverty.
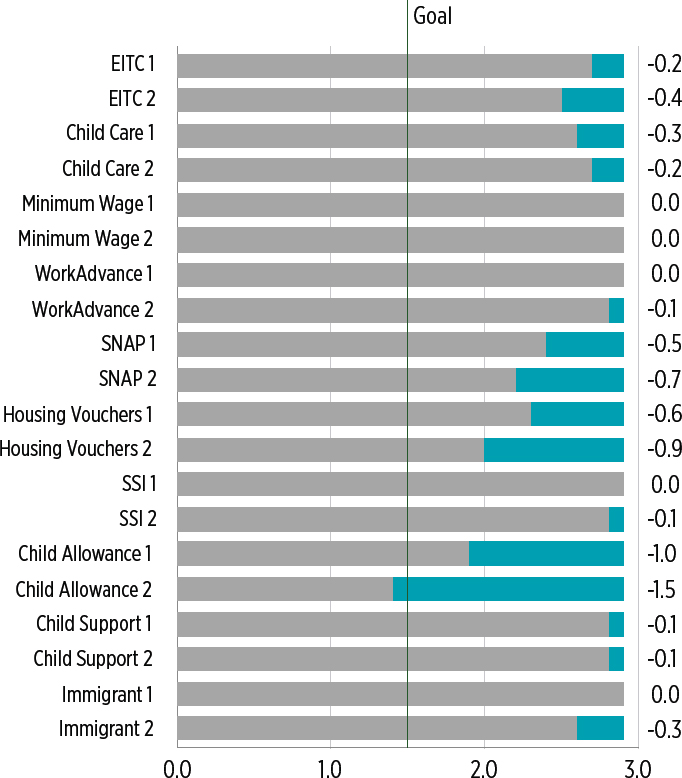
Figure 5-3 shows the impacts of the program on near poverty, defined as below 150 percent of the SPM. For the majority of the programs we have proposed, the reduction in poverty at this level is smaller than the reduction based on a 100 percent poverty line (and sometimes substantially so) because the income eligibility thresholds for the proposals are rarely much higher than 100 percent of SPM poverty. The programs with impacts on families living under 100 percent and under 150 percent of poverty that differ the least are the two child allowance proposals, both of which have high income thresholds and hence relatively large impacts on near poverty.
NOTE: EITC = Earned Income Tax Credit; SNAP = Supplemental Nutrition Assistance Program; SSI = Supplemental Security Income.
SOURCE: Estimates from TRIM3 commissioned by the committee.
NOTE: EITC = Earned Income Tax Credit; SNAP = Supplemental Nutrition Assistance Program; SSI = Supplemental Security Income.
SOURCE: Estimates from TRIM3 commissioned by the committee.
CONCLUSION 5-1: Using a threshold defined by 100 percent of the Supplemental Poverty Measure, no single program or policy option developed by the committee was estimated to meet the goal of 50 percent poverty reduction. The $3,000 per child per year child allowance policy comes closest, and it also meets the 50 percent reduction goal for deep poverty.
CONCLUSION 5-2: A number of other program and policy options lead to substantial reductions in poverty and deep poverty. Two involve existing programs—the Supplemental Nutrition Assistance Program and housing vouchers. The option of a 40 percent increase in Earned Income Tax Credit benefits would also reduce child poverty substantially.
Tradeoffs Among Poverty Reduction, Budget Cost, and Employment
The policy and program options we have analyzed present tradeoffs for policy makers to consider. Some options achieve greater reduction in child poverty but at significant budgetary cost, while other options increase employment and earnings but move fewer children out of poverty. We first look at poverty reduction and cost tradeoffs and then consider the tradeoffs between poverty reduction and changes in employment and earnings.
Figure 5-4 shows the poverty reduction/budget cost tradeoffs among the program and policy options developed by the committee by plotting budget cost on the vertical axis and the number of children lifted above the 100 percent SPM poverty line on the horizontal axis. Costs shown in Figure 5-4 are based on the tax code prevailing in 2015; costs using the 2018 tax code
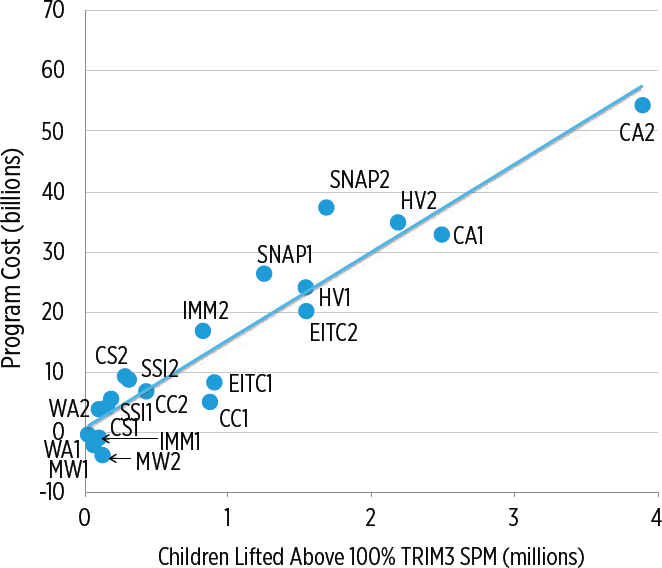
NOTE: CA = Child Allowance; CC = Child Care; CSA = Child Support Assurance; EITC = Earned Income Tax Credit; HV = Housing Vouchers; IMM = Immigrant; MW = Minimum Wage; SNAP = Supplemental Nutrition Assistance Program; SSI = Supplemental Security Income; WA = WorkAdvance. Administrative costs are included for WA but not for other programs. Program costs are based on the tax code prevailing in 2015.
SOURCE: Estimates from TRIM3 commissioned by the committee.
are provided in Appendix E and are generally quite similar. The trend line divides programs into those that cost relatively more per child moved out of poverty (above the line) and those with a lower-than-average cost per child (below the line). Program summaries and abbreviations are given in Box 5-2.
As might be expected, there is a strong positive relationship between cost and the number of children moved out of poverty. Using the results across all of our policies and programs, moving a million children out of poverty (which reduces the current rate of 100% of SPM-based child poverty—13.0%—by roughly 1.3 percentage points) costs an average of about $15 billion per year. Some programs, such as the SNAP expansions, lie above the regression line, implying that they have higher-than-average costs per child moved out of poverty. This is due in part to the fact that the behavioral effects of these programs lead to reductions in earnings.
While Figure 5-4 focuses on the number of children brought above the 100 percent SPM poverty line, we note that our proposed expansions would help to narrow the “poverty gap” of poor children by raising their families’ incomes even when the increases are not sufficient to lift them above the poverty line. Most of these proposed expansions would also raise the incomes of many families with incomes between 100 and 150 percent of SPM poverty. Program expansions with higher-than-average costs have different impacts on lower-income families (relative to higher-income families) than other programs have, and as a result they lift relatively fewer family incomes above the poverty line.
The EITC and the Child and Dependent Care Tax Credit expansions (the latter is labeled “CC1” in the figure) lie below the regression line. These programs cost less than average because part of their poverty-reducing
impact comes from the behavioral effects of increased earnings.8 Taxes paid on these earnings reduce net government costs, while at the same time the increased earnings triggered by work incentives add to family income. Similarly, the two minimum wage policies actually reduce net government expenditures, owing to the fact that they increase earnings, so tax revenues on the earnings increase and expenditures on benefits from transfer programs decrease. At the same time, these minimum wage policies do not lift many children above the poverty line.
The majority of the programs fall under one of two clusters: a cluster of policy and program proposals that not only cost under $10 billion per year but also move relatively few children out of poverty, and a cluster of proposals that not only cost more but also lift more children out of poverty. In the former category are the reforms related to SSI, child care, one of the immigrant reforms, minimum wage expansions, child support assurance reforms, and the less substantial EITC expansion. None of these programs was estimated to lift more than 1 million children out of poverty.
In the second cluster are the SNAP and housing expansions, the more substantial EITC expansion, and the $2,000 per child per year child allowance proposals. These programs would move between 1 to 3 million children out of poverty, at a cost ranging from $20 to $40 billion. The $3,000 per child per year child allowance would move almost 4 million children out of poverty, but it would do so at a cost of $54 billion.
CONCLUSION 5-3: Programs producing the largest reductions in child poverty are estimated to cost the most. Almost all of the committee-developed program options that lead to substantial poverty reduction were estimated to cost at least $20 billion annually.
Policy Tradeoffs with Earnings. Tradeoffs between poverty reduction and annual earnings changes are shown in Figure 5-5.9 As in Figure 5-4, the horizontal axis shows the number of children brought above the 100 percent SPM poverty line by the given program or policy option, but here the vertical axis shows estimated changes in earned income brought about by the behavioral responses to the introduction of the respective program
___________________
8 Details concerning poverty reduction, cost, and employment and earnings changes in the absence or presence of behavioral responses can be found in Appendix E. Some effects are quite substantial. For example, in the case of the first child care policy, which would expand the Child and Dependent Care Tax Credit, the induced employment changes not only increase poverty reduction but also increase government cost by roughly a factor of four but also nearly triple program costs.
9 As shown in Appendix E, tradeoffs between poverty reduction, earnings, and employment are affected very little by the 2018 tax reforms. Accordingly, only the 2015 tax law simulation results are shown in Figures 5-5 and 5-6.
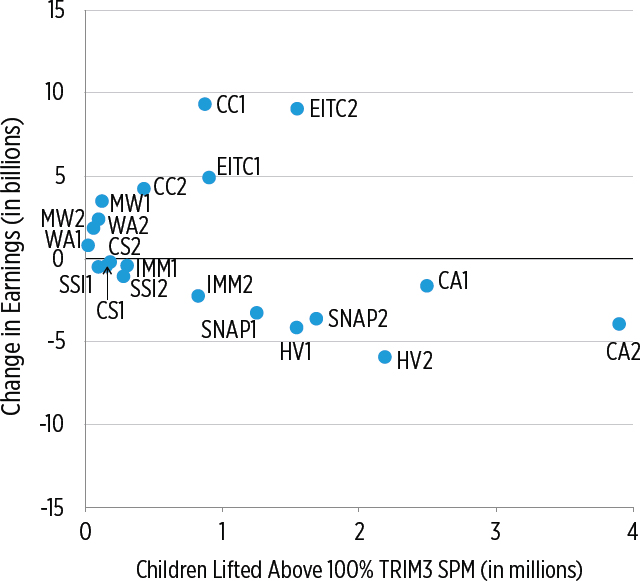
NOTES: Earnings changes are limited to individuals living in households with incomes below 200 percent of SPM poverty. CA = Child Allowance; CC = Child Care; CSA = Child Support Assurance; EITC = Earned Income Tax Credit; HV = Housing Vouchers; IMM = Immigrant; MW = Minimum Wage; SNAP = Supplemental Nutrition Assistance Program; SSI = Supplemental Security Income; WA = WorkAdvance.
SOURCE: Estimates from TRIM3 commissioned by the committee.
or policy. It is important to note that the earnings and employment changes plotted here are limited to workers in low-income families, defined as having family incomes below 200 percent of SPM poverty. This restriction was imposed because a few of the policy proposals—especially the two involving the minimum wage—would boost the earnings of workers in middle- and even high-income families.10
___________________
10 In the case of Minimum Wage Policy #1, for example, earnings would increase by more than $12 billion per year overall, but only a quarter of that amount would be gained by workers in low-income households. The committee judged that the behavioral responses among low-income families would be much more relevant to our study than the behavioral responses in other portions of the income distribution.
Earnings changes vary widely—from a nearly $6 billion drop in aggregate earnings in the case of Housing Voucher Policy #2 to more than a $9 billion increase in aggregate earnings in the cases of EITC Policy #2 and Child Care Policy #1. Apart from the minimum wage proposals, proposals for programs and policies that gear benefits to earned income are estimated to produce the greatest increase in earnings, in this case in the $4 billion to $10 billion range. By contrast, SNAP, subsidized housing, and child allowance programs are estimated to reduce earnings by amounts ranging from $1 billion to $6 billion.
An interesting combination of substantial reductions in the number of poor children and substantial earnings increases is projected for Child Care Policy #1, which converts the Child and Dependent Care Tax Credit into a fully refundable tax credit. It would reduce the number of poor children by nearly 1 million and increase total earnings by $9.3 billion, an amount that would exceed the cost of the program (estimated at $5.1 billion).
Policy Tradeoffs with Employment. Tradeoffs between poverty reduction and changes in employment are shown in Figure 5-6. As in Figure 5-5, employment changes plotted here are limited to workers in families with income less than twice the 200 percent SPM poverty line. With one notable exception, the patterns are similar to those found for changes in earnings. In general, work-based programs increase employment and benefits-based programs reduce employment. More notably, our expansions of the CDCTC and the more generous version of the EITC would increase net employment by more than 500,000 jobs.11 The exception is our minimum wage proposals, both of which increase earnings but are estimated to reduce employment in the 28,000 (MW2) to 42,000 (MW1) range.
CONCLUSION 5-4: Projected changes in earnings and employment in response to simulations of our program and policy options vary widely, but taken as a whole they reveal a tradeoff between the magnitude of poverty reduction and effects on earnings and employment. Work-based program expansions involving the Earned Income Tax Credit and the Child and Dependent Care Tax Credit were estimated to increase earnings by as much as $9 billion and employment by as many as half a million jobs. Programs such as the child allowances and expansions of the housing voucher program were estimated to reduce earnings by up to $6 billion and jobs by nearly 100,000. The bulk of the remaining program and policy proposals are estimated to evoke more modest behavioral responses.
___________________
11 Jobs include full- and part-time jobs. For more details, see Appendix F, the TRIM3 Technical Appendix.
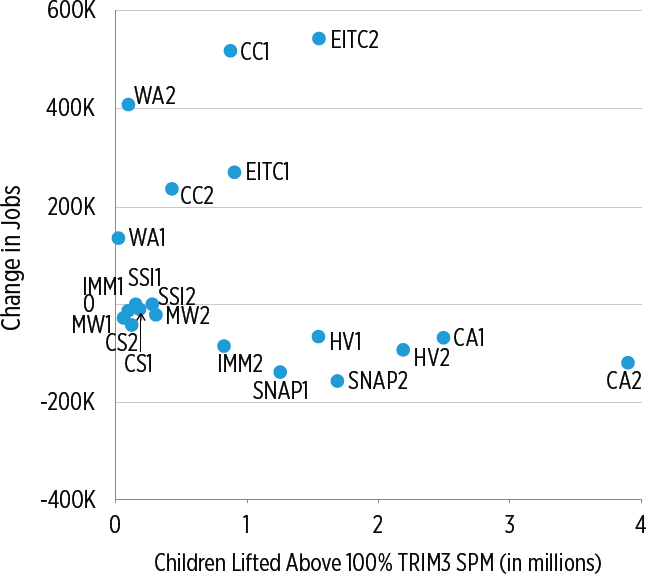
NOTES: Job changes are limited to individuals living in households with incomes below 200 percent of SPM poverty. CA = Child Allowance; CC = Child Care; CSA = Child Support Assurance; EITC = Earned Income Tax Credit; HV = Housing Vouchers; IMM = Immigrant; MW = Minimum Wage; SNAP = Supplemental Nutrition Assistance Program; SSI = Supplemental Security Income; WA = WorkAdvance.
SOURCE: Estimates from TRIM3 commissioned by the committee.
Impacts Across Demographic Subgroups
With 20 program and policy options and nine demographic subgroups of interest, it is difficult to summarize poverty-reduction patterns in a succinct way. Full details are provided in Appendix D, Tables D5-3, D5-4, and D5-5, and in Appendix E. Perhaps the most important lesson is that all 20 program and policy options reduce child poverty across virtually all groups.
However, the poverty reductions induced by the various policy and program options vary substantially across groups and policies. Table 5-1 provides a summary of poverty reductions by subgroup. The first row of the table repeats the baseline poverty rates for particularly disadvantaged subgroups shown in Chapter 2, which range from about 17 percent for
TABLE 5-1 Simulated Poverty Reduction of Various Programs and Policies Across Demographic Subgroups
| All children | Black | Hispanic | Mother not a HS graduate | No bio parents | Single bio/adoptive parent | No workers | Child not a citizen | Child citizen | Mother < 25 years old | |
|---|---|---|---|---|---|---|---|---|---|---|
| Baseline | 13.0% | 17.8% | 21.7% | 32.5% | 22.9% | 22.4% | 61.5% | 33.3% | 31.5% | 23.8% |
| EITC 1 | -9.2% | |||||||||
| EITC 2 | -16.2% | |||||||||
| Child Care 1 | -9.2% | |||||||||
| Child Care 2 | -4.6% | |||||||||
| Minimum Wage 1 | -1.5% | |||||||||
| Minimum Wage 2 | -0.8% | |||||||||
| WorkAdvance 1 | -0.0% | |||||||||
| WorkAdvance 2 | -0.8% | |||||||||
| SNAP 1 | -13.1% | |||||||||
| SNAP 2 | -17.7% | |||||||||
| Housing Vouchers 1 | -16.2% | |||||||||
| Housing Vouchers 2 | -22.3% | |||||||||
| SSI 1 | -1.5% | |||||||||
| SSI 2 | -3.1% | |||||||||
| Child Allowance 1 | -26.2% | |||||||||
| Child Allowance 2 | -40.8% | |||||||||
| Child Support 1 | -1.5% | |||||||||
| Child Support 2 | -4.6% | |||||||||
| Immigrant 1 | -0.8% | |||||||||
| Immigrant 2 | -8.5% |
NOTES: EITC = Earned Income Tax Credit; SNAP = Supplemental Nutrition Assistance Program; SSI = Supplemental Security Income. The vertical dashes indicate that the proportionate poverty reduction was within 1 percent of the overall reduction; green circles indicate that the reduction was more than 1 percent greater than the overall reduction; and red circles indicate that the reduction was more than 1 percent smaller than the overall reduction.
SOURCE: Committee created based on commissioned analyses of TRIM3.
Black children to more than 60 percent for children in families with no adult workers. Down the first column of the table are the proportionate reductions in overall child poverty associated with each of the program and policy options. For example, the “−9.4%” entry for the first EITC option indicates our estimate that implementing this policy would reduce the overall number of children with family incomes below the poverty line by 9.4 percent.12
The green and red circles and the vertical dashes across the first row indicate whether the percentage reduction in poverty for children from the first EITC option in the given subgroup is larger (green), about the same
___________________
12Table 5-1 mixes percentage-point poverty rates across the top row with proportionate reductions in the number of poor children in each group. Given the very different baseline rates of poverty across groups, it made the most sense to show proportionate reductions in the number of poor children within a group.
(vertical dashes), or smaller (red) than the 9.2 percent reduction among all poor children.13 The table shows that the first EITC option, which expands the phase-in and flat portions of the EITC schedule, produces disproportionately large poverty reductions for Black children, children living with single parents, and children with relatively younger mothers. It reduces poverty relatively less for immigrant children, children not living with biological parents and—unsurprisingly, given the earnings orientation of the policy—children living in families with no adult workers.
A broader look at Table 5-1 provides several general lessons. First, some groups—Black children and children living with single mothers or young mothers—tend to benefit more than average from many of the program and policy options. On the other hand, other groups—in particular, children in immigrant families (even if the children themselves are citizens) and children in families with no workers—tend to benefit proportionately less. This is particularly worrisome, given that the poverty rates of these groups (shown in the first row) are already among the highest in the table. These patterns reflect the fact that many of our program and policy ideas are oriented toward working families, and in only one case (the second immigration option) are benefits extended to noncitizens.
A second general lesson is that few of the program and policy options provide substantially disproportionate benefits for most of the subgroups listed in the table. Exceptions are the two child allowance proposals, which disproportionately benefit all groups other than noncitizens and Hispanic children.
CONCLUSION 5-5: The 20 program and policy options generate disparate impacts across population subgroups in our simulations. Although virtually all of them would reduce poverty across all of the subgroups we considered, disproportionately large decreases in child poverty occur only for Black children and children of mothers with low levels of education. Hispanic children and immigrant children would benefit relatively less.
Tradeoffs Among All of the Committee’s Criteria
In addition to impacts on cost, employment, and reduction in 100 percent SPM poverty, the committee judged it important to consider several other dimensions of possible program impacts. In response to the evidence cited in Chapter 3 regarding the detrimental impacts of growing up in a family whose income is far below the official poverty thresholds, the committee added to its list of criteria reductions in the number of children in deep poverty (under 50% of SPM poverty). To provide a more complete
___________________
13 See Appendix D, 5-13, for details.
picture of impacts on the larger group of low-income children, we have also looked at reductions when the poverty threshold is set at 150 percent of the SPM poverty line.
In Chapter 1, we also argued for the importance of promoting social inclusion, for example by reducing the sense of stigma among groups receiving benefits from social programs. We struggled to develop a strong measure of inclusion and, as explained in this chapter’s appendix (Appendix D), settled for gauging the extent to which our policy and program options would promote social inclusion by looking at the reduction of poverty rates between groups. Policies that promote social inclusion show a reduction in the gaps in poverty rates between groups.
Table 5-2 provides a summary of the performance of our 20 policy and program options across all of these criteria, most importantly poverty reduction but also cost, work incentives, and social inclusion. Further information on our methods can be found in Appendix D, 5-13, and in Appendix E. As detailed in Appendix D, 5-13, we developed a score for each of the criteria listed across the top and then classified each program and policy option as very strong, strong, neutral, weak, or very weak in meeting the criteria. Light and dark green circles indicate above-average performance in meeting the given criterion, while light and dark red circles indicate the opposite.
For example, the second EITC option, which increases EITC payments by 40 percent, strongly encourages work (as indicated by the additional earnings associated with it). The light green circles for <100 percent and <150 percent SPM poverty reduction indicate modest relative success in reducing poverty under those two definition, while the two light red circles indicate above-average cost and somewhat worse performance in reducing poverty gaps for the demographic subgroups we have been considering.
Drawing from Chapter 3, we indicate in the final column whether the research literature has provided strong evidence that the policy or program in question has been found to improve child well-being. Regardless of their performance on the criteria we have laid out, any policies or programs for which the literature shows such evidence deserve special attention.
Looking across the columns and rows of Table 5-2, it is not surprising that the first four pairs of programs, all of which are oriented toward work, are the most effective at encouraging work. But none of them is particularly effective at reducing deep child poverty, and only the EITC options are above average in reducing poverty—and this comes at a fairly high budget cost.
The three sets of means-tested transfer program options—expansions of SNAP, housing vouchers, and the child allowance—are the most effective at reducing both poverty and deep poverty for children, but all are relatively costly and none encourages work. Most of the other options cost relatively
TABLE 5-2 Simulated Relative Performance of Program and Policy Options Across Committee Criteria
| <100% SPM poverty reduction | <50% SPM deep poverty reduction | <150% SPM poverty reduction | Low Budget | Encourages work | Social Inclusion | Causal evidence on child impacts? | |
|---|---|---|---|---|---|---|---|
| EITC 1 | Strong | ||||||
| EITC 2 | |||||||
| Child Care 1 | No evidence | ||||||
| Child Care 2 | |||||||
| Minimum Wage 1 | No evidence | ||||||
| Minimum Wage 2 | |||||||
| WorkAdvance 1 | No evidence | ||||||
| WorkAdvance 2 | |||||||
| SNAP 1 | Strong | ||||||
| SNAP 2 | |||||||
| Housing Vouchers 1 | Some | ||||||
| Housing Vouchers 2 | |||||||
| SSI 1 | No evidence | ||||||
| SSI 2 | |||||||
| Child Allowance 1 | Some | ||||||
| Child Allowance 2 | |||||||
| Child Support 1 | No evidence | ||||||
| Child Support 2 | |||||||
| Immigrant 1 | No evidence | ||||||
| Immigrant 2 |
NOTES: EITC = Earned Income Tax Credit; SNAP = Supplemental Nutrition Assistance Program; SSI = Supplemental Security Income. Budget costs for the child allowance proposals are based on the 2018 tax law provisions. See text for explanation of the light and dark green and light and dark red circles.
SOURCE: Committee created based on commissioned analyses of TRIM3.
little but also have little impact on child poverty, which is consistent with the positive slope of the cost/poverty-reduction relationship shown in Figure 5-4.
CONCLUSION 5-6: The work-oriented program and policy options in our simulations would increase employment and earnings but are among the weakest options in reducing child poverty and, especially, deep child poverty. Three sets of means-tested programs—expansions of Supplemental Nutrition Assistance Program benefits, housing vouchers, and a new child allowance—would reduce poverty the most but would also reduce employment and earnings.
CONCLUSION 5-7: Across all of the criteria considered by the committee (poverty reduction, cost, impacts on work, social inclusion, and evidence of positive impacts on child well-being), several of our policy and program proposals stood out:
- A 40 percent increase in Earned Income Tax Credit benefits would decrease child poverty and strongly encourage work and is also likely to improve child well-being. But it would cost $20 billion annually, have only modest impacts on deep poverty, and fail to promote social inclusion.
- A $2,000 per year monthly child allowance would strongly reduce child poverty and deep poverty, which most research suggests would promote child development as well as social inclusion. It would also lead to modest reductions in employment and earnings. Its annual cost is $33 billion.
- Our expansion of the Child and Dependent Care Tax Credit would generate more annual earnings ($9.3 billion) than cost to the budget ($5.1 billion), although its ability to reduce child poverty and deep poverty is relatively modest.
REFERENCES
Administration for Children and Families. (2016a). CCDF Quick Facts: FY2016 Data. Washington, DC: U.S. Department of Health and Human Services. Available: https://www.acf.hhs.gov/sites/default/files/occ/fy2016_infographic.pdf.
________. (2016b). The Child Support Program Is a Good Investment: The Story Behind the Numbers. Washington, DC: U.S. Department of Health and Human Services. Available: https://www.acf.hhs.gov/sites/default/files/programs/css/sbtn_csp_is_a_good_investment.pdf.
________. (2018, May). Fiscal Year 2018 Federal Child Care and Related Appropriations. Washington, DC: U.S. Department of Health and Human Services. Available: https://www.acf.hhs.gov/occ/resource/fiscal-year-2018-federal-child-care-and-related-appropriations.
Alsan, M., and Yang, C.S. (2018). Fear and the Safety Net: Evidence from Secure Communities. Unpublished manuscript. Palo Alto: Stanford University. Available: https://people.stanford.edu/malsan/sites/default/files/people.stanford.edu/malsan/sites/default/files%20/fearsafetynet_manuscript.pdf.
Anderson, P.M., and Butcher, K.F. (2016). The Relationships Among SNAP Benefits, Grocery Spending, Diet Quality, and the Adequacy of Low-Income Families’ Resources. Washington, DC: Center on Budget and Policy Priorities.
Barnow, B.S., and Smith, J. (2016). Employment and training programs. In R.A. Moffitt (Ed.), Economics of Means-Tested Transfer Programs in the United States, Volume II. Chicago: University of Chicago Press.
Bumpass, L.L., and Raley, R.K. (1995). Redefining single-parent families: Cohabitation and changing family reality. Demography, 32(1), 97–109.
Cancian, M., and Meyer, D.R. (2018). Reforming policy for single-parent families to reduce child poverty. RSF: The Russell Sage Foundation Journal of the Social Sciences, 4(2), 91–112.
Child Care Aware of America. (2017a). Parents and the High Cost of Care. Available: http://usa.childcareaware.org/wp-content/uploads/2017/12/2017_CCA_High_Cost_Report_FINAL.pdf.
________. (2017b). Parents and the High Cost of Child Care: County-Level Supplement. Available: http://usa.childcareaware.org/wp-content/uploads/2018/05/CCA_CountyCosts_2018.pdf.
Child Trends. (2016). Births to Unmarried Women: Indicators of Child and Youth Well-Being. Washington, DC: Child Trends DataBank. Available: https://www.childtrends.org/wp-content/uploads/2015/12/75_Births_to_Unmarried_Women.pdf [September 2018].
Coleman-Jensen, A., Rabbitt, M., Gregory, C., and Singh, A. (2018). Household Food Security in the United States in 2017. Economic Research Report 256. Washington, DC: Economic Research Service, U.S. Department of Agriculture. Available: https://www.ers.usda.gov/webdocs/publications/90023/err-256.pdf?v=0.
Collins, A.M., Briefel, R., Klerman, J.A., Wolf, A., Rowe, G., Logan, C., and Lyskawa, J. (2016). Summer Electronic Benefit Transfer for Children (SEBTC) Demonstration: Summary Report No. ae4330d2e5734003bd82df557b62478c. Washington, DC: Mathematica Policy Research.
Collinson, R. Ellen, I.G., and Ludwig, J. (2016). Low-income housing policy. In R.A. Moffitt (Ed.), Economics of Means-Tested Transfer Programs in the United States, Volume 2. Chicago: University of Chicago Press.
Daly, M., and Burkhauser, R. (2003). The Supplemental Security Income Program. In R.A. Moffitt (Ed.), Means-Tested Transfer Programs in the United States. Chicago: University of Chicago Press.
Desmond, M. (2016). Evicted: Poverty and Profit in the American City. New York: Broadway Books.
Duggan, M., Kearney, M., and Rennane, S. (2016). The Supplemental Security Income Program. In R.A. Moffitt (Ed.), Economics of Means-Tested Transfer Programs in the United States, Chicago: University of Chicago Press.
Eissa, N., and Hoynes, H. (2000). Explaining the fall and rise in the tax cost of marriage: The effect of tax laws and demographic trends, 1984–1997. National Tax Journal, 53(3, Part 2), 683–712.
________. (2006). Behavioral responses to taxes: Lessons from the EITC and labor supply. In Tax Policy and the Economy. NBER Book Series Volume 20. Cambridge, MA: The MIT Press.
Eissa, N., and Liebman, J.B. (1996). Labor supply response to the earned income tax credit. Quarterly Journal of Economics, 111(2), 605–637.
Enchautegui, M.E., Chien, N., Burgess, K., and Ghertner, R. (2016). Effects of the CCDF Subsidy Program on the Employment Outcomes of Low-Income Mothers. Washington, DC: U.S. Department of Health and Human Services, Office of the Assistant Secretary for Planning and Evaluation. Available: https://www.researchconnections.org/childcare/resources/33241.
Finkel, M., and Buron, L. (2001). Study on Section 8 Voucher Success Rates. Volume I. Quantitative Study of Success Rates in Metropolitan Areas. Prepared by Abt Associates. Washington, DC: U.S. Department of Housing and Urban Development.
Garfinkel, I. (1994a). The child-support revolution. American Economic Review, 84(2), 81–85.
________. (1994b). Assuring Child Support: An Extension of Social Security. New York: Russell Sage Foundation.
Garfinkel, I., Robins, P.K., Wong, P., and Meyer, D.R. (1990). The Wisconsin child support assurance system: Estimated effects on poverty, labor supply, caseloads, and costs. The Journal of Human Resources, 25(1), 1–31.
Garfinkel, I., Meyer, D.R., and Sandefur, G.D. (1992). The effects of alternative child support systems on Blacks, Hispanics, and non-Hispanic Whites. Social Service Review, 66(4), 505–523.
Garfinkel, I., Smeeding, T.M., and Rainwater, L. (2010). The American Welfare State: Laggard or Leader? Oxford, UK: Oxford University Press.
Giannarelli, L., Lippold, K., Minton, S., and Wheaton, L. (2015). Reducing Child Poverty in the U.S.: Costs and Impacts of Policies Proposed by the Children’s Defense Fund. Washington, DC: The Urban Institute.
Grall, T. (2018). Custodial Mothers and Fathers and Their Child Support: 2015. Washington, DC: U.S. Census Bureau. Available: https://www.census.gov/content/dam/Census/library/publications/2018/demo/P60-262.pdf.
Hendra, R., Greenberg, D.H., Hamilton, G., Oppenheim, A., Pennington, A., Schaberg, K., and Tessler, B.L. (2016). Encouraging Evidence on a Sector-Focused Advancement Strategy: Two-Year Impacts from the WorkAdvance Demonstration. New York: MDRC.
Hotz, V.J., and Scholz, J.K. (2003). The earned income tax credit. In R.M. Moffitt (Ed.), Means-Tested Transfer Programs in the United States (pp. 141–197). Chicago, IL: The University of Chicago Press.
Hoynes, H.W., and Patel, A.J. (2017). Effective policy for reducing poverty and inequality? The Earned Income Tax Credit and the distribution of income. Journal of Human Resources, 1115–7494 R1.
Hoynes, H., and Rothstein, J. (2017). Tax policy toward low-income families. In A. Auerbach and K. Smetters (Eds.), Economics of Tax Policy. New York: Oxford University Press.
Jardim, E., Long, M.C., Plotnick, R., Van Inwegen, E., Vigdor, J., and Wething, H. (2017). Minimum Wage Increases, Wages, and Low-Wage Employment: Evidence from Seattle. NBER Working Paper No. 23532. Cambridge, MA: National Bureau of Economic Research.
Kuhlthau, K., Smith Hill, K., Yucel, R., and Perrin, J.M. (2005). Financial burden for families of children with special health care needs. Maternal and Child Health Journal, 9(2), 207– 218.
Kumlin, S., and Rothstein, B. (2005). Making and breaking social capital: The impact of welfare-state institutions. Comparative Political Studies, 38(4), 339–365.
Lalonde, R.J. (2003). Employment and training programs. In R.A. Moffitt (Ed.), Means-Tested Transfer Programs in the United States (pp. 517–585). Chicago: University of Chicago Press. Available: http://www.nber.org/chapters/c10261.pdf.
Maag, E. (2013). Child-related Benefits in the Federal Income Tax. Washington, DC: The Urban Institute.
Mattingly, M.J., Schaefer, A.P., and Carson, J.A. (2016). Child Care Costs Exceed 10 Percent of Family Income for One in Four Families. Carsey School of Public Policy, University of New Hampshire, Scholars’ Repository, 288. Available: https://scholars.unh.edu/carsey/288.
McLanahan, S. (2009). Fragile families and the reproduction of poverty. ANNALS of the American Academy of Political and Social Science, 621, 111–131.
Meyer, B. D., and Rosenbaum, D.T. (2000). Making single mothers work: Recent tax and welfare policy and its effects. National Tax Journal, 53(4, part 2), 1027–1062.
________. (2001). Welfare, the Earned Income Tax Credit, and the labor supply of single mothers. The Quarterly Journal of Economics, 116(3), 1063–1114.
Morrissey, T.W. (2017). Child care and parent labor force participation: A review of the research literature. Review of Economics of the Household, 5(1), 1–24. doi: 10.1007/s11150-016-9331-3. Available: https://link.springer.com/content/pdf/10.1007%2Fs11150-016-9331-3.pdf.
National Academies of Sciences, Engineering, and Medicine (NASEM). (2018). Transforming the Financing of Early Care and Education. Washington, DC: The National Academies Press. https://doi.org/10.17226/24984.
National Research Council (1999). Children of Immigrants: Health, Adjustment, and Public Assistance. Washington, DC: National Academy Press.
Neumark, D. (2017). The Employment Effects of Minimum Wages: Some Questions We Need to Answer. NBER Working Paper No. 23584. Cambridge, MA: National Bureau of Economic Research. Available: http://www.nber.org/papers/w23584.
Nichols, A., and Rothstein, J. (2016). The Earned Income Tax Credit. In R.A. Moffitt (Ed.), Economics of Means-Tested Programs in the United States, Volume I. Chicago: The University of Chicago Press.
Nord, M. (2009). Food Insecurity in Households with Children: Prevalence, Severity, and Household Characteristics. Economic Information Bulletin No. 56. Washington, DC: U.S. Department of Agriculture.
Rainwater, L. (1982). Stigma in income-tested programs. In I. Garfinkel (Ed.), Income-Tested Transfer Programs: The Case for and Against (pp. 19–65). New York: Elsevier Academic Press.
Renwick, T., and Fox, L. (2016, September). The Supplemental Poverty Measure: 2015. Current Population Reports. Washington, DC: U.S. Census Bureau. Available: https://www.census.gov/content/dam/Census/library/publications/2016/demo/p60-258.pdf.
Romig, K. (2017). SSI: A Lifeline for Children with Disabilities. Washington, DC: Center on Budget and Policy Priorities.
Romley, J.A., Shah, A.K., Chung, P.J., Elliott, M.N., Vestal, K.D., and Schuster, M.A. (2017). Family-provided health care for children with special health care needs. Pediatrics, 139. doi: 10.1542/peds.2016-1287.
Schaberg, K. (2017). Can Sector Strategies Promote Longer-Term Effects? Three-Year Impacts from the WorkAdvance Demonstration. New York: MDRC.
Shaefer, H.L., Collyer, S., Duncan, G., Edin, K., Garfinkel, I., Harris, D., Smeeding, T.M., Waldfogel, J., Wimer, C., and Yoshikawa, H. (2018). A Universal Child Allowance: A plan to reduce poverty and income instability among children in the United States. RSF: Russell Sage Foundation Journal of the Social Sciences, 4(2), 22–42.
Schmitt, J., and Jones, J. (2012). Low-Wage Workers Are Older and Better Educated than Ever. Washington, DC: Center for Economic and Policy Research. Available: https://www.takeactionminnesota.org/wp-content/uploads/2013/10/Low-wage-Workers-AreOlder-and-Better-Educated-than-Ever.pdf.
Schroeder, D. (2016). The Limited Reach of the Child Support Enforcement System. Washington, DC: American Enterprise Institute.
Singer, A. (2004). Welfare reform and immigrants: A policy review. In P. Kretsedemas and A. Aparicio (Eds.), Immigrants, Welfare Reform, and the Poverty of Policy (pp. 21–34). Westport, CT: Praeger.
Siskin, A. (2016). Noncitizen Eligibility for Federal Public Assistance Policy Overview. Washington, DC: Congressional Research Service.
U.S. Congressional Budget Office (2014). The Effects of a Minimum-Wage Increase on Employment and Family Income. Available: https://www.cbo.gov/publication/44995.
U.S. Department of Labor. (2019). Consolidated Minimum Wage Table. Available: https://www.dol.gov/whd/minwage/mw-consolidated.htm.
U.S. Social Security Administration. (2017). SSI Annual Statistical Report 2016. SSA Publication No. 13-11827. Available: https://www.ssa.gov/policy/docs/statcomps/ssi_asr/2016/ssi_asr16.pdf.
Vespa, J., Lewis, J.M., and Kreider, R.M. (2013). America’s Families and Living Arrangements: 2012. Washington, DC: U.S. Census Bureau.
Watson, T. (2014). Inside the refrigerator: Immigration enforcement and chilling effects in Medicaid participation. American Economic Journal: Economic Policy, 6(3), 313–338.
Ziliak, J.P. (2016, May). Modernizing SNAP Benefits. Policy Proposal 2016-06, The Hamilton Project. Washington, DC: The Brookings Institution.
________. (2017, June). Memorandum to the Committee on Building an Agenda to Reduce the Number of Children in Poverty by Half in 10 Years: Proposals to Cut Short-Run Poverty by Half. Lexington: University of Kentucky.
This page intentionally left blank.