
The nation needs to cultivate a larger and more diverse science, technology, engineering, and mathematics (STEM) workforce. Given the rationale outlined in Chapter 2, it can be argued that Minority Serving Institutions (MSIs) are underutilized resources to help address this urgent national need.
Although many MSIs are long established, their role in the nation’s higher education system are often overlooked or misunderstood. This chapter provides a closer look at MSIs, their students, and the complex context in which MSIs operate. The chapter begins with an overview of the seven federally recognized types of MSIs, with emphasis (as noted in Chapter 1) on four: Historically Black Colleges and Universities (HBCUs), Tribal Colleges and Universities (TCUs), Hispanic Serving Institutions (HSIs), and Asian American and Native American Pacific Islander Serving Institutions (AANAPISIs). This is followed by a discussion on what makes MSIs diverse, including the ethnic makeup of their student bodies, faculty, and leadership. The chapter concludes with a discussion of the problematic nature of common accountability metrics to measure the performance of MSIs, and what it means to “serve” minority students. Gaining a stronger understanding of MSIs, their faculty, and students will help decision makers, funders, and other stakeholders of higher education and workforce development make more informed decisions on how best to support these institutions as they prepare their students for the workforce.
WHAT ARE MINORITY SERVING INSTITUTIONS?
For more than 180 years, MSIs have had a presence in the higher education landscape, but this presence has expanded rapidly over the past few decades. These institutions now exist across all regions, in nearly every state and territory, and range in terms of size, student populations, physical space, and geographical location (i.e., rural, urban, and suburban) (Figure 3-1).
Based on analyses by the American Council on Education for this report, there are more than 700 federally designated MSIs that represent approximately 14 percent of all degree-granting, Title IV-eligible institutions of higher education.1 Taken together, they enroll roughly 5 million students, or nearly 30 percent of all undergraduates in U.S. higher education. These institutions carry a significant postsecondary load for the United States and create educational opportunities that in many cases would not otherwise exist (Espinosa et al. 2017; Kim and Conrad 2006; Núñez 2014).
MSIs are traditionally defined by one of two overarching categories: historically defined or enrollment-defined institutions (Tables 3-1 and 3-2). Historically defined MSIs were established with the express purpose of providing access to higher education for a specific minority group (Espinosa et al. 2017; Núñez et
___________________
1 IPEDS data, collection year 2015. See Appendix F for a table of MSIs and non-MSIs by sector.
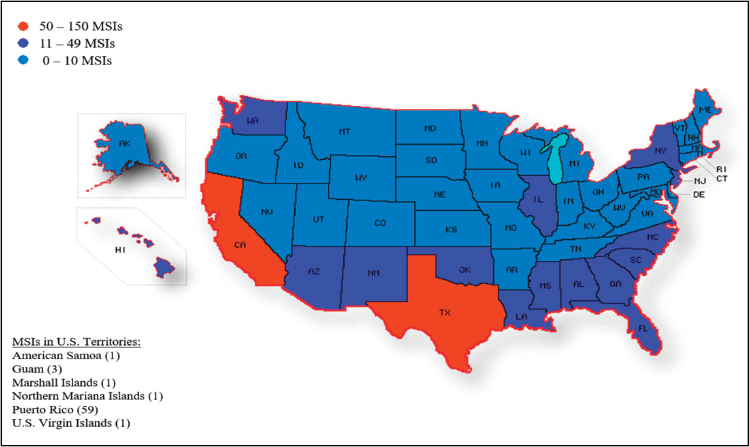
NOTE: Image produced in diymaps.net.
SOURCE: Data from the Integrated Postsecondary Education Data System, collection year 2015.
TABLE 3-1 Historically Defined Minority Serving Institutions
| MSI Type | Acronym | Federal Recognition | Federal Definition |
|---|---|---|---|
| Historically Black Colleges and Universities | HBCU | Higher Education Act of 1965a | Any historically black college or university established prior to 1964, whose principal mission was, and is, the education of Black Americans |
| Tribal Colleges and Universities | TCU | Tribally Controlled College or University Assistance Act of 1978b,c | Institutions chartered by their respective Indian tribes through the sovereign authority of the tribes or by the federal government with the specific purpose to provide higher education opportunities to Native Americans through programs that are locally and culturally based, holistic, and supportive |
a Higher Education Act of 1965, Pub. L. No. 89-329 (1965).
b Tribally Controlled College or University Assistance Act of 1978, Pub. L. No. 95-471 (1978).
c TCUs were not established by this legislation, as they are founded by individual Native tribes. Rather, this legislation provides federal support for these institutions.
SOURCE: Adapted from Espinoso et al. (2017).
| MSI Type | Acronym | Federal Recognition | Federal Definition |
|---|---|---|---|
| Hispanic-Serving Institutions | HSI | Higher Education Act of 1992a | Institutions with 25 percent or more total undergraduate Hispanic full-time-equivalent student enrollment |
| Alaska Native-Serving Institutions are institutions that have at least 20 percent Alaska Native students. | |||
| Alaska Native and Native Hawaiian-Serving Institutions | ANNHI | Higher Education Act of 1998b | Native Hawaiian-Serving Institutions are institutions that have at least 10 percent Native Hawaiian students |
| Collectively, these institutions are referred to as ANNH institutions | |||
| Asian American and Native American Pacific Islander-Serving Institutions | AANAPISI | College Cost Reduction and Access Act of 2007c,d | Institutions that have at least 10 percent enrollment of Asian American Pacific Islander students |
| Predominantly Black Institutions | PBI | Higher Education Opportunity Act of 2008e |
Institutions that have the following demographics:
|
| Native American-Serving, Nontribal Institutions | NASNTI | Higher Education Opportunity Act of 2008 | Institutions that have at least 10 percent enrollment of Native American studentsg |
a Higher Education Act of 1992, Pub. L. No. 102-325 (1992).
b Higher Education Act of 1998, Pub. L. No. 105-244 (1998).
c College Cost Reduction and Access Act of 2007, Pub. L. No. 110-84 (2007).
d The AANAPISIs program was expanded under the Higher Education Opportunity Act of 2008.
e Higher Education Act of 2008, Pub. L. No. 110-315 (2008).
f Note that PBIs are predicated on the institution meeting an enrollment threshold, and HBCUs were established for the primary purpose of educating Black students.
g Note that NASNTIs are predicated on the institution meeting an enrollment threshold, and TCUs were established for the purpose of educating Native American students.
SOURCE: Adapted from Espinosa et al. (2017).
al. 2015). They include HBCUs and TCUs. Five other MSI types are federally designated based on student enrollment and institutional expenditure thresholds:
- HSIs,
- Alaska Native-Serving and Native Hawaiian-Serving Institutions (ANNHIs),
- AANAPISIs,
- Predominantly Black Institutions (PBIs), and
- Native American-Serving Nontribal Institutions (NASNTIs).
Two caveats should be highlighted. First, because MSIs enroll substantially diverse communities, they can qualify for more than one category of MSI. For example, based on enrollment numbers, some HBCUs could potentially identify as HSIs (Núñez et al. 2015). Second, there is substantial heterogeneity in institutional characteristics, not only between MSIs but also within each type. (See Box 3-1 for additional discussion.) These caveats should be considered when collecting, analyzing, communicating, and reviewing data on MSIs. In addition, different stakeholders “count” the number of MSIs differently, which has resulted in varied estimates of the total number of MSIs. The U.S. Department of Education’s College Scorecard data include institutions as MSIs if they are eligible to
apply for federal funding, in a given fiscal year, under Title III and Title V of the Higher Education Act. On the other hand, groups that advocate on behalf of MSIs—particularly MSIs that are enrollment defined—take into account undergraduate enrollment thresholds when identifying MSIs and not federal eligibility under the law. Note that the data presented in this report come from a variety of sources that may differ in how MSIs are defined or “counted;” each of these sources is identified in the report.
In pragmatic terms, the term “MSI” has been solidified in the higher education community through its use by the federal government in its designations and the ability of institutions to receive and/or apply for MSI-specific federal funding. A specified list of allowable activities gears this funding toward institutional capacity building, improving student success, and expanding educational opportunities for low-income students (Gasman et al. 2015; Hegji 2017).
A number of historical and contemporary texts go into depth about the beginnings of the various MSI types, including profiles of specific institutions and the overall contributions of MSIs to their students and communities (e.g., Anderson 1988; AIHEC 2012; Núñez et al. 2015; Santiago et al. 2016; Teranishi et al. 2013). What we present here is a snapshot view of HBCUs, TCUs, HSIs, and AANAPISIs. Their unique characteristics, and notable or recent activity in STEM, are also discussed. A deeper look at the promising practices to support MSI STEM students on these campuses can be found in Chapter 5.
Historically Defined MSIs
As noted above, HBCUs and TCUs are defined as historical in that they were established with the express purpose of serving specific populations, namely, African Americans and Native Americans, respectively. This historical reference is important given that HBCUs and TCUs came into existence long before they were officially recognized through the Higher Education Act of 1965 and the Tribally Controlled College or University Assistance Act of 1978, respectively (Gasman et al. 2015). These acts set the stage for a new kind of federal support for HBCUs and TCUs. Table 3-1 displays the two historically defined MSI types, their associated acronyms, the pieces of legislation by which each category was established, and their federal definitions.
HBCUs at a Glance
Prior to the Civil War, African Americans were denied access to structured postsecondary education throughout much of the United States. Thus, institutions of higher education with the specific intent to educate students of African descent were established, with Cheyney University of Pennsylvania (1837), Lincoln University (1854), and Wilberforce University (1856) representing the nation’s first HBCUs (U.S. Department of Education 1991; Thurgood Marshall College Fund
2015). In 1862, the Morrill Act2 extended higher education opportunities to broad segments of the U.S. population in order to better prepare the nation for a changing economy and society (NRC 1996). This legislation applied to freed citizens only.
After the Civil War, the Freedmen’s Bureau3 and the African Methodist Episcopal Church launched efforts to provide newly freed African Americans with basic needs, including food, medical assistance, and education. These advocates helped establish 70 schools of higher education between 1866 and 1882 (Hawkins 2012). Funding for HBCUs expanded as a result of the Second Morrill Act in 1890,4 which required segregated public higher education systems to establish land-grant institutions for African American students when such institutions were created for White students only (U.S. Department of Education 1991). Title III of the Higher Education Act of 1965, as amended, defines an HBCU as “any historically black college or university that was established prior to 1964, whose principal mission was, and is, the education of black Americans.”5
Based on 2016 fall enrollment, 51 public and 51 private two- and four-year HBCUs operate in the United States (National Center for Education Statistics 2018). The majority are in the South; however, HBCUs are also in the Midwest and Mid-Atlantic. They vary in size, curricular focus, traditions, and other characteristics, but they share the mission of preparing and empowering African American students to succeed in higher education. Although HBCUs comprise only 3 percent of all postsecondary institutions, they have shown disproportionate success in graduating African American students, particularly in the STEM fields (Kim and Conrad 2006; UNCF 2017). HBCUs have also long produced a disproportionately large percentage of African American students who go on to earn STEM doctoral degrees (Burrelli and Rapoport 2008; Fiegener and Proudfoot 2013; Sibulkin and Butler 2011; Solórzano and Solórzano 1995).
The success of HBCUs in educating African American students in STEM has been attributed to a number of factors, including the institutions’ strong academic and social support networks and culturally responsive teaching approaches. Some observers have argued that one of the most impactful practices of HBCUs is their dedication to maintain an institutional culture of success (e.g., Gasman and Nguyen 2014). (See Chapter 5 for additional strategies used by HBCUs to support student success.) This long-standing commitment to expect, cultivate, and celebrate success has helped HBCUs prepare African American students to reach their full academic potential.6
___________________
2 The First Morrill Act, 1862, 7 U.S.C. 301 et seq.
3 Formally known as the Bureau of Refugees, Freedmen and Abandoned Lands, this organization was commissioned by Congress in 1865 (https://www.archives.gov/research/african-americans/freedmens-bureau).
4 The Second Morrill Act, 1980, 7 U.S.C. 321 et seq.
5 Higher Education Act of 1965, Pub. L. No. 89-329 (1965).
6 For additional information on the history of HBCUs and their impact on the success of African Americans in postsecondary education, see Anderson (1988) and UNCF (2017).
HBCUs have a long-standing history and legacy within the higher education landscape, and as a result, social science research on HBCUs is stronger than it is for other MSIs. Nonetheless, many research questions related to HBCUs warrant further exploration, as discussed elsewhere in this report.
TCUs at a Glance
TCUs were established by individual Native American tribes with a core mission to sustain tribal cultures, traditions, and languages, while bringing education, social, and economic opportunities to Native Americans (AIHEC 1999). Following the success of the “self-determination” movement of the 1960s that emphasized self-governance by federally recognized tribes (Cornell and Kalt 2010), Native American leaders restructured tribal higher education to “strengthen reservations and tribal culture without assimilation” (AIHEC 1999). The Navajo Nation created the first tribally controlled college in 1968, now known as Diné College (AIHEC 1999).
TCUs first received federal funding through the Tribally Controlled College or University Assistance Act of 1978. This legislation defines a TCU as “an institution of higher education which is formally controlled, or has been formally sanctioned, or chartered, by the governing body of an Indian tribe or tribes.”7 Today, there are 35 two- and four-year TCUs located primarily in the northern Midwest and Rocky Mountain states.8 These institutions, most of which are embedded within native, rural communities, serve roughly 30,000 full- and part-time students, including Native American and Alaska Native students, representing more than 250 federally recognized Indian tribes (AIHEC 2018; QEM 2012).
TCUs offer essential sources of educational opportunity for many Native American and Alaska Native students. Culturally relevant support approaches and community engagement are critical components of each TCU’s curriculum (AIHEC 1999). At schools with a high population of Native American students, all courses, even those without an explicit cultural focus, are designed from a Native American perspective (AIHEC 1999). As described by Stull et al. (2015), TCUs do not share the same mission as many other higher education institutions, but instead possess a very different history of purpose, investing in efforts to “revitalize Native languages and culture, promote Tribal sovereignty, and further economic growth aligned with Tribal values in the communities they serve” (Stull et al. 2015).
Over the past several decades, STEM-focused programming at TCUs has increased. Grant-funding opportunities and partnerships with federal agencies
___________________
7 Tribally Controlled College or University Assistance Act of 1978, Pub. L. No. 95-471 (1978).
8 The Department of Education collects data on 35 TCUs. Wind River Tribal College (which does not submit data to IPEDS) and Tribal Colleges located in Canada are not included in this tally. Indigenous-focused organizations may provide different total counts of TCUs, which speaks to the complex nature of data collection and reporting for MSIs.
(e.g., the U.S. Department of Agriculture and U.S. Department of Energy) have enabled TCUs to expand their STEM programming; offer new degree options in the fields of information technology, environmental science, and science education; and provide research internship opportunities for their students (Native Science Report 2018; PCAST 2012). (See Chapter 5 for additional strategies used by TCUs to support student success.) Intentional federal legislation and grant programming have served an essential role in stimulating this growth. Notable efforts include the 1996 Executive Order 13021 for Tribal Colleges and Universities,9 the National Science Foundation’s Tribal Colleges and Universities Program, and the 2011 Executive Order 1359210 for Improving Native American and Alaska Native Educational Opportunities and Strengthening Tribal Colleges and Universities.11 Although some progress has been made to bolster and sustain STEM success for this traditionally underrepresented population of students, additional investments and resources are needed.
Enrollment-Defined MSIs
In the enrollment-defined or enrollment-driven MSIs, if and when a given institution meets an undergraduate enrollment threshold for a certain population of students, it is designated as the appropriate MSI type. Federal eligibility also requires that these institutions have comparatively low general and educational expenditures, an amount determined annually by the U.S. Department of Education. Other criteria include that they are eligible for Title IV funding12 and are degree-granting, public or private nonprofit institutions. Established between 1992 and 2008 through various pieces of legislation, there are currently five enrollment-defined MSI types (Table 3-2).
HSIs at a Glance
In 1986, the founding members of the Hispanic Association of Colleges and Universities (HACU) self-defined HSIs as a designated group of colleges and universities with an intentional focus to serve a high population of Hispanic students
___________________
9 Executive Order 13021 for TCUs was signed by President William J. Clinton.
10 Executive Order 13592 for Improving American Indian and Alaska Native Educational Opportunities and Strengthening Tribal Colleges and Universities was signed by President Barack H. Obama.
11 For additional information on the history of TCUs and their impact on the success of American Indian/Alaska Native students in postsecondary education, see the American Indian Higher Education Consortium (AIHEC 1999) and Guillory and Ward (2008).
12 Title IV of Higher Education Act of 1965, Pub. L. No. 89-329 (1965); institutions eligible for Title IV funding enter a written agreement with the Secretary of Education allowing participation in Title IV federal financial aid programs, such as grant aid, federal work study, and federal student loans.
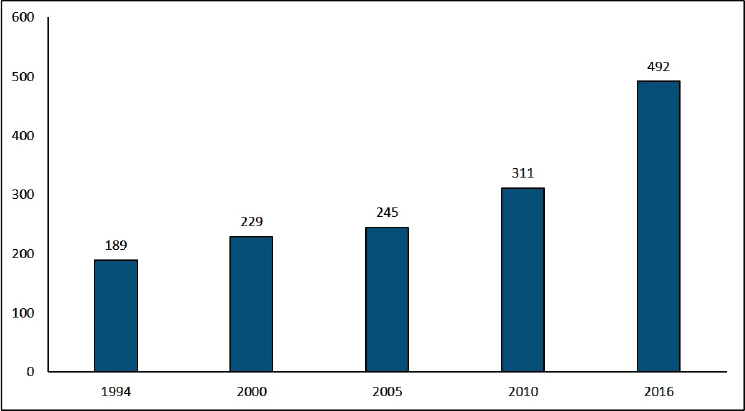
(HACU 2012; Valdez 2015).13 Several years later, the Higher Education Act of 1992 defined HSIs as two- or four-year nonprofit institutions with at least a 25 percent Hispanic undergraduate full-time-equivalent enrollment and a high proportion of students with financial need.14,15 As shown in Figure 3-2, since then, the number of eligible institutions has grown from 189 in 1994 to 492 in 2016 (HACU 2018). Based on 2016-2017 data, of the 492 HSIs, roughly two-thirds were public and just under one-half were two-year institutions (Excelencia in Education 2018).
HSIs show considerable variability in size and focus, and range from small private institutions to large public research universities. Most HSIs are located in urban metropolitan areas, with a small number in rural areas (Núñez et al. 2016). Some institutions, such as Boricua College in New York, were founded with the mission to serve Hispanic populations; however, the majority have become HSIs because of a fast-growing Hispanic population in and around the local and regional communities that they serve. As a result, the number of HSIs continues to grow as national demographics change, with more HSIs located in regions of the country where Hispanic population growth is concentrated (see Box 3-2). For example, California, Texas, and Puerto Rico are home to greater than 60 percent of all HSIs, and Florida, Illinois, New York, and New Mexico account for roughly an additional 20 percent (Excelencia in Education 2018).
HSIs’ contribution to the education of Hispanic students is significant. While HSIs represent 15 percent of all nonprofit colleges and universities, they enroll the majority of Hispanic college students (Excelencia in Education 2018). Some institutions’ student bodies are composed of the minimum level of 25 percent Hispanic students, while others, mostly in Texas, California, and Puerto Rico, have student bodies that are 60 to 100 percent Hispanic (HACU 2017). HSIs also show considerable diversity in their non-Hispanic enrollments; ranging from predominantly White to predominantly African American and other underrepresented populations. However, as a whole, HSIs serve larger proportions of African American and Native American students than HBCUs and TCUs, respectively (Núñez et al. 2015).
In recent years, there has been a concerted effort to build the capacity of HSIs to enroll, retain, and graduate more students—especially Hispanic students—in the STEM fields. This initiative includes boosting HSIs’ research productivity and contributions to the production of advanced STEM degrees by a growing Hispanic population and student body. In 2017, two pieces of legislation provided guid-
___________________
13 Several known HSIs were established with an intentional focus to serve Hispanic students: Boricua College (New York), Colegio Cesar Chavez (Oregon), Eugenio Maria de Hostos Community College (New York), Northern New Mexico College (New Mexico), and National Hispanic University (California, closed in 2015), Puerto Rican institutions, and St. Augustine College (Illinois). See Olivas (1982); Calderón Galdeano et al. (2012); Núñez et al. (2016).
14 Higher Education Amendments of 1992, 102nd Congress (1991-1992). Became Pub. L. No. 102-325.
15 This criterion later changed, and the financial status of students is no longer part of the institutional definition.
ance to the National Science Foundation (NSF) on how to address the needs of HSIs to improve student outcomes in STEM fields. First, the 2017 Consolidated Appropriations Act (Pub. L. No. 115-31) prompted the establishment of an HSI program to build capacity at institutions that do not typically receive high levels of NSF grant funding. Second, the American Innovation and Competitiveness Act of 2017 (Pub. L. No. 114-329) directed NSF to award competitive, merit-based grants to HSIs to enhance the quality of undergraduate STEM education, and to increase retention and graduation rates for students seeking associate and bachelor’s degrees in STEM. At the time of this report, these initiatives were too new to assess their effectiveness.16
AANAPISIs at a Glance
Established in the Higher Education Opportunity Act of 2008 (Pub. L. No. 110-315), AANAPISIs were first recognized by the federal government in 2007 through the College Cost Reduction and Access Act of 2007 (Pub. L. No. 110-84). According to the U.S. Department of Education (2017), there are approximately 133 two- and four-year AANAPISIs.17 Based on 2010 data, they enroll roughly 40 percent of Asian American and Pacific Islander (AAPI) students and award roughly 50 percent of all associate degrees and 25 percent of all bachelor’s degrees attained by AAPI college students (CARE 2013; Museus et al. 2018).
To understand the importance of AANAPISIs is to understand their role in educating a fast-growing AAPI population. As a rapidly growing demographic group within the United States, the AAPI population is expected to reach roughly 50 million people by 206018 (U.S. Census Bureau 2015). Moreover, between 1979 and 2009, AAPIs experienced a 553 percent increase in two- and four-year college enrollment, a number that is projected to increase by 35 percent, cumulatively, over the next 10 years (Vollman 2017).
Although they have a number of common attributes, AAPI students are a diverse group of individuals. They originate from more than 50 ethnic groups, speak more than 300 languages, and have unique immigration experiences and pathways to and through the U.S. K-12 school system (CARE 2011; U.S. Census Bureau 2017). In addition to ethnic, language, and immigration diversity, the AAPI community is heterogeneous as it pertains to educational attainment, poverty status, generational status, household income, and socioeconomic class (B.M.D. Nguyen et al. 2015; Ramakrishnan and Ahmad 2014).
Although no official grouping of the different ethnicities exists, efforts have been made to group ethnicities based on geographic and cultural boundaries, for example, East Asian (e.g., Chinese, Japanese, Korean, and Taiwanese),
___________________
16 For additional background on HSIs and their impact on student success, see Santiago et al. (2016).
17 Institutions that are eligible for AANAPISI-designated funding.
18 Calculation from projected Asian and Pacific Islander population; data include Native Hawaiian population. See U.S. Census Bureau (2015, Table 2, p. 9).
Southeast Asian (e.g., Filipino, Cambodian, Vietnamese, and Thai), South Asian (Bangladeshi, Indian, and Pakistani), and Native Hawaiian and Pacific Islander (e.g., Native Hawaiian, Fijian, Guamanian, and Samoan) (B.M.D. Nguyen et al. 2015; Ramakrishnan and Ahmad 2014). Efforts to disaggregate educational data have revealed significant disparities in the educational outcomes and student experiences between these AAPI subgroups (B.M.D. Nguyen et al. 2015; Ramakrishnan and Ahmad 2014). For example, the National Commission on Asian American and Pacific Islander Research in Education determined that when institutional data are disaggregated by AAPI subgroup, clear disparities in degree attainment and rates of student poverty emerge (CARE 2011). In addition, studies have found that student groups from the Pacific Islander and Southeast Asian subgroups, with low numbers, face different challenges of representation and support on campus, as compared to East Asian subgroups with higher representation (B.M.D. Nguyen et al. 2016). Therefore, treating the AAPI community as monolithic creates a mistaken impression that all AAPIs possess the same academic and social needs. This complexity results in further limitations when it comes to understanding AAPI student experiences and academic outcomes at AANAPISIs, and may contribute to a dearth of research on AAPIs as compared to other MSI student groups (Museus and Park 2015).19 See also Box 2-1 for a discussion on the need to continuously reassess and revise research methods used to examine demographic data.
THE MSI COMMUNITY: A MODEL OF DIVERSITY FOR AMERICAN HIGHER EDUCATION
MSIs offer broad access to higher education for students who might otherwise have limited postsecondary opportunities, including underrepresented racial and ethnic groups, low-income students, first-generation-to-college students, adult learners, and other posttraditional20 and nontraditional students.21 As a result, the student bodies at MSIs are the most diverse in the nation, representing what many call “today’s student” or the “21st century” student (Lumina Foundation 2015). MSI learners look very different from those for whom higher education was originally intended. This distinction cannot be overstated when considering the policies and practices—at the federal, state, and institutional levels—needed to support MSIs and MSI students. In this section, we provide
___________________
19 For additional information on AANAPISIs and the students they serve, see Teranishi et al. (2013).
20 Post-traditional learners are defined as students who are over the age of 25, work full time, are financially independent, or connected with the military. For more information on post-traditional learners, see Soares et al. (2017).
21 Nontraditional students are generally defined as students with one of the following characteristics: independent, having one or more dependents, being a single caregiver, not having received a standard high school diploma, having delayed enrollment in postsecondary education by a year or more after high school, working full time while enrolled, and/or attending school part time (Brock 2010; Choy 2002; Horn and Carroll 1996; Kim 2002, Taniguchi and Kaufman 2005).
summary profiles of MSI students, including their demographics, financial circumstances, enrollment intensity, and STEM enrollment and degree attainment.
Student, Faculty, and Leadership Diversity at MSIs
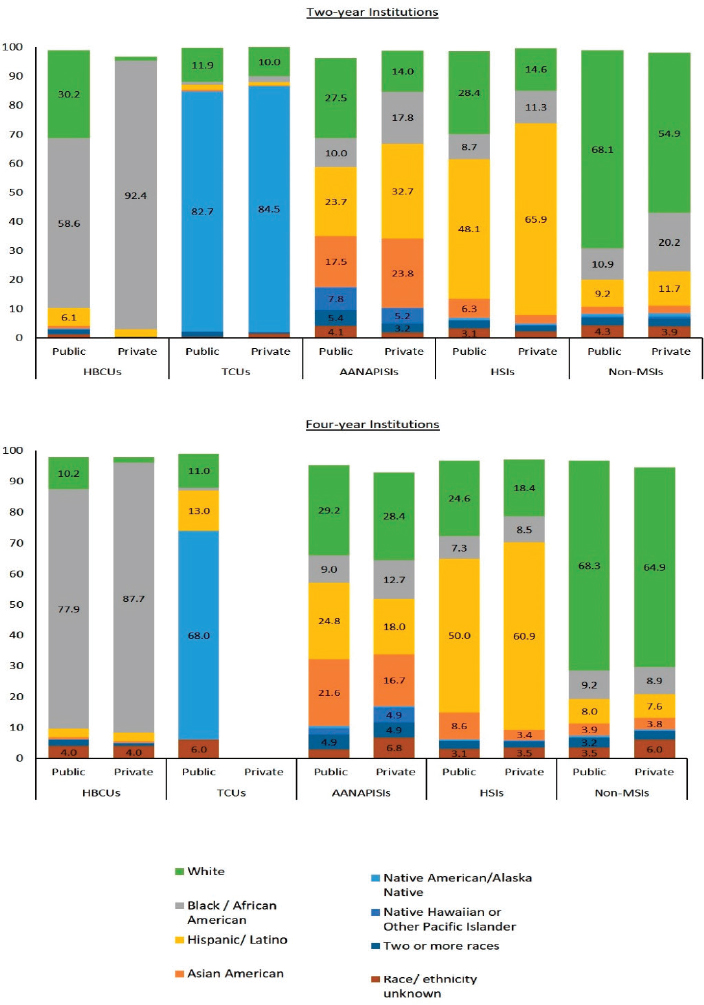
Undergraduate Student Body Diversity
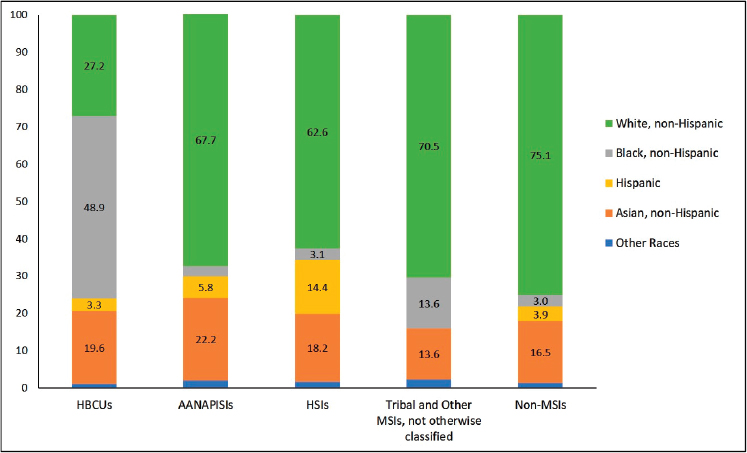
MSIs have diverse student bodies, as compared to non-MSIs (Figure 3-3). Across the four MSI types highlighted in Figure 3-3, the racial groups HBCUs and TCUs are associated with serving represented the largest share of all students enrolled at these institutions. On average, students enrolled at public and private two- and four-year HBCUs are overwhelmingly Black or African American, and students at four-year public and two-year public and private TCUs are predominantly Native American or Alaska Native. Likewise, on average, HSIs have a large percentage of Hispanic students within the two- and four-year private and public institutions.
Public and private two- and four-year AANAPISIs have less of a racial/ethnic concentration; however, from a percentage standpoint, AAPI students represent a smaller proportion of America’s college student body. For this reason, the AAPI student enrollment threshold for AANAPISI federal designation is much smaller (at 10 percent) than for other MSI types. Still, across the board, MSIs are the country’s most diverse set of institutions in terms of ethnic composition of the undergraduate student body. This fact is not lost on prospective undergraduate students, and in fact serves as an influential factor in college choice (Box 3-3).
Student Diversity in STEM Disciplines
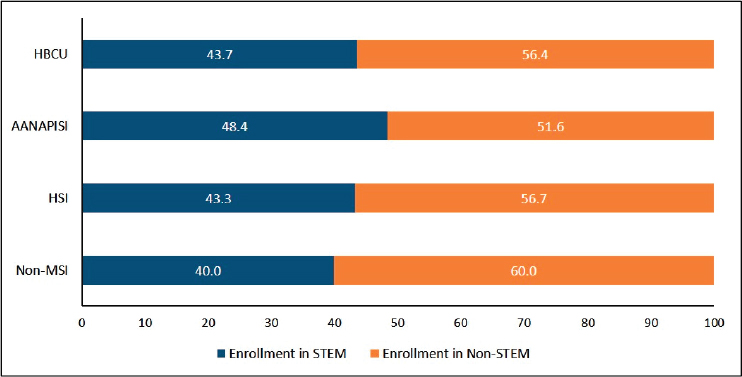
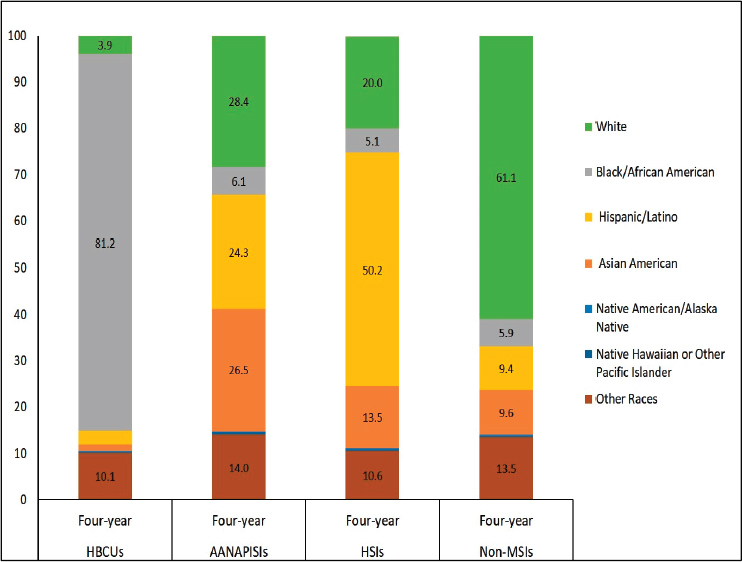
A review of the U.S. Department of Education’s Integrated Postsecondary Education Data System (IPEDS) 2016 fall enrollment data reveals that a slightly higher percentage of undergraduate students are enrolled in STEM fields at four-year MSIs than at four-year non-MSIs. The percentage of undergraduates in STEM versus non-STEM is shown in Figure 3-4, broken down by four institutional types: HSIs (43.3 percent STEM enrollment), HBCUs (43.7 percent STEM enrollment), AANAPISIs (48.4 percent STEM enrollment), and non-MSIs (40.0 percent STEM enrollment). Given the dearth of TCU data in IPEDS, the American Indian Higher Education Consortium (AIHEC) provided the committee with supplemental enrollment data from fall 2016, reporting that approximately 13 percent of TCU students are enrolled in STEM programs at four-year TCUs (not pictured).
As shown in Figure 3-5, based on IPEDs 2016 fall enrollment data, African American students represent the vast majority of students enrolled in STEM at four-year HBCUs, at 81 percent. At four-year HSIs, Hispanics represent half
NOTE: There are limited data for four-year private TCUs; hence, these data are not included. Percentages below 3 percent were not labeled. See the Annex at the end of the chapter for additional notes.
SOURCE: IPEDS 2015 Fall Enrollment Survey. Analysis by the American Council on Education for this report.
(50.2 percent) of all students enrolled in STEM. Of note, 13.5 percent of STEM students at HSIs are Asian American. At four-year AANAPISIs, Asian American and Pacific Islander students represent 26.5 percent of all students enrolled in STEM; Hispanics are the third largest group (following White students) at 24.3 percent. Across all MSI types, Pacific Islander and Native American/Alaska Native students are the most underrepresented groups in STEM. Not surprisingly, based on AIHEC data provided to the committee, of the 1,263 students enrolled in STEM at four-year TCUs in fall 2016, approximately 93 percent were Native American/Alaska Native (not pictured). In comparison, White students represent the 61.1 percent of students enrolled in STEM at four-year non-MSIs.
NOTE: There are limited data for four-year TCUs; hence, these data are not included. See the Annex at the end of this chapter for additional notes. See Appendix F, Table F-2, for data.
SOURCE: IPEDS 2016 Fall Enrollment and Institutional Characteristics data. Analysis by the American Institutes for Research for this report.
Enrollment Intensity and Adult Learners
MSIs reflect another form of diversity in their student bodies: how students pursue college, in terms of enrollment intensity. According to a recent analysis by the American Council on Education (Espinosa et al. 2017), the majority of students at MSIs do not attend college exclusively full time, but rather enroll primarily through mixed enrollment, moving between full-time and part-time status (Table 3-3). Although enrollment data for TCU students were unavailable in this report, data provided by AIHEC demonstrated that a substantial portion of enrolled students attend part time (Table 3-4). Given this pattern of enrollment, it is not surprising that a large number of students who enroll at MSIs, particularly two-year MSIs, are over the age of 25 (see Figure 3-6 for data). These students are often working and are balancing work, school, and family commitments. (See Box 3-4 for a brief discussion on the importance of two-year institutions in higher education.)
The enrollment patterns and proportion of adult learners at MSIs are important to understand. Institutional policies and practices needed to serve a largely nontraditional student body are very different from those intended to serve students who enroll right after high school and stay full time through graduation. Serving nontraditional students requires institutions to be more nimble and innovative in their educational approach (Arbelo-Marrero and Milacci 2016; Soares et
NOTE: Percentages below 3 percent were not labeled. See the Annex at the end of this chapter for additional notes.
SOURCE: IPEDS 2016 Fall Enrollment and Institutional Characteristics data. Analysis by the American Institutes for Research for this report.
al. 2017) and offer more holistic programs and practices, like the ones highlighted in Chapter 5 of this report. It further requires, as discussed in a later section in this chapter, that performance measures take into account the many dimensions of student success for nontraditional and post-traditional learners.
Faculty Diversity
Although not always representative of their student body, full-time faculty members at MSIs are much more diverse than those at non-MSIs (Figure 3-7). HBCUs stand out, in particular, with a faculty body that is overwhelmingly African American. On average, between 41 and 70 percent of faculty at TCUs are Native Americans—figures that vastly exceed proportions of Native faculty at all other institutions. A much higher proportion of Hispanic faculty are employed at two- and four-year HSIs compared to non-MSIs—Hispanic representation is five times as high at public two-year HSIs and seven times as high at public four-year HSIs, on average.
TABLE 3-3 Enrollment Intensity Patterns at HBCUs, AANAPISIs, and HSIs
| HBCU | AANAPISI | HSI | |||||||
|---|---|---|---|---|---|---|---|---|---|
| Enrollment Intensity | Public two-year | Public four-year | Private four-year | Public two-year | Public four-year | Private four-year | Public two-year | Public four-year | Private four-year |
| Percent Enrolled Exclusively Full Time | 21 | 45 | 56 | 16 | 45 | 71 | 16 | 28 | 49 |
| Percent Enrolled Exclusively Part Time | 14 | 3 | 1 | 11 | 4 | 3 | 12 | 6 | 6 |
| Percent Enrolled with Mixed Enrollment | 65 | 52 | 43 | 73 | 50 | 26 | 72 | 66 | 45 |
TABLE 3-4 Enrollment Intensity Patterns at TCUs
| TCU | ||
|---|---|---|
| Enrollment Intensity | 2-year | 4-year |
| Percentage Enrolled Exclusively Full Time | 59.6 | 67.1 |
| Percentage Enrolled Exclusively Part Time | 40.4 | 32.9 |
NOTE: Data from 2016 fall enrollment; data include enrollments for Native American/Alaska Native and non-Native students.
SOURCE: Data provided by the American Indian Higher Education Consortium.
Turning to faculty diversity in the STEM fields, 2015 data from NSF show varying levels of racial/ethnic diversity at MSIs (Figure 3-8), although their faculty diversity is comparatively notable. Roughly half (48.9 percent) of all STEM faculty at HBCUs were Black/African American, an important statistic given the White majorities at all other MSI and non-MSI types. Asian/Asian Americans represented 22.2 percent of all STEM faculty at AANAPISIs and Hispanics represented 14.4 percent of all STEM faculty at HSIs.
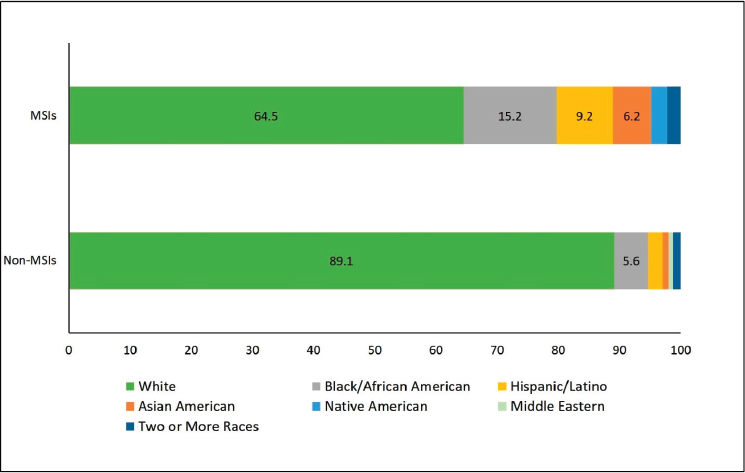
Leadership Diversity
A final point of difference concerns the presence of people of color as senior administrative leaders (i.e., presidents) of colleges and universities (Figure 3-9).
NOTES: There are limited data for four-year private TCUs; hence, these data are not included.
SOURCE: IPEDS 2015 Fall Enrollment Survey. Analysis by the American Council on Education for this report.
NOTE: There are limited data for four-year private TCUs; hence, these data are not included. Percentages below 3 percent were not labeled. See the Annex at the end of this chapter for additional notes.
SOURCE: IPEDS 2015 Fall Staff Survey. Analysis by the American Council on Education for this report.
NOTE: Percentages below 3 percent were not labeled. See the Annex at the end of this chapter for additional notes.
SOURCE: NSF (2015).
Reflecting student and faculty trends, MSI presidents are more diverse when compared to other institution types, although still a low percentage overall. In 2016, 36 percent of MSI presidents were non-White, compared to 17 percent of presidents nationally (Gagliardi et al. 2017). The representation of African American presidents at MSIs was nearly three times that of their representation at non-MSIs (15.2 and 5.6 percent, respectively). The representation of Hispanic presidents at MSIs was quadruple that of their representation at non-MSIs (9.2 and 2.3 percent, respectively). And the representation of Asian American presidents at MSIs was six times that of their representation at non-MSIs (6.2 and 1.0 percent, respectively).
Student Financial Need at MSIs
For all college students, but particularly for many low-income students of color, one of the greatest barriers to obtaining a degree in higher education is the financial cost (Nienhusser and Oshio 2017). Research in fact shows that access to need-based aid is critical to the success of low-income students (Castleman and Long 2016; Perna 2015). This includes access to federal Pell grants, which
NOTE: Percentages below 3 percent were not labeled.
SOURCE: Adapted from Gagliardi et al. (2017).
are awarded to students based on financial need and do not need to be repaid.22,23 Pell grant awardees are often nontraditional students, including independent students, racial/ethnic minorities, students with family responsibilities, and first-generation-to-college students (U.S. Department of Education 2016).
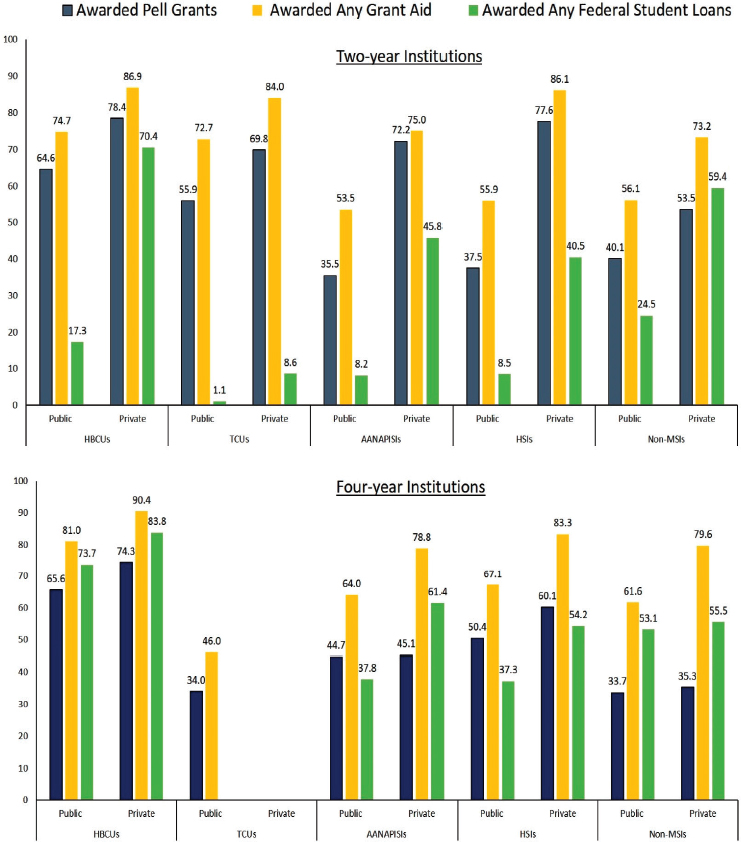
Indeed, this is precisely the profile of many—and in some cases the majority of—students at MSIs. From a financial need perspective, MSIs are again some of the most diverse institutions in the country. Reflected in Figure 3-10, the majority of students in higher education are awarded some form of financial assistance to subsidize their education costs. However, when comparing the percentage of students awarded Pell grants at MSIs to those at non-MSIs, there are substantial differences, most notably at HBCUs and HSIs. For example, on average, at public four-year HBCUs and HSIs, 65.6 and 50.4 percent of students are Pell grant recipients, respectively, compared to 33.7 percent at public four-year non-MSIs.
___________________
22 To review the different options for financial aid from the U.S. Department of Education, see https://www2.ed.gov/fund/landing.jhtml.
23 For additional information on U.S. Department of Education’s federal Pell grants, see https://www2.ed.gov/programs/fpg/index.html.
NOTE: There are limited data for four-year private TCUs; hence, these data are not included. See the Annex at the end of this chapter for additional notes.
SOURCE: IPEDS 2014-2015 Financial Aid Survey. Analysis by the American Council on Education.
Given the low educational and general expenditures, and the overall limited financial resources at MSIs, the sustainability of need-based aid is critical for student success at these institutions. Students are often unable to draw upon family resources to make up the difference when this aid is reduced or withdrawn, and MSIs are generally less equipped to help alleviate students’ financial burden of tuition and fees, compared to Predominantly White Institutions. As a result, federal need-based grants are critical to ensuring access to high-quality higher education, particularly for students of color and even more so for students of color at MSIs. Any cuts in federal financial aid, such as the Pell grant program, will have significant implications for the educational opportunity and advancement of students of color, including those at MSIs. (See Chapter 6 to review the committee’s recommendation to Congress regarding need-based aid.)
CHALLENGES WITH INSTITUTIONAL METRICS
This chapter has described the institutional diversity both within and between MSIs. Yet across the different definitions, federal designations, and funding streams, MSIs share common challenges related to the applicability of traditional performance metrics. Metrics such as retention rate, graduation rate, and postgraduate income are commonly used as across-the-board measures to compare the quality and success of academic institutions. However, as noted, the student bodies at MSIs look very different from those for which higher education was originally intended. As a result, standard metrics of performance are inadequate or do not readily apply.
The U.S. higher education system allows for great diversity in the student pathways taken to obtain a degree or credential, as well as for the life circumstances of students traveling these pathways. In evaluating the performance of MSIs, particularly MSIs that are less selective or open access, contextual factors must be considered. These factors include students’ financial circumstances, life stage, commitments to work and family, and academic preparation. Many standard accountability metrics fail to take these factors into consideration and are therefore inadequate measures of MSI performance. Such measures also inadequately address the progress of students who attend college part time and students who need to take time away from their studies, common scenarios for low-income students and those balancing work, family, and education (Carnevale et al. 2015; Soares et al. 2017). In many cases, the comparatively limited resources of MSIs mean that they are constrained in how much additional financial support they can offer these students to support retention.
In this respect, graduation rates (measures that look at graduation of full-time students within a certain time period) do not depict the experiences of many students at MSIs—and indeed for students at many other institutions. Comparing terminal graduation rates across institutions as a metric of success puts MSIs at a point of disadvantage and sets up a disparity that labels MSIs as “poorer” quality,
or worse, failing in their missions to help students succeed. Many states use performance- or outcomes-based funding (POBF) models to allocate funding to the institutions within their states (Jones et al. 2017). When these models rely too heavily on graduation rates and other standardized metrics, they miss many of the other attributes that characterize MSI success (Espinosa et al. 2014; Núñez 2014; Orfield and Hillman 2018; Rodriguez et al. 2012). When evaluating the success of institutions, including MSIs, it is incumbent on decision makers to understand what the data do and do not reveal.
Research on the effects of state POBF indicates that it has been ineffective at reaching intended goals of raising graduation rates (Dougherty and Reddy 2011). Furthermore, POBF can result in unintended negative consequences, such as diminishing academic standards in order to raise graduation rates, and may penalize institutions such as MSIs that provide access to students with fewer resources by reducing institutional resources for those students even further (Dougherty and Reddy 2011; Li 2014). Given that many MSIs have been historically underfunded and enroll relatively large shares of students with lower academic preparation (Flores and Park 2013, 2015; Núñez and Bowers 2011), these schools often need more resources per student to provide sufficient academic and student support, as compared to more selective, Predominantly White Institutions. In light of these findings, researchers have called for institutional metrics to take into account the nation’s diverse institutional missions, populations, student needs, and resource constraints, a move that this committee endorses.
As there are multiple steps in the myriad pathways to success, it is important to recognize students’ achievements across a diverse set of competencies. As a potential solution to this issue, Li, Gandara, and Assalone (2018) have suggested factoring in other metrics aside from graduation rates, such as student completion of developmental education performance (e.g., supplemental reading and writing courses). Espinosa, Turk, and Taylor (2017) point out that “students enroll in college with a set of unique characteristics, experiences, and backgrounds, as well as changing educational needs and goals” (p. 8), thus urging stakeholders to look at other outcomes, including transfer rates, course completion, and skills enhancement, in addition to graduation rates. They also suggest disaggregating success rates by enrollment intensity, whether full time, part time, or some combination, as well as using metrics that expand the time period by which students are tracked, particularly for students who begin at two-year institutions.
Espinosa, Turk, and Taylor (2017) used 2007 cohort data from the National Student Clearinghouse (NSC) to examine MSI student enrollment and outcomes for students who started their postsecondary education at an MSI.24 Their findings
___________________
24 To determine completion rates for two-year institutions, American Council on Education (ACE) used a four-year (or 200 percent of normal time) completion period. For four-year institutions, ACE used a six-year (or 150 percent of normal time) completion period. Throughout their report, ACE notes the substantial difference between the National Student Clearinghouse completion rates for full-time students with the federal graduation rates (Espinosa et al. 2017).
confirm (as discussed above) that the majority of students at MSIs do not attend college exclusively full time, but rather enroll primarily through mixed enrollment, moving between full-time and part-time status. Yet, the federal graduation rate measures students who complete within 150 percent of normal time at their starting institution. Therefore, students who transfer and complete degrees at other institutions are not taken into account in the federal approach to measuring an institution’s graduation rate.
The robustness of NSC data allows for tracking students across institutions and enrollment intensities, allowing for a more complete picture of student outcomes. Notably, for each MSI type, the NSC completion rates were substantially higher than the reported federal graduation rates, most notably for full-time students (Tables 3-5 and 3-6).
A 2012 report by the American Institutes for Research examined the role of MSIs in STEM education and recommended specific indicators to measure the success of efforts to broaden the participation of underrepresented groups in
TABLE 3-5 Four-Year Outcomes (200 Percent Normal Time) at Two-Year MSIs: Fall 2007 Cohort
| HBCU | HSI | AANAPISI | |
|---|---|---|---|
| NSC Total Completion Rate: Exclusively Full-Time Students | 32.1 | 40.3 | 42.6 |
| Federal Graduation Rate | 13.9 | 25.5 | 27.9 |
NOTE: The federal graduation rate is most comparable to the total completion rate for exclusively full-time students in NSC data.
SOURCE: Espinosa et al. (2017).
TABLE 3-6 Six-Year Outcomes (150 Percent Normal Time) at Four-Year MSIs: Fall 2007 Cohort
| HBCU | HSI | AANAPISI | |
|---|---|---|---|
| Private Four-Year | |||
| NSC Total Completion Rate: Exclusively Full-Time Students | 66.7 | 77.9 | 93.2 |
| Federal Graduation Rate | 43.9 | 49.1 | 81.0 |
| Public Four-Year | |||
| NSC Total Completion Rate: Exclusively Full-Time Students | 61.8 | 74.1 | 87.9 |
| Federal Graduation Rate | 34.1 | 42.7 | 66.2 |
NOTE: The federal graduation rate is most comparable to the total completion rate for exclusively full-time students in NSC data.
SOURCE: Espinosa et al. (2017).
STEM (AIR 2012). Stakeholders who contributed to the study called for measures that examine STEM degree program quality, establish institutional baselines against which expectations and ultimately outcomes could be derived, and compare like institutions to one another, rather than against institutions who serve a very different student body. Other measures covered in the report include skill development, dispositional and attitude measures, the availability of resources and opportunities, and a given institution’s student body diversity (AIR 2012). The Bill & Melinda Gates Foundation, in partnership with the Institute for Higher Education Policy, offers a framework that seeks to address both efficiency and equity in institutional measurement (Engle 2016). The framework offers “a set of metrics that are currently in use by major initiatives to measure institutional performance related to student access, progression, completion, cost, and postcollege outcomes. The framework also highlights metrics in use that examine institutional performance in relation to resources (efficiency) and with respect to diverse populations (equity)” (Engle 2016).
In summary, it is important to determine the best possible metrics to most accurately evaluate the success of students at all institutions. In an era in which accountability standards and performance-based funding are increasing, it is important not to penalize MSIs by holding them to a standard devoid of their context. The committee is not saying that MSIs should not be held accountable. Quite the contrary. It is because MSIs are serving the underserved in American higher education that they must do it well and do right by the students who walk through their doors.
A new National Academies of Sciences, Engineering, and Medicine report, Indicators for Monitoring Undergraduate STEM Education provides a framework and a set of indicators to most effectively determine the status and quality of undergraduate STEM education across multiple years (NASEM 2018). The report describes the limitations of the current national-level indicators system, primarily its ineffectiveness to appropriately track complex student pathways.
Three conclusions from that report are most relevant to the current committee’s charge: (1) federal data systems will need additional data on full-time and part-time students’ trajectories across, as well as within, institutions; (2) recurring longitudinal surveys of instructors and students are needed; and (3) to monitor progress toward the goal of equity, diversity, and inclusion, national data systems will need to include demographic characteristics beyond gender and race and ethnicity, including at least disability status, first-generation college-going student status, and socioeconomic status. These conclusions bolster this committee’s recommendations for a national-level change in metrics to better support MSIs and their students. (See Chapter 6 to review the committee’s recommendations to federal and state agencies to improve MSI assessment metrics.)
CONSIDERING WHAT IT MEANS TO “SERVE” MINORITY STUDENTS
Beyond appropriate accountability metrics lies a final item for consideration, namely, what it means to “serve” the distinct needs of the MSI students discussed throughout this report, as opposed to simply enrolling them. It is clear that serving students means different things to different campuses. Here, too, finding language to define and frame MSIs as a collective group of institutions can be challenging because there is as much diversity across the nation’s MSIs as there is across the entire U.S. higher education landscape. The potential range of emphases on missions to serve specific minority populations—for example, between historically designated and enrollment-designated MSIs—illustrates the danger in lumping all MSIs together and points to the need for policy makers, practitioners, and others to consider carefully each MSI within its immediate geographic, social, political, historical, fiscal, and educational context.
The research community has taken note of such differences, with many MSI scholars now engaged in research and dialogue that attempts to further unpack what it truly means to serve students of color. Such research has found that to fully understand how campuses engage in serving minority students, it is often necessary to visit and speak directly with stakeholders. As further discussed in Chapter 5 of this report, observing and engaging with faculty, staff, students, and leaders engaged in STEM disciplines at these institutions reveals organizational behaviors that might otherwise go unrepresented in formally articulated missions or strategic plans.
The implication of being an MSI is that it should serve its target population. In research, policy, and practice, “serving” is often framed as graduating high numbers and shares of that target population, particularly in relation to majority populations at the institution (e.g., García 2017). While graduation and completion rates of minority populations are critical, and should always be considered when understanding an institution’s capacity to serve its students, the organizational behaviors that MSIs undertake to promote graduation and completion rates are also important to consider.
Thus, two critical dimensions can constitute an MSI’s (or any institution’s) approach to serving its students: institutional outcomes and organizational culture (García 2017). Grounded in research on HSIs, the largest, fastest-growing, and most diverse MSI type, García (2017) proposed a typology of HSIs that is useful for understanding variations among other MSIs as well. This typology advances the idea that an HSI that truly serves Hispanic students incorporates an organizational identity that not only promotes Hispanic students’ outcomes, but also does so in ways that affirm and support Hispanic students’ cultural and familial backgrounds. In contrast, an institution that graduates high shares of its target minority population without having the organizational behaviors that are specifically targeted for that population would not be classified as truly “serving”
its students. (See Chapter 5 for a greater discussion on intentionality and strategies to support MSI student success.)
With the expected increases in the number of MSIs, given that Hispanics and Asian Americans are projected to be the fastest-growing ethnic groups in the United States, it is important to consider whether federal funds received by these schools will be used with an intentional purpose to serve and support the students for whom these funds are intended. Going beyond federal definitions of MSIs means taking into account organizational cultures in these institutions as well as their outcomes. Thus, it becomes important to examine and document the everyday and longer-term activities and behaviors that create organizational cultures that can promote minority student success. Given the varied missions of MSIs, the specific dimensions of organizational behavior that “serve” the targeted population of students will vary—and should be celebrated.
CHAPTER ANNEX
- IPEDS data, collection year 2015, were used to create the list of institutions throughout this report for analysis run by the American Council on Education. Data in this report reflect Title IV participating, degree-granting, public and private, nonprofit, two-year and four-year institutions that offered undergraduate degrees. College Scorecard 2015-16 data were used to flag institutions that were eligible to apply for federal MSI funding in that given fiscal year through Title III and Title V of the Higher Education Opportunity Act of 2008. Out of 3,129 total institutions, 714 were eligible for MSI designation. Of these institutions, 76 were eligible for more than one MSI designation.
- Institutions were classified into a sector based on the institutional category variable and control variable in IPEDS. Within institutional category, all institutions categorized as degree-granting, primarily baccalaureate or above institutions were classified as four-year institutions, and all institutions categorized as degree-granting, not primarily baccalaureate or above and degree-granting, associate’s and certificates institutions were classified as two-year institutions. The control variable was used to classify institutions as public or private nonprofit.
- IPEDS data, collection year 2015, were used to create the list of institutions throughout this report for analysis run by the American Council on Education. Data in this report reflect Title IV participating, degree-granting, public and private, nonprofit, two-year and four-year institutions that offered undergraduate degrees. College Scorecard 2015-16 data were used to flag institutions that were eligible to apply for federal MSI funding in that given fiscal year through Title III and Title V of the Higher Education Opportunity Act of 2008. Out of 3,129 total institutions, 714 were eligible for MSI designation. Of these institutions, 76 were eligible for more than one MSI designation.
- Classification of Instructional Programs (CIP) codes were placed into Science and Engineering categories based on the fields of study classification found in the NSF’s “Science and Engineering Degrees: 1966–2012,” appendix B, with additions made to cover CIP codes found in the IPEDS completions data that were not included in the NSF taxonomy.
- For enrollment, the CIP codes 13.0000, 52.0000, and 22.0101 were classified as “Non-STEM,” while the remaining CIP codes were classified as “STEM.”
- For both the completions and enrollment, the racial category “other” is defined as the combination of “nonresident,” “race unknown,” and “two or more races.” Race reporting varies across years in the IPEDS, so information pertaining to Pacific Islanders is not available for all years and would be combined with counts for Asian students.
- For the enrollment files, we have limited to undergraduate enrollment using the variables LSTUDY and LINE, with criteria that vary by year in accordance with the definition of those variables.
- IPEDS data, collection year 2015, were used to create the list of institutions throughout this report for analysis run by the American Council on Education. Data in this report reflect Title IV participating, degree-granting, public and private, nonprofit, two-year and four-year institutions that offered undergraduate degrees. College Scorecard 2015-16 data were used to flag institutions that were eligible to apply for federal MSI funding in that given fiscal year through Title III and Title V of the Higher Education Opportunity Act of 2008. Out of 3,129 total institutions, 714 were eligible for MSI designation. Of these institutions, 76 were eligible for more than one MSI designation.
- Classification of CIP codes into Science and Engineering categories was based on the fields of study classification found in the NSF’s “Science and Engineering Degrees: 1966–2012,” appendix B, with additions made to cover CIP codes found in the IPEDS completions data that were not included in the NSF taxonomy. For enrollment, the CIP codes 13.0000, 52.0000, and 22.0101 were classified as “Non-STEM,” while the remaining CIP codes were classified as “STEM.”
- For both the completions and enrollment, the racial category “other” is defined as the combination of “nonresident,” “race unknown,” and “two or more races.” Race reporting varies across years in the IPEDS, so information pertaining to Pacific Islanders is not available for all years, and would be combined with counts for Asian students.
- For the enrollment files, we have limited to undergraduate enrollment using the variables LSTUDY and LINE, with criteria that vary by year in accordance with the definition of those variables.
- IPEDS data, collection year 2015, were used to create the list of institutions throughout this report for analysis run by the American Council on Education. Data in this report reflect Title IV participating, degree-granting, public and private, nonprofit, two-year and four-year institutions that offered undergraduate degrees. College Scorecard 2015-16 data were used to flag institutions that were eligible to apply for federal MSI funding in that given fiscal year through Title III and Title V of the Higher Education Opportunity Act of 2008. Out of 3,129 total institutions, 714 were eligible for MSI designation. Of these institutions, 76 were eligible for more than one MSI designation.
- Institutions were classified into a sector based on the institutional category variable and control variable in IPEDS. Within institutional category, all institutions categorized as degree-granting, primarily baccalaureate or above institutions were classified as four-year institutions, and all institutions categorized as degree-granting, not primarily baccalaureate or above and degree-granting, associate’s and certificates institutions were classified
- as two-year institutions. The control variable was used to classify institutions as public or private nonprofit.
- S&E stands for science and engineering
- Other race includes non-Hispanics who are Native Americans/Alaska Natives, Native Hawaiians or Other Pacific Islanders, or persons reporting more than one race.
- Postsecondary institutions are defined as two-year college, community college or technical institute; four-year college or university, other than medical school; medical school (including university-affiliated hospital or medical center); and university-affiliated research institute.
- Totals for MSIs are not mutually exclusive, as 47 institutions are classified as both AANAPISI and HSI.
- Faculty is defined as research faculty, teaching faculty, or adjunct faculty working at postsecondary institutions in the United States during the reference period of the first week of February 2015, and reflect part-time and full-time faculty.
- Some data for TCUs have been suppressed given low sample sizes.
- IPEDS data, collection year 2015, were used to create the list of institutions throughout this report for analysis run by the American Council on Education. Data in this report reflect Title IV participating, degree-granting, public and private, nonprofit, two-year and four-year institutions that offered undergraduate degrees. College Scorecard 2015-16 data were used to flag institutions that were eligible to apply for federal MSI funding in that given fiscal year through Title III and Title V of the Higher Education Opportunity Act of 2008. Out of 3,129 total institutions, 714 were eligible for MSI designation. Of these institutions, 76 were eligible for more than one MSI designation.
- Institutions were classified into a sector based on the institutional category variable and control variable in IPEDS. Within institutional category, all institutions categorized as degree-granting, primarily baccalaureate or above institutions were classified as four-year institutions, and all institutions categorized as degree-granting, not primarily baccalaureate or above and degree-granting, associate’s and certificates institutions were classified as two-year institutions. The control variable was used to classify institutions as public or private nonprofit.
REFERENCES
AACC (American Association of Community Colleges). 2018. Fast Facts 2018. Available at: https://www.aacc.nche.edu/wp-content/uploads/2018/04/2018-Fast-Facts.pdf. Accessed September 2018.
AIHEC (American Indian Higher Education Consortium). 1999. “Tribal colleges: An introduction.” Available at: http://www.aihec.org/who-we-serve/docs/TCU_intro.pdf. Accessed October 2018.
AIHEC. 2012. AIHEC AIMS Fact Book 2009-2010: Tribal Colleges and Universities Report. http://www.aihec.org/our-stories/docs/reports/AIHEC_AIMSreport_May2012.pdf. Accessed October 2018.
AIHEC. 2018. “Tribal Colleges and Universities.” Available at: http://aihec.org/who-we-serve/index.htm. Accessed October 2018.
AIR (American Institutes for Research). 2012. “Broadening participation in STEM: A call to action.” Unpublished report, NSF Grant No. HRD-1059774. Washington, DC.
Anderson, James D. 1988. The education of Blacks in the South, 1860-1935. Chapel Hill, NC: University of North Carolina Press.
Arbelo-Marrero, Floralba and Fred Milacci. 2016. “A phenomenological investigation of the academic persistence of undergraduate Hispanic nontraditional students at Hispanic Serving Institutions.” Journal of Hispanic Higher Education 15 (1): 22-40.
Black, Sandra E., Kalena E. Cortes, and Jane Arnold Lincove. 2015. “Apply yourself: Racial and ethnic differences in college application.” National Bureau of Economic Research. Available at: https://www.nber.org/papers/w21368. Accessed October 2018.
Brock, Thomas. 2010. “Young adults and higher education: Barriers and breakthroughs to success.” The Future of Children 20 (1):109-132.
Burrelli, Joan and Alan Rapoport. 2008. “Role of HBCUs as Baccalaureate-Origin Institutions of Black S&E Doctorate Recipients. InfoBrief. NSF 08-319.” National Science Foundation. https://files.eric.ed.gov/fulltext/ED502482.pdf. Accessed January 2019.
Calderón Galdeano, Emily, Antonio R. Flores, and John Moder. 2012. “The Hispanic association of colleges and universities and Hispanic-serving institutions: Partners in the advancement of Hispanic higher education.” Journal of Latinos and Education 11 (3):157-162.
CARE (National Commission on Asian American and Pacific Islander Research in Education). 2011. The Relevance of Asian Americans and Pacific Islanders in the College Completion Agenda. Available at: http://www.apiasf.org/CAREreport/2011_CARE_Report.pdf. Accessed October 2018.
CARE. 2013. Partnership for Equity in Education through Research (PEER): Findings from the First Year of Research on AANAPISIs 2013. Available at: http://www.apiasf.org/pdfs/2013_peer_report/APIASF_and_CARE_PEER_Report_June_2013.pdf. Accessed January 2019.
Carnevale, Anthony P., Nicole Smith, Michelle Melton, and Eric Price. 2015. Learning While Earning: The New Normal. Washington, DC: Georgetown University Center on Education and the Workforce.
Castleman, Benjamin L. and Bridget Terry Long. 2016. “Looking beyond enrollment: The causal effect of need-based grants on college access, persistence, and graduation.” Journal of Labor Economics 34 (4):1023-1073.
Choy, Susan P. 2002. Access & Persistence: Findings from 10 Years of Longitudinal Research on Students. Washington, DC: American Council on Education, Center for Policy Analysis.
Clotfelter, Charles T., Helen F. Ladd, and Jacob L. Vigdor. 2015. Public Universities, Equal Opportunity, and the Legacy of Jim Crow: Evidence from North Carolina. National Bureau of Economic Research. Available at: https://www.nber.org/papers/w21577.pdf. Accessed October 2018.
Cornell, Stephen and Joseph P. Kalt. 2010. American Indian Self Determination: The Political Economy of a Policy That Works. HKS Faculty Research Working Paper Series RWP10-043, John F. Kennedy School of Government, Harvard University. Available at: https://dash.harvard.edu/handle/1/4553307. Accessed October 2018.
Crisp, Gloria, Vincent D. Carales, and Anne-Marie Núñez. 2016. “Where is the research on community college students?” Community College Journal of Research and Practice 40 (9):767-778.
Dougherty, Kevin and Vikash Reddy. 2011. The Impacts of State Performance Funding Systems on Higher Education Institutions: Research Literature Review and Policy Recommendations. Columbia University. doi: 10.13140/RG.2.2.22017.25449.
Engle, Jennifer. 2016. Answering the Call: Institutions and States Lead the Way Toward Better Measures of Postsecondary Performance. Bill and Melinda Gates Foundation 22. Available at: https://postsecondary.gatesfoundation.org/wp-content/uploads/2016/02/AnsweringtheCall.pdf. Accessed January 2019.
Engle, Jennifer and Mary Lynch. 2009. Charting a Necessary Path: The Baseline Report of Public Higher Education Systems in the Access to Success Initiative. Education Trust.
Espinosa, Lorelle L., Jennifer R. Crandall, and Malika Tukibayeva. 2014. Rankings, Institutional Behavior, and College and University Choice: Framing the National Dialogue on Obama’s Ratings Plan. Washington, DC: American Council on Education.
Espinosa, Lorelle L., Jonathan Turk, and Morgan Taylor. 2017. Pulling Back the Curtain: Enrollment and Outcomes at Minority Serving Institutions. Washington, DC: American Council on Education.
Excelencia in Education. 2018. “Emerging Hispanic-Serving Institutions (HSIs): 2016-2017.” Available at: https://www.edexcelencia.org/research/data/emerging-hispanic-serving-institutionshsis-2016-2017. Accessed October 2018.
Fiegener, Mark K., and Steven L. Proudfoot. 2013. “Baccalaureate origins of U.S.-trained S&E doctorate recipients.” InfoBrief, National Center for Science and Engineering Statistics, National Science Foundation.
Flores, Stella M., and Toby J. Park. 2013. “Race, ethnicity, and college success: Examining the continued significance of the minority-serving institution.” Educational Researcher 42 (3):115-128. doi: 10.3102/0013189x13478978.
Flores, Stella M., and Toby J. Park. 2015. “The effect of enrolling in a minority-serving institution for Black and Hispanic students in Texas.” Research in Higher Education 56 (3):247-276.
Gagliardi, Jonathan S., Lorelle L. Espinosa, Jonathan M. Turk, and Morgan Taylor. 2017. The American College President Study: 2017: American Council on Education, Center for Policy Research and Strategy; TIAA Institute.
García, Gina A. 2017. “Defined by outcomes or culture? Constructing an organizational identity for Hispanic-serving institutions.” American Educational Research Journal 54 (1):111S-134S.
Gasman, Marybeth and Thai-Huy Nguyen. 2014. “Historically black colleges and universities (HBCUs): Leading our nation’s effort to improve the science, technology, engineering, and mathematics (STEM) pipeline.” University of Pennsylvania. Philadelphia, PA.
Gasman, Marybeth, Thai-Huy Nguyen, and Clifton F. Conrad. 2015. “Lives intertwined: A primer on the history and emergence of minority serving institutions.” Journal of Diversity in Higher Education 8 (2):120-138. doi: 10.1037/a0038386.
Guillory, Justin P. and Kelly Ward. 2008. “Tribal Colleges and Universities: Identity, Invisibility, and Current Issues.” In Gasman, Marybeth, Benjamin Baez, and Caroline Sotello Viernes Turner, editors. 2008. Understanding Minority-Serving Institutions. Albany, NY: State University of New York Press.
HACU (Hispanic Association of Colleges and Universities). 2012. 1986-2011: 25 Years of Championing Hispanic Higher Education. A Historical Review and a Glimpse into the Future. Available at: https://www.hacu.net/images/hacu/about/HACU_History_1986-2011F.pdf. Accessed October 2018.
HACU. 2017. HACU List of Hispanic-Serving Institutions (HSIs) 2016-17. Available: https://www.hacu.net/images/hacu/OPAI/2016%20HSI%20list.pdf. Accessed October 2018.
HACU. 2018. 2018 Fact Sheet. Hispanic Higher Education and HSIs. Available: https://www.hacu.net/images/hacu/OPAI/2018_HSI_FactSheet.pdf. Accessed October 2018.
Hagedorn, Linda Serra, and Agustina Veny Purnamasari. 2012. “A realistic look at STEM and the role of community colleges.” Community College Review 40 (2):145-164.
Harris, Michael. 2013. Understanding institutional diversity in American higher education. John Wiley & Sons.
Hawkins, B. D. 2012. “Echoes of faith: Church roots run deep among HBCUs.” Diverse Issues in Higher Education. Available at: https://diverseeducation.com/article/17259/. Accessed October 2018.
Hegji, Alexandra. 2017. Programs for Minority-Serving Institutions Under the Higher Education Act. Congressional Research Service. https://fas.org/sgp/crs/misc/R43237.pdf. Accessed January 2019.
Horn, Laura J. and C. Dennis Carroll. 1996. Nontraditional Undergraduates: Trends in Enrollment from 1986 to 1992 and Persistence and Attainment among 1989-90 Beginning Postsecondary Students. Postsecondary Education Descriptive Analysis Reports. Statistical Analysis Report: ERIC.
Jones, Tiffany, Sosanya Jones, Kayla C. Elliott, LaToya Russell Owens, Amanda E. Assalone, and Denisa Gándara. 2017. Outcomes Based Funding and Race in Higher Education: Can Equity be Bought? New York: Springer.
Kim, Mikyong Minsun. 2002. “Historically Black vs. White institutions: Academic development among Black students.” The Review of Higher Education 25 (4):385-407.
Kim, Mikyong Minsun and Clifton F. Conrad. 2006. “The impact of historically black colleges and universities on the academic success of African-American students.” Research in Higher Education 47 (4):399-427. doi: 10.1007/s11162-005-9001-4.
Li, Amy Y. 2014. “Performance funding in the states: An increasingly ubiquitous public policy for higher education.” Higher Education in Review 11.
Li, Amy Y., Denisa Gándara, Amanda Assalone. 2018. “Equity or disparity: Do performance funding policies disadvantage 2-year minority-serving institutions?” Community College Review 46(3), 288–315. https://doi.org/10.1177/0091552118778776
Lumina Foundation. 2015. Who is Today’s Student. Available at: https://www.luminafoundation.org/files/resources/todays-student-summary.pdf. Accessed October 2018.
Ma, Jennifer, and Sandy Baum. 2016. Trends in Community Colleges: Enrollment, Prices, Student Debt, and Completion. College Board Research Brief.
Ma, Jennifer, Sandy Baum, Matea Pender, and Meredith Welch. 2017. Trends in College Pricing. New York: The College Board.
McCormick, Alexander C., and Chun-Mei Zhao. 2005. “Rethinking and reframing the carnegie classification.” Change: The Magazine of Higher Learning 37 (5):51-57. doi: 10.3200/CHNG.37.5.51-57.
Mooney, Geraldine M., and Daniel J. Foley. 2011. “Community colleges: Playing an important role in the education of science, engineering, and health graduates.” Available at: http://www.nsf.gov/statistics/infbrief/nsf11317. Accessed October 2018.
Museus, Samuel D., and Julie J. Park. 2015. “The continuing significance of racism in the lives of Asian American college students.” Journal of College Student Development 56 (6):551-569.
Museus, Samuel D., Raquel Wright-Mair, Jacqueline Mac. 2018. How Asian American and Native American Pacific Islander Serving Institutions (AANAPISIs) Are Creating the Conditions for Students to Thrive. Available at: https://www.indiana.edu/~cece/wordpress/wp-content/uploads/2017/02/Research-Brief-How-AANAPISI-Thrive.pdf. Accessed October 2018.
NASEM (National Academies of Sciences, Engineering, and Medicine) 2018. Indicators for Monitoring Undergraduate STEM Education. Washington, DC: National Academies Press.
Native Science Report. 2018. “Tribal Colleges: An introduction.” Available at: http://nativesciencereport.org/introduction/. Accessed October 2018.
National Center for Education Statistics. 2018. “Two and four year Historically Black Colleges and Universities.” Available at: https://nces.ed.gov/COLLEGENAVIGATOR/?s=all&ct=1+2&sp=4. Accessed October 2018.
Nguyen, Bach Mai Dolly, Mike Hoa Nguyen, Robert T. Teranishi, and Shirley Hune. 2015. “The hidden academic opportunity gaps among Asian Americans and Pacific Islanders: What disaggregated data reveals in Washington state.” Educational Testing Service.
Nguyen, Bach Mai Dolly, Mike Hoa Nguyen, Jason Chan, and Robert T. Teranishi. 2016. “The racialized experiences of Asian American and Pacific Islander Students: An examination of campus racial climate at the University of California, Los Angeles.” National Commission on Asian American and Pacific Islander Research in Education. ERIC.
Nguyen, Thai-Huy Peter. 2015. “Exploring Historically Black College and Universities’ Ethos of racial uplift: STEM students’ challenges and institutions’ practices for cultivating learning and persistence in STEM.” Available at: http://repository.upenn.edu/edissertations/1105. Accessed October 2018.
Nguyen, Thai-Huy, Valerie Lundy-Wagner, Andres Samayoa, and Marybeth Gasman. 2015. On Their Own Terms: Two-Year Minority Serving Institutions. New York: Center for Analysis of Postsecondary Education and Employment, Columbia University.
Nienhusser, Kenny H., and Toko Oshio. 2017. “High school students’ accuracy in estimating the cost of college: A proposed methodological approach and differences among racial/ethnic groups and college financial-related factors.” Research in Higher Education 58 (7):723-745.
NRC (National Research Council) 1996. Colleges of Agriculture at the Land Grant Universities: Public Service and Public Policy. Washington, DC: National Academy Press. https://doi.org/10.17226/5133.
NSF (National Science Foundation). 2015. National Center for Science and Engineering Statistics, Survey of Doctorate Recipients: 2015. Available at: https://ncsesdata.nsf.gov/doctoratework/2015/. Accessed October 2018.
Núñez, Anne-Marie. 2014. Counting What Counts for Latinas/os and Hispanic-Serving Institutions: A Federal Ratings System and Postsecondary Access, Affordability, and Success. New York: President’s Advisory Commission on Educational Excellence for Hispanics.
Núñez, Anne-Marie and Alex J. Bowers. 2011. “Exploring what leads high school students to enroll in Hispanic-serving institutions: A multilevel analysis.” American Educational Research Journal 48 (6):1286-1313.
Núñez, Anne-Marie, Sylvia Hurtado, and Emily Calderón Galdeano. 2015. Hispanic-Serving Institutions: Advancing Research and Transformative Practice. New York: Routledge.
Núñez, Anne-Marie, Gloria Crisp, and Diane Elizondo. 2016. “Mapping Hispanic-serving institutions: A typology of institutional diversity.” Journal of Higher Education 87 (1):55-83. doi: 10.1353/jhe.2016.0001.
Olivas, Michael A. 1982. “Indian, Chicano, and Puerto Rican colleges: Status and issues.” Bilingual Review/La Revista Bilingüe, 36-58.
Orfield, Gary and Nicholas Hillman 2018. (eds.) Accountability and Opportunity in Higher Education: The Civil Rights Dimension. Cambridge, MA: Harvard Education Press.
PCAST (President’s Council of Advisors on Science and Technology). 2012. Report to the President. Engage to Excel: Producing One Million Additional College Graduates with Degrees in Science, Technology, Engineering, and Mathematics. Executive Office of the President. Available at: https://obamawhitehouse.archives.gov/sites/default/files/microsites/ostp/pcast-engage-to-excelfinal_2-25-12.pdf. Accessed October 2018.
Perna, Laura W. 2015. “Improving college access and completion for low-income and first-generation students: The role of college access and success programs.” Available at: https://repository.upenn.edu/gse_pubs/301. Accessed October 2018.
QEM (Quality Education for Minorities Network). 2012. Promising Practices in STEM Education and Research at Institutions Supported through the National Science Foundation (NSF)’s Tribal Colleges and Universities Program (TCUP).
Ramakrishnan, Karthick and Farah Z. Ahmad. 2014. State of Asian Americans and Pacific Islanders Series: A Multifaceted Portrait of a Growing Population. Washington, DC: Center for American Progress.
Rodriguez, Carlos, Rita Kirshstein, Lauren Banks Amos, Wehmah Jones, Lorelle Espinosa, and David Watnick. 2012. “Broadening participation in STEM: A call to action.” Unpublished report, NSF Grant No. HRD-1059774. Washington: American Institutes for Research.
Santiago, Deborah, Morgan Taylor, and Emily Calderón Galdeano. 2016. From Capacity to Success: HSIs, Title V, and Latino Students. Washington, DC: Excelencia in Education. Available at: https://vtechworks.lib.vt.edu/bitstream/handle/10919/83089/FromCapacitytoSuccessLatinoStudents.pdf?sequence=1. Accessed October 2018.
Santiago, Deborah A., Emily Calderón Galdeano, and Morgan Taylor. 2015. “The condition of Latinos in education: 2015 factbook.” Excelencia in Education. Available at: https://www.edexcelencia.org/research/publications/condition-latinos-education-2015-factbook. Accessed October 2018.
Sibulkin, Amy E., and J.S. Butler. 2011. “Diverse colleges of origin of African American doctoral recipients, 2001–2005: historically black colleges and universities and beyond.” Research in Higher Education 52 (8):830-852.
Soares, Louis, Jonathan S. Gagliardi, and Christopher J. Nellum. 2017. “The post-traditional learners manifesto revisited.” American Council on Education. Available at: https://www.acenet.edu/news-room/Documents/The-Post-Traditional-Learners-Manifesto-Revisited.pdf. Accessed October 2018.
Solórzano, Daniel G. and Ronald W. Solórzano. 1995. “The Chicano educational experience: A framework for effective schools in Chicano communities.” Educational Policy 9 (3):293-314.
Starobin, Soko S., Tom Schenk Jr., Frankie Santos Laanan, David G. Rethwisch, and Darin Moeller. 2013. “Going and passing through community colleges: Examining the effectiveness of project lead the way in STEM pathways.” Community College Journal of Research and Practice 37 (3):226-236.
Stull, Ginger, Demetrios Spyridakis, Marybeth Gasman, Andres Samayoa, and Yvette Booker. 2015. “Redefining success: How tribal colleges and universities build nations, strengthen sovereignty, and persevere through challenges.” Center for Minority Serving Institutions.
Taniguchi, Hiromi and Gayle Kaufman. 2005. “Degree completion among nontraditional college students.” Social Science Quarterly 86 (4):912-927.
Teranishi, Robert T., Dina C. Maramba, and Minh Hoa Ta. 2013. “Asian-American and Native American Pacific Islander Serving Institutions (AANAPISIS).” Fostering success of ethnic and racial minorities in STEM: The role of minority serving institutions. p.168. New York: Rutledge.
Thurgood Marshall College Fund. 2015. “Brief history of HBCUs.” Available at: https://tmcf.org/about-us/our-schools/brief-history-of-hbcus. Accessed October 2018.
UNCF (United Negro College Fund). 2017. HBCUs Make America Strong: The Positive Economic Impact of Historically Black Colleges and Universities. Available at: http://images.uncf.org/production/HBCU_Consumer_Brochure_FINAL_APPROVED.pdf?_ga=2.139166256.2045359234.1540825231-851689931.1537544139. Accessed October 2018.
U.S. Census Bureau. 2015. Projections of the Size and Composition of the U.S. Population: 2014 to 2060. Population Estimates and Projections. Current Population Reports. P25-1143. Washington, DC: U.S. Census Bureau. Available at: https://www.census.gov/content/dam/Census/library/publications/2015/demo/p25-1143.pdf. Accessed October 2018.
U.S. Census Bureau. 2017. American Community Survey and Puerto Rico Community Survey; Code List. Available at: https://www2.census.gov/programssurveys/acs/tech_docs/code_lists/2017_ACS_Code_Lists.pdf. Accessed September 2018.
U.S. Department of Education. 1991. “Historically Black colleges and universities and higher education desegregation.” Office for Civil Rights. Available at: https://www2.ed.gov/about/offices/list/ocr/docs/hq9511.html. Accessed October 2018.
U.S. Department of Education. 2015. College Scorecard 2015. Available at: https://collegescorecard.ed.gov/. Accessed October 2018.
U.S. Department of Education. 2016. Trends in Pell Grant Receipt and the Characteristics of Pell Grant Recipients: Selected Years, 1999-2000 to 2011-2012. https://nces.ed.gov/pubs2015/2015601.pdf. Accessed January 2019.
U.S. Department of Education. 2017. Asian American and Native American Pacific Islander-Serving Institutions Program. Available at: https://www2.ed.gov/programs/aanapi/index.html. Accessed October 2018.
Valdez, Patrick L. 2015. An overview of Hispanic-Serving Institutions’ legislation: Legislation policy formation between 1979 and 1992. In Mendez, J.P., Bonner II, F.A., Méndez-Negrete, J., & Palmer, R.T. (Eds.). Hispanic Serving Institutions in American higher education: Their origin, and present and future Challenges (5-29). Sterling, VA: Stylus. Available at: https://styluspub.presswarehouse.com/browse/book/9781620361443/Hispanic-Serving%20Institutions%20in%20American%20Higher%20Education. Accessed January 2019.
Van Noy, Michelle, and Matthew Zeidenberg. 2017. “Community college pathways to the STEM workforce: What are they, who follows them, and how?” New Directions for Community Colleges 178:9-21.
Vollman, Alexandra. 2017. “Asian American students find academic, cultural support at UIC.” Available at: http://diversity.uic.edu/news-stories/asian-american-students-find-academic-culturalsupport-at-uic/. Accessed October 2018.
Wortham, Stanton, Emerson Fisher, Enrique G. Murillo, and Edmund T. Hamann. 2002. Education in the New Latino Diaspora: Policy and the Politics of Identity. Vol. 2. Westport, CT: Greenwood Publishing Group.
Wortham, Stanton, Katherine Clonan-Roy, Holly Link, and Carlos Martínez. 2013. “Scattered challenges, singular solutions: The new Latino diaspora.” Phi Delta Kappan 94 (6):14-19.


