APPENDIX D
CO2 Flux Calculation
The flux of carbon dioxide (CO2) across an interface is an important parameter in determining the amount of material required for a given amount of separation in addition to the size of the contact area required. The flux of CO2 across an interface may be represented by:
![]()
Such that,
JCO2 = flux of CO2 across the interface from gas to liquid in the case of a solvent or from gas to pore in the case of a solid sorbent
Ci = concentration of CO2 at the interface. In the case of a solvent, this is the Henry’s law solubility. In the case of a solid sorbent it could be the equilibrium capacity of the material based upon a Henry’s law estimation approach.
H = Henry’s law constant in units of atm∙cm3/mol
pCO2 = partial pressure of CO2
kl = mass-transfer coefficient. In the case of a solvent, this is strictly the liquid-phase mass-transfer coefficient. In the case of a solid sorbent or mineral, this could be an effective mass-transfer coefficient, based upon all of the dominating diffusion resistances present in the system (see Ruthven, 1984 for details), that is, water on the pellet, macropore diffusion, etc.
E = enhancement factor, which is only present when a chemical reaction takes place
For simplicity, and to exhibit the unique requirements required of a CO2 separation process for an extremely dilute system (air) compared to a moderately dilute system (coal exhaust), only solvent-based separation will be considered in the remainder of this discussion. The enhancement factor, E, can be calculated for a chemically-reacting solvent based upon the concentration of reactant present and the rate of chemical reaction. For instance, the reaction may take place instantaneously, which means CO2 reacts at the interface, indicating that the base reacting with CO2 is much greater in concentration than CO2 present at the interface. In this case, E = Ei, such that
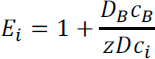
where DB equals the diffusivity of the base, cB is the concentration of the base, z is the stoichiometric coefficient of the base in the chemical reaction, D is the CO2 diffusivity, and ci is the interfacial concentration of CO2.
Most solvents to date do not react with CO2 instantaneously, but rather via a fast pseudo-first-order reaction, in which case,
![]()
such that k is the rate of the chemical reaction. In this case, the equation on page 469 can be rewritten as:
![]()
which would represent the CO2 flux across the gas-liquid interface of the majority of solvents known today.
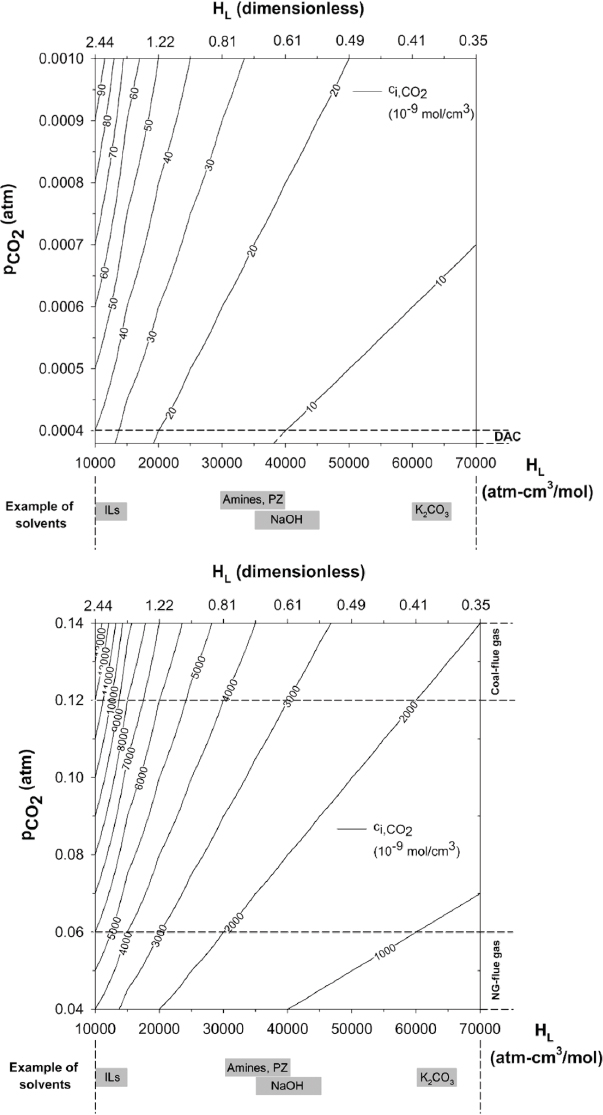
Figure D.1 shows the interfacial concentration as a function of pCO2 and H or air capture (top) and the flue gas of natural gas and coal-fired power plants (bottom). To illustrate the impact that dilution has on the CO2 flux, taking amine-based solvents as an example, for air capture, ci is ~10, while for coal-fired flue gas, it is approximately 250 times greater at approximately 2,500 mol/cm3. Based upon the flux equation, this means that to enhance the flux of CO2 across the gas-sorbent interface for the case of air capture, the product kLE must be 250. The mass transfer coefficient changes by at most a factor of 10. The mass-transfer coefficient, kL, is dependent on the process parameters used in contacting the air and sorbent. For instance, the air can interact with the sorbent via coated packing or bubbles. In addition, the way in which the air flows over the solvent impacts this parameter, that is, cross-flow vs counter-flow. The enhancement factor depends primarily on the rate constant of the chemical reaction between CO2 and the chemical binding to it. Hence, a chemical with a rate constant 25 times greater, combined with a process that allows for the mass-transfer coefficient to be maximized, has the potential to create a flux for air capture equivalent to the more concentrated scenario of coal-fired flue gas exhaust. It is not necessary for the air capture flux to match that of flue gas for its success, but improving materials in this way could results in more competitive costing because the capital expense would surely decrease with fewer required units for separation. Hence, the development of new chemistries that could lead to enhancing the rate of chemical reaction with CO2 could
be of interest in terms of future research. These new chemistries could also play a role in enhancing the flux of CO2 for more concentrated CO2 cases as well.
SOLID SORBENT SYSTEM
To assess the bounds of a generic, hypothetical air capture process employing adsorption as the separation technology, the methodology outlined in the work of Sinha et al. (2017) was employed. This approach, applying mass and energy balances to each individual step in the overall process, calculating energy requirements, and then assessing the costs of the necessary capital equipment, has been applied to various scenarios to arrive at overall costs for the separations process.
In the analysis employed, an array of critical parameters was defined within a range of values deemed physically realistic, and from these parameters other key parameters are calculated (Figure D.2). A stepwise approach to calculating process energetics and costs was then applied. In the first step, the contactor:adsorbent ratio, adsorbent purchase cost, and adsorbent lifetime are defined. The contactor is the structure that
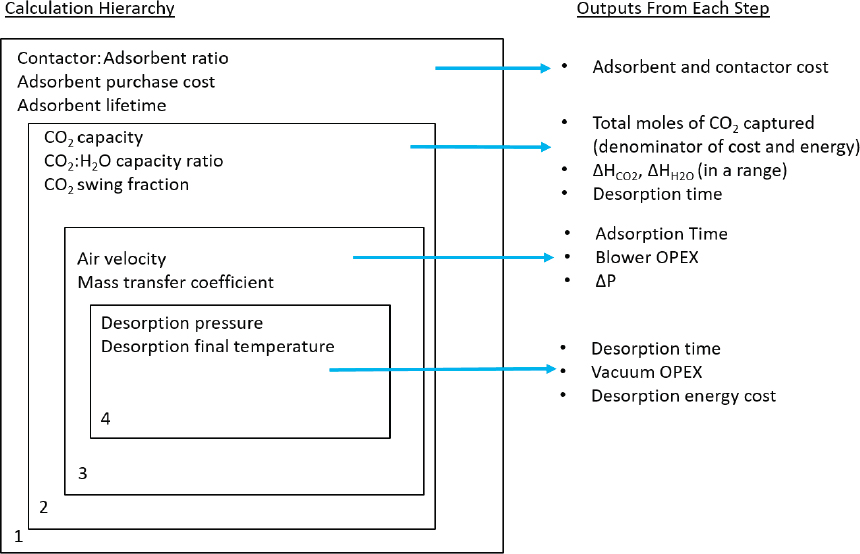
provides for high surface area gas-solid contacting, whereas the adsorbent is the chemical agent that binds the CO2. From these values, the adsorbent and contactor costs are determined. In the limiting case where the adsorbent and contactor are the same, the contactor cost goes to zero. This case was not specifically considered here.
Next, the total CO2 capacity was defined, the ratio of the CO2 and H2O capacities, and the fraction of captured CO2 desorbed and collected as product (CO2 swing capacity) were defined. These define the total moles of CO2 captured, which is a key parameter in the denominator of the cost and energy. The heat of adsorption of CO2 is also defined, constrained within a range (DHCO2). The desorption time is also defined based on a transient energy balance calculation using 100°C saturated steam as the heat transfer media, which transfers heat through the heat of condensation. In these calculations, the model envisaged that the steam is directly contacted with the sorbent, providing both a concentration and thermal driving force for desorption. In this approach, the sorbent quickly attains a pseudo-steady-state capacity of adsorbed water, becoming hydrated after steaming, with some water desorption occurring via evaporative cooling upon exposure to fans blowing air through the material in the next adsorption step. Based on the water transfer rate, the amount of water lost by evaporation was calculated such that the heat transfer was sufficient to reduce the sorbent/contactor combination to the initial conditions based on the sensible heat requirement of the adsorbent/contactor system (Jeong et al., 2010). This is essential to reinitialize the system for the next adsorption step. Given the high content of adsorbed water on the sorbent surface owing to the direct steaming heat transfer approach, the amount of water adsorbed from the air in each adsorption cycle is estimated to be minimal in this gas-solid contacting strategy. In contrast, alternate strategies are being employed in practice, whereby heat is transferred indirectly and the steam does not directly contact the sorbent. This alternate approach might offer less efficient heat transfer but better protects the sorbent from possible degradation by direct steam contact. This approach also would result in more water being extracted from humidity in the air. No attempt was made to model every known process, but rather to use the representative, generic process for energy and cost estimations.
In the next phase, the pressure drop is derived from a calculation that considers the velocity, contactor length, and radius of a contactor channel. The mass-transfer coefficient is derived from the velocity calculation. The mass-transfer coefficient is a lumped parameter that accounts for all potential resistances to mass transfer, including film resistance, macropore resistances, as well as micropore resistances. The adsorption time depends on the mass transfer coefficient, pressure drop, and velocity. From these parameters, blower or fan operating costs were determined.
TABLE D.1 Parameters Used to Calculate Lower-Bound and Upper-Bound Costs for Direct Air Capture with Solid Sorbents
| Process Parameters | Lower/Upper Bounds |
|---|---|
| Adsorbent purchase cost ($/kg) | 15/100 |
| Adsorbent lifetime (yrs) | 5/0.25 |
| Sorbent total capacity (mol/kg) | 1.5/0.5 |
| Desorption swing capacity | 0.9/0.75 SCmax |
| CO2:water ratio | 1:2/1:40 |
| Desorption pressure (bar) | 0.2/1 |
| Final desorption temperature (K) | 340/373 |
| Thermal Energy Outputs | |
| MJ/mole | 0.08/0.85 |
| GJ/tCO2 | 1.85/19.3 |
| kW-hr/tCO2 | 514/5367 |
| Electrical Energy Outputs | |
| MJ/mole | 0.003/0.167 |
| GJ/tCO2 | 0.08/3.79 |
| kW-hr/tCO2 | 20/1055 |
| Cost | |
| $/tCO2 | 14/1065 |
NOTE: Energy expenditure associated with upper- and lower bound-process configurations.
In the last step, the desorption pressure was varied within a range and the final desorption temperature of the contactor/adsorbent material was similarly defined. By conducting a transient heat transfer calculation using 100°C saturated steam as the heat transfer media, as noted above, with a final desorption temperature defined, the desorption time was calculated. Other outputs from this step include the vacuum operating costs as well as the desorption energy costs (steam costs).
The calculation procedure and outputs from each step is schematically shown in Figure D.2. The range of parameter variation is given in Table D.1.
The conditions leading to the lower- and upper-bound costs are outlined here. As noted above, the combination of all the most favorable parameters, using realistic physical parameters, suggests that a hypothetical cost as low as $18/tCO2 can be estimated. The upper-bound cost ($1,060/tCO2) is not a true upper bound, because there are an infinite number of ways to deploy direct air capture with high costs. The term upper bound solely signifies the upper end of the range considered in the calculations. The committee does not feel that the lower bound cost is practically achievable, though no physical bounds prevent the cost of direct air capture from dropping below $100/tCO2.
RENEWABLE ROUTES WITH SOLVENT-BASED SYSTEMS
Costing Air Capture from Renewables—achieving 1Mt CO2 avoided per year
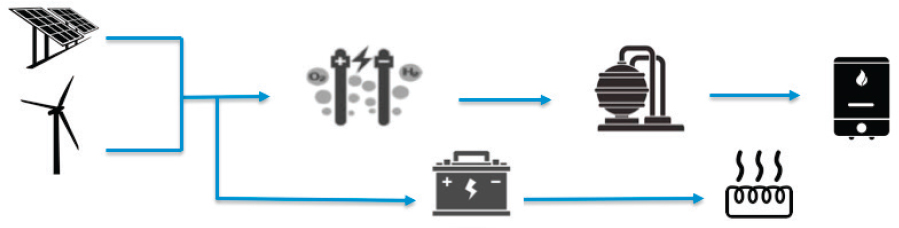
Two routes to costing air capture using 100 percent renewables were considered: (1) electricity sourced from combined photovoltaics (PV) and battery storage for direct use and (2) electricity sourced from PV for electrolysis (Figure D.3; Table D.2), followed by H2 storage as described in detail in Chapter 5. In these low-carbon scenarios, solar thermal and geothermal were not considered because of their temperature limitations and inability to reach the required calcination temperature of 900°C. It should be noted however that technologies are emerging, such as concentrated power towers (DOE, 2013) and alternative nuclear designs (Harvey, 2017), that involve high-temperature gas-cooled reactors that may be suitable low-carbon routes for integration into air capture approaches requiring high temperatures for regeneration.
SECOND-LAW EFFICIENCY CALCULATION
The second law efficiency calculation for the separation of CO2 from the atmosphere for a process employing a solid sorbent, as described above, is given here.
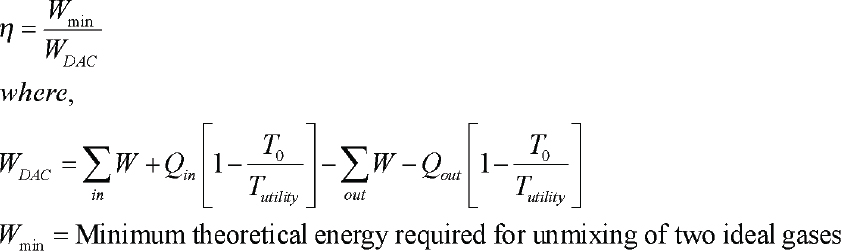
This estimate demonstrates that an air capture process using solid sorbents and operating near ambient conditions, using low temperature thermal energy, can be surprisingly efficient. Despite the high dilution of the source gas, a process suitably designed
TABLE D.2 Economic Costs Associated PV + Storage for Solvent-Based Air Capture
| CAPEX | Cost ($M) | Comment |
|---|---|---|
| Contactor array | 150-250 | Lower bound: anticipated cost of 10 air contactor array from Holmes and Keith (2012), based on optimal percent capture of 75% and bed depth of 6-8 m. Upper bound: scaled cost for system at high percentage capture (90%+) and deeper packing bed, with 1.5× learning cost factor. |
| Slaker/causticizer/clarificator | 130-195 | Lower bound: capital costs taken from Socolow et al. (2011) report and adjusted to 2016 USD. Upper bound: 1.5× factor to account for new technology. Though the Ca-recovery cycle is mature and well studied in the pulp and paper industry, learning costs may be associated with integration into a direct air capture system. |
| Electric-fired calciner | 270 | Lower bound: price quote from industry source for oxy-fired kiln with 4.5× factor used for scaling Inside Battery Limits (ISBL) equipment costs to full costs. Assuming the lower-bound estimate because this may be lower than an oxycombustion or H2fired kiln since electric-fired kiln are commercially available. Efficiency of 80% assumed. |
| CAPEX | Cost ($M) | Comment |
|---|---|---|
| CAPEX Subtotal | 550-715 | |
| Annualized Capital Payment ($M/y) | 62-80 | Assumes a plant life of 30 years and fixed charge factor of 0.11278 (Rubin et al., 2007). |
| OPEX | Cost ($M/y) | Comment |
| Maintenance | 23-40 | Range calculated as 0.03 of total capital requirement. |
| Labor | 7-12 | Range calculated as 0.30 of maintenance cost. |
| Makeup (H2O, KOH, Ca(OH)2) and waste removal | 5-7 | Lower bound: assumes $500/t KOH, $250/t Ca(OH)2, $0.30/t H2O, $260/t waste disposal (Rubin et al., 2007). Upper bound: applies 1.5 factor to make-up OPEX. |
| PV+battery | 294-389 | Levelized cost of energy “PV Plus Storage” $92/MWh (Lazard, 2016). Assumes total capital costs of ~ $3,900/kW including PV and battery energy storage. Assuming direct electricity needs of 21-27 kJ/molCO2. Assuming electric kiln and electric heater have efficiencies of 80%, requires an electricity demand to meet thermal energy demands of 485-643 kJ/molCO2. |
| OPEX Subtotal | 329-448 | |
| Cost = Net Removed CO2 Cost ($/tCO2 yr-1)a | ||
| PV+Battery | 391-528 | |
a Basis = 1Mt CO2
and optimized to target ambient CO2 can achieve the separation with unexpected efficiency. See Chapter 5 for calculated efficiencies.