
APPENDIX E
Carbon Mineralization
ENERGY BUDGET FOR “GENERIC” EX SITU MINERAL CARBONATION
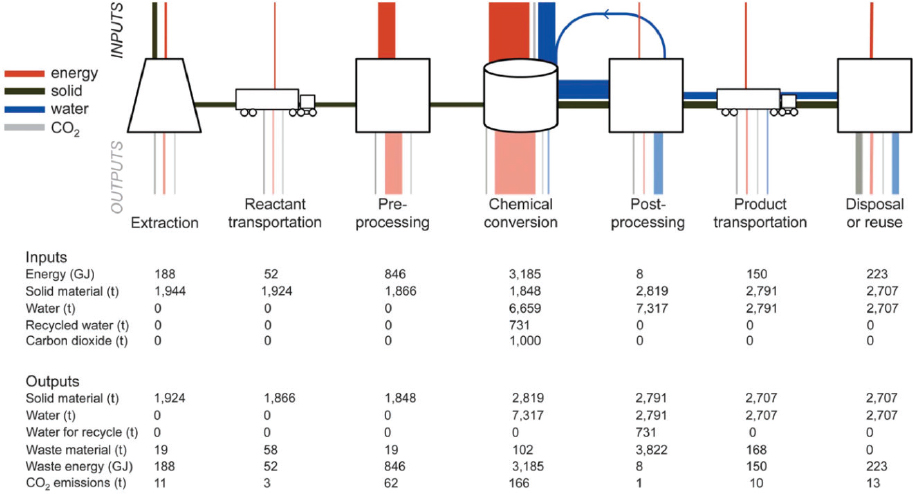
This section focuses on energy use in a general general ex situ mineral carbonation process, where the energetic and material inputs and outputs will be examined for the following steps: extraction, reactant transport, pre-processing, chemical conversion, post-processing, product transport, and disposal or reuse. Because there are a variety of alkalinity sources (rocks and industrial waste products) and a number of possible reaction conditions (e.g., elevated temperature and pressure), all calculations are presented first generally and then applied to a case involving olivine carbonation at 155 and 100 bar.1 A general scheme for this process is provided in Figure E.1.
Extraction, Reactant Transport, and Pre-Processing
Alkalinity stored in naturally occurring silicate deposits can be made available for onsite carbonation through mining, separating, crushing to size, and delivery via truck or rail depending on distance to source.2 Because the drilling, blasting, excavation, and hauling activities associated with mineral extraction vary based on quarry location, the energetic consumption is expected to fall between similar low- and high-intensity extractions (97.0 MJ/t and 360.9 MJ/t) (Kirchofer et al., 2012). Based on electricity sourced from coal and natural gas, this results emissions of 0.02-0.08 t CO2/t CO2 processed and 0.013-0.05 t CO2/t CO2 processed, respectively.3
An additional source of alkalinity exists in the form of industrial waste by-products (e.g., cement kiln dust (CKD), steel slag, and coal fly ash (FA). Carbonation of these
___________________
1 This is in keeping with the development of ex situ mineral carbonation, which started with a single step, high-temperature, high-P(CO2) reaction in an aqueous medium with naturally occurring minerals. (contacting CO2 with dry rock was quickly shown not to work). Such processes were envisioned to use pure CO2 gas. More recently, multistage extraction processes have been put forward. Some produce Mg(OH)2 which can be reacted at lower (and possibly atmospheric) P(CO2). The distinction is important. If direct single step mineral carbonation is used then a gas purification step is needed. If a multistage extraction process is used, then it may be possible to avoid pre-gas purification.
2 It is assumed that rail transport is required for hauls more than 60 miles (one-way).
3 Assumes a material loss of 1 percent.
SOURCE: Kirchofer et al., 2012.
waste-products represents an opportunity for reliable carbon storage while also treating industrial waste that would otherwise require disposal. Additionally, waste from industrial manufacturing may fill niche scenarios whereby transport of crushed olivine or serpentine proves cost-prohibitive due to distance considerations. The energy required in handling and collecting of industrial alkalinity can be approximated as 50 percent of that outlined for the natural mineral extraction case above (Kirchofer et al., 2012).
Transport can be considered invariant to source and is reported as the energy required to move 1 ton of reactant material over 1 mile. Using a standard diesel conversion of 2.68 kg CO2 per liter and assuming a 3 percent material loss during transport, transport via truck and rail freight yields 0.11 kg CO2 and 0.03 kg CO2 per ton-mile, respectively. Alternatively, in some cases ex situ mineral carbonation could be done at the source of solid reactants (mine tailings, quarry, alkaline waste site) with very low transport costs (Moosdorf et al., 2014), for example by building direct air capture plants at the source.
In the final step before chemical conversion, the feedstock must be ground to reduce the input particle size (ca. 10,000 microns) to an output size suitable for efficient conversion (4 to 2000 microns). The electric work for grinding is a function of the
80 percent passing size of the feedstock grain size (I) and desired grain size (O), in microns:
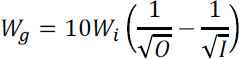
where Wi is the Bond’s work index4 for the material (Gupta et al., 2006). Using the olivine work index value, this corresponds to 2.0 and 1.0 kgCO2/t using electricity sourced from coal and natural gas fired plants, respectively.
Chemical Conversion
In the conversion of carbon dioxide, alkalinity must be liberated via dissolution of the pre-processed feedstock, followed by heating and mixing of the reactants to precipitate the stable carbonate. Water consumption during this process is estimated as 6.7 tH2O / tCO2 processed (Kirchofer et al., 2012) less 0.73 tH2O/tCO2 processed recycled from downstream processing, yielding a net water consumption of 5.9 tH2O/tCO2 processed. Energy consumption to deliver and recycle water for chemical conversion is estimated at 4.66 MJ/tCO2 processed, resulting in 1.0 and 0.6 kgCO2/tCO2 processed using power sourced from coal and natural gas, respectively.
The energy required to mix reactants is determined from the mixing power, Pm:
![]()
where Np is the power number (3.75 in this case), ρ is the mixture density, N represents the impeller speed (0.6 rps), and D represents the impeller diameter, taken as one-third of the reactor tank diameter.5 The total energy is thus contingent on the reaction speed, where the rate of CO2 carbonation is considered limiting. Here it is assumed that the rate of carbonation is dependent on the alkaline feedstock dissolution and not on the mass transfer of CO2 into the liquid phase.
Heat input is required to bring the reactants (including water) up to reaction temperature plus any additional energy to compensate for heat loss from the reactor vessels. The former is calculated from the specific heat capacity and temperature change required:
___________________
4Wi = 12.00, 13.49, 13.39, 11.31, and 11.61 kWh per tonne for SS, CKD, FA, olivine and serpentine, respectively.
5 Two reactor tanks are considered: (1) for ambient pressure conversion (10 m diameter, 785 m3 volume) and (2) for high-pressure conversion (up to 100 bar, 2 m diameter, 27 m3 volume).
![]()
However, this heating requirement is effectively lowered because relevant reactions are exothermic.6 Heat loss is calculated assuming that the heat flux (fq) from the stainless-steel tank is equal to heat flux to the surroundings, and is calculated from:
![]()
where h represents the convection coefficient (20 W m-2 K-1 in this case), e1 is the emissivity for the tank insulation material (0.050 for mineral fiber), σ is the Stefan-Boltzman constant, and To and Ta represent the temperature of the outer tank surface and the ambient surroundings, respectively.
Considering water demand, mixing of reactants, and reaction temperature maintenance, the total energy required for chemical conversion of olivine at 155 is 3.185 GJ/tCO2 processed, or 0.70 tCO2 and 0.43 tCO2 of additional emissions based on power from coal and natural gas, respectively.
Post-Processing, Product Transport, and Reuse or Disposal
After conversion, the solid carbonate product must be clarified to remove and recover water, then separated via liquid cyclone, centrifugal filtration, or a combination in series. Following separation, the product is transported for reuse as an aggregate material or disposed of as mine back-fill.
In post-processing, a material loss of 5 percent is assumed. Energy requirements are calculated assuming a processing train of clarification, liquid cyclone separation, and centrifugal filtration. In the first step, 75-80 vol.% water is clarified from the product mixture of 0.1-35 wt% solids. Clarification power is calculated from:
Pcl = cclD2
where the coefficient ccl is taken as 0.0045 and the tank clarifier tank diameter D is taken as 25 m,7 and the volumetric flow rate is assumed to be 0.20 m3/s.
___________________
6 The standard heat of reaction for carbonation is –179 kJ/mol for industrially-sourced alkalinity, –88 kJ/mol for olivine, and –35 kJ/mol for serpentine.
7 Typical values for ccl range from 0.003 to 0.006, with typical clarifier tank diameters from 2–200 m.
After clarification, the product mixture is fed to the liquid cyclone process to produce a 30-50 wt% solid mixture. The power requirement for this step is a function of the volumetric flow rate qv:
Plc = cclqv
where the coefficient clc is taken as 2008 and is 0.075 m3/s. This mixture is passed for additional processing in the centrifugal filter to produce an 80-95 wt% solid mixture. The power requirement in this step is a function of the solids input rate, qm (kg/s):
Pcf = ccfqm
where the coefficient ccf is taken as 16.5 and the volumetric flow rate is 0.076 m3/s. The collective power requirement for post-processing is 8 MJ / tCO2 carbonated, which results in a negligibly small carbon footprint in comparison to other steps in the carbonation chain.
Product transport is similar to reactant transport and energy requirements are calculated using the same fuel economies presented in the reactant transport section. However, the total product weight is greater than the total reactant weight per tCO2 carbonated (ca. 44% more weight in the case of olivine carbonation); thus, the levelized emissions from product transport are expected to be greater than those reported for reactant transport.
If the processed material is reused, it is necessary to quantify the emissions saved in the displacement of an aggregate product. Here, the life cycle energy associated with medium-intensity mining and extraction of crushed limestone serves as a general representation of the energy saved in reuse of carbonate as an aggregate material (Kirchofer et al., 2012). This equates to an energy credit of 97 MJ/t, or 21 and 13 kgCO2 for coal and natural gas, respectively. If, instead, the processed carbonate heads for open mine disposal as back-fill, the energy cost can be assumed as 50 percent that of low-intensity mining.
The total cost for an ex situ mineral carbonation system is an order of magnitude larger than that observed for in situ systems (Table E.1). A previous National Academies of Sciences, Engineering, and Medicine (NASEM) study examined the cost of mineral carbonation based on the exampled presented in Kirchofer et al., 2012 and obtained a similar result of $1,000/t CO2 reliably stored (NASEM, 2015). The dominant capital factor involves the reactor vessels that house the chemical conversion of CO2 into stable mineral form, while the dominant operating cost involves delivery of
___________________
8 Typical values for clc range from 100 to 300; values for ccf range from 3-30, while values for qv range from 0.002 – 0.015 kg/s.
alkalinity to the facility. This latter cost can be mitigated if the ex situ facility is positioned to take advantage of local alkalinity resources. Though a thorough life cycle analysis on treatment of industrial waste products has shown that these processes are far more carbon intensive than those involving the mining, transport, and grinding of natural silicate minerals (i.e., 200-500 tonnes less avoided per 1000 tonnes CO2 reliably stored), these processes may garner more public support by virtue of waste treatment (Kirchofer et al., 2012).
TABLE E.1 Economic Costs Associated with Reliable Storage via Ex Situ Mineral Carbonation
| CAPEX | Cost ($M) | Comment |
|---|---|---|
| Grinding | 44 | Estimate scaled from Huijgen et al. (2007) assuming two grinders operated in succession: (1) cone crusher and (2) ball mill to achieve particle size of ca. 10 microns. |
| Reactor vessels | 2,700 | Estimate scaled from Huijgen et al. (2007) assuming type a reactor tank (see Kirchofer et al., 2012), 780 m3 capacity, and ~150 tanks required to process volume of material necessary to reliably store 2,778 tCO2/d. |
| Filtration system | 30 | Estimate scaled from Huijgen et al. (2007) assuming rotating vacuum tumble filter with 50 m2 filter area collects 8.8 m3 filtrate/day. |
| CAPEX Subtotal | 2,774 | |
| Annualized Capital Payment ($M/y) | 313 | Assumes a plant life of 30 years and fixed charge factor of 0.11278 (Rubin et al., 2007). |
| OPEX | Cost ($M/y) | Comment |
| Maintenance | 83 | Range calculated as 0.03 of total capital requirement. |
| Labor | 25 | Range calculated as 0.30 of maintenance cost. |
| Total fuel (coal, natural gas, electricity) | 140 | Collective energy cost for all steps including mining, pre- and post-processing, chemical conversion, transport, and disposal. Excludes energy costs associated with capture, compression, and transport of CO2. Excludes petroleum cost for alkalinity transport, which is assumed into the delivery cost. Assumes $3/GJ for natural gas, Appalachian medium-sulfur coal, cost of $50/t, and higher heating value (HHV) of 31 GJ/t (Rubin et al., 2007), and $60 MWh electric cost. |
| Alkalinity delivery | 250 | Assumes alkalinity delivery cost of $250/tCO2 fixated. Cost reflects mining and transport via trucking. Rail costing may be cheaper for greater distances (>100 km) or where the mineral carbonation site exists at a railhead. |
| Capture, compression, and delivery of pure CO2 | 40-70 | Reflects cost of capture, compression and transport via pipeline (assumes 250 km) (Rubin et al., 2015). Range exists for various point sources (e.g., supercritical pulversized coal (SCPC) vs natural gas combined cycle (NGCC), average value of 55 used in total. |
| OPEX Subtotal | 553 | |
| Levelized Cost ($/tCO2 yr-1)a | 866 | |
| Avoided Cost ($/tCO2 yr-1)b | 1170 |
a Levelized basis = 1Mt CO2.
b Levelized basis = 0.74 Mt CO2 (Kirchofer et al., 2012).
This page intentionally left blank.


