
APPENDIX F
Geologic Storage
ENERGY REQUIREMENTS AND COSTS FOR COMPRESSION, TRANSPORT, AND INJECTION OF CO2
This appendix calculates the energy requirements and costs for compressing captured carbon dioxide (CO2), transporting it to the sequestration site, and injecting it into a deep sedimentary formation. It also provides the timeline and costs for an experimental injection of CO2 into peridotite or basalt (Table F.3).
COMPRESSION AT THE CAPTURE UNIT
Following separation of CO2 from flue gas, air, or some other source, the now rich CO2 stream must be dehydrated and compressed to a level suitable for transport, typically above 10 MPa for pipeline to ensure that the supercritical phase is maintained and frictional losses overcome. Compression power is calculated from:
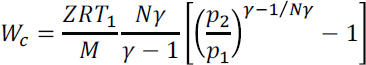
where Z is the compressibility factor (0.9942), T1 is the inlet temperature (313.15 K), R is the universal ideal gas constant (8.3145 J/(mol K), M is the molar mass of CO2 (44.01 g/mol), N is the number of compression stages (4), γ is the specific heat ratio (1.293759), and p1 and p2 are the inlet and outlet pressures, respectively (0.101325 and 11 MPa) (Damen et al., 2007). Based on these parameters, and assuming an isoentropic efficiency of 80 percent, the electrical work for compression equals 400 MJ/t CO2, or 0.09 and 0.055 t CO2 emitted per t CO2 compressed using electricity sourced from coal and natural gas, respectively. Material requirements for the construction and demolition of compression equipment and infrastructure are negligibly small and can be ignored in this analysis.
PIPELINE TRANSPORT
There are three factors to consider in estimating the carbon footprint of a CO2 pipeline: (1) the embodied energy in the materials used in construction (including transport of these materials to the building site and demolition at end-of-life), (2) indirect emissions associated with the electricity required to power CO2 pumps along the pipeline length to maintain pressure, and (3) fugitive emissions associated with leakage and loss of CO2 over the pipeline lifetime. All calculations assume a 10-mile pipeline length and all associated components are expected to scale linearly for longer pipelines.1 The dimensions used in these calculations are sufficient to transport 10 Mt/y CO2.
Materials, Construction, and Demolition. The major material requirements for pipeline construction include 31,200 t sand and 7,680 t steel (Koornneef et al., 2008). The embodied energy in steel is 11,254 MJ/t (Kirchofer et al., 2012), such that every 10-mile section of pipeline results in emissions of 0.02 and 0.012 Mt CO2 from the production of steel,2 using energy sourced from coal and natural gas, respectively. Collection and handling of sand is expected to have a small energy requirement relative to transport and is thus ignored. Transport of all materials to the construction site results in 2.26 × 10⁶ ton-miles of material hauling. Assuming an energy density of 35.9 MJ/L for lower heating value (LHV) diesel with a carbon intensity of 102.82 g/MJ, this material can be transported via heavy-duty trucking at an emission rate of 0.11 kgCO2 per ton-mile, or 249 tCO2 per 10-mile pipeline segment. Energy consumed over the course of construction is estimated at 53,000 GJ diesel per 10-mile segment (Koornneef et al., 2008). Using the same energy density and carbon intensity described above yields an additional 5.4 kt of CO2 emissions.
After a pipeline lifetime of 30 years, all materials must be demolished and transported off-site. Here, it is assumed that 50 percent of the materials are left in-ground and 50 percent are demolished and hauled away (Koornneef et al., 2008). Assuming a demolition energy of 11.1 MJ/t (Phua, 2009), and a hauling requirement equal to 50 percent of that required for construction, an additional 0.15 ktCO2 is emitted in pipeline removal.
Pipeline Compression. The optimal number of pumps to overcome pressure loss3 along the pipeline length is calculated from the DOE Fossil Energy (FE)/ National
___________________
1 For example, if a 10-mile segment requires 80,000 t steel, a 50-mile segment requires 400,000 t.
2 Analysis assumes primary steel. Adjustments for secondary steel may assume an embodied energy of 7,230 MJ/t.
3 Assuming an 11 MPa input pressure and 10.7 MPa output pressure.
Energy Technology Laboratory (NETL) CO2 Transport Model (NETL, 2018). For the case of a 10-mile pipeline segment with nominal diameter of 30 inches, two compression pumps (η= 0.75) are spaced 3.3 miles apart and require 8,379 MWh/y—collectively—to operate. This compression work adds 6.6 and 4.1 ktCO2 per year, or 198 and 123 ktCO2 over the lifetime of the pipeline, using energy sourced from coal and natural gas, respectively. The number of compression pumps does not scale perfectly linearly as the materials, and a pipeline model (e.g., FE/NETL model) should be used to assess the optimal number of pumps for a given length and desired pressure.
Fugitive Emissions. Over the course of compression and transport, a small percentage of CO2 will be lost due to system leakage. Using guidelines for fugitive emission calculations provided by the IPCC (2006), an estimated 3.74 tCO2/mile per year is lost, or 1.12 ktCO2 per 10-mile segment over the course of the pipeline lifetime.
INJECTION
This section outlines the carbon footprint of CO2 injection with the ultimate goal of permanent storage in the subsurface.4 This chain involves construction of the injection well plus compression and injection energy to pump approximately 7.3 Mt/y underground.5 Emissions associated with materials (embodied energy) and transport to the construction site are approached with the same assumptions outlined in “Pipeline Transport: Materials, Construction and Demolition” above. A key difference in the life-cycle treatment of injection wells is that after a 30-year lifespan, the injection well is abandoned; thus, no emissions are accountable to project demolition and disposal.
Materials and Construction. A 7.3 Mt/y injection project requires approximately 6 wells, each 1.86 miles in length. A smaller (larger) capacity can be achieved by subtraction (addition) of wells, and the calculations outlined in this section should be scaled accordingly. The material requirements for well construction include 712,000 t sand, 11,900 t steel, and 25,111 t concrete, resulting in 46,452,000 ton-miles of material hauling. Using an average value of 3,255 MJ/t for the embodied energy of reinforced concrete, indirect emissions from material production total 0.047 and 0.03 Mt CO2 assuming power sourced from coal and natural gas, respectively. Transport of construction materials to the site results in an additional 5.11 ktCO2 emissions. Energy consumed over the course of construction is unknown, but a conservative estimate may
___________________
4 Alternative injection goals (e.g., enhanced oil recovery) may require additional equipment and energy requirements for processing of re-circulated CO2.
5 This injection capacity is based on reports for underground natural gas storage, where the life-cycle data scales to a 7.3 Mt/y capacity operation.
be obtained from the energy of construction per ton of steel in the pipeline case. This results in a consumed energy of 255,400 GJ, or 37.3 ktCO2 emissions.
Injection Energy. Assuming a 0.3 MPa pressure loss over the course of pipeline transport, the CO2 arrives at the wellhead at a pressure of 10.7 MPa. The energy required to pressurize the incoming CO2 to 15 MPa for injection can be calculated from the same equation presented above for compression work post-capture. However, the pre-injection compression train requires only 2 stages to achieve the desired pressure of 15 MPa. Using the assumptions outlined in “Compression at the Capture Unit” above, and changing the inlet and outlet pressures to 10.7 and 15 MPa, respectively, the injection well compression energy totals 25.2 MJ/t, or 0.04 and 0.025 Mt CO2 in indirect emissions if using power generated in coal and natural gas firing, respectively.
CARBON EMISSIONS AND COSTS
A summary of the carbon emissions and costs associated with compression, transport, and injection chain is presented in Tables F.1 and F.2.
TABLE F.1 Contributions to the Carbon Footprint from Compression, Transport, and Injection (kgCO2emitted/tCO2 processeda)
| Parameter | Power Source | |||
|---|---|---|---|---|
| Diesel | Coal | Natural Gas | N/A | |
| Compression (at the capture unit) | 90 | 55 | ||
| Embodied energy of materials (pipeline construction)b | 0.2 | 0.13 | ||
| Transport of materials (pipeline construction)b | 0.003 | |||
| Energy consumed in construction (pipeline)b | 0.06 | |||
| Pipeline demolition | 0.002 | |||
| Pipeline pumps | 0.07 | 0.04 | ||
| Fugitive emissions | 0.012 | |||
| Embodied energy of materials (well construction) | 0.2 | 0.14 | ||
| Transport of materials (well construction) | 0.02 | |||
| Energy consumed in construction (injection well) | 0.17 | |||
| Injection (compression) energy | 0.18 | 0.11 | ||
| Total carbon footprint | 90.9 | 55.7 | ||
a Assumes a 30-year lifetime.
b Assumes a 10-mile segment.
TABLE F.2 Economic Costs Associated with Compression, Transport, and Injection of CO2
| Factor | Cost ($M) | Comment |
|---|---|---|
| CAPEX | ||
| Compressor | 100 | Value scaled from integrated environmental control model (IECM) estimate, assuming a product pressure of 11 MPa, compressor efficiency of 80%, product purity of 99.5%, and a maximum CO2 compressor capacity of 300 t/hr. |
| Pipeline | 25–225 | Lower bound: value calculated from the FE/NETL CO2 Transport Cost Model.a Assumes 10 Mt/y transport and pipeline length of 10 mi. Upper bound: value calculated as above assuming pipeline length of 100 mi. |
| Injection site screening and evaluation | 2.5 | Value adjusted for current USD from estimate based on the work of Smith et al. (2001) |
| Injection equipment | 0.6-8.0 | Values calculated from actual injection site costs provided in Herzog et al., 2003) and include supply wells, plants, distribution lines, headers, and electrical services. Values called to current dollars. Lower bound: low case, aquiferb Upper bound: high case, gas reservoirb |
| Well drilling | 0.20-210.0 | Values calculated based on estimates provided in Herzog et al., 2003), which were derived from data presented in the report “1998 Joint American Survey (JAS) on Drilling Costs.” Capital expense tied to number of wells required, which is in turn calculated from the equations outlined in McCollum and Ogden (2006) and uses the high- and low-case parameters outlined in the table notesb Lower bound: low case, aquiferb Upper bound: high case, gas reservoirb |
| CAPEX Subtotal | 128-546 | |
| Annualized Capital Payment ($M/y) | 14-62 | Assumes a project life of 30 years and fixed charge factor of 0.11278 (Rubin et al., 2007). |
| Factor | Cost ($M) | Comment |
|---|---|---|
| OPEX | ||
| Maintenance: compression | 3 | Range calculated as 0.03 of total capital requirement for compression. |
| Labor: compression | 0.9 | Range calculated as 0.30 of maintenance cost for compression. |
| Electricity: compression | 67-100 | Calculated from energy requirement (400 MJ/t CO2) and electricity cost range of $60/MWh lower bound to $90/MWh upper bound. |
| Operation and maintenance: pipeline | 0.2-1.3 | Pipeline operational and maintenance expenses reported in the FE/NETL CO2 Transport Cost Modela includes labor, excludes cost of electricity. Range in costs reflect 10-mile (low) and 100-mile (high) pipeline segments. |
| Electricity: pipeline | 0.2-2.9 | Range calculated based on low case of 10-mile segment, 2,700 MWh/y electric requirement, and $60/MWh, and high case of 100-mile segment, 32,000 MWh/y electric requirement, $90/MWh. |
| Operation and maintenance: injection | 0.6-34.0 | Operational and maintenance costs estimated from McCollum and Ogden, 2006) and include: normal daily expenses, consumables, surface maintenance and subsurface maintenance. Compression energy at the wellhead is included and is considered negligible compared to other electric requirements in the transport and storage chain, thus no range for electric cost is reported. Lower bound: low case, aquiferb Upper bound: high case, gas reservoirb |
| Factor | Cost ($M) | Comment |
|---|---|---|
| OPEX Subtotal | 72-142 | |
| Total Annual Cost | 86-204 | |
| Levelized Cost ($/tCO2 yr-1)c | 8.6-20.4 | |
| Avoided Cost ($/tCO2 yr-1)d | ||
| Natural Gas | 9.1-21.6 | |
| Coal | 9.5-22.4 |
aSee https://www.netl.doe.gov/projects/energy-analysis-details.aspx?id=543 (accessed January 29, 2019).
b High and low cases were calculated for three injection sites: aquifer, oil reservoir and gas reservoir. Variables for each scenario include reservoir pressure, thickness, depth, and horizontal permeability. These values are taken from Herzog et al., 2003) and are tabulated in McCollum and Ogden, 2006).
cLevelized basis = 10 Mt/y CO2
dLevelized basis = 10 Mt/y CO2 less 0.55 Mt/y CO2 (0.90 Mt/y CO2) for emissions associated with natural gas (coal) firing.
ESTIMATED COST OF A PILOT EXPERIMENT ON IN SITU CARBON MINERALIZATION IN PERIDOTITE OR BASALT
TABLE F.3 Timeline and Budget, Generic In Situ Carbon Mineralization Experiment in Peridotite or Basalt at 100,000 Tons/y
| Scoping and site selection | Preparation for 2 years | Drilling | Injection for 2 years | Monitoring and analysis for 3 years | |||||||
|---|---|---|---|---|---|---|---|---|---|---|---|
| year 1 | year 2 | year 3 | year 4 | year 5 | year 6 | year 7 | year 8 | year 9 | year 10 | Total | |
| Management | $250,000 | $250,000 | $750,000 | $750,000 | $1,000,000 | $1,000,000 | $1,000,000 | $750,000 | $750,000 | $750,000 | $7,250,000 |
| Characterization (mapping, small test wells) | $750,000 | $750,000 | $750,000 | $750,000 | $3,000,000 | ||||||
| Injection preparation | $2,000,000 | $2,000,000 | $4,000,000 | ||||||||
| Drilling 1 injection well at $6M and 3 monitoring wells at $3M | $3,000,000 | $12,000,000 | |||||||||
| Permitting/outreach/engagement | $250,000 | $250,000 | $250,000 | $500,000 | $208,333 | $208,333 | $208,333 | $208,333 | $208,333 | $208,333 | $2,500,000 |
| Monitoring | $500,000 | $2,000,000 | $2,000,000 | $2,000,000 | $2,000,000 | $750,000 | $750,000 | $10,000,000 | |||
| Research | $500,000 | $1,000,000 | $1,416,667 | $1,416,667 | $1,416,667 | $1,416,667 | $1,416,667 | $1,416,667 | $10,000,000 | ||
| CO2 at $100/ton | $100,000 | $4,950,000 | $4,950,000 | $10,000,000 | |||||||
| Contingency at 30% of total costs above | $375,000 | $375,000 | $1,275,000 | $2,580,000 | $6,472,500 | $2,872,500 | $1,387,500 | $1,312,500 | $937,500 | $937,500 | $18,525,000 |
| Total | $1,625,000 | $1,625,000 | $5,525,000 | $11,180,000 | $28,047,500 | $12,447,500 | $6,012,500 | $5,687,500 | $4,062,500 | $4,062,500 | $80,275,000 |
This page intentionally left blank.


