
Science has nearly always been driven by having better data, said JP Onnela. What has changed in the past 10 years is the volume of data collected and the types of data available about human behavior. Onnela tied this phenomenon to the shrinkage in the size of transistors which, as embodied by Moore’s law,1 has led to smaller and smaller sensors embedded into mobile phones and wearable devices. In parallel with this miniaturization of technology, mobile devices have become ubiquitous, he said, with 77 percent of U.S. adults owning a smartphone in 2017. The widespread application of these technologies has enabled the collection of rich data about the social, cognitive, and behavioral function of individuals, even people with serious mental illnesses, he said.
For digital technologies to have an impact on human health requires not just fancy gadgets but a robust evidence base, said Husseini Manji. He envisioned a kind of learning engine (see Figure 3-1) that would transform aggregated digital data into knowledge that would help patients through the development of predictive algorithms. However, Onnela noted that integrating raw data collected from different kinds of devices would be extremely challenging because of the difficulty of convincing device manufacturers and researchers to share their data as well as the complex statistical approaches needed.
___________________
1 Moore’s law was named after Intel co-founder Gordon Moore, who predicted in 1965 that the number of transistors that could fit onto a chip would double every year. Moore revised this to every 2 years in 1975, and this rate continued for the next four decades.
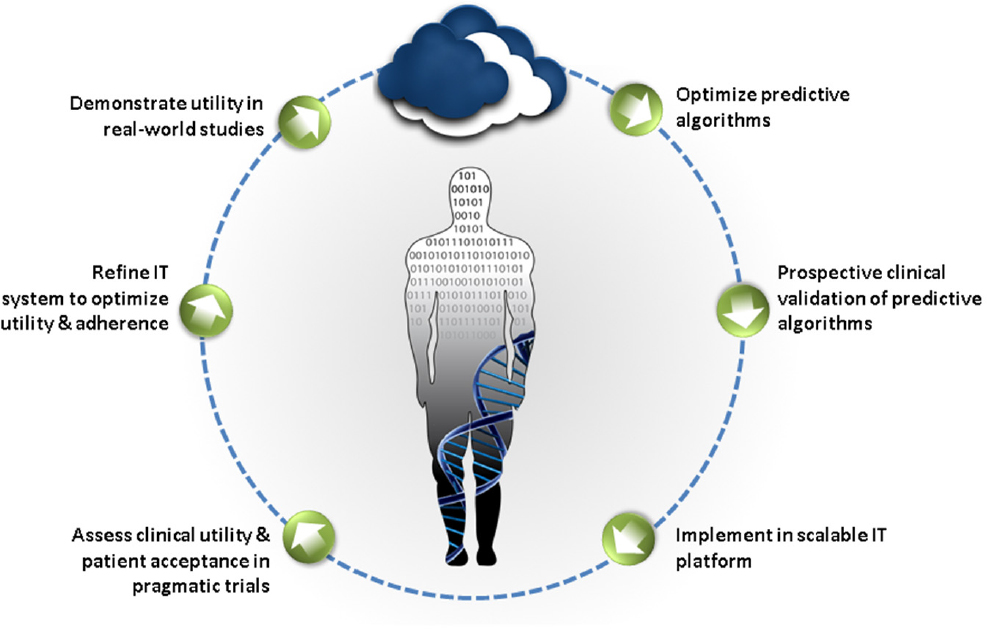
SOURCE: Presented by Manji, June 5, 2018. Concepts derived from Manji et al., 2014.
While recognizing the challenges associated with collecting and analyzing digital data, Onnela noted that digital phenotyping has three distinct advantages for research: it facilitates the inclusion of many participants, reduces the burden on participants by enabling the passive collection of data, and enables researchers to conduct large population-level studies with data over a long period of time, including before and after an event or intervention occurs. Box 3-1 describes a project that Onnela has undertaken to transform data collected from digital devices into digital phenotypes.
COLLECTING THE DATA
To build the sorts of algorithms that would enable the digital phenotyping described by Onnela, investigators determine what data will be most useful, what sort of device will enable their collection, and how, where, and from whom to collect this information. This requires consideration not only of the technicalities of data collection, management, and analysis, which are discussed below, but also the perspectives of participants and clinicians involved in studies, which are discussed in Chapters 5 and 6.
Choosing the Device
Many factors must be considered in choosing the device that will best fit the intended purpose, said Daniela Brunner, founder and president of the Early Signal Foundation. She noted that there is an essential tension between research and health care: the devices, data, and algorithms appropriate for research may differ from those used for applied medicine, she said. For either use, both quality of data and sustainability are essential. A fantastic device will prove useless if the company goes out of business, said Brunner. Multidomain sensors that capture as much data as possible are desirable because they can provide the context in which a patient lives and how that context affects the targeted domain.
The device and device manufacturer will also determine what form of data will be available for research studies, said Brunner. Non-aggregated data are essential, but raw sensor data may not be necessary, she said. Two sensors may be used together—what Brunner called “sensor stacking”—to enable interpretation of the data in a meaningful way. For example, if a researcher wants to study various sleep parameters, combining data from a wearable and a bed sensor may provide a solution.
Determining Which Data to Collect and How to Get Them
William Marks noted that one of the advantages of wearable devices is that they enable the unobtrusive collection of continuous or near-continuous digital data at home in a person’s normal environment or elsewhere during the normal course of the day. The power of collecting continuous data is illustrated in Figure 3-2, which shows the declining function of two hypothetical patients at points where infrequent assessments can lead to incorrect interpretations, said Stephen Arnerić, executive director of the Critical Path for Alzheimer’s Disease. However, Onnela cautioned that continuous monitoring could result in data overload for the person being monitored as well a clinician trying to make sense of the data.
Episodic monitoring also has some advantages, said Marks, including the potential to reduce the burden to the person being monitored and to prevent data overload. For example, to assess response to a new treatment, 1 week of monitoring at baseline before treatment, followed by another week of monitoring after the treatment has been initiated, may be sufficient to detect treatment response. Or to track the progression of PD, it
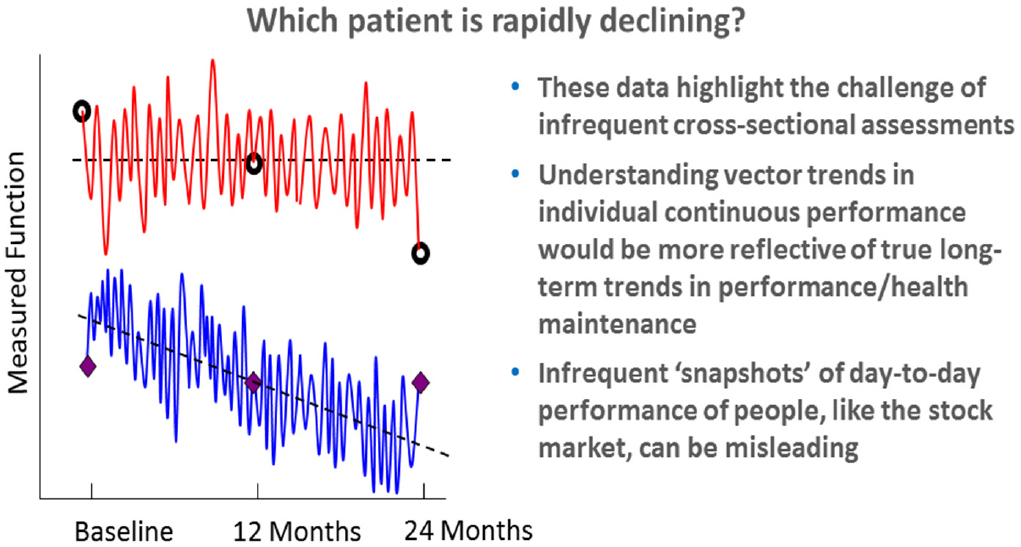
SOURCE: Presented by Arnerić, June 6, 2018.
might make sense to monitor once per month for 24 hours and then take 24-hour measurements at regular intervals.
In addition to free-living continuous or episodic monitoring, collecting data during structured activities also can be valuable because predictable aspects of the activity can be labeled and correlated with the signals being measured, said Marks.
Sensors are not the only tools that provide access to digital data. Social media platforms such as Facebook, YouTube, Instagram, Snapchat, and Twitter are digital tools that are used by a majority of Americans, according to a recent report from the Pew Research Center (Pew Research Center, 2018). While these platforms are designed to enable people to stay connected with others, build new connections, and share information about their lives, Munmun De Choudhury, assistant professor in the School of Interactive Computing at Georgia Tech, said they also provide rich data about people’s behaviors and moods, and thus may be helpful in assessing mental health, identifying early warning signals and risk factors, and even may enable early diagnosis. She added that social media platforms may
also be useful as a mechanism for intervening in the care of people with mental illnesses.
De Choudhury described a study she led in which she examined the Twitter archives of women before and after the birth of a child. For about 15 percent of the new mothers, the researchers saw a pattern of change that differed markedly from the other mothers, with reduced activity, more negative affect, reduced emotional intensity and social interactivity, and greater focus on self (De Choudhury et al., 2013). To attempt to understand this further, De Choudhury and colleagues recruited new mothers through Facebook ads. These women consented to have the researchers access all of their Facebook time line data and completed a survey designed to assess depressive symptoms. Using these data, they built models that predicted with reasonable accuracy (explaining more than 48 percent of the variance) the risk of postpartum depression based on social media–derived behavioral and affective markers identified in the prepartum period (De Choudhury et al., 2014). This study indicated that meaningful and clinically relevant signals could be accessed through social media, said De Choudhury. She went on to show evidence from one study suggesting that social media data could be used to efficiently develop an index for depression at the population level.
In a subsequent study, De Choudhury and colleagues mined data from the social media platform Reddit to identify markers of suicidal ideation (De Choudhury et al., 2016). They identified many different words and phrases that are causally linked to an increased or decreased likelihood of suicidal ideation. She suggested that these approaches could be incorporated into suicide prevention efforts going forward.
She cited challenges specific to the use of social media data. First, platforms have different terms of service that may compromise individual privacy; thus, researchers must be very sensitive to how they are using these data. Second, every platform is different and the demographics of people using those platforms differs, which could introduce bias. Usage of different platforms may also change very quickly, so machine learning models must adapt to these evolving changes, said De Choudhury.
VALIDATING DIGITAL DATA
Marks described the different types and levels of validation that are needed when capturing digital data for a research study. The first question to be answered, he said, is whether the sensor is faithfully capturing the
physiological or environmental signal in question. For example, is the photoplethysmography (PPG) sensor in a wearable device measuring pulse as intended? The next level of validation, said Marks, is confirming the accuracy of the feature extraction and activity classification. An example of how a device may misclassify an activity was described by attendee John Gardinier, who said that his smartphone translates vibrations from riding in a golf cart as steps taken.
Next, said Marks, to provide face validity the signals being measured either individually or in aggregate should correlate with other measures of the disorder, such as imaging findings, clinical exam, or molecular endophenotype. They should provide some useful information about the disease, its progression, or its response to treatment, he said. This level of validation involves comparing data from sensors or other novel digital tools to the gold standard measures or “ground truth,” said Brunner. However, Steven Hyman commented that while validated and widely accepted behavioral measures may be interpreted as ground truth for many neurological conditions, the same cannot be said for many neuropsychiatric disorders. He expressed concern about overinterpreting phenotypic measures that are disconnected from any kind of ground truth. Alternatives to tying these measures to ground truth may be to look at how they relate to some disordered behavior or diagnosable illness, said Hyman, or how they may help select interventions or make decisions regarding incremental care, said Deborah Estrin, professor of computer science at Cornell Tech.
Connecting digital measures with what is known about the biology of neuropsychiatric disorders is key to making these technologies useful, said Tanzeem Choudhury, associate professor in computing and information sciences at Cornell University. Many continuous signals—such as physical activity, sleep, social activity, speech, and even food intake—can be automatically measured to monitor behavioral health, she said. Choudhury’s company, HealthRhythms, Inc., has developed a platform that captures data automatically from smartphones on people’s sleep–wake and active–rest rhythms because disruptions in circadian rhythms have been linked to disruptions in behavioral health. They have used these sensor measures, for example, to model social rhythms in people with bipolar disorder, and have demonstrated that these models predict stable and unstable states with high accuracy (Abdullah et al., 2016).
ORGANIZING, MANAGING, AND INTERPRETING DIGITAL DATA
Having access to high-resolution data is not sufficient, said Marks. Organizing the data collection system in a way that makes it easy for an individual to contribute data, that allows for secure, high-fidelity storage, that provides easy access to data miners and analysts, and that stores the data in a form that can be brought together with other data types in a multidimensional way is equally important.
Integrating data from multiple sources would require the creation of data standards and the establishment of platforms that enable interoperability of data, said Manji. He cited two organizations as exemplars—One Mind and Cohen Veterans Bioscience—that have attempted to do this by encouraging the use of open source approaches. Even companies developing proprietary interventions can benefit from shared data, he said.
Representing complex multidimensional data—for example, data from sensors, clinical assessments, and other outcome measures—in a format that is easy to understand may be accomplished using visual approaches that transform group data using dimensionality reduction and identifying clusters that represent certain features of a population (e.g., persons with a certain condition), said Brunner. Once these clusters have been identified, interactions among clusters may be explored to generate new hypotheses that deserve further investigation. In addition, individual outliers that do not follow said patterns may be identifiable to enable more accurate diagnoses and more individualized care, said Brunner.
Onnela noted that in a research setting, continuous monitoring can produce very high-grade data; however, it can be very consuming on the device’s battery, making this approach non-scalable. The Beiwe platform created by Onnela and colleagues records global positioning data intermittently, leading to large amounts of missing data. Therefore, they developed a statistical method that allows them to impute missing data. By collecting continuous data for one person, they were able to demonstrate that in comparison to linear interpolation, where one simply connects the dots between data points with straight lines, this imputation method provides a measure much closer to ground truth (i.e., empirical measurement), said Onnela. Although improvements in the imputation method are needed to improve its precision, Onnela described how his lab has demonstrated its utility in a study using gyroscope data to monitor when and for how long a person is walking, standing, sitting, and climbing up or down stairs. Such statistical methods, he said, allow researchers to “propagate uncertainty,”
and thus draw more reliable conclusions from incomplete data. They also have the potential to improve in-clinic measures, he said.
Approaches are also needed to manage the high variability of free-form digital data acquired in different contexts and environments. These data are both high dimensional and extremely noisy, with substantial variability and strange patterns of messiness, said Onnela. All of these factors will likely impact the ability to reproduce digital findings across multiple studies, he said, noting that insufficient reproducibility of data has plagued biomedical research studies across multiple fields (NASEM, 2016; Prinz et al., 2011). This variability highlights the importance of developing new methods specifically designed to tackle these kinds of problems, he said.
ACTIVATING THE DATA
The final piece of this process is what Marks called “activation” of the data—using analytics to transform the data into insights that can improve the lives of the people who were monitored by modifying behavior, identifying new clinical endpoints, and accelerating drug development.
Marks noted that digital technologies are starting to creep into the clinical world, largely from individuals who share data from wearable devices with their physicians, hoping that the physician may be able to answer questions about the data. The problem, said Marks, is that the data being fed back to consumers are not always reliable or actionable. Although miniaturized technologies have provided useful data in fields such as diabetes and cardiovascular disease management, neuropsychiatry has lagged far behind in terms of accessing useful and believable data, said Marks. Furthermore, Tanzeem Choudhury suggested that being aware of every single aspect of one’s behavior by itself can be overwhelming and stress inducing.
Digital tools have also been used in recent years to increase operational efficiency in clinical development and as new clinical endpoints, said Luís Matos, deployment lead digital biomarkers at Roche. Smartphones, for example, combine multiple integrated sensors that detect light, touch, movement, position, connectivity, sound, and other data that may be relevant to an individual’s health status, said Matos. At Roche, they are conducting the FLOODLIGHT trial2 using a mobile smartphone app that aims to use passive remote monitoring combined with active tests to monitor disease activity for 1 year in 60 patients with multiple sclerosis
___________________
2 For more information, see https://floodlightopen.com (accessed July 2, 2018).
and 20 controls. The active tests available on the app—which take about 5 to 10 minutes per day—have been designed to correlate closely with standard clinical assessments. For example, the pinching test “Squeeze a Shape” asks participants to pinch a shape on the screen for 30 seconds as a way to evaluate fine motor control and hand-to-eye coordination, which are typically assessed in the clinic using the Nine-Hole Peg Test. Another test asks participants to make at least five U-turns while walking between two points. During the performance of this task, the smartphone uses movement and inertial sensors to capture data on the number of steps, the symmetry of U-turns, and several aspects of balance. Matos said they have found that these metrics correlate well with performance on the Timed 25-Foot Walk, a standard clinical test used as a functional measure of walking ability.
Figure 3-3 illustrates how smartphone data can improve adherence and enable the collection of high-quality data on a daily basis. These data are also combined with passive data, questionnaires, and symptom trackers to provide a rich view of disease progression, said Matos.
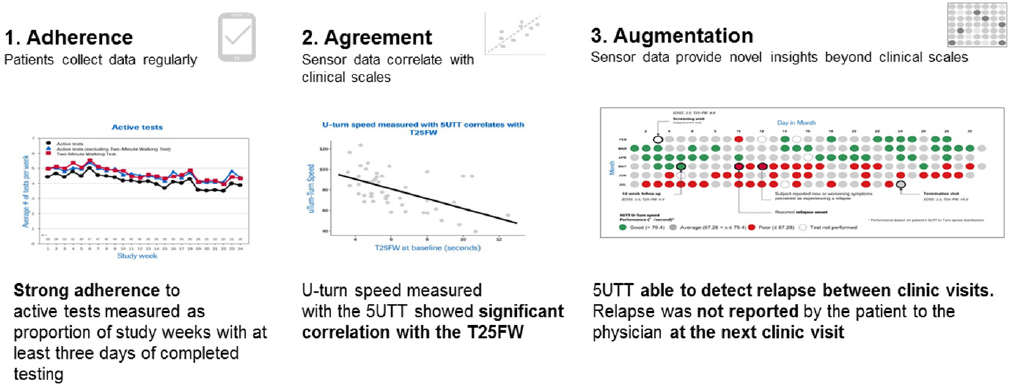
NOTE: 5UTT = five U-turn test
SOURCE: Presented by Matos, June 5, 2018.
This page intentionally left blank.


