
Appendix A
The Engineering Education-Workforce Continuum1
Donna K. Ginther
Professor, Department of Economics
Director, Center for Science, Technology & Economic Policy
University of Kansas
Lawrence, KS 66045
Email: dginther@ku.edu
and
Shulamit Kahn
Associate Professor, Department of Markets, Public Policy, and Law
Questrom School of Business
Boston University
Email: skahn@bu.edu
December 7, 2015
Abstract: Using a variety of data sources including longitudinal NSF data, this report finds that the engineering workforce is growing, is earning a high rate of return on their degrees, and is generally satisfied with their work. Although less than half of engineers are classified as working in engineering occupations, the data indicate that over 80% are using their engineering training in their work. However, compared to other STEM disciplines, engineers are more likely to become managers, perhaps because there are few promotion opportunities for engineers outside of management. The engineering workforce is less diverse than the STEM workforce, having significantly fewer women and underrepresented minorities and relatively more foreign-born workers.
Acknowledgements: We thank the National Science Foundation for granting a site license to use the SESTAT data. Carlos Zambrana provided research assistance. Ginther and Kahn acknowledge financial support from NIH grant 1R01AG036820. The use of NSF data does not imply NSF endorsement of the research, research methods, or conclusions contained in this report. Any errors are our own responsibility.
___________________
1 This paper was not subject to NAE editing.
“Scientists discover the world that exists; engineers create the world that never was.”
—Theodore Von Karman, aerospace engineer
The link between engineering, innovation, and economic activity is clear. Engineers innovate to solve problems, and innovation—new ideas, products, and processes—is the key ingredient in economic growth. Many believe that much of economic growth in the United States for the past 60 years has resulted from innovation and technological change, and engineers have been pivotal in that innovation (Olson 2014). The health of the engineering enterprise is tied to the size and well-being of the engineering workforce. The preface of The Importance of Engineering Talent to Prosperity and Security of the Nation declares: “The quality of engineering in the United States will only be as good as the quality of the engineers doing it.” (Olson, 2014, p. v).
In this study, we paint a statistical portrait of the engineering education-workforce continuum. In the first section, we report statistics on engineering degrees awarded as well as the demographic makeup of degree recipients. In the second section, we examine employment trends for engineers. To do this, we consider and report on various definitions of working in engineering as well as career transitions. We also consider employment sectors, earnings, job satisfaction and working in careers unrelated to engineering. The final section concludes that the engineering workforce is growing, highly compensated, and using their engineering training in their employment, although there are concerns related to diversity of the workforce.
1. Engineering Degrees Awarded
Recent Patterns
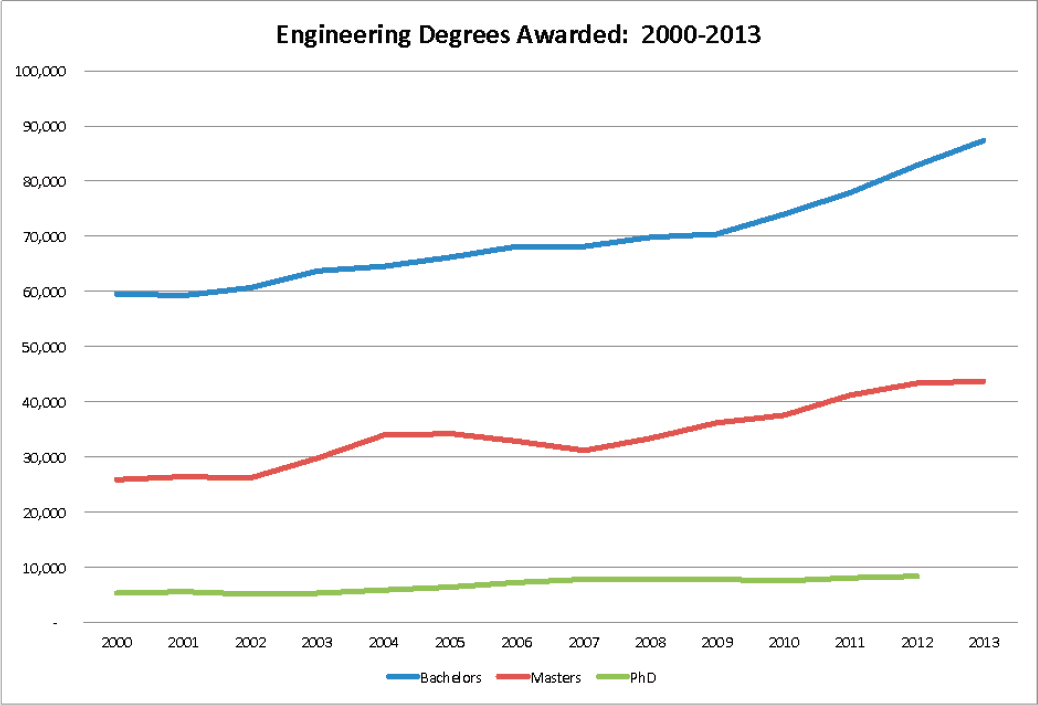
We begin the analysis by examining engineering degrees awarded between 2000-2013. These data come from two sources: the Integrated Postsecondary Education Data System (IPEDS) for bachelor’s and master’s degrees and the Survey of Earned Doctorates (SED) for PhD degrees. Throughout this analysis we focus more on bachelor’s of science in engineering (BSE) and master’s of science in engineering (MSE) because individuals holding these degrees are more prevalent and more likely to be employed in the private sector. For completeness, we include PhDs in engineering in this section as well. In Figure A-1 we show the number of BSE, MSE and PhD degrees in engineering awarded. BSEs in Engineering have grown rapidly, from 60,000 to almost 90,000 by 2013. MSEs have grown as well, from about 26,000 to 44,000 in 2013. PhDs have grown from 5,300 to 8,400 degrees by 2012.
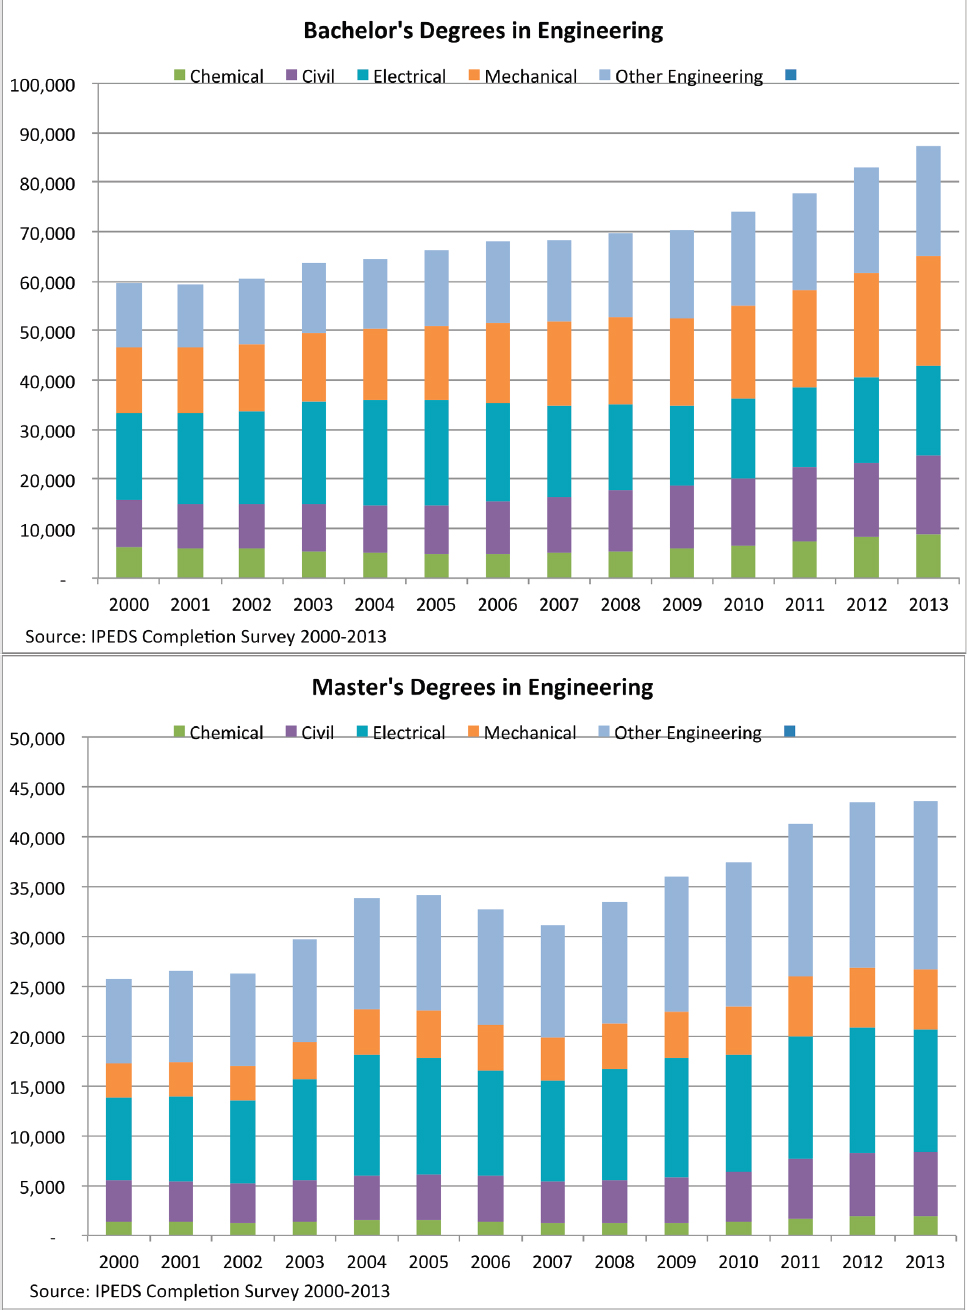
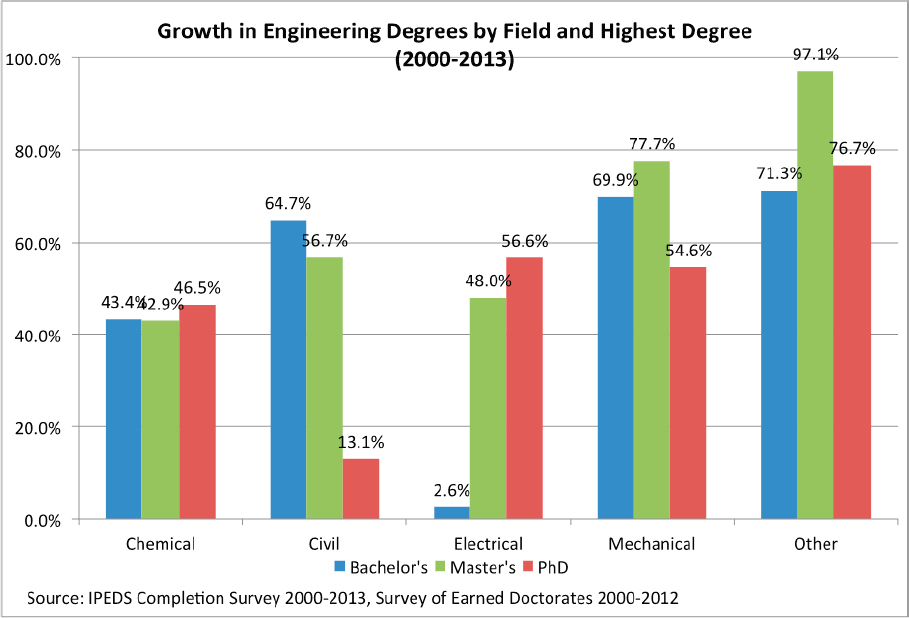
Figure A-2 shows the breakdown in degrees by field of engineering for BSEs and MSEs from 2000-2013. The largest engineering fields for BSEs are Mechanical and Electrical engineering, followed by Other engineering fields combined, Civil and Chemical. The size of fields for MSEs differ with Other and Electrical engineering being the largest followed by Mechanical, Civil and Chemical. Figure A-3 shows different patterns of growth in Bachelor’s, Master’s and PhD degrees by field, and interesting patterns emerge. “Other engineering” fields grew at the fastest rate for all three degree levels. This resulted from large growth in Aerospace BSE and MSE degrees and Biomedical BSE, MSE and PhD degrees. To some extent growth in Industrial MSEs also contributed to this pattern. Chemical engineering shows steady growth of around 45% for all degree levels, and Mechanical shows higher growth for BSEs and MSEs (70-80%) compared with PhDs of 55%. Growth in Civil engineering degrees is concentrated in the BSE and MSE levels. In contrast BSEs in Electrical engineering hardly grew between 2000-2013, but this comparisons masks a boom in Electrical engineering degrees through 2005 followed by a bust at the end of the decade—likely the result of fluctuations in demand from the Information Technology sector (Figure A-2). In contrast, Electrical engineering MSEs and PhDs grow between 48-57% between 2000-2013.
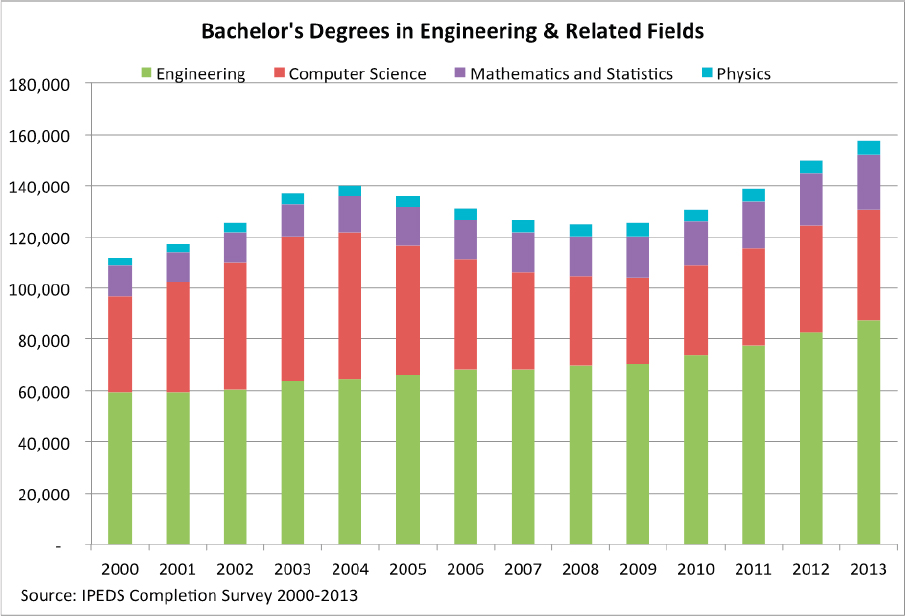
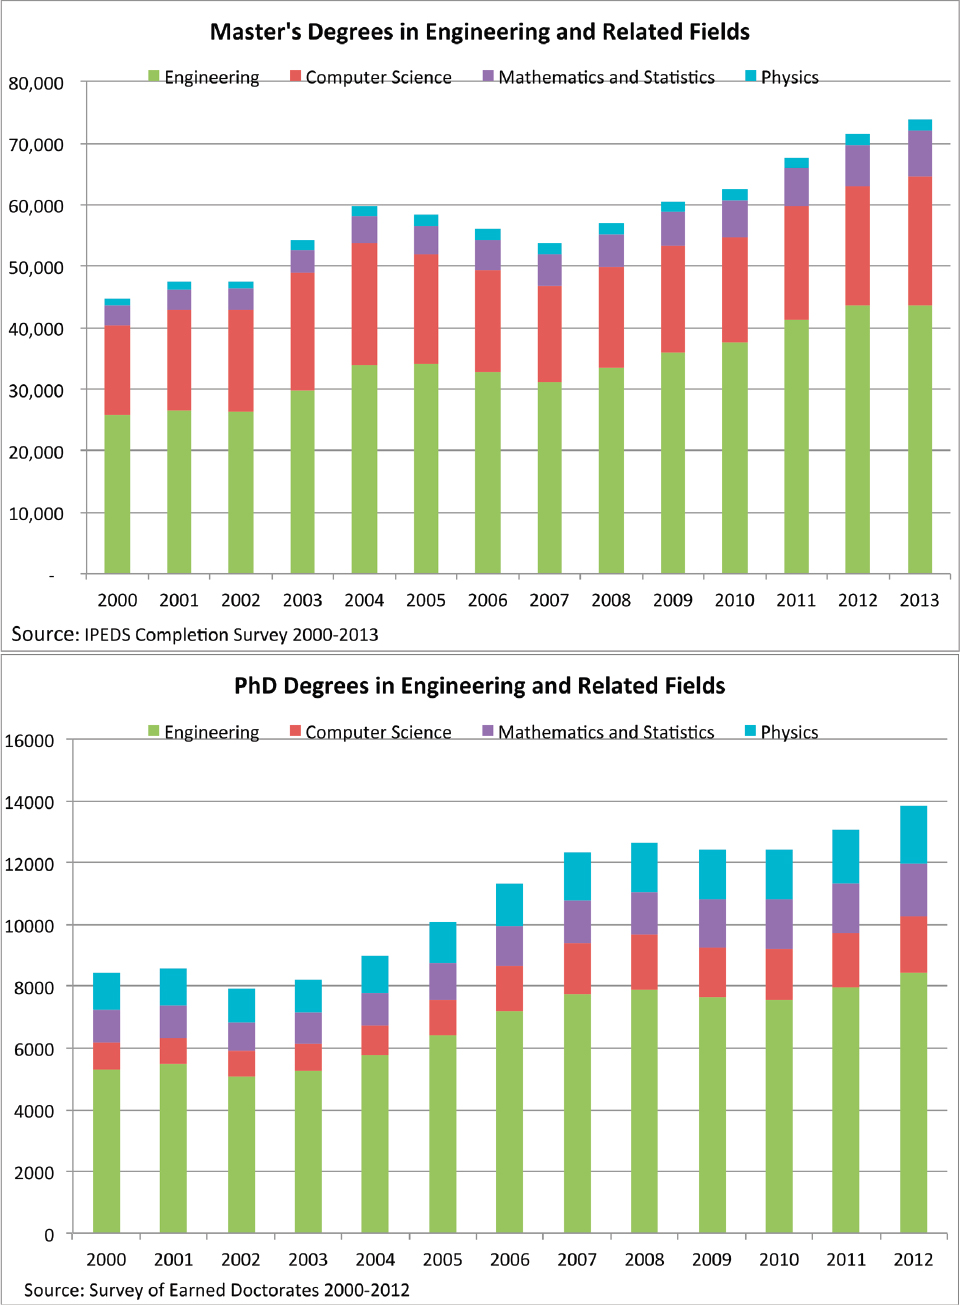
Overall, the data on degrees indicate healthy growth in the number of engineering degrees awarded. To underscore this point, Figure A-4 compares Bachelor’s degrees in engineering, computer science, mathematics and statistics, and physics (Appendix Figure A1-1 shows Master’s and PhD degrees). We chose these comparison fields because all emphasize quantitative skills. At the Bachelor’s and Master’s levels, engineering is the largest field, followed by computer science, mathematics and statistics, and physics. Engineering has shown steady growth whereas computer science has fluctuated significantly at the Bachelor’s level—likely the result of changes in the demand for information technology workers over the past decade. We observe similar trends at the Master’s
Source: BSE & MSE: IPEDS Completion Data; PhD: Survey of Earned Doctorates.
degree level (Appendix Figure A1-1), although engineering MSE degrees grew through 2005, fell through 2007 and then resumed growth through 2013.
Demographics
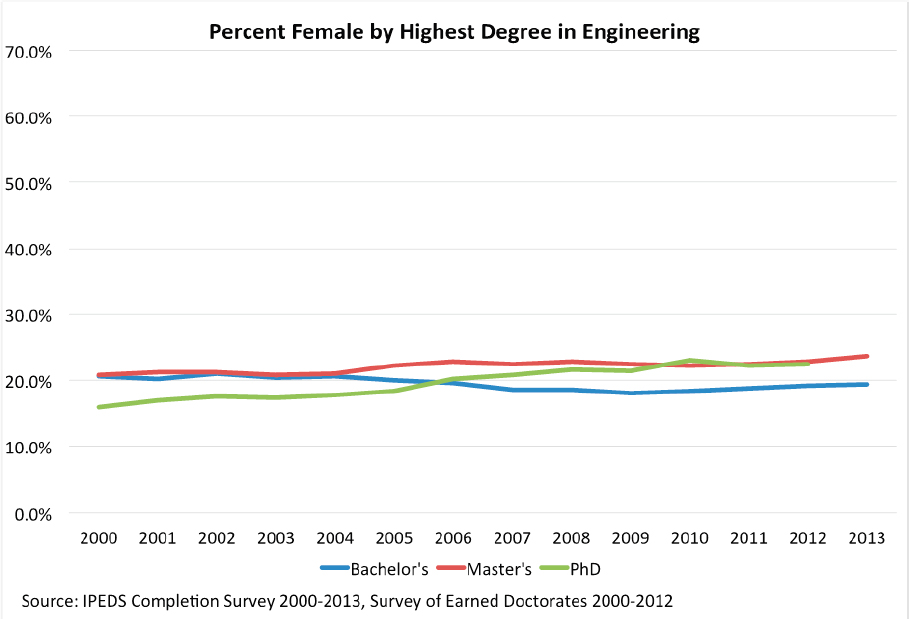
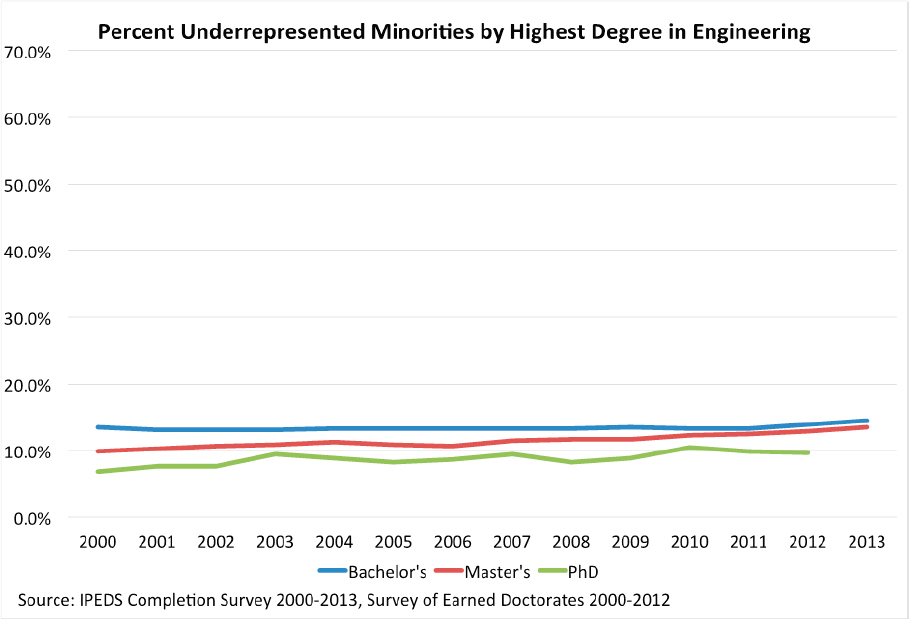
Although engineering is a large and growing field, one would be hard-put to describe the field as diverse. In 2012, 57% of all Bachelor’s degrees, 60% of all Master’s degrees and 46% of all PhD degrees were awarded to women. Figure A-5 shows the percentage of engineering degrees awarded to women from 2000-2013. Engineering awards far fewer Bachelor’s, Master’s and PhD degrees to women than do other fields. In 2013 only 19% of BSEs and 22% of MSEs (and of PhDs in 2012) were awarded to women. These percentages have been essentially flat with exception of PhDs which grew by 6 percentage points since 2000. In 2012, 13.8% of all Bachelor’s degrees, 12.9% of all Master’s degrees and 9.6% of all PhD degrees for U.S. citizens or permanent residents were awarded to underrepresented minorities. Figure A-6 shows that these percentages have been essentially flat for bachelor’s, master’s and PhD degrees.
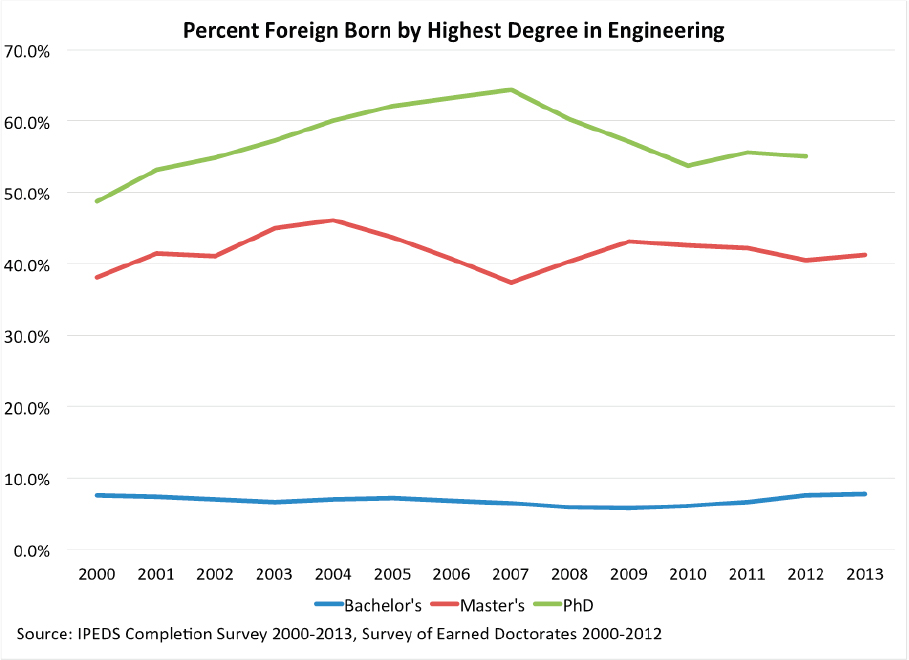
Degrees awarded to foreign-born students show interesting patterns relative to the slow- or no-growth in degrees awarded to women and underrepresented minorities. Figure A-7 shows that only 7-8% of BSEs in engineering were awarded to foreign-born students from 2000-2013, although the numbers of foreign born BSEs awarded grew as the total number of BSEs awarded grew. Approximately 40% of MSEs in engineering were awarded to the foreign-born—with this percentage peaking at 46% in 2004 and decreasing to 41% in 2013. PhDs awarded
Source: IPEDS Completion Survey.
Source: Bachelor’s & Master’s—IPEDS Completion Survey; PhD—Survey of Earned Doctorates.
Source: IPEDS Completion Survey.
Source: Bachelor’s & Master’s—IPEDS Completion Survey; PhD—Survey of Earned Doctorates.
Source: Bachelor’s & Master’s—IPEDS Completion Survey; PhD—Survey of Earned Doctorates.
Source: Bachelor’s & Master’s—IPEDS Completion Survey; PhD—Survey of Earned Doctorates.
to foreign-born students increased from 49% in 2000 to a high of 60% in 2007 before dropping to 55% in 2012 (Figure A-7). For all fields in 2012, 3% of all Bachelor’s, 12% of all Master’s degrees and 35% of all PhD degrees were awarded to foreign-born students. Thus, engineering awards a disproportionately larger share of degrees to foreign students than other disciplines.
This analysis of degrees awarded shows that engineering is a large and growing field. In related work, Ginther (2015) shows that at the PhD level, engineering is growing more quickly than life science, physical science or social science fields. Despite this strong growth, diversity in engineering remains a challenge. Women now receive the majority of bachelor’s degrees in the US but less than 20% of engineering degrees. Underrepresented minorities receive fewer PhD degrees in engineering when compared to their representation in the population. If these trends persist, the engineering workforce will not reflect the diversity of the US population.
2. Employment Outcomes for Engineers
Recent Trends in Total Engineering Employment
We use the 2013 Occupation and Employment Statistics (OES) and the 2013 National Survey of College Graduates (NSCG) to examine employment trends for engineers. The OES is an annual survey of employers conducted by the Bureau of Labor Statistics that provides information on employment and earnings in metropolitan areas, states and the nation as a whole by occupation. Our analysis of OES data is limited to individuals employed in engineering occupations because it has no information on education. As a result, we do not observe individuals with engineering degrees working in non-engineering occupations. We use the NSCG, collected by the National
Science Foundation (NSF), to examine the relationship between engineering degrees and engineering employment. The NSCG surveys individuals with bachelor’s degrees or higher, and contains detailed information on all degrees, occupations, employment sector, salaries, the relationship of the highest degree to the job, technical expertise, reasons for working outside of the field of one’s degree, job satisfaction, and work activities. We consider each of these data sets and outcomes in turn.
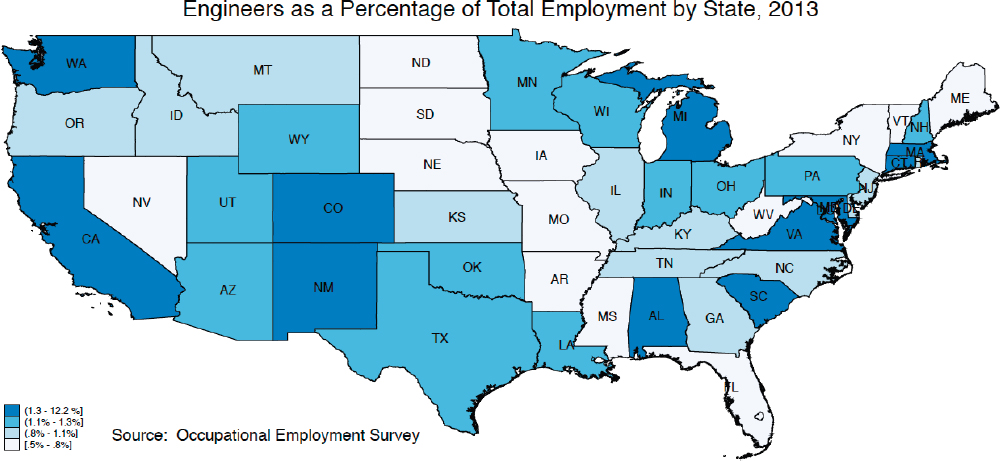
We use the OES data show to examine employment in engineering occupations in the nation as a whole. Figure A-8 shows the distribution of engineers as a percentage of total employment by state in 2013. Engineers make up a larger share of total employment in Washington and California on the west coast, Colorado, New Mexico, Alabama, Michigan, South Carolina, Virginia, Maryland, Connecticut and Massachusetts. New Mexico and Alabama stand out as places where large federal investment in National Laboratories (New Mexico) and NASA (Alabama) led to a significant concentration of engineers.
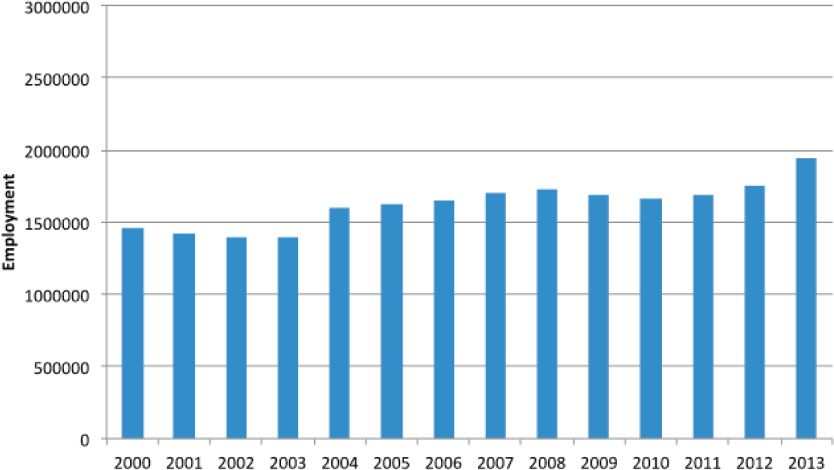
Although the OES is not considered a time-series, the repeated cross sections show interesting patterns across recent business cycles. Figure A-9A shows that employment in engineering occupations fell after the 2000 recession and jobless recovery, and then resumed growth from 2004-2008. After the 2008 recession and subsequent jobless recovery, engineering employment dipped slightly through 2010 resuming growth in 2011 with a sizeable jump in 2013. The OES data only examines individuals employed in engineering occupations and does not provide information on those trained as engineers but employed in other occupations. Figure A-9B shows the stock of engineers holding either a Bachelor’s or Master’s degree in engineering from the NSF’s 1999-2010 Science and Engineering Data System (SESTAT) and the 2013 NSCG. The stock of individuals trained as engineers exceeds the number of people employed in engineering occupations. In 2003 there were nearly 2.5 million people with BSE or MSE degrees but less than 1.5 million were employed in engineering occupations; in 2013 there were 2.7 million BSE and MSE degree holders but less than 2 million working in engineering occupations. These large differences in the stock of trained engineers and those employed in engineering occupations raise important questions about the relevance of the engineering degree and whether engineers are using their degrees in their employment. We examine this issue in greater detail.
Source: Occupational Employment Statistics.
Source: Occupational Employment Statistics.
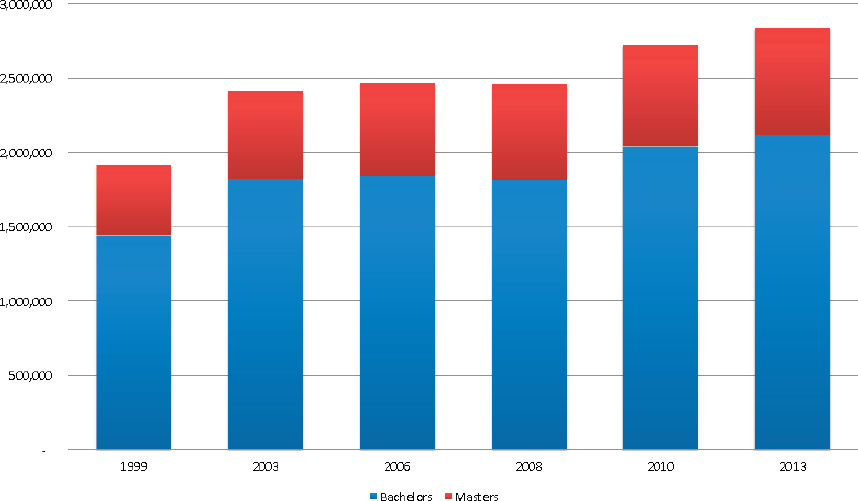
Source: 1999-2010 SESTAT; 2013 National Survey of College Graduates.
Do Engineers use their Degrees in their Work?
Although these trends in employment and earnings are informative, the detailed information provided by the NSCG allows us to examine the engineering education-workforce continuum. In 2013, there were approximately 2 million people whose highest degree was a bachelor’s in engineering (BSE), and another 700,000 whose highest degree was a master’s in engineering (MSE). In the analysis that follows we combine all bachelor’s and master’s highest degrees in engineering together and used these data to examine the employment of engineers. What were these people doing, and how had their careers developed from when they got their degree? Most importantly, were they still working in engineering jobs or, more generally, utilizing their engineering education in their work?
The answer depends on how one defines engineering jobs or utilizing their engineering education. Before turning to that thorny issue, it is important to note that some of these people with engineering degrees – specifically 16.5% of them – were not working at all (or were working part-time and had no occupation assigned to them). The majority of these were out of the labor force (which includes those enrolled in an educational program), and about 3% were looking for a job.
The National Science Foundation (NSF) must make choices about what to categorize as an engineering job in the face of considerable ambiguity. Some of NSF’s “engineering occupations” (listed in appendix A) – especially “computer engineers - hardware” – could have been categorized under computer occupations while one could argue that the NSF computer-occupation “computer engineers – software” could instead have been categorized under engineering occupations (and indeed, is listed under engineering in the 2013 questionnaire but not in the occupation data itself). Similarly, the line between engineering occupations and what NSF deems to be “engineering-related” occupations (e.g. Electrical, electronic, industrial, and mechanical technicians, also listed in Appendix A) is not a clear-cut choice. In the 2000s, SESTAT gave managers in engineering a separate occupational code. However, NSF only includes as “engineering managers” lower level managers directly supervising engineering, but does not include higher-level managers even if they worked in engineering companies supervising managers who in turn, supervised engineers.
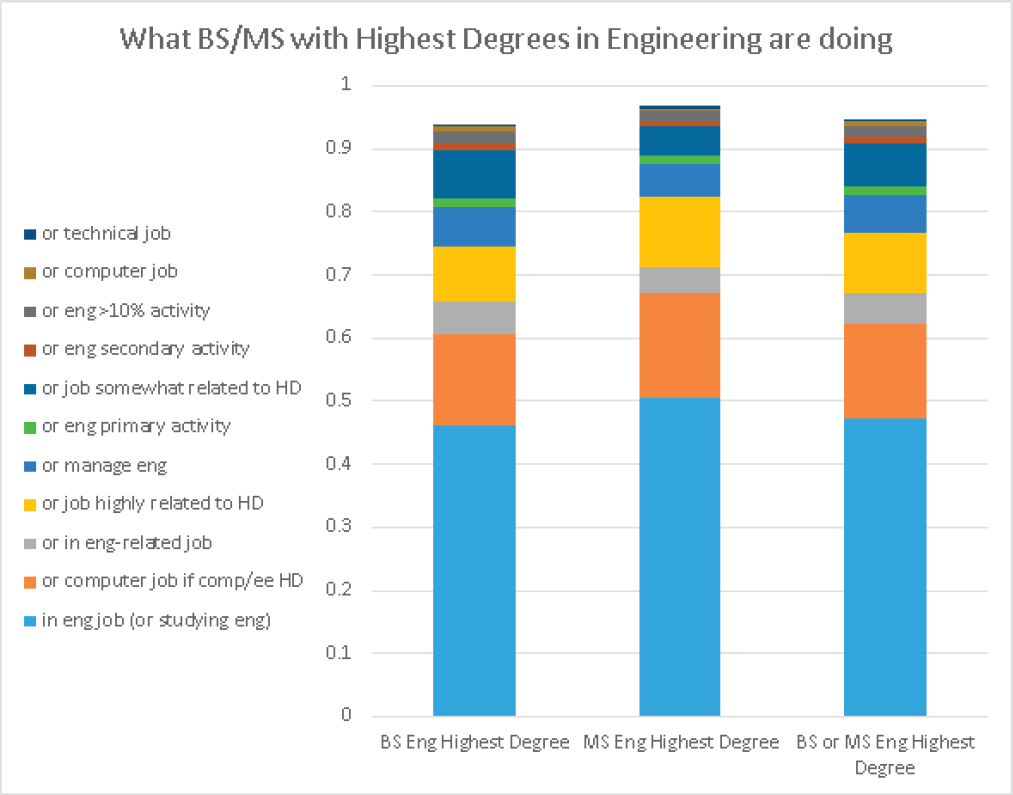
In 2013, we calculate that of those with bachelor’s or master’s highest degrees in engineering, 47.3% work in what NSF considers an engineering job: 46.1% among BSE-highest degree holders and 50.5% among MSE-highest degree holders. This includes low-level engineering managers. Without these managers, the percent in engineering occupations is only 39.3%: 37.9% among those with BSE-highest degree and 43.4 % of those with MSE-highest degree.
However, this narrow definition of engineering occupations is a limited measure of those that use their engineering degrees in their work. In Figure A-10 and the discussion below, we add in others, starting with those to be most clearly using their degrees and then adding additional people who in our judgment, by their occupation, activity, or self-admission, are using their degrees in their employment.
The largest subfield of new BSE/MSE degrees awarded throughout the period 2000-2013 were in Electrical and Computer engineering. Many of graduates in this subfield were classified as working in a computer occupation instead of an engineering occupation. But we argue they are surely using their education in electrical and computer engineering. If we add these in with those in NSF engineering jobs, the proportion utilizing their engineering degrees jumps to an average of 62.3% of the total stock of those with engineering BSEs or MSEs working in 2013.
Also, the line between engineering and engineering-related seems indistinct. If we add the jobs that are engineering-related, the total percentage utilizing their educational degrees become 67.1% (again, somewhat higher amongst those with MSE highest degrees than those with MS highest degrees.)
Another way of ascertaining whether those who had highest degrees in engineering were working in jobs utilizing their engineering education is to look at the answer to the SESTAT question, “To what extent was your work on your principal job related to your highest degree?” with the possible answers “closely related,” “somewhat related” and “not related.” 56.7% of those with highest degrees in engineering respond that their job is closely related to their highest degree. Adding in those individuals with closely related jobs brings us to 76.7% of BSE and MSE degree holders using their engineering degrees in their employment.
An additional complication is caused by “manageers,” a term we coined for engineers who move into management positions. The numbers of those working in NSF-defined engineering jobs included “engineering managers”
Source: 2013 National Survey of College Graduates. (2013).
– lower level managers directly supervising engineering. However, it does not include higher-level managers even if they worked in engineering companies supervising managers who in turn, supervised engineers. We have created an additional category of managers doing work related to engineering that includes people who: 1) have a highest degree is in engineering, 2) list their primary occupation is a manager, and 3) answer “yes” to a survey question that their job “requires technical expertise at the bachelor’s level or higher in engineering, computer science or the natural sciences.” Note that by applying these conditions only to those with engineering as their highest degree, we believe that we have captured those whose management work requires technical expertise in engineering. This brings the percentage of those with highest degrees in engineering utilizing their degree up to 82.7.
A final way of determining whether those who had highest degrees in engineering were working in jobs utilizing their engineering degree is to look at the answer to the SESTAT questions: “Which of the following work activities occupied at least 10 percent of your time during a typical work week on this job?” and “On which two activities in question did you work the most hours during a typical week on this job?” (with the latter answer ranked). Of the activities listed, the ones we deem most directly related to engineering are “doing basic research,” “doing applied research,” “development – using knowledge gained from research for the production of materials, devices,” “design of equipment, processes, structure, models,” and “quality of productivity management.” Those
who do one of these as their primary activities include only 31.2% of all those with highest degrees in engineering, which we note is even less than the percentage whose jobs are classified as NSF engineering occupations but not NSF engineering managers (and the correlation between those with highest degrees in engineering and doing one of these primary activities is only r=.38). Adding the few people who do one of these as their primary activity not already included in the group utilizing their engineering education increases the total percent by less than 1½ percentage points, to 84.0% (See Figure A-10).
Figure A-10 then adds in those whose job is only “somewhat” related to their highest the degree (engineering). This has a large impact, increasing the percentage to 90.8%: 93.5% of those with MSE degrees and 89.8% of those with BSE degrees. We conclude that this is a very large percentage of people educated in engineering who are using their engineering degrees in their employment.
To round out our analysis, we add in a few other groups with highest degrees in engineering who are using their engineering education to a more limited extent: first, those whose secondary work activity is the engineering activities listed above, then those who engage in these activities for at least 10% of the time, then those who work in a computer job (but did not major in computer/electrical engineering), then finally those whose job “requires technical expertise at the bachelor’s level or higher in engineering, computer science or the natural sciences.” Adding these leaves us with 94.6 percent of those with highest degrees in engineering using their engineering degree in some way.
Figure A-10 includes all people with highest degrees in engineering who work. Of these, 3.3% work part time. Somewhat fewer people with engineering degrees who work part-time work in engineering jobs, perhaps because part-time engineering jobs are less available than part-time jobs in other occupations. (This point is made in Kahn and Ginther 2015). Including only those who work full time brings us to 95.7% of those with highest degrees in engineering using their degrees in some way.
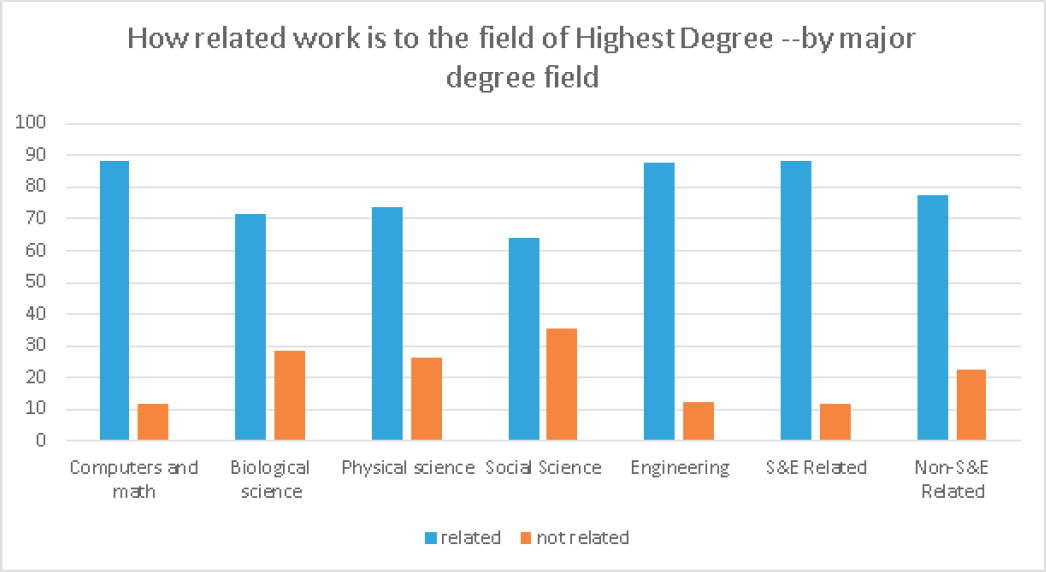
It is enlightening to compare this with other fields. The best way is to use the question, “To what extent was your work on your principal job related to your highest degree?” Figure A-11 shows the percent in each major field answering that their job is either closely or somewhat related for those with highest degrees either a bachelor’s
Source: 2013 National Survey of College Graduates. (2013).
or a master’s. The percent working in related jobs hovers between 87.5 and 88.2 percent for those with highest degrees in engineering, computers/math and S&E-related fields all, considerably higher than the other major fields.
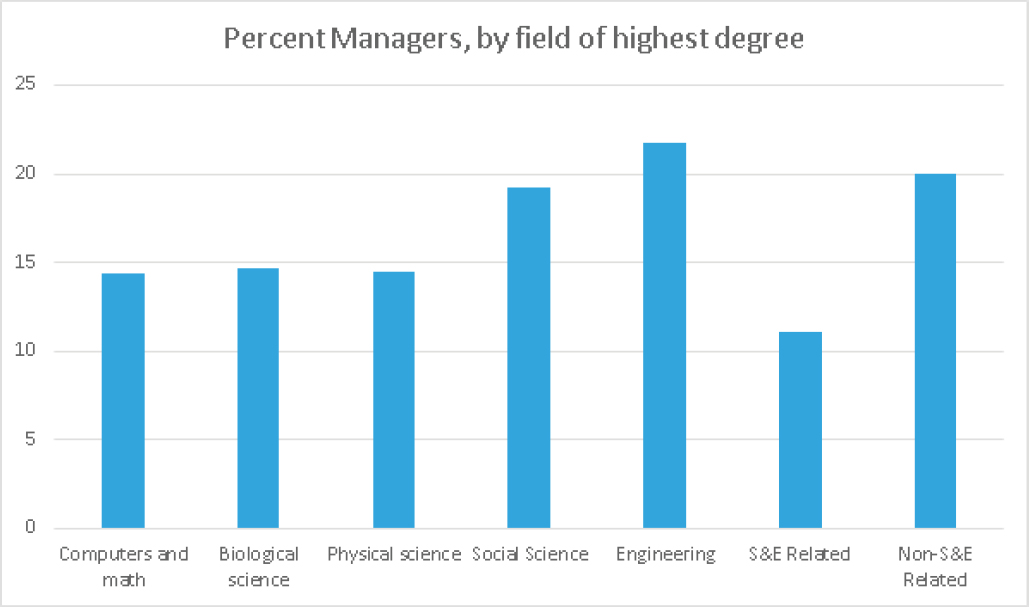
Finally, we note that a major reason that people move from the most narrowly defined engineering occupations and activities is often to become managers. In fact, people who have highest degrees in engineering are more likely to become managers than those who have highest degrees in other major fields, with the differences most striking between engineering and computer/math, biological and physical sciences (Figure A-12).
Moreover, when engineering BSE/MSE holders who do the kinds of activities associated with engineering – such as applied research or design of products – they get paid less than managers. For instance, we have run a regression of logged salary on a set of dummy variables for primary work activities as well as on age and age squared. Holding age constant, the highest salary was paid to managers, the lowest was paid to those doing basic science (about 58% less salary on average than to managers); applied research was also poorly paid (23% less than management) and development and design were paid about 10% less than managers on average.
Career Transitions
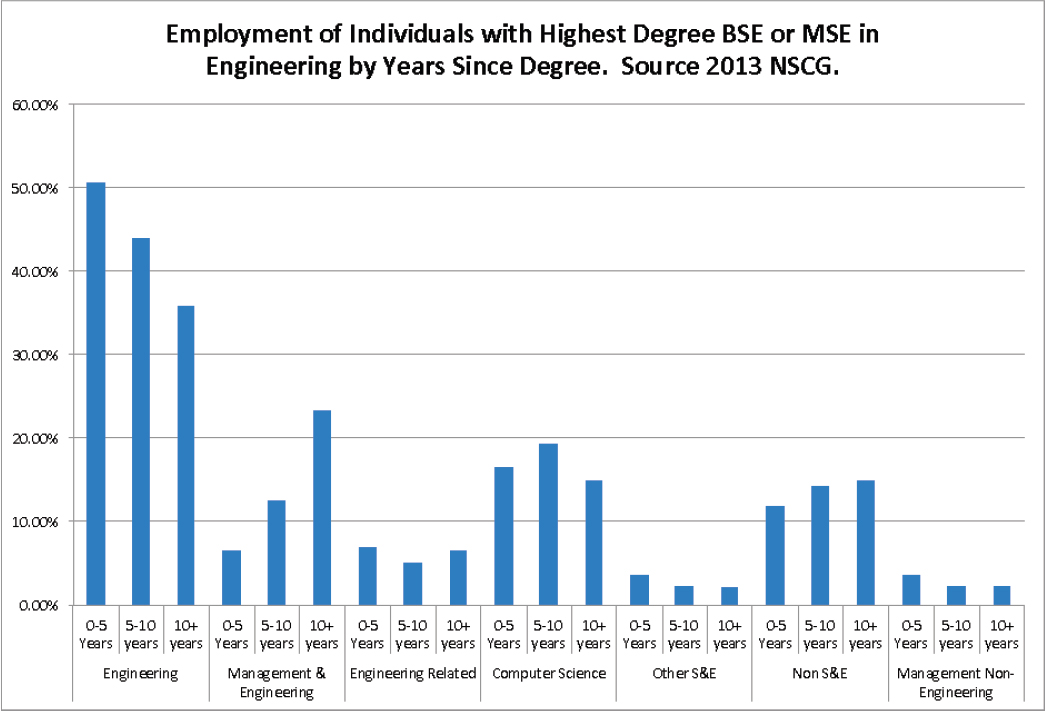
Figure A-13 (based on the 2013 cross-section) and Table A-1 (based on longitudinal data) provide insight into the early career dynamics of these occupations. In 2013, half of all engineering BSEs and MSEs are working in engineering occupations within 0-5 years of their highest degree. This percentage drops with years of work experience to 36.0% for those with 10-plus years since highest degree. In contrast, the number moving into Management & Engineering increases with years of experience starting at a low of 6.0% at 0-5 years since highest degree and increasing to 23.4% by 10-plus years since degree. Thus, engineers seem to transition from engineering occupations into “manageers,” our coined term for Management & Engineering occupations.
Source: 2013 National Survey of College Graduates.
Source: 2013 National Survey of College Graduates. N = 2,722,978.
Table A-1 corroborates the point that indeed, people move from engineering jobs to being managers as they get older and move up the career later. This table uses the longitudinal aspect of SESTAT to follow individuals through from one point to another. The first panel of Table A-1 picks up people who received highest degrees (BSE/MSE) in engineering between 1996 and 2002 and categorizes them by their job in 2003. It then picks up these same individuals and asks what they were doing five years later in 2008. We see that of these junior people, 75% of those who were working in engineering jobs (excluding management) in 2003 are still working in engineering jobs 5 years later and only 7.1% are working in management jobs associated with engineering. However, Table A-1’s second panel picks up older people who in 2003 were between 10 to 17 years past their graduation and follows them over the next five years. Of those who were observed working in engineering jobs in 2003, the same proportion (75%) were still working in engineering jobs 5 years later. However, 12.5% are working in management jobs associated with engineering. Of those in this older cohort who started in engineering-related management jobs in 2003, 50% remained in these kinds of jobs 5 years later. On the other hand, if one was in a management job early in the career, they were less likely to remain in that kind of job 5 years later (with 35% remaining there).
If the individual with an engineering BSE/MSE starts in a different occupational category in year 5, there is no systematic exodus from that occupation to management in the way there is from engineering jobs. In the cross section of Figure A-13, approximately the same proportion of BSE/MSE degree holders are employed in Computer Science, Engineering-related jobs, Other S&E, and Management Non-Engineering in year 1-5, 5-10 and >10 postdegree, whereas Non-S&E shows some growth between 0-5 years and 5-10 years and computer science peaks at nearly 20% 5-10 years since degree and then drops at 10-plus years to 15%.
Table A-1 A Comparison between what people were doing in 2003 and 2008.
| Table 1: A comparison between what people were doing in 2003 and in 2008. Percent of those starting in each job (row) who ended up in each kind of job (column) |
|||||||||
| Where they ended up in 2008 Population: those who received their bachelors 1998-2002 and had either a BS or MS in engineering (#obs=1625) |
|||||||||
| Where they started in 2003 | Working in Engineering Job | Working in Computer Job | Working in “Eng-Related” Job eg eng. Technician, architect | Management Jobs Associated with Engineering or | Working in other STEM job | Management Jobs Not Associated with Engineering* | Working in other non-STEM job | Not-employed | Total |
| Population: those who received their bachelors 1996-2002 and had either a BS or MS in engineering (#obs=2324) | |||||||||
| Working in Engineering Job | 74.49% | 2.80% | 1.05% | 7.07% | 2.01% | 0.72% | 6.39% | 5.47% | 100.00% |
| Working in Computer Job | 7.84% | 70.23%. | 0.38% | 8.72% | 1.22% | 0.52% | 5.89% | 5.20% | 100.00% |
| Working in “Eng-Related” Job eg eng. Technician, architect | 32.47% | 0.00% | 32.57% | 16.26% | 0.76%. | 7.79% | 3.56% | 6.59% | 100.00% |
| Working in Management Jobs Associated with Engineering or Computers | 23.20% | 3.51% | 0.00% | 34.80% | 1.82% | 6.67% | 29.99% | 0.00% | 100.00% |
| Working in other STEM job | 6.42% | 12.57% | 0.00% | 14.63% | 37.81% | 3.93% | 8.46% | 16.19% | 100.00% |
| Working in Management Jobs Not Associated with Engineering or Computers | na | na | na | na | na | na | na | na | na |
| Working in other non-STEM job | 15.03% | 2.79% | 0.92% | 10.10% | 7.23%. | 7.14% | 52.22%. | 4.57% | 100.00% |
| In school: non-STEM | na | na | na | na | na | na | na | na | na |
| Not-employed | 26.38% | 21.07% | 3.40% | 8.07% | 9.02% | 3.03% | 7.76% | 21.27% | 100.00% |
| TOTAL | 47.81% | 15.21% | 2.24% | 9.73% | 4.07% | 2.26% | 12.28% | 6.40% | 100.00% |
| Population: those who received their bachelors 1986-1993 and had either a BS or MS in engineering by 2003 (#obs=3947) | |||||||||
| Working in Engineering Job | 75.00% | 1.44% | 2.36% | 12.47% | 1.09% | 0.30% | 5.03% | 2.31% | 100.00% |
| Working in Computer Job | 5.19% | 77.53% | 0.42% | 9.37% | 1.12% | 0.17% | 3.29% | 2.91% | 100.00% |
| Working in “Eng-Related” Job eg eng. Technician, architect | 24.68%. | 8.86% | 46.16% | 2.02% | 0.97%. | 0.00% | 5.95% | 11.35% | 100.00% |
| Working in Management Jobs Associated with Engineering or Computers | 20.85% | 4.24% | 2.51% | 49.66% | 4.40% | 8.15% | 8.38% | 1.81% | 100.00% |
| Working in other STEM job | 6.50% | 1.24% | 0.52% | 8.53% | 63.00% | 3.64% | 12.70% | 3.86% | 100.00% |
| Working in Management Jobs Mot Associated with Engineering or Computers* | 4.44% | 4.91% | 0.00% | 35.09% | 4.74% | 13.47% | 32.64% | 4.72% | 100%* |
| Working in other non-STEM job | 11.07% | 2.27% | 0.82% | 13.00% | 4.93% | 4.75% | 56.77% | 6.39% | 100.00% |
| In school: non-STEM | na | na | na | na | na | na | na | na | na |
| Not-employed | 13.74% | 13.38% | 6.89% | 2.42% | 5.18% | 0.30% | 19.78% | 38.31% | 100.00% |
| TOTAL | 36.77% | 16.59% | 3.04% | 15.47% | 4.73% | 2.28% | 15.25% | 5.87% | 100.00% |
n.a.: Data suppressed because row has fewer than 20 observations
* Row has fewer than 100 observations so data should be considered suggestive only
Another point brought home by the longitudinal data (Table A-1) is that the line between some of these other jobs and engineering are not are all that clear. For instance, if a young person is observed in an engineering-related job in 2003, they are just as likely to be observed in an engineering job 5 years later than to be still in an engineering-related job (each 32.5%). It appears that the “engineering-related” job is just an entry-level job before entering an engineering occupation.
In contrast, junior people who in 2003 were in a non-engineering STEM occupations in 2003 are not likely to move back into engineering--only 15% do so.
Employment Sectors
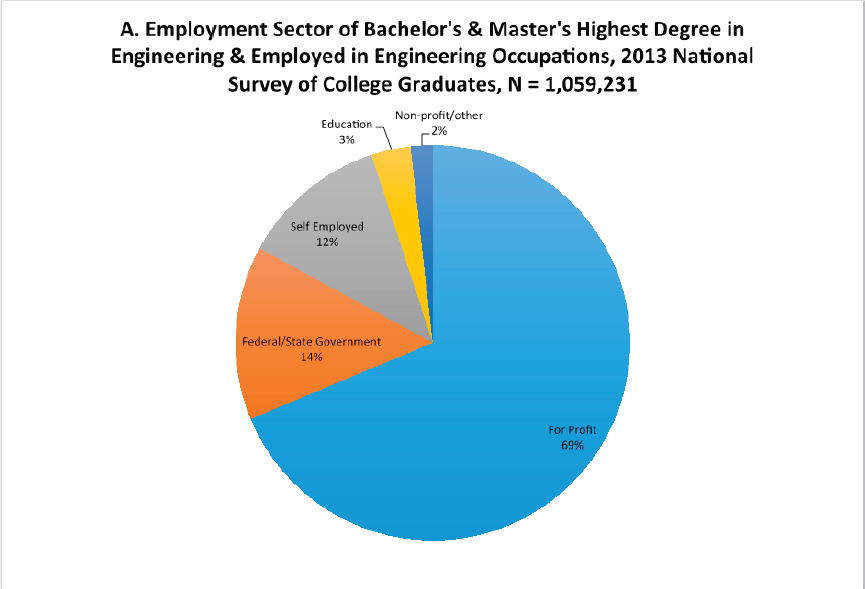
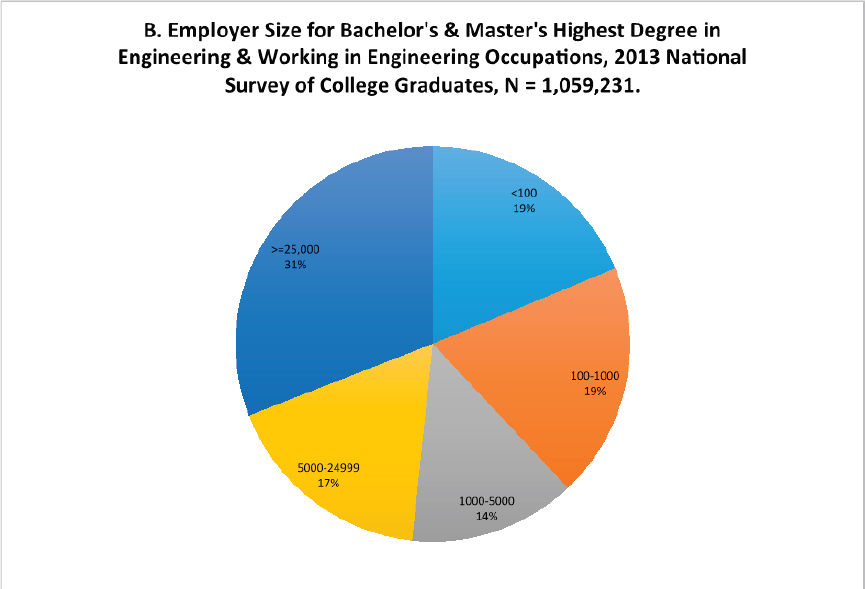
Figure A-14 shows the employment sector and employer size of individuals with bachelor’s or master’s in engineering as their highest degree in 2013 using the NSCG. Figure A-14A indicates that 69% of engineers work in for-profit companies and another 12% are self-employed (either incorporated or unincorporated) and presumably for-profit. 14% of engineers work for the government sector and another 5% are divided between education and the non-profit sectors. Figure A-14B shows that about half of engineers (48%) work for very large companies with 5,000 or more employees. 38% of engineers work for companies with less than 1,000 employees, and the rest (14%) work for mid-sized firms with 1,000-5000 employees. Thus, engineers are concentrated in large firms in the for-profit sector.
Although the majority of engineers are working in large firms, the NSCG data allow us to examine engineering entrepreneurship for individuals with a bachelor’s or master’s degrees in engineering. This paragraph identifies likely entrepreneurship among engineers employed in the for-profit or self-employed sectors with either a BSE or MSE highest degree who report engineering occupations. Of these, 5.4% are working in a business started within the past 5 years. Self-employment is often used as a proxy for entrepreneurship. If we define engineering entrepreneurship as being self-employed (either incorporated or unincorporated) in a job that requires technical expertise at bachelor’s level or higher in engineering, computer science, math or natural science, then 15% of the combined for-profit/self-employed population are engineering entrepreneurs. If we further want to identify entrepreneurs (self-employed) in new businesses, of the 15% who are self-employed, 16% have new businesses started in the last five years. To put these numbers in perspective, engineers make up 6% of the 55.4 million college-educated individuals in the US in 2013. Of the total number of technical entrepreneurs – measured as the self-employed working in a job requiring technical expertise – 20% have some degree in engineering (Bachelors or higher). Thus, engineers are relatively more entrepreneurial than other fields of study.
Earnings
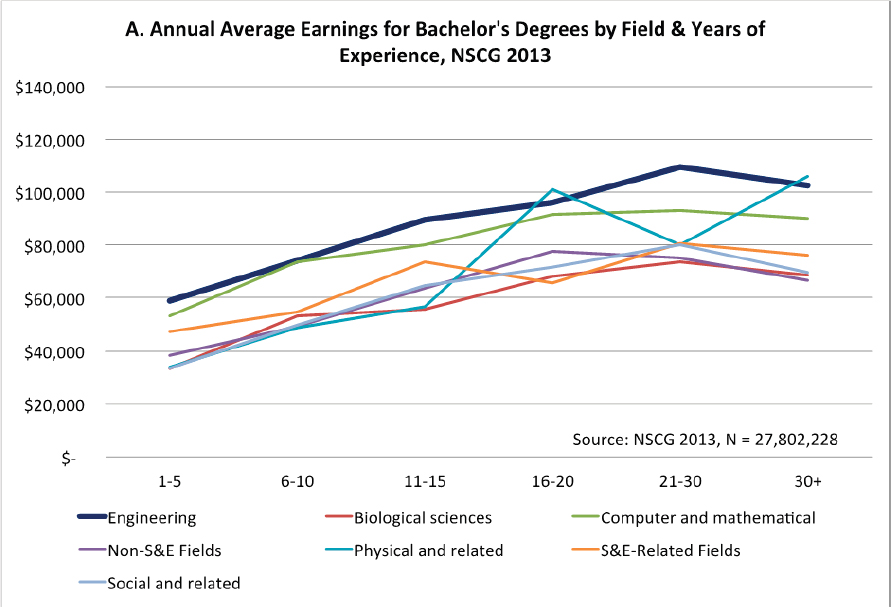
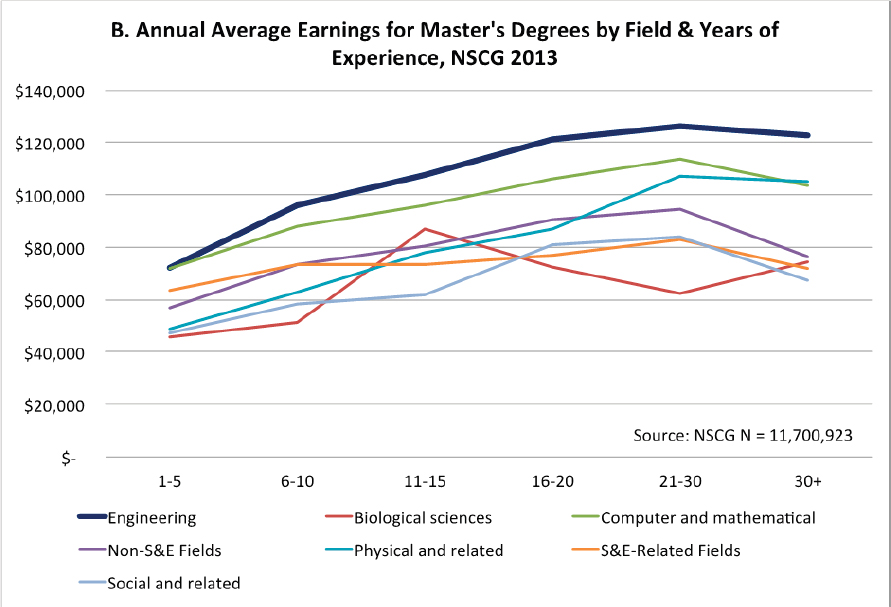
Figure A-15 shows the annual average earnings in 2013 of those with bachelor’s and master’s highest degrees by years of experience for engineering compared to other fields. Figure A-15A compares earnings at the bachelor’s degree level and Figure A-15B compares earnings at the master’s degree level. Engineers consistently earn more than individuals from other fields. At the bachelor’s level, annual earnings for engineers within 5 years of receiving their degree average about $60,000 per year, whereas social science and biological science majors earn less than $40,000 on average. Engineers continue to earn a premium relative to other fields with peak earnings of $109,000 occurring at 21-30 years after the degree. The engineering earnings premium is higher at the master’s degree level than at the bachelor’s where engineers with 5 years or less of experience earn over $70,000 with a master’s degree and over $126,000 at 21-30 years after the degree. Only individuals with a master’s degree in mathematics and computer science and physical and related sciences earn more than $100,000 per year at the earnings peak, but earn significantly less on average than MSEs.
Job Satisfaction and Leaving Engineering
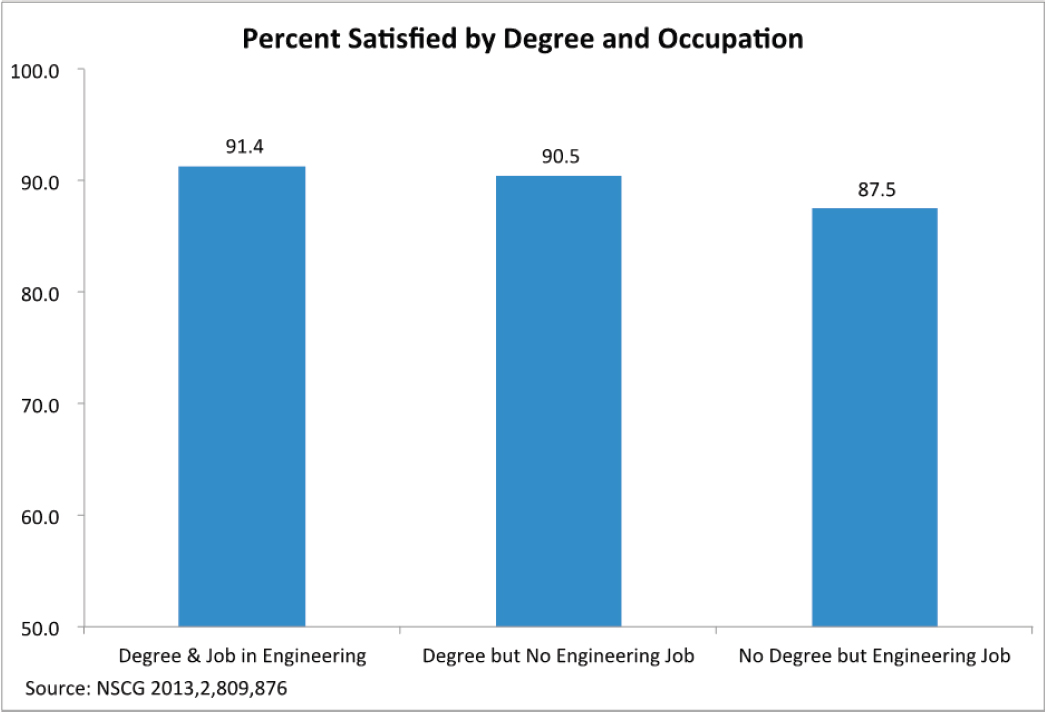
Figure A-16 shows the percentage reporting being somewhat or very satisfied with their job by engineering degree and occupation combinations. The first bar shows that 91% of individuals with a bachelor’s or master’s degree in
Source: 2013 National Survey of College Graduates. N = 1,059,231.
Source: 2013 National Survey of College Graduates. N = 1,059,231.
Source: 2013 National Survey of College Graduates. N = 27,802,228 Bachelor’s.
Source: 2013 National Survey of College Graduates. N = 11,700,923 Master’s.
Source: 2013 National Survey of College Graduates. N = 2,809,876.
engineering working in an engineering occupation report being satisfied with their job. Similarly 91% of engineers working outside of engineering occupations report being satisfied with their job. A slightly smaller percentage (88%) of individuals working in engineering occupations without an engineering degree also report being satisfied.
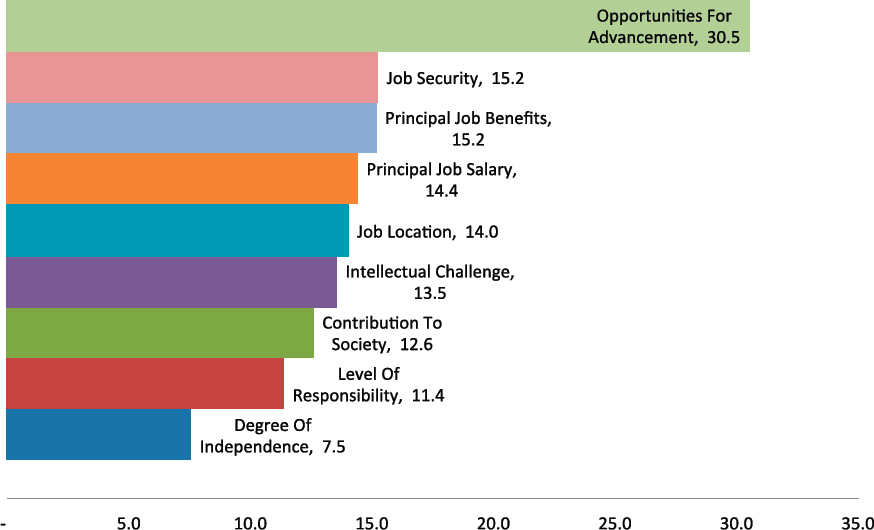
Of those with a highest degree and occupation in engineering who are dissatisfied, 31% indicate that opportunities for advancement is the leading source of dissatisfaction (Figure A-17). Other factors such as job security, benefits, job salary, job location, intellectual challenge, contribution to society and level of independence are chosen by between 10-15% as reasons for dissatisfaction (note that individuals can choose more than one reason).
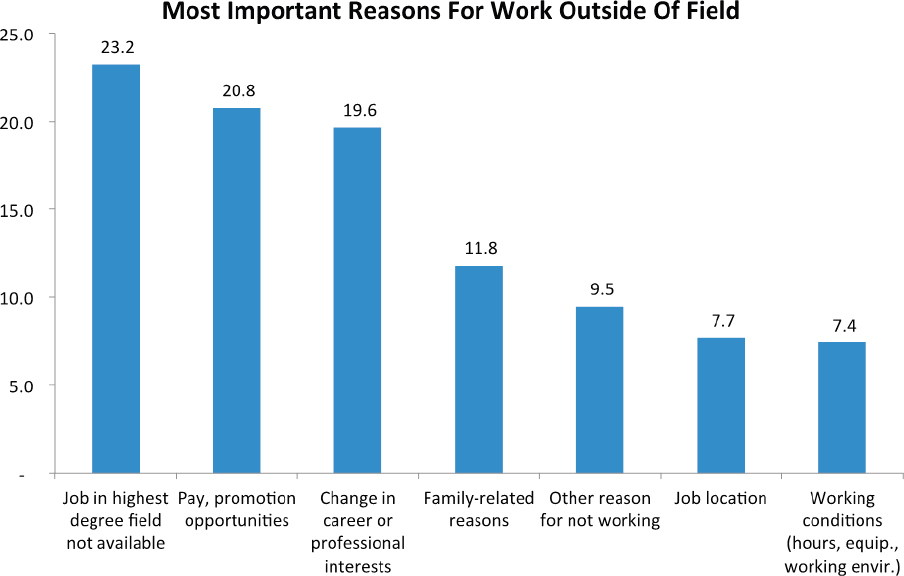
Perhaps the most relevant measure of dissatisfaction with engineering is working in a job that is not related to the highest degree in engineering. Figure A-18 reports the most important reasons that people leave engineering. 23% work in an unrelated job because a job in their highest degree field (engineering) is not available. This is followed by 21% who cite pay and promotion reasons, and 20% who report a change in professional interests. Family considerations (12%), working conditions (7%), job location (8%) and other reasons (10%) are also cited as reasons for working in a field unrelated to their engineering degree. Taken together, these results indicate that engineers are very satisfied in engineering occupations. Those who are dissatisfied dislike their opportunities for promotion; and of those who work in an unrelated field, availability of engineering jobs, pay and promotion, and changes in career interests figure prominently.
Source: 2013 National Survey of College Graduates. N = 1,059,230.
Source: 2013 National Survey of College Graduates. N = 338,795.
3. Conclusion
We have examined the engineering education-workforce continuum with the most recent data available from the IPEDS Completion Survey, the SED, OES, and National Survey of College Graduates. We have presented information on degrees awarded, demographics, employment trends, use of the engineering degree in employment, career transitions, employment sectors, earnings, job satisfaction and working in an occupation unrelated to the engineering degree. The picture that emerges from this analysis is one of a robust and growing field.
Engineering has several strengths that will propel the profession into the future. Individuals with engineering degrees work in a variety of occupations besides engineering, many in computers, engineering-related or management occupations. At first blush it appears that less than half (47%) of engineers are working in engineering occupations. However, we argue that this occupation-based definition misses important information, The large percentage of Electrical engineers working in computer science occupations adds another 15%; those in engineering-related occupations another 5%. To this, if we add those not already included above but reporting their job is highly related to their degree (10%) and those in none of these groups but in management occupations reporting their degree requires technical skills related to engineering (6%) we see that a total of 83% of individuals with BSE or MSE degrees are using those degrees in their employment. If work activities related to engineering are also included, then over 90% of trained engineers are using their degrees in their work. As a result, we conclude that occupation-based definitions of engineering are an imperfect way of examining the education-workforce continuum. Our approach suggests that narrowly defined engineering occupations do not fully capture whether engineers are engaged in engineering in their work.
In addition, engineers are highly paid and very satisfied with their work. Engineers with a BSE or MSE earn more on average than individuals with a bachelor’s or master’s degree in other STEM disciplines throughout their careers. 91% of BSEs and MSEs in engineering report being satisfied with their jobs.
Despite this positive outlook, there are also reasons to be concerned about the future of the engineering profession. First, engineering is less diverse than other STEM disciplines. While over half of bachelor’s degrees are now being awarded to women in STEM fields, engineering lags far behind with only 19%. Likewise, fewer bachelor’s degrees in engineering are being awarded to underrepresented minorities compared with other STEM fields.
Second, engineering awards a disproportionately large share of degrees to foreign-born students. 8% of BSE, 40% of MSE, and 55% of PhD degrees in engineering are awarded to foreign-born students. Although many of these students would like to remain in the US, immigration policy and the availability of H1-B visas may limit their opportunity to do so. The return of these students to their country of origin may constitute a brain-drain of engineering talent.
Third, we found that engineers are more likely to move into management occupations than other STEM disciplines. Furthermore, those who are working in a job not related to their engineering degree often do so because jobs in their field are not currently available and/or because of pay and promotion. Also, engineers working in engineering occupations who are dissatisfied cite their main problem as opportunities for advancement. Finally, those engineers that report management as a primary work activity earn significantly more than those who are engaged in engineering-specific activities such as research and product development. Taken together, these results suggest that engineers are drawn into management by a combination of higher salaries and advancement opportunities. Thus, firms employing significant numbers of engineers who want to keep them actively engaged in engineering tasks may want to consider two employment tracks for advancement in engineering—the current engineering management track and a second professional engineering track (such as principal engineer) that pays higher salaries to engineers who continue to work in non-management activities. The professional engineering track would have a career ladder and pay levels similar to those on the management track. However, instead of managing personnel and multiple projects, the principal engineers would specialize in solving complex engineering problems and the professional development of their junior engineering colleagues.
Even with these challenges, the picture we have painted of the engineering profession is a healthy one, especially in contrast to other STEM disciplines such as biological science, physical science, and social science where 25% - 35% of degree holders report working in a field that is unrelated to their highest degree and the salaries are significantly lower.
REFERENCES
Ginther, Donna K. (2015). “Storm Clouds on the Career Horizon for Ph.D.s.” Issues in Science & Technology (Summer 2015). 74-77.
Kahn, Shulamit and Donna K. Ginther (2015). “Are recent cohorts of women with engineering bachelor’s less likely to stay in engineering?” Frontiers in Psychology. 6:1144. doi: 10.3389/fpsyg.2015.01144
National Institutes of Health. (2012). Report of the Biomedical Research Workforce Working Group of the Advisory Committee to the NIH Director, Shirley Tilghman (Princeton) and Sally Rockey (NIH) co-Chairs http://acd.od.nih.gov/bwf.htm.
Olson, Steve, ed. (2014). The Importance of Engineering Talent to the Prosperity and Security of the Nation. Washington, DC: National Academies Press.
APPENDIX A1: NSF OCCUPATIONAL CODES USED
Engineering Jobs
510820: Aeronautical/aerospace/astronautical engineers
520850: Chemical engineers
530860: Civil, including architectural/sanitary engineers
540870: Computer engineer - hardware
540890: Electrical and electronics engineers
550910: Industrial engineers
560940: Mechanical engineers
570830: Agricultural engineers
570840: Bioengineers or biomedical engineers
570900: Environmental engineers
570920: Marine engineers and naval architects
570930: Materials and metallurgical engineers
570950: Mining and geological engineers
570960: Nuclear engineers
570970: Petroleum engineers
570980: Sales engineers
570990: OTHER engineers 96
Also:
582800: Postsecondary Teachers: Engineering
Engineering Technologists/Technicians/Surveyors (Engineering-Related)
641000: Electrical, electronic, industrial, and mechanical technicians
641010: Drafting occupations, including computer drafting
641020: Surveying and mapping technicians
641030: OTHER engineering technologists and technicians
641040: Surveyors, cartographers, photogrammetrists
650810: Architects
Computer Occupations
110510: Computer & information scientists, research
110520: Computer network architect
110540: Computer support specialists
110550: Computer system analysts
110560: Database administrators
110570: Information security analysts
110580: Network and computer systems administrators
110590: Software developers - applications and systems software
110600: Web developers
110610: OTHER computer information science occupations
110880: Computer engineers - software
Also
182760: Postsecondary Teachers: Computer Science
Managers:
621430: Engineering managers
621420: Computer and information systems managers
711141: Top level managers, executives, administrators
711470: Other mid-level managers
Source: Master’s—IPEDS Completion Survey. PhD—Survey of Earned Doctorates.


