
1
Characteristics of Engineers and the Engineering Workforce
Engineering skills and knowledge are foundational to the innovation and technological development that drive long-term economic growth and help solve major societal challenges. Therefore it is important to understand the educational and career pathways of engineers who embody these skills and knowledge, and the evolving system of institutions, policies, markets, people, and other resources that together prepare, deploy, and replenish the nation’s stock of engineers.
This chapter begins with three definitions of the engineering labor force and describes the datasets used to characterize and measure the nation’s engineering workforce.1 This is followed by an examination of the educational background, demographics, occupational and sectoral distributions, specific work activities, and career pathways of engineers using the three definitions. The chapter then reviews the economic returns to an engineering degree, the dynamics of the engineering labor market, and major forces, including technological developments and globalization, that shape the market and with it the educational and career pathways of engineers.
DEFINING, MEASURING, AND CHARACTERIZING THE ENGINEERING LABOR FORCE
There are three overlapping ways to define and measure the nation’s engineering labor force:
- those working in relatively narrowly defined engineering occupations,
- those with engineering degrees,2 and
- those who apply on the job the skills and knowledge acquired through an engineering degree.
The occupational definition of an engineer captures some engineering degree holders as well as workers without an engineering degree who perform certain job duties that define an engineering occupation, while excluding holders of engineering degrees working in “engineering-proximate” occupations, those that draw heavily on the specialized technical and professional knowledge and skills of engineering graduates, as well as “non-engineering”
___________________
1 Workforce is defined in this report as a subset of the labor force that includes only those who are employed. The labor force includes those in the workforce as well as working-age persons who are not employed but are looking for work.
2 In part due to the classification system used by federal datasets, the committee decided to define “engineering degrees” to include only degrees earned from traditional engineering programs and to exclude 4-year degrees in engineering technology, despite the similarities between the programs. Engineering technology degree holders are discussed in box 1.1.
occupations, those that draw on professional and more generic technical skills of engineering graduates. Defining an engineer in terms of degree earned implies that an engineer remains an engineer throughout his or her career, regardless of occupation or whether specific technical or professional knowledge and skills associated with the degree are used on the job. The third definition, a subset of the second, encompasses those who have a degree in engineering and apply the technical and professional knowledge and skills acquired with that degree in their work, as evidenced either by the tasks they perform or by whether they say they use science, engineering, or mathematical knowledge from the degree on the job. The committee believes that these three definitions yield complementary insights into the educational and career pathways of engineers as well as the market (i.e., supply and demand) for engineering knowledge and skills.
Although engineering and computing are closely related, the discipline of computer science and computing occupations are defined as distinct from engineering by the statistical agencies that track graduation rates and employment and the report follows this categorization in the analyses. The project examined some aspects of career flexibility and pathways for those with computer science degrees and found similarities to the pathways of those with engineering degrees, but a full review of the pathway to a computing degree and then into the workforce is beyond the scope of the project.
Sources of Data to Identify Engineers
To examine these three definitions of the engineering labor force and their implications, the committee used data from two primary sources, both of which include bachelor’s degrees and higher, but not associate’s degrees. The first dataset consists of annual data on degrees awarded by discipline and citizenship (including foreign-born students) from the Integrated Postsecondary Education Data System (IPEDS) of the National Center for Education Statistics (http://nces.ed.gov/ipeds). IPEDS is a primary source for a variety of annual data—including rates of college enrollment and degree completion, and demographic characteristics of current students—for colleges and universities in the United States.
For data on degreed engineers in the labor force and those working in engineering occupations, the committee relied primarily on the NSF Scientists and Engineers Statistical Data System (SESTAT) and its National Survey of College Graduates (NSCG3) and Survey of Earned Doctorates (SED4). SESTAT was created to provide data for policy analysis and general research, particularly of the college-educated science and engineering (S&E5) labor force. It provides information on individuals educated or employed in S&E occupations or those related to S&E, as well as those educated or employed in non-S&E occupations.6 The NSCG is the core of SESTAT and is representative of the entire population of those with a bachelor’s degree residing in the United States when the sampling frame for the survey was established. The survey includes foreign-born workers and students with college degrees regardless of whether they were educated in the United States.7 It collects cross-section information every two to three years, with a subsample of respondents followed from one survey to the next, thus providing longitudinal data.
The committee used both IPEDS and NSCG to evaluate engineering degree holders because IPEDS data provide information on the number of new engineering graduates each year (a measure of flow into engineering) whereas the NSCG provides information on the total number of engineering degree holders in the labor force (a measure of the stock of engineers). To complement these data and create a fuller portrait of engineers in the labor
___________________
3https://nsf.gov/statistics/srvygrads. NSCG respondents choose the field of their degree from a list. It is then categorized as engineering or not based on standardized codes. The NSCG is conducted biennially by the US Census Bureau. The year of the referenced survey is indicated throughout this report.
4https://nsf.gov/statistics/srvydoctorates
5 According to the 2014 NSF Science and Engineering Indicators Report, page 3-8, “general terms, including science, technology, engineering, and mathematics (STEM), science and technology (S&T), and science, engineering, and technology (SET), are often used to designate the part of the labor force that works with S&E. These terms are broadly equivalent and have no standard definition.”
6www.nsf.gov/statistics/sestat/#sci_eng_definitions
7 The NSCG includes people not educated in the United States because the sample frame is pulled from the decennial census or the American Community Survey (ACS). It also includes people up to the age of 76, who may or may not still be in the labor force.
force, the committee also drew on peer-reviewed research (Kuehn and Salzman 2018) and data from the American Community Survey,8 US Census,9 Office of Personnel Management,10 and American Society for Engineering Education’s Survey of Engineering and Engineering Technology Programs.11
Engineers as Those Working in Engineering Occupations
The first definition of an engineer is based solely on narrowly defined occupational classifications. In the Standard Occupational Classification (SOC) System12 used by the National Science Foundation and Bureau of Labor Statistics, engineering occupations are defined by a set of job duties applied to particular areas of technology. For example, according to the SOC definition, aerospace engineers “[p]erform engineering duties in designing, constructing, and testing aircraft, missiles, and spacecraft. May conduct basic and applied research to evaluate adaptability of materials and equipment to aircraft design and manufacture. May recommend improvements in testing equipment and techniques.” And biomedical engineers “[a]pply knowledge of engineering, biology, and biomechanical principles to the design, development, and evaluation of biological and health systems and products, such as artificial organs, prostheses, instrumentation, medical information systems, and health management and care delivery systems.”13
The NSF identifies 18 job categories as engineering occupations in its National Survey of College Graduates (table 1-1). As of 2015, there were 1.72 million college-educated individuals employed in engineering occupations (listed in appendix A1) in the United States. Just over half are in electrical, mechanical, or civil engineering occupations. The next largest groups of engineering occupations are aeronautical, chemical, environmental, computing, industrial, and sales engineers.
However, there is considerable ambiguity involved in NSF’s decisions about the categorization of some technically demanding occupations that employ significant numbers of degreed engineers. Perhaps most notably, NSF categorizes “computer engineers – hardware,” which in 2015 employed roughly 70,000, including 13,000 degreed computer scientists, as an engineering occupation, while categorizing “computer engineers – software,” which employed approximately 592,000 in 2015, including 194,000 degreed engineers, as a computing occupation.14 Similarly, those involved in the direct supervision of engineers engaged in technical engineering work (i.e., “engineering managers”)—roughly 362,000 in 2015 including 208,000 degreed engineers—are classified as working in “S&E management occupations.”15 In addition, the line between engineering occupations and what NSF calls “engineering-related” occupations (e.g., engineering technologists and technicians,16 listed in appendix A1) is not clear. Because of these ambiguities, this report refers to engineering occupations (those defined by the SOC), engineering-proximate occupations (those that draw heavily on the specialized technical and professional knowledge and skills of engineering graduates), and non-engineering occupations (those that draw on professional and more generic technical skills of engineering graduates).
___________________
8https://www.census.gov/programs-surveys/acs/. Also see the Hamilton Project (http://hamiltonproject.org).
9https://www.census.gov/2010census/data/
11https://www.asee.org/papers-and-publications/publications/college-profiles
13 For detailed descriptions of all 18 engineering occupations see US Department of Labor, Bureau of Labor Statistics, Occupational Outlook Handbook: https://www.bls.gov/ooh/architecture-and-engineering/home.htm.
14 It is worth noting that the occupation “computer engineers – software” was listed under engineering in the 2013 questionnaire but not in the occupation data proper.
15 In the 2000s, SESTAT gave managers in engineering a separate occupational code. However, NSF only includes as “engineering managers” lower-level managers directly supervising engineering, but does not include higher-level managers even if they worked in engineering companies supervising managers who in turn supervised engineers.
16 In most instances, individuals with 4-year engineering technology degrees are called technologists, while those with 2-year engineering technology degrees are called technicians, although several limitations exist. “First, federal employment data collection efforts sometimes use the term ‘technician’ and at other times ‘technician or technologist’ to describe work that might be done by those with either a 2- or 4-year degree. Second,…many of those with 4-year [engineering technology] degrees do not identify themselves as technologists. If asked in surveys, for instance, they may call themselves engineers or managers. Third, the term ‘technologist’ also does not seem to have much currency within industry, where the focus tends to be on the function an employee fulfills rather than the degree earned” (NAE 2017, p. 19).
TABLE 1-1 Number of college-educated people employed in NSF engineering occupations, 2015.
| NSF categories used for engineering occupations | Number employed |
|---|---|
| Aeronautical/aerospace/astronautical engineers | 96,000 |
| Agricultural engineers | 7,000 |
| Bioengineers/biomedical engineers | 26,000 |
| Chemical engineers | 80,000 |
| Civil, including architectural/sanitary engineers | 251,000 |
| Computer engineers – hardwarea | 70,000 |
| Electrical and electronics engineers | 290,000 |
| Environmental engineers | 66,000 |
| Industrial engineers | 82,000 |
| Marine engineers and naval architects | 12,000 |
| Materials and metallurgical engineers | 31,000 |
| Mechanical engineers | 337,000 |
| Mining and geological engineers | 5,000 |
| Nuclear engineers | 25,000 |
| Petroleum engineers | 19,000 |
| Sales engineersb | 90,000 |
| Engineers – all othersc | 178,000 |
| Postsecondary teachers: Engineering | 53,000 |
| Total | 1,718,000 |
Source: NSB, S&E Indicators, 2018.
a Consistent with the Standard Occupational Classification (SOC) System used by the National Science Foundation and Bureau of Labor Statistics, in the committee’s analysis the occupation “computer engineering – hardware” is included with engineering occupations and “computer engineering – software” is included with computing occupations. The number of people employed in computer engineering – software is 505,439.
b Defined in the SOC as those who “sell business goods or services, the selling of which requires a technical background equivalent to a baccalaureate degree in engineering.”
c Examples of occupations in this category are salvage engineer, photonics engineer, ordnance engineer, optical engineer (www.bls.gov/soc/2010/soc172199.htm). The category (code 17-2199 in the SOC System) is equivalent to “miscellaneous engineers” (code 1530) in the 2010 US Census Occupation Title classification system and “general engineering” (series 0801) as defined by the Office of Personnel Management.
Educational Background of Those in Engineering Occupations
The vast majority of those working in engineering occupations in the United States have bachelor’s or higher degrees in engineering from US colleges and universities. Others employed in engineering occupations are those who earned a US college degree in a field other than engineering, foreign-born workers who earned a degree outside the United States, and even a significant fraction with no college degree or less than a four-year college degree. Because workers without a college degree are excluded from the most useful national datasets on engineers and engineering occupations, they are not included in the committee’s analysis.17
The NSCG data show that in 2015 roughly 1.72 million college-educated individuals were employed in engineering occupations in the United States, accounting for 3.7 percent of all employed college-educated people in the US labor force that year. The data also show that 75 percent of those in engineering occupations have an engineering
___________________
17 The number of engineering workers who have no college degree or less than a four-year college degree can be measured using ACS data. Analysis of these data shows that there are workers in engineering occupations who either have an associate’s degree or have no college degree. They account for 12 percent of those in engineering occupations (Kuehn and Salzman 2018).
| Bachelor’s degree awarded in: | Percent |
|---|---|
| Non–science and engineering (S&E) fielda | 29% |
| S&E-related fieldb | 26% |
| Computing and mathematical sciences | 15% |
| Physical and related sciences | 13% |
| Biological sciences | 10% |
| Social and related sciences | 8% |
Source: NSF National Survey of College Graduates, 2015.
a These fields include business, the humanities, and education.
b This includes technology and technical fields, architecture, science or math teacher education, and health fields.
degree as their highest degree (BS, MS, or PhD), and just over 81 percent have at least one engineering degree, even if it is not their highest degree, meaning about 19 percent have no engineering degree at any level.
Of those employed in engineering occupations without an engineering degree (table 1-2), nearly half have a degree in science fields, most notably in the physical and related sciences (13 percent) and computing and mathematical sciences (15 percent), and about a quarter are degreed in S&E-related fields such as engineering technology (see box 1-1). The remaining 29 percent are from non-S&E fields, most of them from business administration with a small percentage from economics, humanities, and education. In fact, holders of business degrees represent 21 percent of those in engineering occupations without an engineering degree, a greater share than those with degrees in computing and mathematics or in the physical and related sciences.
Demographics of Those in Engineering Occupations
White and Asian males constitute the vast majority of those who work in engineering occupations (roughly 85 percent); women (of any race) account for about 15 percent (table 1-3). Three significant minority populations—African Americans, American Indians/Alaska Natives, and Hispanics of any race—together constitute roughly 23 percent of the nation’s population yet represent 11.5 percent of those employed in engineering occupations. Among persons in engineering occupations, 22 percent are foreign born, that is, they were born outside the United States and have become naturalized citizens, are permanent residents (they have a green card),18 or are temporary residents (they have a temporary visa such as the H-1B) (NSCG 2013).
As shown in table 1-3, some disciplines include higher percentages of women and minority engineers than others, although none of the disciplines have achieved either gender or racial/ethnic parity. However, some occupations (e.g., biological/biomedical and environmental) have increased gender diversity in recent years and will continue to do so as more diverse cohorts19 of engineers graduate and enter the workforce. It is also noteworthy that women account for 15.1 percent of postsecondary engineering educators and Asian Americans 30.2 percent, while African Americans and Hispanics of any race account for only 1.9 and 5.7 percent respectively. While this reflects the demographics of engineering PhD holders discussed below, it has implications for the ability of the nation’s engineering schools to attract and retain students from underrepresented populations (see chapter 3 for further discussion).
Finding: Although some disciplines have greater diversity than others, overall the US engineering workforce remains characterized by limited gender, ethnic, and racial diversity. White and Asian males dominate the
___________________
18 Both NSF and IPEDS datasets group naturalized citizens and permanent residents with US-born workers, while those on temporary visas are defined as foreign-born.
19 In 2014–2015, women earned 49.7% of bachelor’s degrees in environmental engineering and 40.9% of bachelor’s degrees in biological/biomedical engineering (Yoder 2015).
makeup of this workforce, while women, African Americans, American Indians/Alaska Natives, and Hispanics of any race remain significantly underrepresented.
Engineers as Those with a Degree in Engineering
The second definition of an engineer used in this analysis is a member of the labor force with a degree in engineering. According to NSCG data, in 2013 there were 4.3 million college-educated individuals with a bachelor’s or higher degree in engineering, of whom 3.7 million were in the labor force (i.e., employed or looking for work)—just over 8 percent of the college-educated labor force in the United States.20 This section presents data both on holders of engineering degrees overall and on holders of engineering degrees in the labor force. There has been more than a decade-long rise in the number of engineering degrees awarded annually at all levels (see box 1-2). Most
___________________
20 For measuring the size of the engineering labor force, these numbers include those who work part time and full time, and those who earned two or more bachelor’s degrees and marked the engineering degree as either their highest or other degree (either an earlier degree or a second major). A number of the survey questions concern the highest degree, so for later analysis those who listed engineering as a second or other degree were removed from the group.
TABLE 1-3 Demographics of those working in engineering occupations in the United States, 2015
| Male | Female | Asian | American Indian/Alaska Native | African American | Hispanic | Native Hawaiian or Pacific Islander | White | More than one race | |
|---|---|---|---|---|---|---|---|---|---|
|
All engineering occupations |
85.5% | 14.5% | 16.2% | 0.2% | 4.3% | 7.0% | 0.2% | 70.6% | 1.6% |
|
Aerospace |
87.5% | 12.5% | 12.5% | S | 2.1% | 11.5% | S | 70.8% | S |
|
Bio/Biomedical |
73.1% | 26.9% | 15.4% | S | 3.8% | 7.7% | S | 73.1% | S |
|
Chemical |
78.8% | 22.5% | 16.3% | S | S | 5.0% | 2.5% | 73.8% | 2.5% |
|
Civil |
80.5% | 19.5% | 14.7% | S | 4.4% | 8.0% | S | 70.1% | 2.0% |
|
Computer – hardware |
92.9% | 7.1% | 34.3% | S | 1.4% | 5.7% | S | 57.1% | S |
|
Electrical |
89.9% | 10.7% | 21.4% | S | 5.5% | 7.2% | 0.3% | 64.1% | 1.4% |
|
Environmental |
66.7% | 33.3% | 9.1% | S | 6.1% | 6.1% | S | 74.2% | S |
|
Industrial |
81.7% | 18.3% | 15.9% | S | 8.5% | 8.5% | S | 67.1% | S |
|
Materials |
83.9% | 16.1% | 9.7% | S | S | 6.5% | S | 74.2% | S |
|
Mechanical |
91.7% | 8.6% | 13.6% | S | 3.6% | 5.6% | 0.3% | 75.7% | 1.5% |
|
Petroleum |
89.5% | 10.5% | 15.8% | S | S | 5.3% | S | 73.7% | S |
|
Postsecondary education |
84.9% | 15.1% | 30.2% | S | 1.9% | 5.7% | S | 60.4% | S |
S = numbers have been suppressed by NSF because the populations are too small to report.
Source: NSCG 2015, https://www.nsf.gov/statistics/2018/nsb20181/data/appendix.
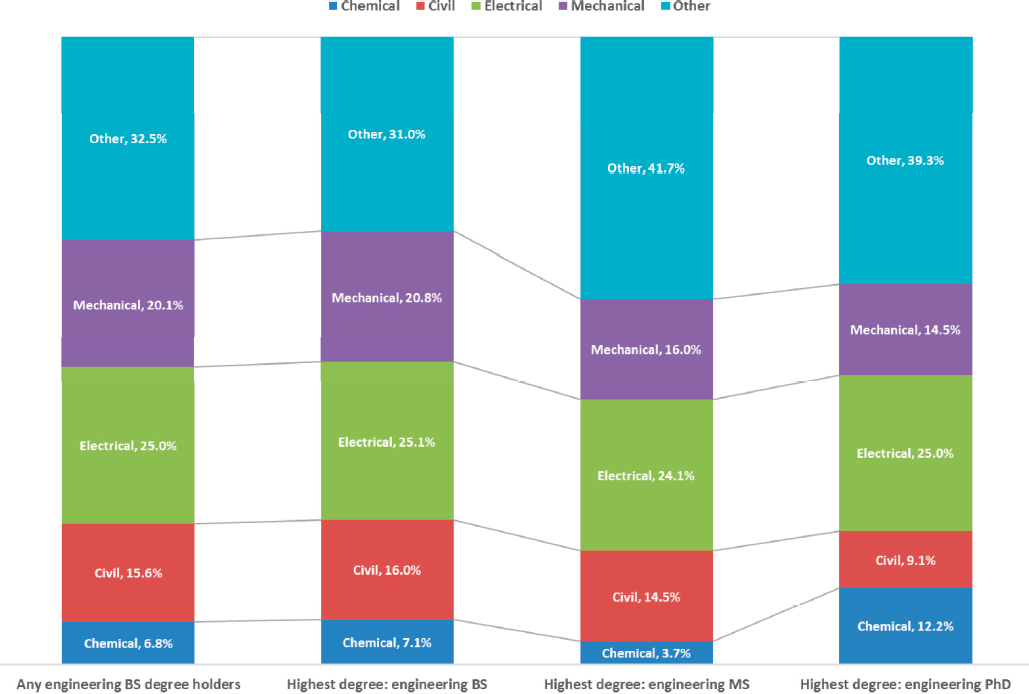
degreed engineers (93 percent) hold a bachelor’s degree in engineering (figure 1-1). When those with engineering bachelor’s or master’s degrees are counted together they account for 99 percent of degreed engineers.
Of those with a bachelor’s degree in engineering, for the majority (62 percent) this was their highest degree. Put another way, roughly 58 percent (2.5 million) of those educated as engineers (4.3 million) hold a bachelor’s degree as their highest degree; another 21.5 percent hold a master’s degree in engineering as their highest degree, and 4.5 percent hold a doctoral degree in engineering as their highest degree; the remaining 16 percent who graduated with either a BS or MS engineering degree earned their highest degree in a field other than engineering. While most MS engineers also earned a bachelor’s degree in engineering, a sizable fraction (16 percent, 164,114 people) hold a bachelor’s degree in a non-engineering field. Among engineering PhD holders most earned either a bachelor’s or master’s degree in engineering, although 19 percent hold at least one degree (bachelor’s, master’s, PhD, or professional degree) in a non-engineering field. Figure 1-1 presents a schematic of the major educational pathways for earning engineering degrees.
Engineering Degrees by Field
The fields of electrical and mechanical engineering award the largest shares of engineering degrees (figure 1-2), and from 2000 to 2013 the number of degrees awarded in mechanical, civil, and “other” engineering (a collection of less populous engineering disciplines, including industrial, biomedical, and materials science; appendix A) accounted for most of the growth in degrees awarded (with increases of 69 percent, 64 percent, and 71 percent, respectively) (figure 1-3; IPEDS). (The glossary in appendix B provides a brief description of various engineering disciplines.) This disciplinary distribution of engineering degrees differs only slightly from the makeup of all BS engineering degree holders in the workforce in 2013 (discussed below).
Source: IPEDS 2013.
Many degreed engineers who pursue degrees beyond the bachelor’s level combine their engineering degree with a non-engineering degree. NSCG data for BS engineering degree holders (older than 25 years21) show that over 40 percent have completed additional degrees beyond a bachelor’s. While the most common additional degree is an MS in engineering (40 percent), 30 percent went on to receive a master’s in a non-S&E field (often an MBA degree) as their highest degree (figure 1-4).
Demographics of Engineering Graduates
White and Asian men earned the vast majority of BS, MS, and PhD degrees in engineering in 2013, and have done so for decades, whereas women and most of the nation’s minority populations have long been severely underrepresented among engineering degree earners. At the same time, foreign-born students on temporary visas have earned a significant fraction of engineering degrees awarded by US institutions, particularly at the master’s and PhD levels, for several decades.
Although women earned 57 percent of all bachelor’s degrees and 60 percent of all master’s degrees awarded in the United States in 2012, they earned only 19 percent of BS engineering degrees and 23 percent of MS engineer-
___________________
21 The age restriction was used to account for the time needed to earn an additional degree.
Source: IPEDS 2013.
ing degrees awarded in 2013, and these percentages have been essentially flat since 2000 (figure 1-5; appendix A, figure A-5).22 Indeed, engineering awards far fewer bachelor’s and master’s degrees to women than any other field (appendix A). At the PhD level, the number of engineering degrees awarded to women has risen from 16 percent (2000) to 22 percent (2012) (Survey of Earned Doctorates), but is still much lower than the 41 percent of all science and engineering doctorates women earned in 2010 (SED 2010).
As in the case of engineering occupations, the representation of women among engineering degree holders varies by field (table 1-4). In 2013 women accounted for barely 12 percent of BS degrees earned in electrical and mechanical engineering, the two largest fields (Kuehn and Salzman 2018). By comparison, two of the smaller fields, biomedical and environmental engineering, have very high representation, about 39 percent and 45 percent respectively, and chemical, industrial, and materials engineering all have substantially higher levels than the 19 percent average for women in engineering generally. Although these differences could be related to the disciplines themselves, it is also the case that progress toward gender parity occurs more slowly in larger fields because more women need to enter the field each year to reach parity. In other words, while 4,500 women earning chemical engineering bachelor’s degrees achieves gender parity for that year, over 11,000 women must earn mechanical engineering bachelor’s degrees to reach parity. Similarly, 5,000 women earning chemical engineering degrees in one year
___________________
22 Unless otherwise indicated, these and other statistics and data about degrees earned are from IPEDS (http://nces.ed.gov/ipeds/).
Source: NSCG 2013.
represents about 2 percent of the total stock of chemical engineering BS degree holders (approximately 266,400 in 2013), but 5,000 women earning mechanical engineering degrees in one year represents less than 1 percent of the total stock of BS degree holders in that field (approximately 777,000 in 2013).
African Americans, American Indians/Alaska Natives, and Hispanics of any race also remain significantly underrepresented in engineering degree programs and among engineering degree holders. After an increase from 1993 to 2000, from 9.8 percent to 13.6 percent, the share of BS engineering degrees awarded to underrepresented minorities plateaued at about 13 percent, with a slight uptick to 14.4 percent in 2013 (table 1-5 and figure 1-6).23 On the other hand, the share of engineering master’s degrees earned by underrepresented minorities was 13.4 percent in 2013, up from 9.9 percent in 2000 and 6.5 percent in 1993. The share of engineering PhDs earned by underrepresented minorities was 9.6 percent in 2012, down from 10.4 percent in 2010 (the high since 2000) and up from 6.9 percent in 2000. Comparison of these numbers to the total US college degree population shows that the URM share of engineering degrees is 6–7 percent below their share of bachelor’s and master’s degrees in all subjects: In 2013 underrepresented minorities earned 21 percent of all bachelor’s degrees and 19.6 percent of all master’s degrees awarded in the United States (IPEDS).
Finding: The representation of women and other underrepresented groups in engineering has improved in some disciplines but remains well short of parity.
___________________
23 These percentages are of the total population of permanent US residents (temporary residents are not included nor is their race analyzed).
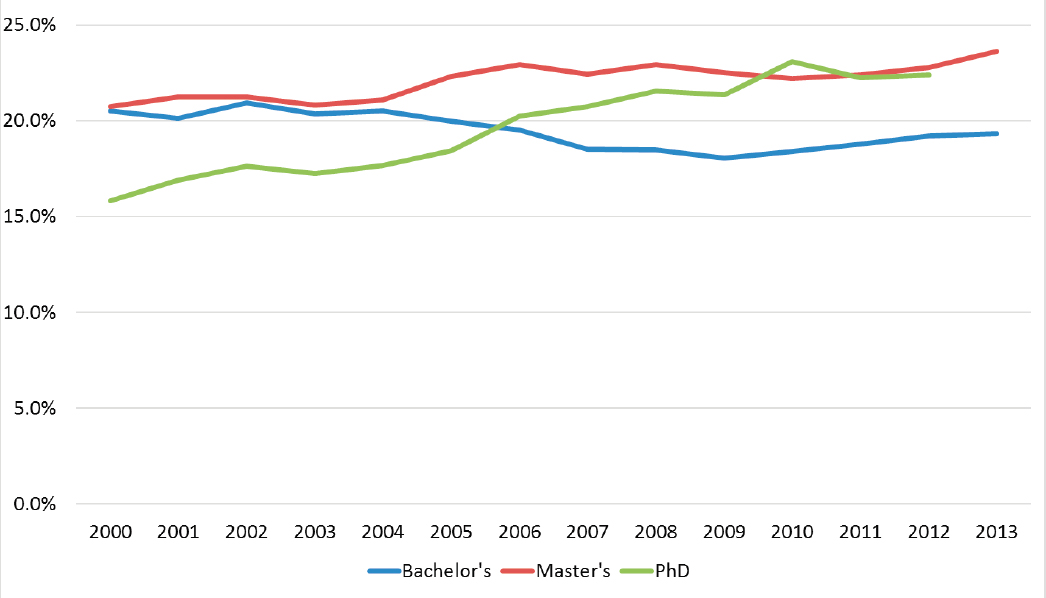
Sources: IPEDS Completion Survey 2000–2013, NSF Survey of Earned Doctorates 2000–2012.
TABLE 1-4 Share of women earning engineering bachelor’s degrees by field. Adapted from Kuehn and Salzman (2018).
| Engineering field | Total number of degrees | Female share of bachelor’s degrees |
|---|---|---|
| Mechanical | 22,267 | 11.99% |
| Electrical | 18,123 | 11.76% |
| Civil | 15,809 | 21.44% |
| Other | 12,497 | 24.11% |
| Biomedical | 38.93% | |
| Computer | 9.91% | |
| Environmental | 45.05% | |
| Chemical | 8,917 | 32.27% |
| Industrial | 4,747 | 29.77% |
| Aerospace | 3,490 | 13.72% |
| Materials | 1,436 | 29.76% |
| Total share of women among engineering BS degree earners | 87,286 | 19.36% |
Source: IPEDS 2013.
TABLE 1-5 Engineering bachelor’s degrees awarded by field and race, 2013. URM = underrepresented minority (African Americans, American Indians/Alaska Natives, and Hispanics of any race).
| Engineering field | Total number of degreesa | URM share of bachelor’s degrees |
|---|---|---|
| Mechanical | 21,010 | 13.0% |
| Electrical | 16,109 | 18.1% |
| Civil | 15,009 | 16.0% |
| Other | 11,811 | 10.6% |
| Chemical | 7,914 | 13.0% |
| Industrial | 4,163 | 19.1% |
| Aerospace | 3,217 | 12.1% |
| Materials | 1,316 | 8.4% |
| Total engineering BS degree earners | 80,549 | 14.4% |
Source: IPEDS 2013.
a The total of degrees earned excludes those earned by temporary residents because their race and ethnicity are not collected by IPEDS.
Sources: Bachelor’s and master’s degrees—IPEDS Completion Survey; PhDs—Survey of Earned Doctorates (2000–2012).
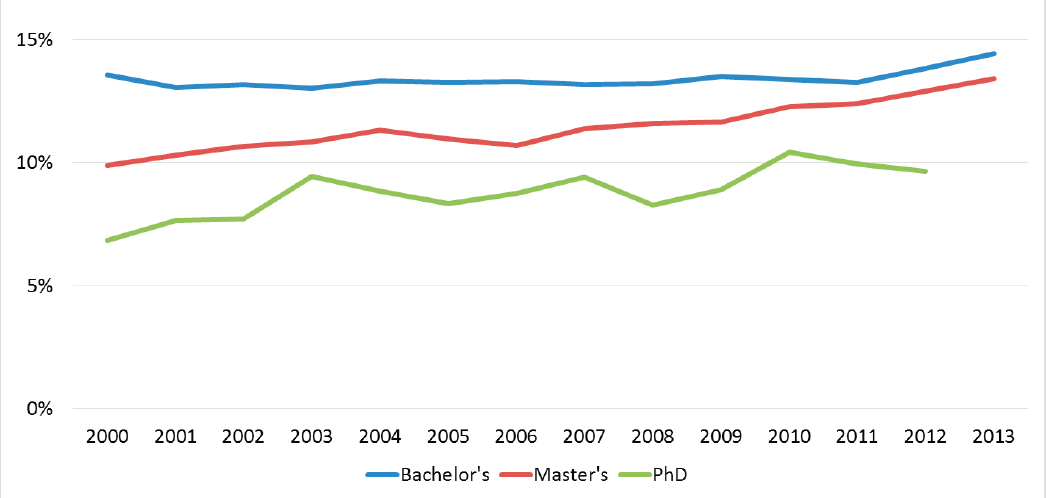
Another important aspect of engineering education in the United States is the number of degrees awarded to foreign-born students on temporary visas24 (“temporary residents”). In 1990–2013, an average of about 7 percent of the engineering bachelor’s degrees awarded each year went to temporary residents (figure 1-7)—double the 3.5 percent of all bachelor’s degrees awarded to temporary residents in 2012. And the proportion of engineering degrees awarded to temporary residents increases significantly with the level of the degree. Since 2001, approxi-
___________________
24 The IPEDS data categorize students according to three citizenship classifications: US citizen, foreign-born permanent resident, and foreign-born temporary resident. The committee’s analysis of foreign-born students focuses on only the temporary residents.
Sources: Bachelor’s and master’s degrees—IPEDS Completion Survey (2000–2013); PhD—Survey of Earned Doctorates (2000–2012).
mately 40 percent of engineering master’s degrees and more than half of engineering PhD degrees awarded each year have gone to temporary residents.
Occupational Distribution of Degreed Engineers
While degreed engineers account for over 80 percent of all workers employed in engineering occupations, nearly two thirds of degreed engineers work in engineering-proximate or non-engineering occupations: 65 percent of those employed with any engineering degree and 60 percent of those whose highest degree is in engineering. There are a wide variety of fields in which degreed engineers pursue careers in engineering-proximate or non-engineering occupations—not only other scientific disciplines but also management, health care, law, business, education, fine arts, sales, and service.
Table 1-6 shows that, after engineering occupations narrowly defined, management occupations associated with engineering are the next most common for those with a bachelor’s or master’s degree in engineering, followed by non-S&E nonmanagement occupations and computing occupations.
The occupational distribution of engineering graduates varies based on how long ago they earned their degree. The NSCG 2013 data show that a more recent graduate is more likely to be in an engineering occupation (45 percent of those with a BS in engineering and 49 percent of those with an MS in engineering) than graduates more than 10 years from their degree (33 percent of BS engineering graduates and 38 percent of MS engineering graduates). And conversely, 25 percent of those who earned a BS in engineering more than 10 years ago are in engineering
TABLE 1-6 Employed engineering bachelor’s or master’s degree holders by occupation. Management associated with engineering, computing, and engineering-related occupations are considered “engineering-proximate” occupations. S&E = science and engineering.
| % of employed degreed engineers working in: | Bachelor’s degree in engineering (%) | Master’s degree in engineering (%) |
|---|---|---|
| Engineeringa | 36 | 42 |
| Management associated with engineeringb | 21 | 18 |
| Non-S&E that is also not management | 15 | 11 |
| Computing | 15 | 17 |
| Engineering-relatedc | 6 | 5 |
| Management not associated with engineering | 3 | 2 |
| Other S&Ed | 4 | 5 |
| Total | 100 | 100 |
Source: NSCG 2013.
a Includes lower-level or first-line engineering managers that NSF includes in engineering occupations.
b Includes engineering-degreed workers in management occupations who report that the duties of their job require the technical expertise of a bachelor’s degree or higher in engineering, computer science, math, or the natural sciences.
c Includes architecture and engineering technician occupations.
d Excludes engineers, computer scientists, engineering-related, and management occupations.
management occupations, as opposed to only 10 percent of those who earned the degree less than 5 years ago (the numbers are comparable—22 percent and 11 percent, respectively—for those with a master’s degree in engineering).
Disciplinary Differences among Employed Degreed Engineers
For more than a decade the bachelor’s-degreed engineers produced each year have been primarily in electrical (21 percent in 2013) or mechanical engineering (26 percent in 2013) (IPEDS 2013), so it is not surprising that the NSCG data show a similar distribution among all degreed engineers in the workforce (figure 1-8). After electrical and mechanical engineering, the largest subdiscipline in the engineering bachelor’s-degreed workforce is civil (about 16 percent). Other disciplines, such as industrial, biomedical, and materials science, amount to about 33 percent of the engineering BS-degreed workforce. Figure 1-8 also shows that the percentage of people in the workforce in 2013 whose highest degree is in the “other” disciplines is higher at the master’s and PhD levels, likely because some of the fields included in this group, like biomedical engineering, often start at the graduate level.
Of the major disciplines, persons with an electrical or chemical engineering BS degree are less likely to be working in a narrowly defined engineering occupation (33 percent and 37 percent, respectively) than those with a BS degree in mechanical (45 percent) or civil (42 percent) engineering. And of the degree holders in these disciplines who are in an engineering occupation, those with a degree in chemical engineering are most likely to work in a subfield different from their degree, at 15 percent, followed by those with a BS in mechanical engineering (13 percent). In contrast, only 7 percent of the civil and electrical degree holders in engineering occupations work in a discipline other than that of their degree. At the same time, civil engineering degree holders are most likely to work in engineering management occupations (23 percent), whereas the shares of graduates of other subdisciplines range between 11 percent and 17 percent (NSCG 2013).
Occupational Differences among Men and Women Engineering Graduates
Several large-scale studies have examined gender-based differences in career pathways for engineering graduates. A study by the Society of Women Engineers (SWE; Frehill 2007) found some important differences. The society surveyed 4,490 male and 1,803 female engineers shortly after graduating and found that 58 percent of the men
Source: NSCG 2013.
were employed in engineering occupations compared to 48 percent of the women, and 18–20 years after graduation half of the men, but only a third of the women, were still in an engineering occupation. Chapter 3 looks at gender disparities in greater detail.
Employment of Degreed Engineers by Sector
The NSCG data show that 69 percent of persons with a BS in engineering work in for-profit companies and about 12 percent are self-employed (incorporated or unincorporated). Of the remaining 19 percent, about 14 percent work in the government at the federal or state level, 3 percent in education, and 2 percent in the nonprofit sector. Of those working in the for-profit sector, 32 percent worked for very large companies (more than 25,000 employees), 32 percent for large companies (1,000–25,000 employees), 18 percent for mid-sized firms (100–1,000 employees), and the rest (18 percent) for firms with fewer than 100 employees. This differs from college-educated workers generally, who are evenly split between for-profit and non-profit, but similarly spread among small, medium, and large firms.25 Entrepreneurship is a growing area of interest among engineering students and engineering educators (box 1-3), but these distinctions for economic sector are not able to reveal how many engineers are pursuing this path.
___________________
25 Data from the 2013 NSCG show that 44 percent of all college-educated workers are in large companies, 23 percent in medium-sized companies, and 33 percent in small companies. The data also show that 51 percent of college-educated workers are in for-profit companies.
Looking at the sectoral distribution of degreed engineers working exclusively in engineering occupations, 2013 data from the American Community Survey (ACS) show that two industry sectors employ the vast majority of these engineers: manufacturing (45 percent) and professional, science, and technical services (28 percent) (Kuehn and Salzman 2018). In the manufacturing sector, most of those in engineering occupations have an engineering bachelor’s degree in aerospace, chemical, industrial, mechanical, or materials engineering (Kuehn and Salzman 2018).
Government—largely at the federal level but also at state and local levels—is a direct employer of degreed engineers in engineering occupations (130,654 in 2013) as public employees, and an indirect employer of many more engineers (326,311) who work on government contracts, either part or full time, including engineers from other employment sectors (Kuehn and Salzman 2018). The combined populations of directly and indirectly (i.e., some work supported by government grants or contracts) employed government engineers amounted to 40 percent of all degreed engineers in engineering occupations in 2013 (Kuehn and Salzman 2018). Government will likely remain an influential component of the demand for specific types of engineers (e.g., aerospace, nuclear, and civil); demand for biomedical engineers both in and outside the government will be more specifically influenced by federal grant funding, particularly from the National Institutes of Health, and demand for civil and environmental engineers will be more specifically influenced by government infrastructure investments (Kuehn and Salzman 2018).
Demographics of the Degreed Engineering Workforce
White and Asian males constitute the vast majority of employed degreed engineers. White males constitute 38 percent of the US college-educated workforce, yet they account for 57 percent of employed engineering BS degree holders. Asian American males constitute only 4.5 percent of the US college-educated workforce but account for 17 percent of employed engineering BS degree holders (NSCG 2013).
Although women represented more than 19 percent of engineering graduates in 2012, and over half of the nation’s college-educated workforce in 2013, they accounted for only 15 percent of employed engineering BS degree holders in 2013. Three significant minority populations—African Americans, American Indians/Alaska Natives, and Hispanics of any race—together made up 15 percent of the college-educated workforce in 2013, and about 12 percent of employed engineering BS degree holders (NSCG 2013).
The demographics of engineering matriculation during the first year of undergraduate education make clear that the origins of engineering’s diversity challenge are to be found much earlier, in the precollege experience of students. Data gathered by the Higher Education Research Institution (HERI; https://heri.ucla.edu) on student
TABLE 1-7 Demographic comparison of those who started in engineering and completed a degree in engineering, completed a degree in a different area (STEM or non-STEM), or got no degree. STEM = science, technology, engineering, mathematics; URM = underrepresented minority (African Americans, American Indians/Alaska Natives, and Hispanics of any race).
| Gender | Race | |||
|---|---|---|---|---|
| Male | Female | White/Asian | URM | |
| First-year students aspiring to an engineering degree | 79.4% | 20.6% | 79.5% | 20.5% |
| Outcome after six years | ||||
| Engineering degree (n=16,298) | 82.0% | 18.0% | 90.0% | 10.0% |
| Other STEM degree (n=1,630) | 76.2% | 23.8% | 85.5% | 14.5% |
| Non-STEM degree (n=3,260) | 80.5% | 19.5% | 86.8% | 13.2% |
| No degree (n=6,193) | 88.8% | 11.2% | 68.3% | 31.7% |
Sources: 2004 Freshman Survey, Cooperative Institutional Research Program, Higher Education Research Institute, UCLA; National Student Clearinghouse, 2010.
Note: Total population N=27,381.
matriculation and degree completion in engineering show that White and Asian males represent nearly 80 percent of first-year students aspiring to earn an engineering degree (see appendix C).
The proportionately low matriculation rate of underrepresented minorities—who account for about 25 percent of the undergraduate student population (see appendix C)—may be partly a function of these groups’ lack of access to the higher-level secondary school math and science needed to enroll in undergraduate engineering. In addition, the inability of educators, families, and the broader engineering stakeholder community to attract or recruit precollege students to engineering has contributed to the underrepresentation of certain minorities and has been a leading cause of the underrepresentation of young women in first-year engineering (women represent over 50 percent of all undergraduate students).26 The precollege dimensions of the diversity challenge are discussed in chapter 3, but clearly engineering educators and schools of engineering at the nation’s colleges and universities have a critical role in raising awareness of and interest in engineering among female and URM precollege students, their families, and others who advise them.
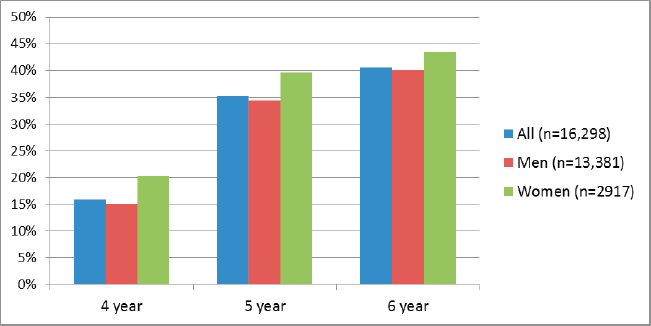
HERI data on first-year students who wish to earn an engineering degree show nearly identical percentages of women (20.6 percent) and underrepresented minorities (20.5 percent). Table 1-7 shows demographic comparisons of those who aspired to an engineering degree and completed it, left engineering for a degree in another field, or got no degree after six years. Almost one third of those who did not get a degree are underrepresented minorities. Women, in contrast, account for only 11 percent of those without a degree after six years.
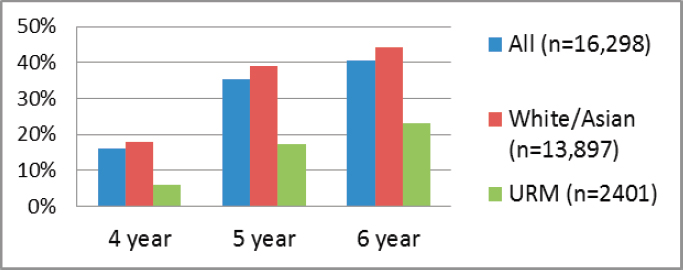
Thus although female and underrepresented minority students (partially overlapping populations) account for roughly 20 percent of students matriculating in engineering during their first year of college, their degree completion rates diverge significantly. In the HERI sample, overall engineering degree completion rates within six years of entering college hover around 40 percent (appendix C, figure C-13), which is similar to students in other majors (Ohland et al. 2008). Engineering degree completion rates for women were slightly higher than for men in years four, five, and six after matriculation (figure 1-9). However, given the initial disparity in the size of the male and female engineering student populations at the time of matriculation, women’s share of total engineering graduates had fallen to 18 percent in year six, 2.6 percentage points below their share at matriculation (table 1-7). By comparison, URM students (men and women) experienced engineering degree completion rates ranging from roughly a third to little more than half the rates of the White and Asian students over years four through six (figure 1-10) although they still earned only 10 percent of engineering degrees (table 1-7).
___________________
26 National Center for Educational Statistics (NCES), https://nces.ed.gov/fastfacts/display.asp?id=98.
Sources: 2004 Freshman Survey, Cooperative Institutional Research Program, Higher Education Research Institute, UCLA; National Student Clearinghouse, 2010.
Sources: 2004 Freshman Survey, Cooperative Institutional Research Program, Higher Education Research Institute, UCLA; National Student Clearinghouse, 2010.
Although women and minorities are underrepresented when considered as independent groups, when race and gender are examined together it becomes evident that female underrepresented minorities are grossly underrepresented both in the population of employed engineering bachelor’s degree holders in any occupation and among those working in engineering occupations with an engineering bachelor’s degree (tables 1-8 and 1-9). Furthermore, underrepresented minorities and women are better represented in the overall population of employed engineering bachelor’s degree holders than among those in narrowly defined engineering occupations, suggesting that underrepresented minorities and women are more likely to be working in non-engineering or engineering-proximate occupations than their male White and Asian counterparts.
These statistics show that much work needs to be done to improve the retention of underrepresented minorities in engineering and their graduation rate regardless of major. Chapter 3 explores many of the factors that contribute to low recruitment and retention of women and underrepresented minorities in engineering education and describes interventions to increase the diversity of engineering students as well as strategies to support students from all backgrounds throughout their education.
TABLE 1-8 Underrepresented minority (URM) employed bachelor’s degree holders by gender and field of bachelor’s degree. URM = African Americans, American Indians/Alaska Natives, and Hispanics of any race.
| Major | Male URM share | Female URM share | URM share | Female share |
|---|---|---|---|---|
| Engineering | 10.05% | 2.15% | 12.20% | 15.05% |
| Electrical and computera | 10.78% | 1.47% | 12.25% | 12.26% |
| Mechanical | 8.98% | 1.26% | 10.23% | 8.78% |
| Civil | 8.98% | 2.7% | 11.69% | 16.56% |
| College-degreed worker | 6.63% | 8.57% | 15.20% | 50.30% |
Source: NSCG 2013.
a The percentage may be slightly higher because the numbers for American Indians/Alaska Natives in electrical and computer engineering are not included (they were suppressed by NSF).
TABLE 1-9 Share of those in engineering occupations with a bachelor’s in engineering by race and gender. URM = underrepresented minority (African Americans, American Indians/Alaska Natives, and Hispanics of any race).
| Occupation | Male URM share | Female URM share | Total URM share | Total Female share | Size of occupation with BS in engineering |
|---|---|---|---|---|---|
| Engineering | 8.93% | 1.86% | 10.79% | 14.37% | 1,169,334 |
| Electrical and computera | 9.24% | 1.72% | 10.96% | 9.47% | 258,370 |
| Mechanical | 8.92% | 0.80% | 9.72% | 8.84% | 258,848 |
| Civil | 8.07% | 1.85% | 9.92% | 16.88% | 199,079 |
| College-degreed worker | 6.63% | 8.57% | 15.20% | 50.30% | |
Source: NSCG 2013.
a The percentage may be slightly higher because the numbers for American Indians/Alaska Natives in electrical and computer engineering are not included (they were suppressed by NSF).
Foreign-born workers with college degrees are overrepresented in the US engineering workforce compared to the general workforce.27 In 2013 the share of foreign-born engineering degree holders in the US workforce was 27 percent of those with a BS degree and 43 percent of those with an MS degree, and the share of foreign-born workers in engineering occupations was 22 percent, all of which are substantially higher than the 15 percent foreign-born share in the overall workforce that have a college degree (NSCG 2013).
Engineers as Both Degreed and Working in Engineering
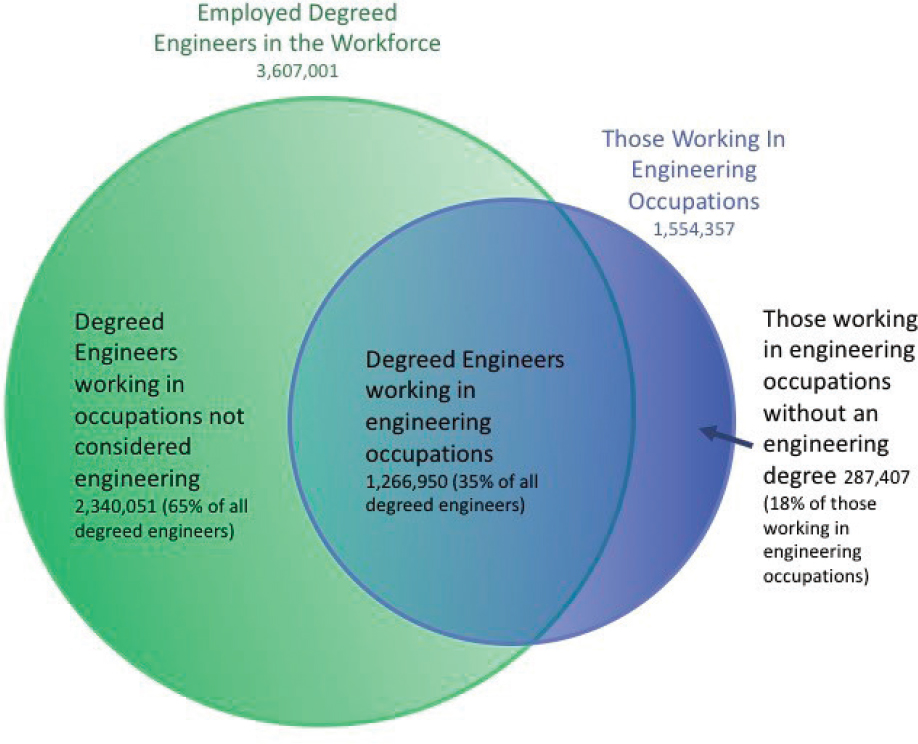
Figure 1-11 uses NSCG data to show the size of the employed US engineering labor force (i.e., the engineering workforce) in 2013 based on the educational and occupational definitions of the workforce as well as the overlap between them. There are 3.6 million employed people with an engineering degree (bachelor’s, master’s, or PhD), 1.55 million people working in engineering occupations regardless of degree, and 1.27 million people who have an
___________________
27 The majority of foreign-born workers are naturalized US citizens rather than permanent or temporary residents: for BS engineering degree holders 15.9 percent are naturalized, 6.6 percent are permanent, and 4.5 percent are temporary, while for workers in engineering occupations 13 percent are naturalized, 4 percent permanent, and 4.5 percent temporary.
Source: NSCG 2013.
engineering degree and work in an engineering occupation (NSCG 2013). The total number of degreed engineers is more than double the number of people employed in engineering occupations (NSCG 2013).
One might conclude from these data that a large fraction of degreed engineers are not using their degrees since they are not working in engineering occupations narrowly defined. However, a closer look at the skills and knowledge engineering graduates acquire in their formal education and the tasks they perform on the job points to a very different conclusion.
Degreed Engineers Using Engineering Knowledge and Skills on the Job
In 2000 ABET (formerly known as the Accreditation Board for Engineering and Technology), which accredits engineering education programs at most US schools of engineering as well as a multitude of engineering programs overseas, defined the following technical and professional skills and knowledge as essential for all BS engineering graduates28:
___________________
28 At the time this report was written, ABET was considering revisions to these criteria, but the changes had not been finalized. This report does not address the draft criteria.
- An ability to apply knowledge of mathematics, science, and engineering
- An ability to design and conduct experiments, as well as to analyze and interpret data
- An ability to design a system, component, or process to meet desired needs within realistic constraints such as economic, environmental, social, political, ethical, health and safety, manufacturability, and sustainability
- An ability to function on multidisciplinary teams
- An ability to identify, formulate, and solve engineering problems
- An understanding of professional and ethical responsibility
- An ability to communicate effectively
- The broad education necessary to understand the impact of engineering solutions in a global, economic, environmental, and societal context
- A recognition of the need for, and an ability to engage in, lifelong learning
- Knowledge of contemporary issues
- An ability to use the techniques, skills, and modern engineering tools necessary for engineering practice.
In addition, each accredited department/disciplinary field of engineering requires its graduates to master technical knowledge and skills that are unique to the discipline, although there are no program-specific criteria for accredited “general engineering” programs.
Given the breadth and depth of technical knowledge and skills and the associated portfolio of professional skills expected of engineering graduates when they enter the workforce, it seems unlikely that a graduate’s “engineering skills” would not be put to productive use in non-engineering occupations. Using NSCG data, there are several ways to assess the extent to which degreed engineers use their engineering skills and knowledge on the job; since many BS-degreed engineers get an MS degree and a few go on to get a PhD, all three degree groups are included for a fuller picture.
One way to assess degreed engineers’ use of their engineering skills in their work is to examine NSCG respondents’ answers to questions about how closely related their highest degree is to their occupation. For those whose highest degree is in engineering, a considerably higher share report that their work is closely related to their degree than report working in engineering occupations (table 1-10).
A second way is to exploit the NSCG questions on whether the duties of respondents’ jobs “require the technical expertise of a bachelor’s degree or higher in engineering, computer science, math, or the natural sciences.” Of those with an engineering degree as their highest degree, an overwhelming majority say that such technical expertise is needed for their job (table 1-10). As expected, the data also show that the connection between degree and occupation increases as the level of degree increases and the education becomes more specialized.
TABLE 1-10 Connection of engineering degree to occupation for workers with a degree in engineering. n/a = not applicable.
| Highest degree is a BS in engineering | Holds a BS in engineering | Highest degree is an MS in engineering | Holds an MS in engineering | Highest degree is a PhD in engineering | Holds a PhD in engineering | |
|---|---|---|---|---|---|---|
| Percentage who are in an engineering occupation | 38% | 36% | 43% | 42% | 51% | 51% |
| Percentage who report that their work is closely related to their highest degree | 54% | n/a | 63% | n/a | 72% | n/a |
| Percentage who report that a bachelor’s in science or engineering is needed for their job | 84% | 84% | 92% | 90% | 94% | 94% |
Source: NSCG 2013.
Finding: The vast majority of those formally trained in engineering work in occupations that draw heavily on their technical and professional engineering knowledge and skills. Their professional and problem-solving skills are also used in occupations with little connection to the more technical aspects of engineering. Engineers work in many different industries and across all sectors of society.
Answers to NSCG questions concerning respondents’ “primary work activities” and other work activities that occupy at least 10 percent of their time provide a third way of teasing out what those in engineering occupations really do, as well as whether those in non-engineering occupations actually do engineering-related work.
Fourteen work activities are presented to survey participants:
- Accounting, finance, contracts
- Basic research – study directed toward gaining scientific knowledge primarily for its own sake
- Applied research – study directed toward gaining scientific knowledge to meet a recognized need
- Development – use of knowledge gained from research for the production of materials, devices
- Design of equipment, processes, structures, models
- Computer programming, systems or applications development
- Human resources – including recruiting, personnel development, training
- Managing or supervising people or projects
- Production, operations, maintenance (e.g., chip production, operation of lab equipment)
- Professional services (e.g., health care, counseling, financial services, legal services)
- Sales, purchasing, marketing, customer service, public relations
- Quality or productivity management
- Teaching
- Other – Specify (respondents can write in a response)
Activities 3–6 and 12 (italicized) are commonly understood as engineering or engineering-related work and identified as such in the engineering degree accreditation criteria set forth by ABET. In addition, activity 2 (basic research) is often performed by PhD-level engineers, distinguishing them from BS- and MS-degreed engineers.
Building on analysis of these and other NSCG survey data, consultants to the study committee, Donna Ginther and Shu Kahn, calculated the aggregate share of those employed whose highest degree is in engineering and who are using their engineering knowledge and skills.29 Starting with those who work in an engineering occupation (narrowly defined), including first-line engineering managers (46.4 percent of the degreed engineers), they aggregate by adding those that:
- have an electrical engineering degree and work in computing occupations (bringing the total to 60.8 percent of degreed engineers);
- work in an engineering-related occupation (e.g., engineering technologists and technicians) (bringing the total to 65.4 percent);
- report that their job is closely related to their highest degree (bringing the total to 74.9 percent);
- work in a management occupation and report that their job requires a bachelor’s degree or higher in engineering, computer science, math, or the natural sciences30 (bringing the total to 80.6 percent);
- report that their primary or secondary job activity is one of the six engineering or engineering-related work activities on the NSCG list of 14 cited above (basic research, applied research, development, design, computing tasks, quality or productivity management) (bringing the total to 82.9 percent); and
___________________
29 Highest degree in engineering is used for the analysis because the NSCG asks about the connection between respondents’ highest degree and their occupation. As mentioned earlier, the Ginther and Kahn analysis excludes those who list engineering as their second major at the bachelor’s level. Because the data rely on classifications by highest degree, all three degree levels are included so as not to leave out BS- or MS-degreed engineers who have additional education.
30 Ginther and Kahn call this group “engineering managers,” which is different from the first-line managers that NSF also calls “engineering managers” and counts as an engineering occupation.
- report that their job is somewhat related to their highest degree (bringing the total to 89.3 percent).
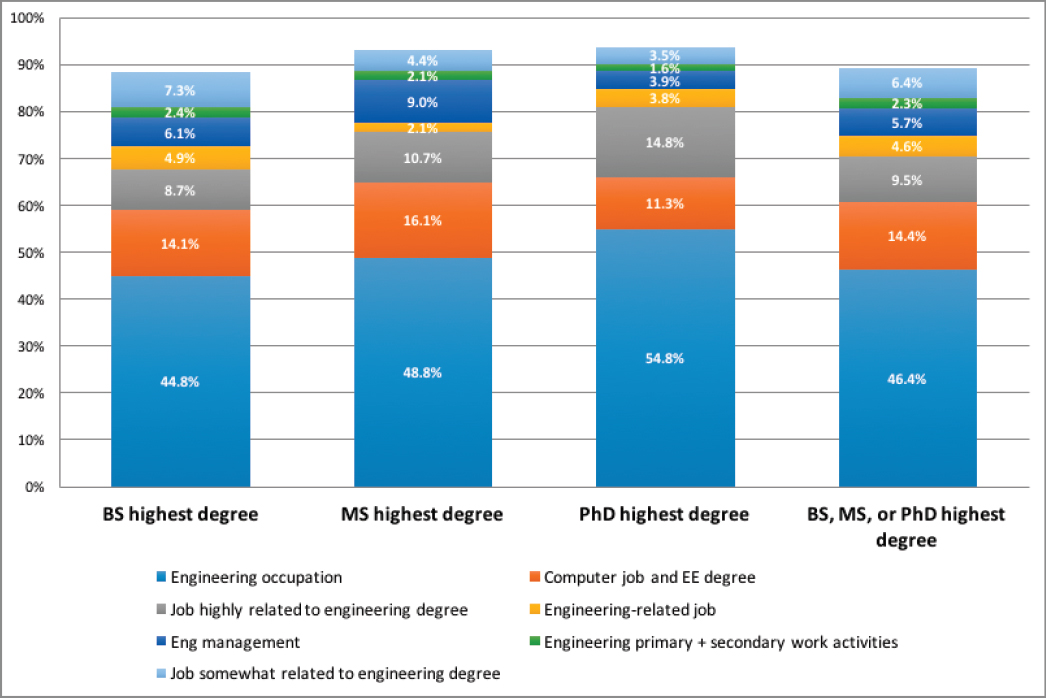
On the basis of this analysis, Ginther and Kahn conclude that the overwhelming majority (89 percent) of those employed whose highest degree is in engineering use their engineering knowledge and skills in their jobs (figure 1-12; also see appendix A and figure A-6).
WORK ACTIVITIES OF EMPLOYED ENGINEERS
Engineers by degree and occupation typically perform a significant variety of tasks requiring diverse skills in their jobs, ranging from management of people or projects to applied research, development, and design; and computer programming, production, and quality management (NSCG 2013). The NSCG questionnaire presents a list of work activities and asks respondents to indicate which ones occupied 10 percent or more of their work time, then to indicate which activity occupied the most time (“principal activity”) and which the second most time. The data show that time allocation for engineers differs only slightly depending on whether they are engineering BS degree holders, engineering BS degree holders in engineering occupations, or workers in engineering occupations regardless of degree.
Table 1-11 shows that management (defined as “managing or supervising people or projects”) and design (“of equipment, processes, structures, or models”) are the most common specific tasks for BS engineering degree holders and workers in engineering occupations. Engineering MS degree holders report performing very similar tasks to BS degree holders. In contrast, engineering PhD degree holders report that their most common principal activity is applied
Source: NSCG 2013.
TABLE 1-11 Activities most often performed by (1) bachelor’s-degreed engineers in any occupation, (2) bachelor’s-degreed engineers in engineering occupations, and (3) workers in engineering occupations with or without an engineering degree. Percentages are of the population in each column.
| BS-degreed engineers in any occupation | BS-degreed engineers in engineering occupations | Workers in engineering occupations, with or without an engineering degree | |
|---|---|---|---|
| Report that their principal activity is: | |||
| Most common | Othera (28%) | Design (27%) | Design (25%) |
| Second most common | Management (26%) | Management (21%) | Other (22%) |
| Third most common | Design (13%) | Other (19%) | Management (20%) |
| Fourth most common | Computing (13%) | Development (12%) | Development (12%) |
| Fifth most common | Development (7%) | Applied research (8%) | Applied research (9%) |
| Sixth most common | Applied research (5%) | Computing (6%) | Computing (5%) |
| Report that it takes up to a tenth of their time: | |||
| Most common | Management (66%) | Design (69%) | Design (66%) |
| Second most common | Design (49%) | Management (65%) | Management (64%) |
| Third most common | Development (41%) | Development (53%) | Development (52%) |
| Fourth most common | Applied research (37%) | Applied research (47%) | Applied research (48%) |
| Fifth most common | Quality or productivity | Quality or productivity | Quality or productivity |
| management (36%) | management (36%) | management (35%) | |
| Sixth most common | Computing (33%) | Computing (29%) | Computing (29%) |
Source: NSCG 2013
a This category is defined by the individual respondent.
research; however, almost two thirds of these PhDs indicate that management and design occupy at least 10 percent of their time. Across all categories of engineers, management and design appear to be signature work activities.
Aside from management and design, engineers perform many other activities for at least a tenth of their time. Among BS degree holders, 41 percent reported spending 10 percent or more of their time performing “development” tasks (“using knowledge gained from research for the production of materials, devices”), and more than 30 percent reported spending at least that much of their time on tasks in the following areas: “applied research”; “computer programming, systems or application development”; and “quality or productivity management.” For those in engineering occupations (with or without an engineering degree), the activities most likely to occupy at least a tenth of their time were design, management, development, and applied research, each listed by about half of the respondents. This diversity of tasks places a premium on both the professional and technical skills of engineers and their ability to continue learning over their lifetime.
Finding: Engineers typically perform a variety of tasks in their jobs—management of people or projects; development and design; and computer programming, production, and quality management. Management is a major component of engineering work, as are computing and the design of equipment, processes, structures, and/or physical or computational models.
CAREER PATHWAYS OF ENGINEERING GRADUATES
Engineering graduates demonstrate considerable ease of movement into and out of engineering occupations. A number of factors affect whether a person with an engineering degree enters and/or remains employed in an engineering occupation, and these factors can vary for different populations such as women and underrepresented
minorities (as discussed in chapter 3). This section examines longitudinal NSCG panel data to characterize the career pathways of BS and MS engineers. The data follow two cohorts of engineering bachelor’s or master’s degree holders over a 5-year period, one near the start of their career (1–7 years after earning their bachelor’s degree) and the other a further 11 years into their career (12–17 years after earning their bachelor’s degree).
Changes in Career Pathways for Individuals in Early and Mid-Career Cohorts
The longitudinal aspect of the NSCG data makes it possible to examine the occupational distribution of each cohort in both 2003 and 2008 (after 2008, data may exhibit atypical effects from the Great Recession). The first cohort includes those who received their BS degree in 1996–2002 (table 1-12); the second cohort is further along in their career, having received their BS degree in 1986–1993 (table 1-13). Both cohorts have an engineering bachelor’s or master’s degree, and the latter had to have been earned before 2003. These cohorts and data enable analysis of actions at different career stages.
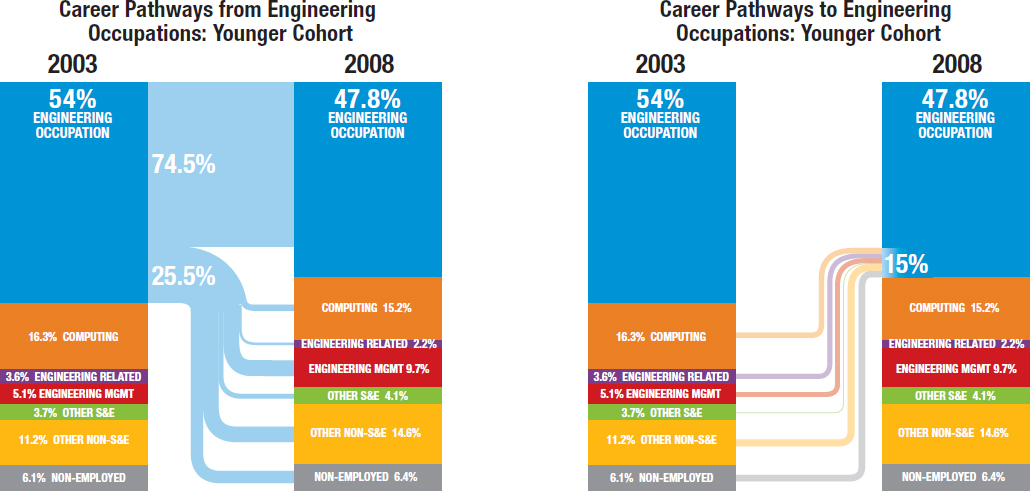
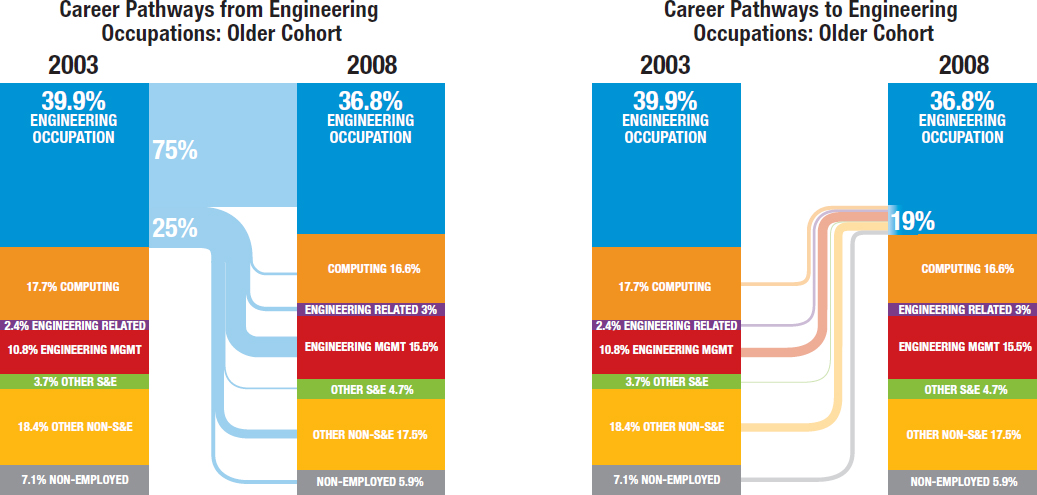
The data reveal that there is considerable mobility across engineering, engineering-proximate, and non-engineering occupations, particularly among the younger cohort.
- Working in engineering: For both cohorts, three quarters of the degree holders that were working in engineering occupations in 2003 were still working in engineering occupations five years later.
- Moving from a non-engineering or engineering-proximate to an engineering occupation: Among both cohorts, but more so for the younger group, there was considerable movement into engineering occupations from engineering-proximate occupations. For instance, in the younger cohort (table 1-12) 23.2 percent of those who were working in engineering management in 2003 moved into an engineering occupation by 2008 (20.9 percent for the older cohort; table 1-13) and 32.5 percent of those who started in an engineering-related occupation moved to an engineering occupation (24.7 percent for the older cohort). There was also some movement from non-engineering to engineering occupations: 15.0 percent of those who started in non-S&E jobs moved to an engineering occupation (11.1 percent for the older cohort). However, it was uncommon for those in other S&E occupations to move into engineering occupations—for both cohorts only about 6 percent did so, although the younger cohort had some movement from other S&E to engineering-proximate occupations like computing (12.6 percent) or engineering management (14.6 percent).
- Moving from an engineering to an engineering-proximate or non-engineering occupation: Among those who moved from engineering to occupations not labeled as engineering, most went into engineering management. More mature workers were more likely than younger workers to transition to management positions associated with engineering or computing (12.5 percent for older vs. 7.1 percent for younger) and younger workers were equally likely to move from engineering to non-S&E occupations (7.1 percent).
- Starting in engineering management: Mature workers who started in engineering management were most likely to remain there (49.7 percent) or take an engineering job (20.9 percent), whereas younger workers who were working in engineering management in 2003 were largely split between staying (34.8 percent), moving to a non-S&E job (36.7 percent), and switching to an engineering job (23.2 percent).
- Starting in an engineering-related occupation: A member of the younger cohort who started in an engineering-related occupation was as likely to be in an engineering occupation 5 years later as to remain in an engineering-related occupation (about a third in each case). This was not so for the older workers, who were more likely to stay in an engineering-related occupation (46.2 percent) than to move to an engineering occupation (24.7 percent). It appears that, for many younger workers, work in an “engineering-related” occupation is an entry-level stepping stone to an engineering occupation.
- Starting in a non-S&E occupation: There is “field persistence” for those who began in other (non-engineering management) non-S&E occupations: 59.3 percent of the younger workers were still in that category 5 years later, whereas a smaller but notable number (15 percent) had moved into engineering occupations. This persistence was even stronger in the older cohort, with 61.6 percent staying in non-S&E occupations; if they left that job category, slightly more went into engineering management (13 percent) than into engineering jobs (11.1 percent).
TABLE 1-12 Where engineering bachelor’s graduates from 1996–2002 were working in 2003 (time 1) and 2008 (time 2). Each row sums to 100 percent.
| Occupation they started working in, 2003: | Occupation in 2008 (time 2): | ||||||
|---|---|---|---|---|---|---|---|
| Engineering-proximate | Non-engineering | ||||||
| Engineering | Computing | Engineering-related | Management with engineering or computers | Other S&E | Other non-S&E | Non-employeda | |
| Engineering | 74.5% | 2.8% | 1.1% | 7.1% | 2.0% | 7.1% | 5.5% |
| Computing | 7.8% | 70.2% | 0.4% | 8.7% | 1.2% | 6.4% | 5.2% |
| Engineering-related (e.g., engineering technician, architect) | 32.5% | 0.0% | 32.6% | 16.3% | 0.8% | 11.4% | 6.6% |
| Management associated with engineering or computers | 23.2% | 3.5% | 0.0% | 34.8% | 1.8% | 36.7% | 0.0% |
| Other S&E | 6.4% | 12.6% | 0.0% | 14.6% | 37.8% | 12.4% | 16.2% |
| Other non-S&E | 15.0% | 2.8% | 0.9% | 10.1% | 7.2% | 59.3% | 4.6% |
| Non-employed | 26.4% | 21.1% | 3.4% | 8.1% | 9.0% | 10.8% | 21.3% |
| TOTAL from the whole cohort that ended up in each column in time 2 | 47.8% | 15.2% | 2.2% | 9.7% | 4.1% | 14.6% | 6.4% |
Source: NSCG 2013.
a “Non-employed” refers to persons who are unemployed (not working but looking for work) and those who are out of the labor force (not working and not looking for work).
The data in tables 1-12 and 1-13 show that as people get farther from graduation and deeper into their careers, the migration out of engineering occupations is greater than into them, and most of this migration is into management and other non-S&E work (figure 1-13). For the younger cohort, in 2003, 54 percent were in engineering occupations and 5.1 percent in engineering management occupations, and five years later 47.8 percent were in an engineering occupation and 9.7 percent in engineering management. The same trend is seen in the older cohort: in 2003, 39.9 percent were in engineering occupations and 10.8 percent were in engineering management, and five years later 36.8 percent were in engineering occupations and 15.5 percent in engineering management (figure 1-14).
These results show that skills are more transferable across occupations than occupational titles indicate and that movement across engineering, engineering-proximate, and non-engineering occupations is not unidirectional.
THE ECONOMIC RETURNS TO AN ENGINEERING DEGREE
Salary and Lifetime Earnings
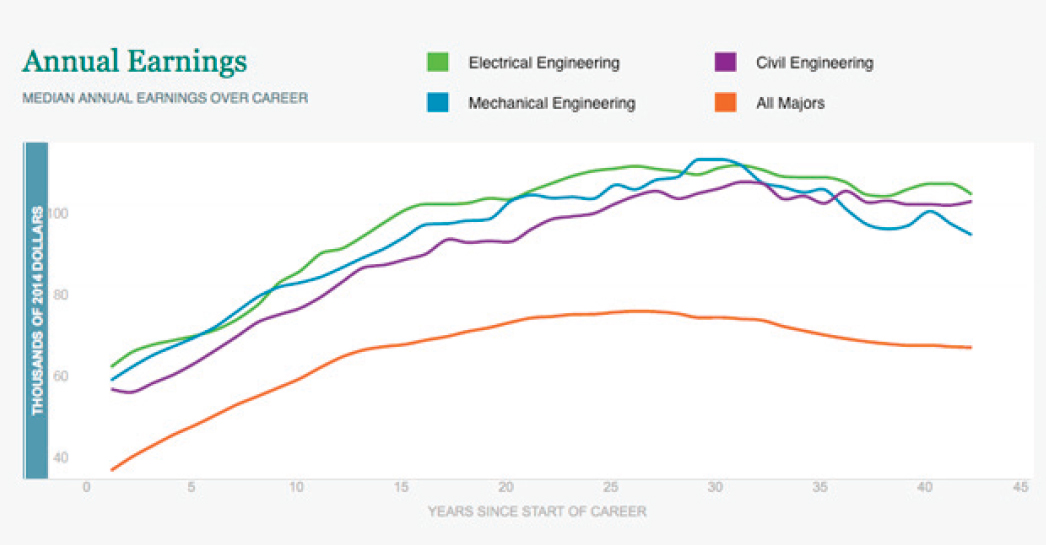
Workers with engineering degrees generally receive comparatively high lifetime earnings (Hershbein and Kearney 2014). Data from the 2009–2013 American Community Surveys show that, in the first year of their career (the sample includes those who go on to obtain a graduate degree), the median annual earnings of holders of bachelor’s degrees in electrical, mechanical, or civil engineering are $60,000, $57,000, and $54,000 respectively,31
___________________
31 Career earnings by college major can be graphed at the Hamilton Project website (http://hamiltonproject.org/earnings_by_major). The salary data are for all degreed engineers, working in engineering, engineering-proximate, and non-engineering occupations. Salary data presented here are for full-time workers only and are calculated in 2014 dollars.
TABLE 1-13 Where engineering bachelor’s graduates from 1986–1993 were working in 2003 (time 1) and 2008 (time 2). Each row sums to 100 percent.
| Occupation they started working in 2003 | Occupation in 2008 (time 2): | ||||||
|---|---|---|---|---|---|---|---|
| Engineering-proximate | Non-engineering | ||||||
| Engineering | Computing | Engineering-related | Management with engineering or computers | Other S&E | Other non-S&E | Non-employeda | |
| Engineering | 75.0% | 1.4% | 2.4% | 12.5% | 1.1% | 5.3% | 2.3% |
| Computing | 5.2% | 77.5% | 0.4% | 9.4% | 1.1% | 3.5% | 2.9% |
| Engineering-related (e.g., engineering technician, architect) | 24.7% | 8.9% | 46.2% | 2.0% | 1.0% | 6.0% | 11.4% |
| Management associated with engineering or computers | 20.9% | 4.2% | 2.5% | 49.7% | 4.4% | 16.6% | 1.8% |
| Other S&E | 6.5% | 1.2% | 0.5% | 8.5% | 63.0% | 16.3% | 3.9% |
| Other non-S&E | 11.1% | 2.3% | 0.8% | 13.0% | 4.9% | 61.6% | 6.4% |
| Non-employed | 13.7% | 13.4% | 6.9% | 2.4% | 5.2% | 20.1% | 38.3% |
| TOTAL from the whole cohort that ended up in each column in time 2 | 36.8% | 16.6% | 3.0% | 15.5% | 4.7% | 17.5% | 5.9% |
Source: NSCG 2013.
a “Non-employed” refers to persons who are unemployed (not working but looking for work) and those who are out of the labor force (not working and not looking for work).
compared to $35,000 for new graduates of all majors combined (figure 1-15). After 20 years, the median earnings are $101,000, $100,000, and $91,000 for the engineering majors, respectively, compared to a median of $71,000 for all other graduates with other majors.
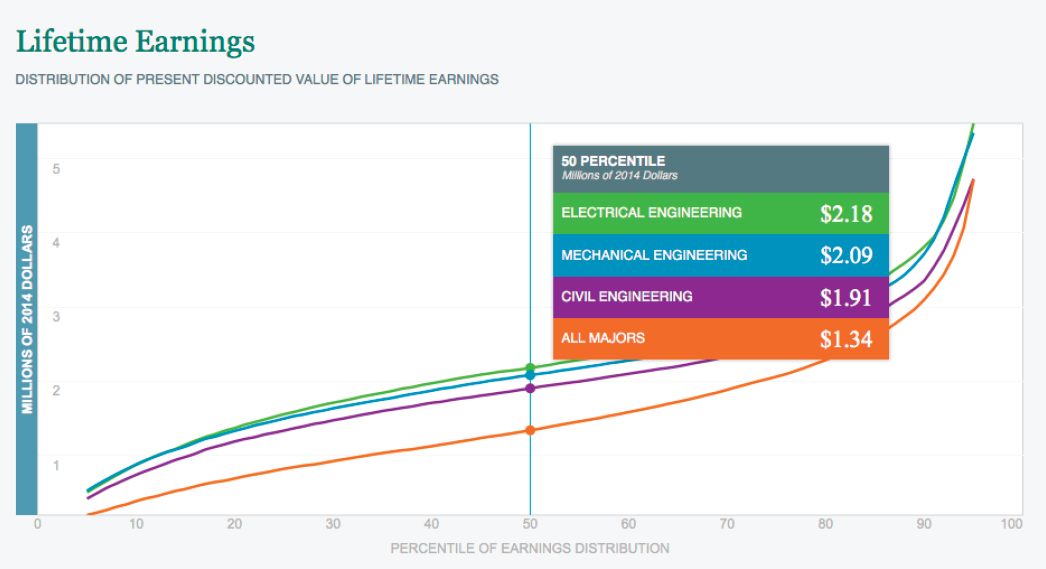
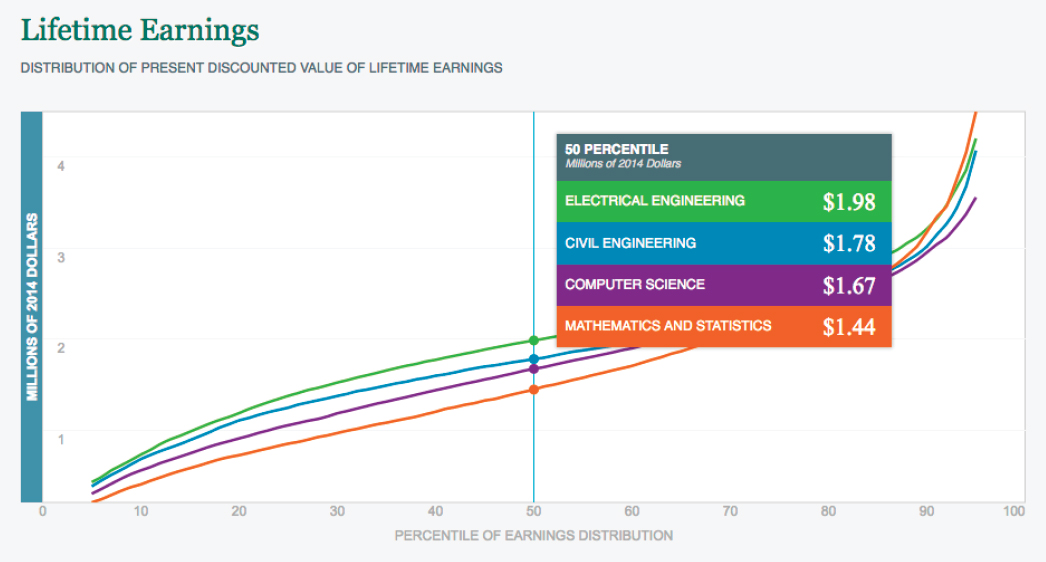
The median lifetime earnings for those working full time, as calculated on the Brookings Institution’s Hamilton Project (with later years’ earnings discounted to take into account the shorter duration of their investment) are $2.18 million, $2.09 million, and $1.91 million respectively for the three engineering degrees, versus $1.34 million for all other majors, and the lifetime earnings of the engineers exceed those of all other graduates combined at every percentile of the distribution (figure 1-16). The median lifetime earnings of computer science and mathematics majors are slightly lower than those of electrical, mechanical, and civil engineers but still higher than the median of all other majors for those working full time (figure 1-17).
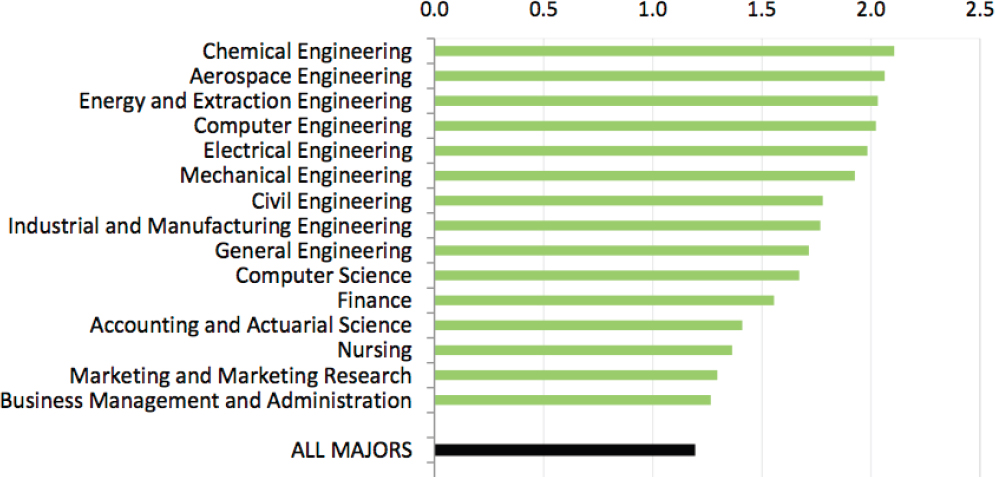
The top nine high-earning majors are all engineering; computer science is tenth and finance eleventh (figure 1-18; Hershbein and Kearney 2014). However, it is possible that engineering majors would have earned more than other graduates even had they studied something else, because “individuals with high math ability [as measured by math SAT scores] receive uniformly higher earnings regardless of their educational choices” (Arcidiacono 2004, p. 345; Arcidiacono et al. 2012). Since math ability is a key part of engineering education and work, many engineering students are likely to obtain financial rewards in their career regardless of whether they stay in engineering and to have higher earnings than students without strong math abilities.
It is important to note, however, that, although all engineering majors are high-earning compared to those in other fields, significant disparities exist in median annual and lifetime earnings by gender, race, and ethnicity. In 2009 the median annual earnings of female BS engineering graduates were 78 percent of male earnings, which has serious implications for lifetime earnings (AAUW 2015; Carnevale et al. 2011). NSF (2018) data based on
Source: NSCG 2013.
Source: NSCG 2013.
Source: http://hamiltonproject.org/earnings_by_major, accessed August 17, 2018.
Source: http://hamiltonproject.org/earnings_by_major, accessed August 17, 2018.
Source: http://hamiltonproject.org/earnings_by_major, accessed August 17, 2018.
Source: Hershbein and Kearney 2014, complete chart is available at www.hamiltonproject.org/assets/legacy/files/downloads_and_links/MajorDecisions-Figure_2a.pdf.
| Working in management with highest degree in: | Bachelor’s degree | Master’s degree |
|---|---|---|
| Engineering | $104,401 | $117,821 |
| Other S&E | $99,981 | $103,357 |
| Non-S&E | $87,546 | $111,585 |
Source: NSCG 2013.
occupation also show a disparity: in 2015 median earnings for women in engineering occupations were $88,000, roughly 93 percent the earnings of their male counterparts ($95,000). Similarly, the median annual earnings of BS engineering graduates from several major US ethnic and racial minority populations are significantly below those of Whites. In 2009, while Asian American BS engineers earned $72,000 or 90 percent of the earnings of Whites ($80,000), the median earnings of African Americans were 75 percent ($60,000), Hispanics 70 percent ($56,000), and other races32 71 percent ($57,000) (Carnevale et al. 2011). Contributing to this disparity is the fact that underrepresented minority students tend to pursue lower-paying engineering majors, such as those included in the “other engineer” occupation classification,33 rather than better-paying fields such as chemical or mechanical engineering (Carnevale et al. 2016). The implications of this disparity for these groups’ lifetime earnings potential should also be of serious concern.
NSCG data show that those with a bachelor’s or master’s degree in engineering as their highest degree34 are paid more on average—even when they work in a field other than engineering—than those with other educational backgrounds. For bachelor’s-degreed engineers in non-S&E occupations 10–15 years from their degree, the median wage in 2013 was $62,183, whereas the median wage for other S&E BS holders in such occupations was $45,647 and for non-S&E bachelor’s holders (which includes business majors and others specializing in non-S&E occupations) it was $54,441.
The same data reveal that average salaries in engineering occupations are higher than those in other S&E occupations and in non-S&E occupations (which are 13 percent and 37 percent lower respectively than in engineering occupations); but salaries in management occupations are the highest (5 percent higher than in engineering occupations). Even among those in management occupations, BS- and MS-degreed engineers are paid more than those with bachelor’s and master’s degrees in non-S&E or other S&E fields (table 1-14).
Unemployment Rate of Engineers
The unemployment rate of engineering degree holders is lower than that of other college-educated workers. The 2013 NSCG data show that only 2.9 percent of those with a bachelor’s degree in engineering reported being unemployed—about two-thirds the unemployment rate (4.3 percent) that year for all those in the labor force with a bachelor’s or higher degree. The unemployment rate for those with a master’s in engineering is slightly higher (3.2 percent) but still below the 3.5 percent unemployment rate for other college-educated workers with a master’s degree.
___________________
32 Defined by Carnevale et al. (2011) as “including Pacific Islanders and American Indians.”
33 Examples of occupations in this category are salvage engineer, photonics engineer, ordnance engineer, and optical engineer. Carnevale et al. (2016) use the term “general engineering” rather than “other engineering.” As noted earlier, “other engineering,” coded as 17-2199 in the Standard Occupational Classification System, is equivalent to “miscellaneous engineers” (code 1530) in the 2010 US Census Occupation Index and “general engineering” (series 801) as defined by the Office of Personnel Management.
34 This analysis was done using a population with engineering as their highest degree and 10–15 years from degree completion. The data thus reflect only the engineering degree, not another professional degree (such as an MBA, MD, or JD) that might influence earning power. The slightly older cohort was used to even the comparison with other fields that often necessitate graduate education before entering the labor force.
The unemployment rate is the same for men and women with bachelor’s degrees in engineering, but at the master’s level the rate for women is 5.4 percent compared to just 2.7 percent for men, and this pattern is roughly the same at the PhD level. Factors that may play a role in this difference are explored in chapter 3.
Finding: Engineering graduates working in engineering, engineering-proximate, and non-engineering-related occupations typically have higher career earnings than their peers with bachelor’s degrees in other fields, the lowest rate of unemployment (less than 3 percent) of all bachelor’s degree holders, and considerable career flexibility.
DYNAMICS OF THE ENGINEERING LABOR MARKET
Supply and Demand for Engineers in Engineering Occupations: Adjustments to Shocks
Recent history indicates that the engineering labor market adjusts to demand and supply shocks by changing salaries/wages and employment. There has been a certain number of abrupt changes in demand, which due to time lags in the response of supply (the production of engineering graduates) have led to cycles in salaries, raising periodic concerns over perceived “shortages” and “gluts.” The pattern of the engineering labor market’s adjustment to supply and demand shocks has been characterized by economists as the “cobweb effect” or following the “cobweb model” (Freeman 1976; see appendix D for details on the cobweb model). Following is a brief explanation of these “cobweb-like” market adjustments, and figure 1-19 shows a simplified cobweb model.
Student enrollments in engineering programs in any given year depend in part on the level of engineering salaries in the marketplace at the time of enrollment (i.e., salaries based on market conditions four years before the students’ graduation and entrance into the labor market). When demand for engineers suddenly rises, the market initially responds with a jump in engineering salaries to a wage above what will be the equilibrium wage when supply responds. This causes engineering enrollments to increase beyond what will eventually be warranted. Four years later the excessively expanded population of engineering graduates enters the labor market, causing engineering salaries to fall below what will eventually be the equilibrium wage. The lower salaries lead to lower enrollment rates, resulting in a decreased supply of engineering graduates four years later and a wage increase to a higher level than the eventual equilibrium wage. These cycles of adjustment to salaries and enrollments continue until a new long-term equilibrium is achieved or until a new shift in the market occurs. Plotted on a graph, these cycles of adjustments to supply and demand and corresponding adjustments in price/engineering salaries display a cobweb pattern as the market seeks a new equilibrium.
The cobweb effect in the engineering labor market was initially demonstrated by studies of the market’s response to the creation of NASA, which rapidly increased the demand for engineers and led to higher wages and higher employment for engineers, fed by increased enrollment in engineering degree programs (Freeman 1976; see also Ryoo and Rosen 2004). Cobweb cycles have also been demonstrated for electrical engineers and computer scientists over the period 1975–2006, with evidence that immigration accelerated more recent cycles (Bound et al. 2013). In the tech booms of the late 1970s and late 1990s, wages and enrollments jumped, with a four-year lag in the number of degrees awarded: those in computer science and electrical engineering35 combined rose 446 percent from 1975 to 1986, and 186 percent from 1995 to 2004 (Bound et al. 2013). Along with the smaller enrollment jump in the 1990s, however, the wage response was also more muted in the 1990s, changes that were ascribed to immigration.
Starting in the mid-2000s the oil and mining boom led first to a large increase in wages for petroleum engineers and then to a significant increase in enrollments in this discipline (Lynn et al. 2011; Teitelbaum 2014).36 Similarly, enrollment in science and engineering graduate programs is responsive to booms and busts in other areas of the economy (Bedard and Herman 2008). The expansion of the financial services industry, for example, increased
___________________
35 In the study by Bound et al. (2013), a computer science major is defined as a bachelor’s degree in computer and information sciences and an electrical engineering major is defined as a bachelor’s degree in electrical, electronic, and communication engineering.
36 Since 2014, however, a decline in commodity prices is resulting in a decrease in demand for engineers in these extractive industries.
Source: Adapted with permission from https://policonomics.com/cobweb-model/.
the demand for graduates with mathematical skills, increasing the wages and employment of engineering degree holders who entered finance occupations in increasing numbers (Shu 2013). Changes in military spending also shift demand for engineers.
These examples are of responses to sudden changes in the demand for engineers, but a rise in the supply of engineers can also occur, such as when access to tertiary education is expanded (e.g., through the establishment of new programs or schools, or the hiring of new faculty to accommodate more students), financial aid for engineering students grows, or immigration rules are liberalized. An expansion of supply increases the employment of engineers (not exclusively in engineering occupations), but would usually be expected to reduce wages (although any resulting innovation associated with the larger number of engineers employed might offset the wage decline).
The cobweb model is useful for explaining why, until the recent rise in skilled immigration, political economic discourse cycled between concerns about “shortages” and “gluts” as the market adjusted to shocks (Atkinson and Stewart 2013; Benderly 2013; Cappelli 2014; Salzman and Lynn 2010; Salzman 2013; Teitelbaum 2014). Employers say that they cannot hire or are having difficulty hiring enough qualified domestic engineers (Lee 2015; Rosen 2013; Rothwell 201437), but this may be driven by a desire to increase supply to influence wages, or it may depend on whether the definition of “enough” STEM workers is discussed in the context of quantity, quality, diversity, or some combination thereof (NSB 2015).
Tracking the Educational and Career Pathways of Engineers: Administrative and Survey Data
As the occupational distribution, work activities, and career pathways of engineering graduates make clear, the demand for engineering skills is much greater than that of engineering occupations alone. Yet national survey–based datasets provide only limited insight into the dynamics of the larger market for engineering skills and knowledge, its connections to the educational enterprise, and broader implications. Survey data provide only periodic snapshots of where the stock of engineering degree holders are employed, the tasks they perform, or the educational background and job tasks of those in various engineering occupations.
There is, however, an emerging opportunity to harness and integrate “administrative data.” Such data are collected by academic institutions, government agencies, and other organizations for purposes such as administrative recordkeeping, transactions, registration, and reporting. In combination with survey data, they can yield a
___________________
37 Also see the Manpower Group’s list of the Top 10 Hardest Jobs to Fill in 2015 (www.manpowergroup.us/campaigns/talent-shortage-2015/index.html) and the Indiana Chamber of Commerce 2014 Employer Survey Results (http://share.indianachamber.com/media/2014_Employer_Survey_Results.pdf).
deeper, more fine-grained understanding of the educational and career trajectories of engineering graduates and the relationship between engineering education, training, and workforce outcomes. In particular, they can shed light on engineering education migration patterns and student retention, engineering employment choices, engineering employment dynamics, and economic impacts of the engineering workforce.
Although the innovative use of administrative datasets offers a uniquely comprehensive approach to examining educational and career pathways, there are several challenges associated with their use. The datasets were not initially developed to be used in analysis, nor have most of them been structured in a manner that allows them to be integrated with other datasets, so combining datasets requires effort to ensure that all data are properly cleaned and matched. Furthermore, federal regulations have been set up to protect the privacy of individuals at multiple levels; protection of the data against unauthorized access or disclosure is the most significant challenge in the use of administrative data.
Aggregating datasets for research purposes is achievable, but requires a considered approach, resources to identify and integrate data, measures to provide data security and confidentiality, and cooperation between researchers and owners of the administrative data. The emergence and promise of administrative data are described in box 1-4 and appendix E.
Finding: Despite some challenges to implementation, administrative data can both supplement current survey data and offer a completely new source of data to provide a more complete picture of the career paths, education, and training of engineers.
MAJOR FORCES SHAPING DEMAND FOR ENGINEERING LABOR AND SKILLS
The following sections describe six major forces that influence the supply and demand for engineers and particular engineering skills: technological developments, changing societal priorities, expanding global trade, skilled immigration, growing engineering capacity in developing economies, and the globalization of engineering work.
Technological Development and Changing Societal Priorities
One factor that affects demand in all labor markets is technological development, which influences and is influenced by society’s priorities. The peculiarity of the engineering labor market is that it is the source of much technological development.
Technological developments lead to new products and services, change how some existing products and services are made or delivered, and destroy other products and services. Blockbuster new technologies can appear quickly, sharply increasing demand for specially trained engineers and at the same time potentially rendering obsolete existing technologies and knowledge. An environment of rapid technological change both alters the field of engineering and is likely to favor engineers, whose training better equips them to understand, shape, and apply new technologies than other workers. For example, a student who embarked on a career of refining vacuum tube technology likely had to master semiconductor technology at some point in his or her career to remain in the engineering workforce.
Likewise, evolving societal priorities regularly spur changes in the focus of engineering education and practice. Consider, for example, the rapid expansion of engineering employment and enrollment in response to Sputnik and the ensuing space/arms race with the Soviet Union, the birth and growth of environmental engineering in response to the nation’s environmental concerns of the late 1960s and early 1970s, and the more recent efforts by engineering schools and professional societies to advance specializations and training to address sustainability challenges (Bilec et al. 2007; Lucena 2005; Petroski 2010; Wisnioski 2012).
Technological developments are believed to have increased demand generally for highly skilled workers since 1979 (Lemieux 2008) and will likely continue to do so for the foreseeable future.38 The types of engineering skills in
___________________
38 In manufacturing, although increased automation has resulted in large productivity increases, absolute numbers of those employed in manufacturing have remained stable (Kuehn and Salzman 2018).
demand will change with technology, and engineers capable of innovating and learning new skills to meet changing societal priorities will be in particularly high demand. Advances in the life sciences and the rise of biotechnology, for example, have created the field of bioengineering, and the rise of information technology has increased the demand for computer engineers (hardware and software) and for engineers adept at computing, data mining, and analytics.
Finally, there are opportunity costs associated with not using the skills and talents of major parts of the US population—problems or opportunities not identified, products not built, designs not considered, constraints not understood, and processes not invented when the diversity of life experiences engaged in engineering is limited. Solving engineering problems requires consideration of the positive and negative aspects of as wide a variety of solutions as possible, and better outcomes are likely when individuals with diverse backgrounds and experiences contribute to both problem identification and the design and implementation of solutions.
Globalization and Other International Factors
Global Trade Growth
The rise of developing economies and the expansion of global trade are important factors in the supply and demand of engineers. US trade with developing countries has increased rapidly since 2000.39 International trade changes
___________________
39 Data are available at the World Trade Organization page on Trade and Development: https://www.wto.org/english/thewto_e/coher_e/mdg_e/development_e.htm.
the industrial composition of a country’s economy, allowing the country to focus on what it does best and hence maximize its income. In the case of the United States, this may have slowed manufacturing production and, if so, acted as a brake on the demand for engineers (Sachs et al. 1994).
Declines in transportation costs, communication costs, and trade barriers that have increased trade in goods and services have also expanded the offshoring of certain engineering tasks and permitted the creation of global supply chains. A salient example of offshoring has been the migration of the personal computing industry, especially laptop production, to Asia, starting with labor-intensive manufacturing and then moving to include testing activities and finally design and engineering (Pisano and Shih 2009). US-based firms, both big and small, also offshore engineering work in aerospace, automotive, civil, computer, industrial, mechanical, and software engineering (Kenney and Dossani 2005).
Yet many of the changes that facilitate the offshoring of work from the United States also promote US production of goods and services for global markets. For example, the United States is a net exporter of architectural, engineering, and construction services.40 The net effect of offshoring and onshoring on US demand for engineers is unclear.
Skilled Immigration
Another international factor that influences supply in the US engineering labor market is the growth in skilled immigration (i.e., immigrants with advanced skills and training, especially in technical fields) facilitated by changes in immigration policy, increased access to improved education in countries such as Korea, India, and China, and a relaxation of emigration from China. The changes abroad have also contributed to a rise in the number of foreign-born students at US universities, including in engineering (Ruiz 2013, IPEDS Completion Data). These developments benefit US universities and employers of engineers, who can choose from a larger pool of candidates; they also enable employers to avoid temporary spikes in engineering wages when demand rises suddenly (as described above), to dampen wages over the long term, or to hire foreign-born workers on temporary visas to address market demand increases.
Whether the wages of engineers are negatively affected over the longer term and whether the career choices of natives are affected by larger inflows of skilled immigrants has not been established conclusively (Bound et al. 2015; Orrenius and Zavodny 2015). On balance, the empirical literature discussed in box 1-5 suggests that skilled immigrants collectively increase innovation, which increases technological developments and growth in GDP per capita in the United States.41
Advances Abroad
Two final international factors that have gained widespread US attention are increases abroad in the number of engineering graduates and rising investment by developing countries in research and development (OECD 2008). The impacts of these developments on the US engineering labor market are not immediately apparent. One possible effect would be reduced skilled immigration to the United States, but there is as yet little evidence of this. In terms of the US economy as a whole, the net effect of foreign innovation is positive, as the United States benefits from foreign innovation as well as domestic: the global economy is not a fixed pie to be divided among countries. A narrowing of the US technological lead harms the United States only if the US capacity for innovation is harmed, for instance by reduced skilled immigration or even emigration.
___________________
40Export.com, Service Exports – High Growth, US Department of Commerce; available at https://www.export.gov/article?id=Service-Exports-with-High-Growth-Potential (accessed March 6, 2017). Data for trade in architectural, engineering, and construction services, which are components of other business services, are available from the Bureau of Economic Analysis, International Services Table 2.1, US Trade in Services, by Type of Services (https://www.bea.gov/iTable/iTableHtml.cfm?reqid=62&step=6&isuri=1&6221=0&6220=0&6210=4&6200=245&6224=&6223=&6222=&6230=1).
41 One caveat to this is that in recent years such growth has gone to firms and skilled workers rather than unskilled workers (https://www.epi.org/productivity-pay-gap/).
Globalization of Engineering Work
These international factors all arise from the trend toward a more globalized economy. This globalization influences the nature of engineering work through the development of global supply chains, the global exchange of ideas, and the global diffusion of technologies and applications—all of which affect both engineering work and the international job market and thus the career pathways and choices of engineers in the United States.
The fact that engineering pathways and the composition of the engineering workforce evolve in response to changes in the labor market and the underlying forces that shape it—be they technological, economic, societal, or institutional—is not new. Throughout history the knowledge, skills, and work of those trained as engineers have evolved continuously in response to changes in societal needs and advances in science and technology. Computer and software engineering and bioengineering are just the latest chapters being written. Engineering pathways are certain to continue to evolve. Even as some of these changes create challenges in the existing pathways, exciting new opportunities will emerge.
SUMMARY OBSERVATIONS
This chapter provides information about the size, demographics, and other characteristics of the nation’s engineering labor force, where degreed and nondegreed engineers work, what work they do, the variety of engineering careers/pathways they pursue, and the dynamics of the engineering labor market.
Defining and Counting Engineers
- There are three overlapping ways to define and measure the nation’s engineering workforce: (1) those who work in engineering occupations (1.55 million in 2013), (2) those with engineering degrees in the overall labor force (3.7 million in 2013), and (3) those who apply the skills and knowledge associated with their engineering degree on the job (3.2 million in 2013).
- More than 80 percent of those employed in engineering occupations have a degree in engineering. Of those in engineering occupations without such a degree, just over half are degreed in other science and engineering fields—computing and mathematics (14 percent), physical sciences (15 percent), biological sciences (10 percent), or social sciences (8 percent); a quarter have a degree in an S&E-related field such as engineering technology; and the remaining quarter have degrees in non-S&E fields, most in business.
- The vast majority (99 percent) of the nation’s 4.3 million degreed engineers hold either a bachelor’s or master’s degree in engineering. Roughly 58 percent of those educated as engineers hold only a bachelor’s degree; another 26 percent hold either a master’s or doctoral degree in engineering as their highest degree; and the remaining 16 percent who graduated with either a BS or MS engineering degree went on to earn their highest degree in a field other than engineering.
- Most advanced degree holders in engineering earn a BS or MS engineering degree on the path to their highest degree. But in 2013 at least 16 percent of those with an MS in engineering as their highest degree had a bachelor’s degree in a non-engineering field and 19 percent of engineering PhD holders earned at least one degree in a non-engineering field.
- There has been more than a decade-long significant rise in the number of engineering degrees awarded annually in the United States. From 2000 to 2013 the number of BS engineering degrees awarded each year increased 46 percent—more rapidly than that of all US bachelor’s degrees (41 percent), while that of engineering master’s degrees awarded annually grew 69 percent and doctoral degrees 58 percent over the same period.
- Almost twice as many degreed engineers work in non-engineering occupations (65 percent) as in engineering occupations narrowly defined (35 percent), and even among those whose highest degree is in engineering only 40 percent work in engineering occupations. Yet more than half of those whose highest degree is in engineering indicate that their job is closely related to their engineering degree, 84 percent say a bachelor’s degree in science or engineering is needed for their job, and an estimated 89 percent use their engineering skills and knowledge in their job.
- By any measure, engineers are a small but critically important fraction of the total college-educated labor force (engineering degree holders are 8 percent, and those in engineering occupations are 3.5 percent). It is therefore important to understand the composition, dynamics, and quality of the engineering labor force, how it is replenished, and how it can maintain its vibrancy and strength in the face of demographic challenges, advances in science and technology, globalization, and other forces.
Engineering’s Diversity Challenge
- White and Asian males constitute the vast majority of employed degreed engineers and those who work in engineering occupations. Women and most of the nation’s minority populations remain severely underrepresented among engineering degree earners and in the engineering workforce. Although women represent over half of the nation’s college-educated workforce, in 2013 they accounted for only 15 percent of both those working in engineering occupations and those with BS engineering degrees in the workforce. African Americans, American Indians/Alaska Natives, and Hispanics of any race together made up 15 percent
- of the college-educated workforce in 2013, but 11 percent of those employed in engineering occupations and about 12 percent of employed engineering BS degree holders.
- Significant disparities exist in median annual and lifetime earnings of BS engineering graduates by gender, race, and ethnicity. In 2009 the median annual earnings of female BS engineering graduates were 78 percent of male earnings, a discrepancy that has serious implications for lifetime earnings. Similarly, the median annual earnings of BS engineering graduates from several major US ethnic and racial minority populations are significantly below those of Whites. As of 2009, the median earnings of Asian American BS engineers were 90 percent of those of Whites ($80,000), while those of African Americans were only 75 percent, Hispanics 70 percent, and other races 71 percent.
- While women and minorities are underrepresented when considered as independent groups, when race and gender are examined together it becomes evident that women of underrepresented minorities are even more severely underrepresented in engineering.
- Although overall engineering students graduate with BS degrees at similar rates as students in other majors, disparities exist between gender and racial/ethnic groups, and underrepresented minority students are far less likely than White or Asian students to graduate with an engineering degree.
- Women and men have similar retention rates in undergraduate engineering degree programs, but women are also somewhat more likely than men to switch to another STEM field.
- Foreign students have long constituted a large share of US engineering school enrollments at the graduate level whereas the rapid growth of foreign student enrollments in undergraduate engineering programs is a more recent development. Less information has been collected and analyzed at the undergraduate level than at the graduate level on the drivers and composition of rising foreign student enrollment in engineering and its impacts on host institutions and on the educational and career choices as well as the engineering education experiences of domestic and foreign students.
Characteristics of Working Engineers
- As their distribution among engineering and non-engineering occupations suggests, engineering degree holders have considerable occupational mobility over their careers. Not only is there significant movement from engineering occupations into non-engineering occupations (particularly to engineering management and other non-S&E occupations), there is also movement from engineering-related and non-engineering occupations into engineering occupations. Overall, for both younger and older degree holders, more leave engineering occupations than move into them, resulting in fewer people working in engineering.
- Engineers by degree and occupation typically perform a variety of tasks in their jobs, ranging from management of people or projects to development and design, and computer programming, production, and quality management. This diversity of tasks places a premium on both their professional and technical skills and their ability to continue learning over their lifetime.
- Managing projects or supervising people is a major component of their work for all engineers whether defined by degree or occupation. Over 25 percent of BS engineering degree holders report that management is their principal task, and about two thirds of engineers defined by degree or occupation report spending at least 10 percent of their time on management.
- The design of equipment, processes, structures, and/or models is the principal task of 27 percent of BS-degreed engineers who work in engineering occupations and of 13 percent of employed BS engineering degree holders regardless of their occupation.
- Computing (“computer programming, systems or applications development”) figures prominently in the work life of engineering graduates and those in engineering occupations. It is the principal task of 13 percent of employed BS engineering degree holders, and takes up at least 10 percent of work time for roughly a third of engineering BS degree holders and 30 percent of those in engineering occupations. Moreover, 15 percent of engineering bachelor’s degree holders and 17 percent of engineering master’s degree holders (mostly electrical/electronics engineers) work in computing occupations.
- Nearly two thirds of employed engineering BS degree holders work in for-profit companies (concentrated in large and very large firms), 14 percent work in the government sector, roughly 12 percent are self-employed, and the rest are divided between education and the nonprofit sector.
Engineering Labor Market
- Labor markets for engineering occupations adjust to shocks. Demand is met primarily by degreed US engineers, but an additional supply is provided by individuals degreed in non-engineering fields and by foreign nationals (both permanent residents and those with temporary visas such as the H-1B) who have skills and knowledge needed in engineering occupations.
- BS engineering graduates on average have the highest annual compensation and lifelong earnings of all bachelor’s degree holders; the highest mean wages whether working in engineering, engineering-proximate, or non-engineering occupations; and the lowest unemployment rates of college degree holders. This is due, at least in part, to their versatility and occupational mobility, particularly their promotion into management occupations.
- Because nearly two thirds of degreed engineers (2.34 million) work in occupations not classified as engineering, analysis of periodic survey data based on the number of engineering occupations compared to the number of engineering graduates provides only a narrow perspective on the engineering labor market. There is an emerging opportunity to harness and integrate “administrative data,” which are collected by academic institutions, government agencies, and other organizations for purposes such as administrative recordkeeping, transactions, registration, and reporting. Complementing survey data, administrative data can yield a deeper, more fine-grained understanding of the educational and career trajectories of engineering graduates and the relationship between engineering education, training, and workforce outcomes.
- Multiple factors may be expected to influence the demand for and supply of engineers and particular engineering skills over the long term. These include technological developments, changing societal priorities, the expansion of global trade, the increase in skilled immigration, and increases in both engineering graduates abroad and investment by developing countries in research and development.
REFERENCES
AAUW [American Association of University Women]. 2015. Even in high-paying STEM fields, women are shortchanged. Career and Workplace blog, April 14. Washington. Available at www.aauw.org/2015/04/14/women-shortchanged-in-stem/.
Aghion P, Howitt P. 1992. A model of growth through creative destruction. Econometrica 60:323–351.
Arcidiacono P. 2004. Ability sorting and the returns to college major. Journal of Econometrics 121(1-2):343–375.
Arcidiacono P, Hotz VJ, Kang S. 2012. Modeling college major choices using elicited measures of expectations and counterfactuals. Journal of Econometrics 166(1):3–16.
Atkinson RD, Stewart LA. 2013. The Real Story on Guestworkers in the High-skill US Labor Market. Washington: Information Technology and Innovation Foundation.
Bedard K, Herman DA. 2008. Who goes to graduate/professional school? The importance of economic fluctuations, undergraduate field, and ability. Economics of Education Review 27(2):197–210.
Benderly BL. 2013. Boom or bubble? Prism 23(3):31–33.
Besterfield-Sacre M, Ozaltin NO, Shartrand A, Shuman LJ, Weilerstein P. 2011. Understanding the technical entrepreneurship landscape in engineering education. Proceedings of the American Society for Engineering Education Annual Conference and Exposition, June 26–29, Vancouver, BC.
Bilec M, Ries R, Matthews HS. 2007. Sustainable development and green design: Who is leading the green initiative? Journal of Professional Issues in Engineering Education and Practice 133(4):265–269.
Bound J, Braga B, Golden JM, Turner S. 2013. Pathways to adjustment: The case of information technology workers. American Economic Review 103(3):203–207.
Bound J, Braga B, Golden JM, Khanna G. 2015. Recruitment of foreigners in the market for computer scientists in the United States. Journal of Labor Economics 33(S1):S187–S223.
Byers T, Seelig T, Sheppard S, Weilerstein P. 2013. Entrepreneurship: Its role in engineering education. The Bridge 43(2):35–40.
Cappelli P. 2014. Skill Gaps, Skill Shortages and Skill Mismatches: Evidence for the US. NBER Working Paper No. 20382. Cambridge, MA: National Bureau of Economic Research.
Carnevale A, Strohl J, Melton M. 2011. What’s It Worth? The Economic Value of College Majors. Washington: Georgetown University Center on Education and the Workforce.
Carnevale A, Fasules M, Porter A, Landis-Santos J. 2016. African Americans: College Majors and Earnings. Washington: Georgetown University Center on Education and the Workforce.
Doran K, Gelber A, Isen A. 2014. The Effects of High-Skilled Immigration Policy on Firms: Evidence from H-1B Visa Lotteries. NBER Working Paper No. 20668. Cambridge, MA: National Bureau of Economic Research. Available at www.nber.org/papers/w20668.
Freeman RB. 1976. A cobweb model of the supply and starting salary of new engineers. Industrial and Labor Relations Review 29(2):236–248.
Freeman RB. 2010. Globalization of scientific and engineering talent: International mobility of students, workers, and ideas and the world economy. Economics of Innovation and New Technology 19(5):393–406.
Frehill LM. 2007. Are women more or less likely than men to be retained in engineering after college? SWE Magazine: Society of Women Engineers (fall):2–4.
Grossman GM, Helpman E. 1991. Quality ladders in the theory of growth. Review of Economic Studies 58(1):43–61.
Helpman E, Grossman GM. 1991. Innovation and Growth in the Global Economy. Cambridge: MIT Press.
Hershbein B, Kearney M. 2014. Major Decisions: What Graduates Earn Over Their Lifetimes. The Hamilton Project.
Hunt J. 2011. Which immigrants are most innovative and entrepreneurial? Distinctions by entry visa. Journal of Labor Economics 29(3):417–457.
Hunt J, Gauthier-Loiselle M. 2010. How much does immigration boost innovation? American Economic Journal: Macroeconomics 2(2):31–56.
Hunt J, Garant J-P, Herman H, Munroe DJ. 2013. Why are women underrepresented amongst patentees? Research Policy 42(4):831–843.
Jones CI. 1995. Time series tests of endogenous growth models. Quarterly Journal of Economics 110(2):495–525.
Kenney M, Dossani R. 2005. Offshoring and the future of US engineering: An overview. The Bridge 35(3):5–12.
Kerr WR. 2007. US Ethnic Scientists and Entrepreneurs. Federal Reserve Bank of Cleveland.
Kerr WR. 2013. US High-Skilled Immigration, Innovation, and Entrepreneurship: Empirical Approaches and Evidence. NBER Working Paper No. 19377. Cambridge, MA: National Bureau of Economic Research.
Kuehn D, Salzman H. 2018. The Labor Market for New Engineers: An Overview of Recent Trends. In: Engineering in a Global Economy, eds. Freeman RB, Salzman H. NBER and University of Chicago Press.
Land RE. 2012. Engineering technologists are engineers. Journal of Engineering Technology (Spring):32–39.
Lee T. 2015. The 10 toughest jobs to fill in 2016. Society for Human Resource Management, September 22. Available at https://www.shrm.org/hrdisciplines/staffingmanagement/articles/pages/10-toughest-jobs-to-fill-2016.aspx.
Lemieux T. 2008. The changing nature of wage inequality. Journal of Population Economics 21(1):21–48.
Lucena JC. 2005. Defending the Nation: US Policymaking to Create Scientists and Engineers from Sputnik to the “War Against Terrorism.” Lanham, MD: University Press of America.
Lynn L, Salzman H, Kuehn D. 2011. Dynamics of Engineering Labor Markets: Petroleum Engineering and Responsive Supply. Cambridge, MA: National Bureau of Economic Research.
NAE [National Academy of Engineering]. 2017. Engineering Technology Education in the United States. Washington: National Academies Press.
NSB [National Science Board]. 2015. Revisiting the STEM Workforce: A Companion to Science and Engineering Indicators 2014. Washington: National Science Foundation.
NSF [National Science Foundation]. 2014. Science and Engineering Indicators. Washington. Available at https://www.nsf.gov/statistics/seind14/.
NSF. 2018. Science and Engineering Indicators. Washington. Available at https://www.nsf.gov/statistics/2018/nsb20181/report/sections/science-and-engineering-labor-force/women-and-minorities-in-the-s-e-workforce#salary-differences-for-women-and-racial-and-ethnic-minorities.
OECD [Organization for Economic Cooperation and Development]. 2008. The Global Competition for Talent: Mobility of the Highly Skilled. Paris.
Ohland MW, Sheppard SD, Lichtenstein G, Eris O, Chachra D, Layton RA. 2008. Persistence, engagement, and migration in engineering programs. Journal of Engineering Education 97:259–278.
Orrenius PM, Zavodny M. 2015. Does immigration affect whether US natives major in science and engineering? Journal of Labor Economics 33(S1):S79–S108.
Ortega F, Peri G. 2013. The effect of income and immigration policies on international migration. Migration Studies 1(1):47–74.
Petroski H. 2010. The Essential Engineer: Why Science Alone Will Not Solve Our Global Problems. New York: Vintage Books.
Pisano GP, Shih WC. 2009. Restoring American competitiveness. Harvard Business Review, July-August.
Romer PM. 1990. Endogenous technological change. Journal of Political Economy 98(3210):s71–s102.
Rosen L. 2013. The truth hurts: The STEM crisis is not a myth. Huffington Post, September 11. Available at www.huffingtonpost.com/linda-rosen/the-truth-hurts-the-stem-_b_3900575.html.
Rothwell J. 2014. Short on STEM talent. US News & World Report, September 15. Available at www.usnews.com/opinion/articles/2014/09/15/the-stem-worker-shortage-is-real.
Ruiz NG. 2013. Immigration Facts on Foreign Students. Brookings Interactive, April 9. Available at www.brookings.edu/research/interactives/2013/facts-on-foreign-students.
Ryoo J, Rosen S. 2004. The engineering labor market. Journal of Political Economy 112 (February):S110–S140.
Sachs JD, Shatz HJ, Deardorff A, Hall RE. 1994. Trade and jobs in US manufacturing. Brookings Papers on Economic Activity 1:1–84.
Salzman H. 2013. What shortages? The real evidence about the STEM workforce. Issues in Science and Technology, Summer.
Salzman H, Lynn L. 2010. Engineering and engineering skills: What’s really needed for global competitiveness. Association for Public Policy Analysis and Management Annual Meeting, Boston.
Shartrand A, Weilerstein P, Besterfield-Sacre M, Golding K. 2010. Technology entrepreneurship programs in US engineering schools: Course and program characteristics at the undergraduate level. Proceedings of the American Society for Engineering Education Annual Conference and Exposition, June 20–23, Louisville, KY.
Shu P. 2013. Career Choice and Skill Development of MIT Graduates: Are the “Best and Brightest” Going into Finance? Working Paper 16-067. Boston: Harvard Business School.
Teitelbaum M. 2014. Falling Behind? Boom, Bust, and the Global Race for Scientific Talent. Princeton University Press.
Wisnioski M. 2012. Engineers for Change: Competing Visions of Technology in 1960s America. Boston: MIT Press.
Yoder BL. 2015. Engineering by the numbers. Available at: https://www.asee.org/papers-and-publications/publications/college-profiles/15EngineeringbytheNumbersPart1.pdf.
Zolas N, Goldschlag N, Jarmin R, Stephan P, Owen-Smith J, Rosen RF, Allen BM, Weinberg BA, Lane JI. 2015. Wrapping it up in a person: Examining employment and earnings outcomes for PhD recipients. Science 350(6266):1367–1371.


