


Below is the uncorrected machine-read text of this chapter, intended to provide our own search engines and external engines with highly rich, chapter-representative searchable text of each book. Because it is UNCORRECTED material, please consider the following text as a useful but insufficient proxy for the authoritative book pages.
11 Plenary Sessions Keynote Address Innovation: Federal Maritime Commissionâs Innovation Supply Chain Innovation Team Initiative Rebecca F. Dye, Federal Maritime Commission he Federal Maritime Commission (FMC) exercises broad programmatic responsibility over ocean carriers, ports, marine terminals, and ocean transportation intermediaries (freight forwarders and non-vessel-operating common carriers). The flagship authority is the Shipping Act of 1984, which authorized the commission to analyze agreements between ocean carriers, ports, and marine terminals to ensure that U.S. markets remain competitive. The ultimate benefit accrues to American exporters and importers with the highest-quality ocean freight ensured at the lowest cost. To carry out this mandate and to develop an in-depth understanding of the businesses that it regulates, FMC analyzes and evaluates a large amount of current operations and financial data for its stakeholders. The Supply Chain Innovation (SCI) Team was implemented in response to the following factors: increasing weather-related congestion in East Coast ports in 2012 and 2013, increasing congestion on the West Coast in 2014 and 2015 due to labor disruptions, and requests from the trucking industry to the commission to help address the resulting impacts. As part of forming the SCI Team, small working teams were established and anchored by the directors of the largest ports in the United States. These team provide the intersection between supply chain system management, team and innovation leadership theory, and port and maritime shipping operations. The project was supported in consultation with some of the best supply chain management companies in the country as well as many other consultants. They shared not only their time and expertise but also their company resources to be part of this effort. The commission acted as catalyst to lead the innovation teams. More information is available at https://www.fmc.gov/supplychain.aspx. In his 2015 book, Team-of-Teams6, General Stanley McChrystal discusses how systems move from complicated, in which each routine event is planned and predicted, like an assembly line, to complex, in which butterfly effects, black swans, and other far-flung events make anticipating outcomes difficult, if not impossible. The most important concept that the members of the innovation teams were encouraged to adopt was that the global supply chain is a complex system in which every action and every commercial decision may affect outcomes in other parts of the supply chain in unanticipated ways. Internal business 6 General Stanley McChrystal with Tantum Collins, David Silverman, and Chris Fussell, Team of Teams: New Rules of Engagement for a Complex World, Portfolio/Penguin, New York, 2015. T
12 efficiency is not necessarily enough to prosper in this system. Teams were encouraged to step out of their enterprise silos to consider the supply chain from an overall upstreamâdownstream perspective. Stepping out of these silos included considering the concept that transportation, the intermodal approach that the federal government employs to regulate the various businesses in the global ocean supply chain system, may need to be updated to reflect the interdependent complex systems reality of the global freight system. The goal of the SCI Team was to take a broad, systems view of the global supply chain, identify one important supply chain process innovation, and move beyond discussion to action on improving supply chain effectiveness and reliability. The SCI Teamâs work resulted in three major themes that evolved from the work of six import and export supply chain teams during 2016 and 2017: 1. Small teams and process innovation, or, more specifically, the importance of creating small teams with no more than a dozen industry leaders from across the relevant range of supply chain actors to identify and promote conditions to support process innovation; 2. Visibility of information, or the identification of specific, critical pieces of information that each actor needs to achieve a specific goal, not on more data collection; and 3. A National Seaport Information Portal, which is the supply chain process innovation that the teams recommended as the most useful for changing the operational behavior of actors in the freight delivery system. Use of this portal is the way critical information can be made available to supply chain actors in a timely and secure manner to all relevant supply chain actors. BACKGROUND The SCI Team project was launched in May 2016. The teams were directed, first, to identify one supply chain process innovation that would make the supply chain more reliable and resilient and, second, to develop a proposed private-sector implementation of that process innovation. Two aspects were removed from consideration: port infrastructure and funding and port metrics. From the first discussion, the teams were encouraged to avoid diving down to infrastructure and instead to obtainmore money to support it from the federal government. Port metrics is being considered in another forum. The teams were organized to consider process innovation, with the commission designing the discussion platform, focusing discussions, and acting as the overall catalyst to ensure a timely process by allowing the teams to think outside of the box. These multistate teams consisted of no more than 12 key supply chain leaders to ensure active participation by all members. Members had to be industry leaders to ensure that that the collective experience and authority at the table were appropriate for productive discussions. In addition, teams had to include port officials who understood actual port operations, not those at an optimal ideal port. Team meetings and discussions were private to ensure that participants would engage and speak candidly and would step outside their industry silos. These meetings
13 were balanced with regular public presentations in commission meetings, testimony before the Senate Commerce Committee, and public statements on the commission webpage. INNOVATION At the project launch, team members were encouraged to consider how innovation occurs. In his book on the digital revolution, The Innovators7, Walter Isaacson indicates that contributions to innovation by isolated individuals is overrated. He observed that real innovation springs from creative action between committed individuals. Most often that action takes the form of incremental advances over time. By the end of the SCI Team project in December 2017, all six import and export teams agreed that enhanced visibility of the international supply chain would be the one improvement to the global supply chain that would provide increased reliability and resilience. The teams were careful to characterize the underpinnings of what was being developed as discrete, critical pieces of information, not lots of data. Many supply chain inefficiencies result from poor information availability. The lack of timely, accurate information can leave supply chain actors flying blind, and in certain parts of the chain, not just flying blind, but flying blindly right into each other. Providing critical information, which, according to supply chain experts, is the right information at the right time, encourages self-correcting behavior and harmonization of the system. Teams identified critical information needs of each supply chain actor and discussed how to ensure this information reached each actor in a timely fashion. The process involved determining who requires what information when, who has it, and how it can be distributed. Although intuitive, this determination is not simple. For example, shippers on the import teams reported that the key piece of actionable information they want and, in fact, the only thing they really need, is when a container is available. However, there is a major impediment to obtaining this information: since ocean carriers have divested truck chassis, in certain ports the marine terminal operators do not know if a chassis is available when they call a shipper who calls a trucker to come to the port. Truckers go to the port on the basis of when the ship pulled in and when cargo was estimated to be unloaded and its estimated time on the terminal yard. This practice results in port congestion and queues of waiting trucks. Because appointment systems are dependent on these estimates, even the systems do not adequately compensate for this issue. Shippers on the export teams identified critical information as when an empty container is available, its location, the earliest time an export container can be delivered to the marine terminal, and terminal gate hours. All these are discrete pieces of information that should be possible to deliver but currently are difficult to create. 7 Walter Isaccson, The Innovators: How a Group of Hackers, Geniuses, and Geeks Created the Digital Revolution, Simon and Schuster, New York, 2015.
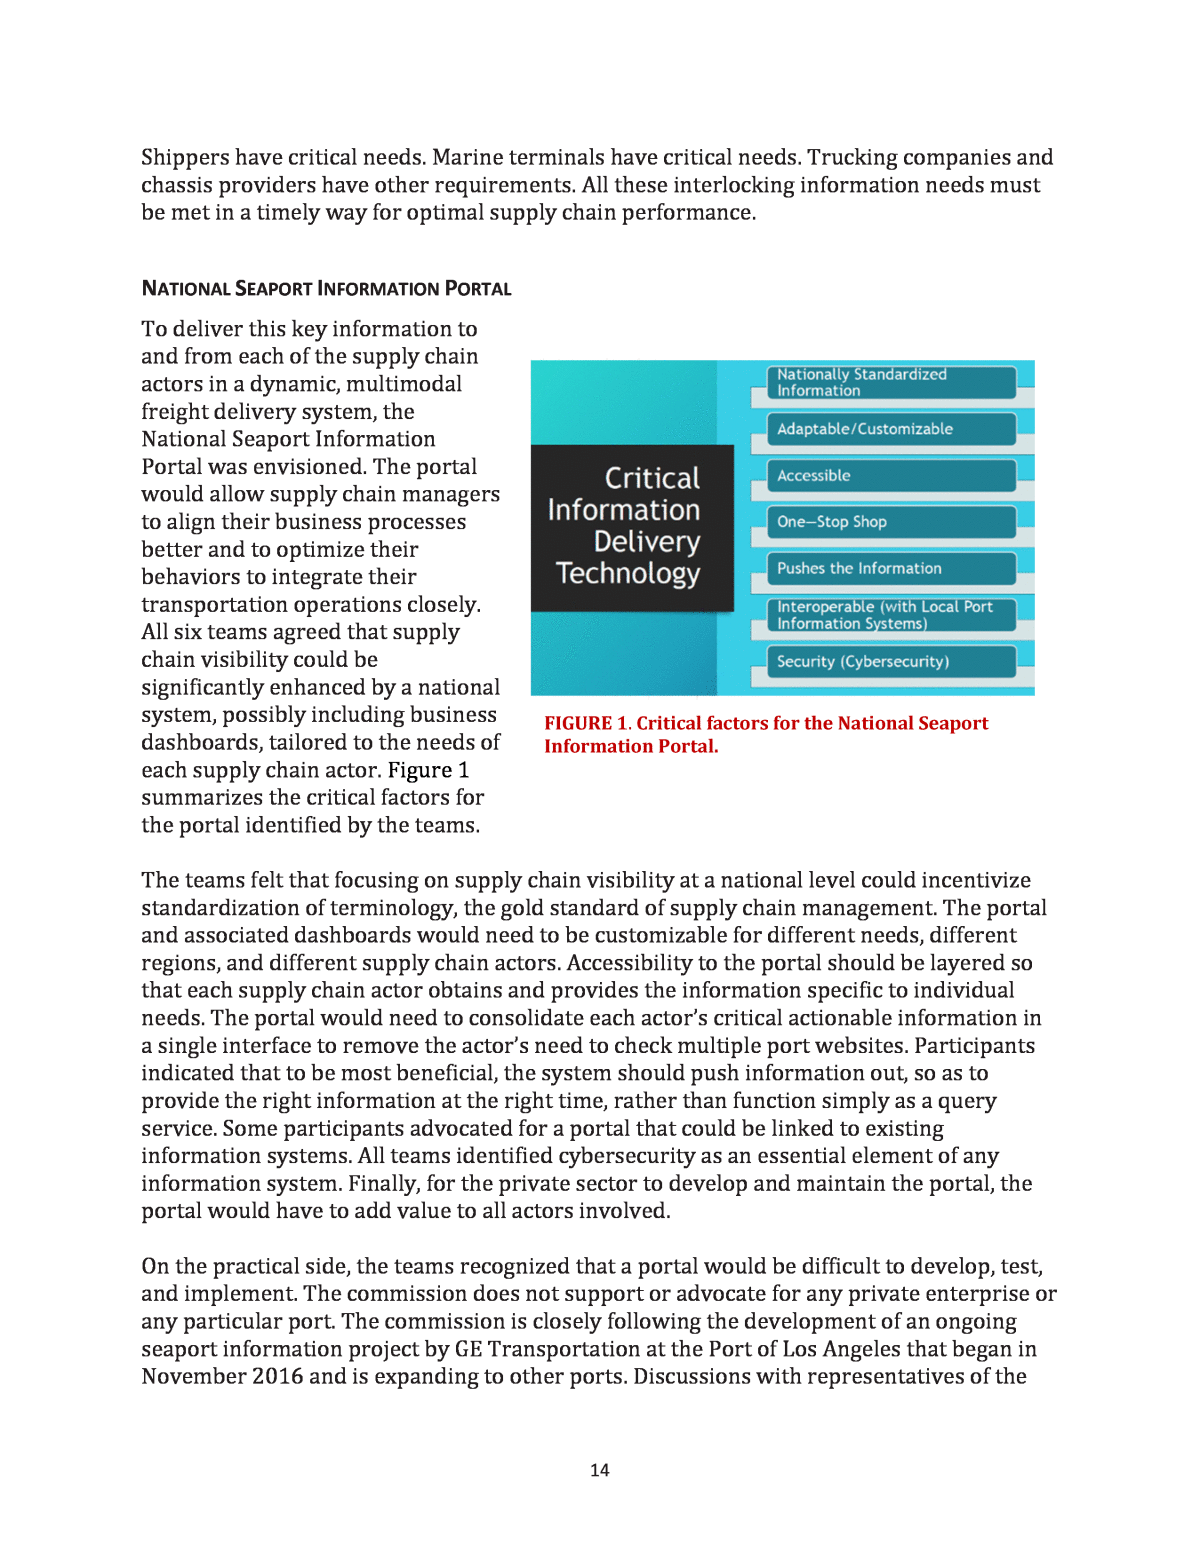
14 Shippers have critical needs. Marine terminals have critical needs. Trucking companies and chassis providers have other requirements. All these interlocking information needs must be met in a timely way for optimal supply chain performance. NATIONAL SEAPORT INFORMATION PORTAL To deliver this key information to and from each of the supply chain actors in a dynamic, multimodal freight delivery system, the National Seaport Information Portal was envisioned. The portal would allow supply chain managers to align their business processes better and to optimize their behaviors to integrate their transportation operations closely. All six teams agreed that supply chain visibility could be significantly enhanced by a national system, possibly including business dashboards, tailored to the needs of each supply chain actor. Figure 1 summarizes the critical factors for the portal identified by the teams. The teams felt that focusing on supply chain visibility at a national level could incentivize standardization of terminology, the gold standard of supply chain management. The portal and associated dashboards would need to be customizable for different needs, different regions, and different supply chain actors. Accessibility to the portal should be layered so that each supply chain actor obtains and provides the information specific to individual needs. The portal would need to consolidate each actorâs critical actionable information in a single interface to remove the actorâs need to check multiple port websites. Participants indicated that to be most beneficial, the system should push information out, so as to provide the right information at the right time, rather than function simply as a query service. Some participants advocated for a portal that could be linked to existing information systems. All teams identified cybersecurity as an essential element of any information system. Finally, for the private sector to develop and maintain the portal, the portal would have to add value to all actors involved. On the practical side, the teams recognized that a portal would be difficult to develop, test, and implement. The commission does not support or advocate for any private enterprise or any particular port. The commission is closely following the development of an ongoing seaport information project by GE Transportation at the Port of Los Angeles that began in November 2016 and is expanding to other ports. Discussions with representatives of the FIGURE 1. Critical factors for the National Seaport Information Portal.
15 ports, marine terminal operators, and shippers with cargo moving through the ports who were active participants in the SCI Team were important to the development of the Port of Los Angeles/GE Transportation portal, resulting in significant and useful cross-fertilization. IN CONCLUSION The results of a recent Journal of Commerce survey of shipping industry executives and professionals, âWorking as One: How Real-Time Cloud-Based Data-Sharing Will Benefit the Maritime Shipping Sector,â8 provides the following takeaways: ⢠More than half of the respondents said that their operational performance would improve by at least 50 percent if they could share real-time information. ⢠Ninety-seven percent supported the importance of supply chain stakeholders being able to operate with a common set of data. If those numbers are reasonably accurate, the industry understands the benefits of greater data sharing, information sharing, and visibility. But the hard part remains, and that is what this conference addressed. Bringing the key supply chain actors together to improve reliability and resilience of our complex dynamic multimodal freight delivery system is a challenge. The teams made remarkable progress in a short period. Their work will likely continue to support private-sector efforts such as that undertaken by Los Angeles and GE Transportation. Our international freight delivery systemâocean, rail and truckingâis vital to the growth of the U.S. economy. Enhancing the performance of our U.S. freight delivery system, through information visibility in particular, will provide a boost to the international competitiveness of the United States. In closing, itâs not collaboration; itâs engagement. Itâs not brainstorming or facilitationâthis is focused leadership. 8 Alan M. Field, White paper, navis, XVELA, HIS Markit, and JOC.com, 2018; available at https://subscribe.joc.com/xvela-navis-whitepaper-may-2018/.
16 Plenary Session 1 Perspectives Driving Marine Transportation Systemâs Freight Analytics Helen Brohl, U.S. Committee on the Marine Transportation System, presiding Kathleen Hancock, Virginia Polytechnic Institute and State University, recording Panelists Caitlin Hughes, Federal Highway Administration Bethanny Rooney, Port Authority of New York and New Jersey Jonathan Rosenthal, Harbor Performance Enhancement Center, LLC Thomas Smith, U.S. Army Corps of Engineers Louis-Paul Tardif, Transport Canada Ted Trepanier, INRIX SUMMARY This session framed the trends, needs, and issues facing the freight system related to operations, planning, and policy from the perspectives of infrastructure and innovation thought leaders. Panelists engaged in a moderated conversation and offered their unique perspectives on how better data and analytics integrated from many sources and transportation modes enhance and inform public- and private-sector decision-making. Summaries of each view are followed by issues raised in response to these discussions. Caitlin Hughes indicated that her office at FHWA is focused on building intermodal and multimodal engagement and collaboration. Early efforts were directed at ensuring that freight was part of the conversation related to transportation infrastructure and decision-making. Her office is now improving products including data, tools, and models and is moving into developing predictive capabilities to understand the supply chain in preparation for the expected growth in goods movement. A critical consideration is the interoperability of data. Hughes indicated that good information exists on truck movement at the national level but that work needs to be done to disaggregate this information to understand more detailed movements including when and where freight is switching between modes. At the national level, the FAF was used to produce the first Freight Conditions and Performance Report. States are using the FAF and National Performance Management Research Data Set (NPMRDS) to develop their state freight plans. Other information of importance includes the intermodal inventory cost model, baseline highway performance monitoring data, and a better understanding of fluidity and supply chain flows. Hughesâs office is also working on a forward-looking initiative that improves the FAF and the understanding of truck size and weight in support of developing a roadmap for improving the determination of truck impacts on the transportation system. FHWA is also developing a behavioral-based national freight model for predictive freight analytics and a freight and logistics survey to help identify technologies that can yield better data. Finally, Hughes presented some results from the just-released initial report of the Freight Traveler Advisory System, which helps ports with routing trucks for optimized goods movement. Results showed reductions of 10 percent for
17 bobtail trips, 15 percent for truck travel time, 20 percent for terminal queue wait time, and 5 percent each for emissions and fuel consumption. This example effectively demonstrates the value of technology and data sharing. Bethany Rooney discussed the breadth of scope and challenges that are faced by the Port Authority of New York and New Jersey. The authority was the first multi- and intermodal agency in the country established to help support the U.S. military. The authority includes seven airports, passenger rail service, float rail service, four bridges, two tunnels, two bus terminals, the World Trade Center site, and 14 of more than 180 marine port facilities. Having experienced a series of large disruptions over the past decade, she emphasized the need to understand cascading impacts on the transportation system in addition to normal operations. The authority was the first to bring a broad range of stakeholders together to evaluate port performance and efficiency, breaking down silos and considering the entire supply chain. The stakeholders used the forum to improve port efficiency by employing data collected during the worst times to measure improvements. The overarching consideration was getting commerce to the marketplace. Although data exist at the national level, Hughes indicated that boots-on-the-ground data were needed for understanding day-to-day operations. The port authority is expecting the container volume to double or triple in the next 30 years, but there is no landside capacity to expand. As a result, she indicated, improvements were needed in efficiency and productivity of existing facilities. These improvements can happen with changes in operations and use of facilities based on a clear understanding of the impact of and reliance on their multimodal system. Jonathan Rosenthal brought a different and unique perspective of a background in investing in or representing investors, operating industries, and companies within industries undergoing transformations. He identified three sectors currently going through this transformation: airlines, utilities, and the freight ecosystem. Of these, he indicated that there are never-before-seen opportunities available today in freight due to the availability of data coupled with emerging analytical capabilities. Rosenthal identified three requirements for leveraging these opportunities: (1) understanding the art of transformation, (2) applying the science of capital, and (3) always making winners. His company is involved in two initiatives related to this conference. First is the Harbor Performance Enhancement Center in the Port of Los Angeles, which is a hub-and-spoke operation for containers, with the goal of increasing throughput and processing speed by 20 percent. The second is the Warehouse Exchange, which communicates the availability of warehouse space to those who need it. Rosenthal indicated that it currently takes about 90 days to integrate the data system for a warehouse into the Warehouse Exchange system because of data incompatibilities. He closed with stating that investors invest only if they think that they will win. Currently, because freight is not viewed as a good risk, often because of challenges associated with public- and private-sector perceptions, investors are not encouraged. He recommends celebrating winners. Thomas Smith indicated that the navigation mission of USACE is to ensure safe, reliable, efficient commerce; national security; and economic viability for the United States. With more than 1,000 ports, approximately 200 locks and dams, and a dynamic inland waterway system, the U.S. Army Corps embraces the development of data to inform this mission
18 better. Smith stated that two perspectives are considered: (1) from the mariner side, whether the vessel operator has all the information necessary for operating a vessel, and (2) from the business side, where the commerce is and where it is moving as captured by the corps. He identified two challenges. First, it is important to understand the purpose and role of the corps as data are collected and made available. Second, the corps is moving from a long history of legacy practices to the digital and electronic world of today. Louis-Paul Tardif talked about the Canadian experience and Canadaâs commitment to investing in gateways. He indicated that decisions would be based on evidence, which requires data. As a result, Canada reached out to the private sector to use these data early in the process. The approach was to consider what decisions were necessary for smart investments and then to identify the data. The next step was to identify how stakeholders win by sharing these data. The concept of freight fluidity evolved from the need to educate the public about the value of investing in trade. In turn, the need for education led to the concept of evolution, when data exchanges were created between partners, which then supported the visibility concept, with the role of government being to facilitate exchange of data between all players. For the visibility concept to work, the government must establish common definitions and metrics. The result has been a view of resilience of the ports. A next step is expanding beyond the gateways to the multimodal transportation system. A major challenge is cybersecurity and system vulnerability. Tardif closed by explaining the shift from evidence-based decisions to transparency to winâwin. The steps between are filled with danger and are dependent on how one works with data. Ted Trepanier rounded out the discussion from the perspective of a traffic data and analytics provider. In a world of big data and global trade, he stated, we live on a very small sphere. He provided an acronym that demonstrates how technologies are upending how transportation is viewed and operated. ACES stands for automation, connected, electrified, and shared; he gave the example of a self-driving UBER-like service. Trucks carrying freight are almost all connected to a fleet management service, which provides anonymized data in near real time, which become part of the NPMRDS data. Long-established trends are changing. The data available today are very different from data 3 years ago. Technology outpaces research, which outpaces established processes and policies. After the presentations, a more general discussion ensued. Table 1 summarizes points that were made in response to questions. No agreement or consensus is intended or implied, and the order in which the concepts are listed does not imply prioritization or their relative level of importance.
19 TABLE 1. Summary of Comments and Questions. Question When considering national versus local, what local data are being missed? Responses ⢠Missing last mile: â Available for identified national critical freight corridors. â Can get from INRIX but just a sample and includes bias. Requires research into analysis of data. ⢠Effect of increased truck traffic in response to post-Panamax ships on roadways. ⢠Truck parking. ⢠Destination of cargo (O-D) : â Need to be responsible with data to ensure sensitive data are not released or misused. â Smart chassis: currently â¼2,500 instrumented of â¼80,000 total. â Possible restart of Vehicle Inventory and Use Survey Time to driverless vehicles and shift of resourcesâno parking but increased road repair. Question How do we assess system performance? Responses ⢠Capture done in the right way so that we see dynamic behavior: reliability, completeness, penetration, frequency. ⢠Performance measures: variability, resilience of commercial system and ability to adapt, predictability of container flow. ⢠Development of standards (difficult). ⢠Truck size and weight 2014âinconsistency in truck sizes and weight restrictions. ⢠Black box on board trucks. ⢠Consideration of Yelp for trucking to characterize customer behavior? (i.e., receiver not being available when truck arrives). Question What is in the state freight plans? Responses ⢠Most included multimodal considerations but not required. ⢠Required looking at bottlenecks. ⢠Encouraged freight advisory board (not required in each state) to help inform plans. ⢠FHWA will perform crosswalk study to identify commonalities and best practices. ⢠USDOT multimodal team will consider what can be used for the National Freight Strategic Plan. Question What about noncontainerized freight? Resppnses ⢠Multiply the problem by 10. ⢠One-commodity ports are unique, with their own challenges. ⢠Fluidity considers market baskets to help address noncontainerized freight.
20 Plenary 2 Reaching the Vision: The Challenges and Opportunities of Advancing Multimodal Freight Network Analytics Jim Kruse, Texas A&M Transportation Institute, presiding Craig Philip, Vanderbilt University, recording Panelists Stuart Anderson, Iowa Department of Transportation Bill Eisele, Texas A&M Transportation Institute Sarah Hernandez, University of Arkansas Kenneth Mitchell, U.S. Army Corps of Engineers Birat Pandey, Federal Highway Administration SUMMARY This session considered real-world challenges in advancing multimodal freight network analytics. Panelists considered barriers to advancing analytics associated with data sourcing and sharing, policy barriers, technology transfer, and multimodal transparency. In addition, panelists shared their visions for progress and opportunities to collaborate between federal agency partners, multimodal stakeholders, and the research community. Panel members represented a broad spectrum of interests, each with specific and relevant experiences reflecting their respective roles within state and federal agencies and academic institutions. Stuart Anderson described the Iowa DOTâs efforts since 2013 to analyze the impact of Upper Mississippi River operational disruptions on Iowa through a comprehensive reconnaissance study that resulted in a marine highway designation and a multistate study assessing the impact of a system shutdown on the agricultural sector. He concluded with an analysis of three potential pilot projects focused respectively on efficiency, reliability, and capacity. An analytical methodology was demonstrated to monetize the impacts and estimate benefit/cost levels for each. Bill Eisele discussed barriers and opportunities to integrate marine data with data from other modes and the evolution from observations of volumes and travel times to the current state of practice in measuring actual and aspirational commodity movements across the multimodal supply chain. The concept of freight fluidityâtravel time, travel time reliability, and costâwas used to frame three case studies describing highway congestion, highway bottlenecks, and port travel time distributions. Eiseleâs recommendations included the development of standardized analytical methods to measure end-to-end supply chain performance and bottleneck identification. Sarah Hernandez demonstrated that no single source of data is sufficient to support multimodal analytics. She showed that multiple sources of data available in the trucking sector can be effectively combined and identified three primary data types: mobile (e.g.,
21 GPS, electronic logging devices), point sensor (loop detectors), and surveys. She also noted that some data sources could be repurposed, as in using enhanced loop detector data to provide vehicle type and commodity information based on an inductive signature. Kenneth Mitchell divided the domain of multimodal freight network analytics between freight system demand and freight system efficiency. On the demand side, he noted the problems of data granularity and confidentiality and the lack of agreement on what to measure and model. For efficiency, he indicated challenges translating snapshot measures into systemwide metrics and agreeing on level-of-service measures across modes. He identified a significant opportunity as the full exploitation of probe data sets that could be coupled to provide multimodal insights. Birat Pandey provided an overview of comparative national freight mode shares, forecast increases for the next 30 years, and the FAST Act mandate to establish a national multimodal freight network. He indicated that analytics would be needed for the network with new and expanded research on national freight fluidity performance and the development of a behavioral-based network freight model. Foundational work would include aligning freight data collection programs, specifically a common commodity classification, and developing an integrated routable multimodal network. KEY TAKEAWAYS From the panelists and participant discussion, the following factors relate to the objectives of this session: ⢠Available relevant data are exploding as sensors, probes, the Internet of things (IoT), and the like are applied to freight activities, but much still remains modally stovepiped. ⢠Analytics can repurpose data to increase the relevant content for decision makersâfor example, by applying algorithms to determine truck type using frame pavement loop data. ⢠Increased alignment of multimodal level of service and freight performance metrics is extremely important. INNOVATIVE APPROACHES ⢠Travel time contour maps focused on modal connections can effectively illustrate fluidity across the modes. ⢠Multimodal data conflation can overcome existing mode-specific stovepipes that plague much of the available data. ANALYTICS ⢠Multiple data sources are necessary, so focus should be on using analytics to bridge data divides.
22 ⢠Visualization is an underexploited capability that can be used to effectively manage the big data that are coming from the freight sector IoT revolution, especially as sensors become integral to everything mobile. DATA CONCERNS AND ISSUES ⢠The AIS is a robust and granular data source for maritime activity. To be exploited fully, it requires crisp metadata definitions to improve data quality and accessibility. ⢠Absence of commodity flow data is endemic across the modes. ACTION ITEMS TO CONSIDER ⢠Seek data that will inform what shippers want, not only what their present mode and service choices are, which is the focus of most existing data sets. ⢠Develop common definitions of commodity classes and levels of service across all freight modes. Plenary 3 The Value of Multimodal Freight Network Analytics: Making the Case Through Scenarios Catherine Lawson, University at Albany, presiding Kathryn McIntosh, U.S. Army Corps of Engineers, recording Panelists Alex Appel, Federal Highway Administration Bruce Busler, U.S. Transportation Command Michael Cashner, Landstar Transportation Logistics, Inc. Nicole Katsikides, Texas A&M Transportation Institute SUMMARY Planners use various natural and man-made scenarios, key to modern freight planning, to design and engage better in freight operations. Panelists offered scenarios that they have employed to illustrate the possible value of national multimodal freight analytics in both the tactical (event-driven) and strategic (long-term planning) contexts. The scenarios referenced network disruptions ranging from localized impacts to multistate natural disasters to military deployment. The long-range planning scenarios considered demographic changes, supply chain dynamics, technological advances, and more substantial extreme weather events resulting from climate change. Last, some panelists introduced ideas to consider how improved analytics and possible tools could build resilience into multimodal systems.
23 During his presentation, Alex Appel recommended that in using scenario planning, planners look at how land-based localized impacts could ripple across the marine system and vice versa. He discussed three scenarios. The first looked at a 3-week-long bridge closure and how the roadway system adapted to the surge of vehicle traffic. Preparing for this surge included proactively pre-placing or staging emergency vehicles to address real-time risks during traffic events. The second scenario extended the scope of planning from a localized disruption to a statewide or regional disruption by evaluating the experiences in Puerto Rico during Hurricane Maria. Hurricane Maria caused numerous land-based impacts: traffic signal disruptions, road closures due to rain, numerous bridge washouts, and roadway collapses. These directly affected the recovery of the highway system. The recovery of the MTS was directly affected by these landside impacts. With the incorporation of the regional aspects, elements of resilience could be incorporated into planning operations. Last, Appel discussed planning for a disaster on a scale not previously experienced by referencing the Cascadia subduction zone. In this scenario, multiple states would be affected, and the scope of the necessary planning would be brought to the national level as the event would cause disruptions to all modes of transportation across multiple boundaries. Bruce Busler provided a military perspective in the use of large-scale scenarios in planning operations. His discussion focused on being mission ready at all times; this factor requires a different approach to resiliency and preparation of the nationâs civil infrastructure to address national security needs. Using the Strategic Highway Network, Busler described scenario planning for a national emergency as an exercise in identifying the pathways that would place the least stress on the national highway systems while still retaining the capacity to absorb the stress. Looking at the zombie apocalypse scenario, he explained that the goal was to determine how, if the highway system were operational, it could be managed in a quick and beneficial way to best support the movement of equipment and resources from nonimpacted regions to impacted regions. Busler concluded that identifying local areas of stress and limitations on local infrastructure and determining areas of restriction are critical to meet the needs of the U.S. Department of Defense. Michael Cashner offered a motor carrierâs perspective to the discussion of scenario planning and discussed considerations when planning for a total network disruption. During normal operations, almost 100 percent of commercial trucking capacity is in use: during a disruption, limited capacity is available to respond. Scenario planning offers a means of addressing this imbalance to minimize the time for industry to respond effectively. Looking specifically at the movement of military equipment and transport during an emergency, Cashner offered the following considerations for planners. First, freight transport of military equipment requires load permits and would either need exceptions or preauthorization. Local police coordination for escorts would need to be preplanned. Convoys for large, sensitive, or hazardous cargo need clearance from the USDOT for authorized movement and likely can be moved only by a limited number of trucks. Finally, the impacts to the industry and commercial customers must be considered for effective planning.
24 Nicole Katsikides touched on bridging the resources available to the public sector with those used by the private sector when planning for disturbances. She discussed the need to demonstrate that the transportation system operates as a connected system of systems and not just as an individual mode. For operations and strategic planning, Katsikides explained that for rapid or real-time operations, planners should consider the entire system from a local and national level. She also proposed that having a tool that incorporates the entire supply chain into the process, including commodity data, would be helpful to articulate the value that freight provides to local jobs and positive economic impacts. KEY TAKEAWAYS During this session, the panelists considered the use of various scenario planning techniques and the types of tools needed to help expand the scope of standard planning approaches applied to the multimodal freight network. Critical considerations included the following: ⢠Meaningful scenario planning needs to extend from the local to the national level, or else impacts or disruptions would result in considering the freight system in isolation. ⢠The U.S. freight transportation operates as a system within systems. As a result, a tool is desired to identify the current status of the system and determine where chokepoints are or are expected to impact operations. ⢠Including local knowledge and perspectives in planning operations provides invaluable information on possible limitations. ⢠At the same time, to support planning at the national level, it is important that local governments and communities understand better how their work affects the national system. Keynote Address Blockchain and Freight Transportation John Kingston, Blockchain in Transport Alliance he principle behind blockchains is the ability to allow digital information to be distributed but not copied. This concept is the underpinning for Bitcoin. According to Don and Alex Tapscott, authors of Blockchain Revolution (2016) 9, âThe blockchain is an incorruptible digital ledger of economic transactions that can be programmed to record . . . virtually everything of value.â Information exists as a shared and continually reconciled distributed database. Kingston is the executive editor of Freightwaves (https:/www.freightwaves.com), an online source for news about freight markets, and the head of community engagement for the 9 Don and Alex Tapscott, How the Technology Behind the Bitcoin and Other Cryptocurrencies Is Changing the World, Portfolio/Penguin, New York, 2016. T
25 affiliated Blockchain in Transport Alliance, where he works with groups interested in learning about blockchain technology and how it could affect their markets. In his presentation, he discussed how blockchains could influence supply chain efficiency and the multimodal freight system. Because blockchains are designed to capture chains of information, they lend themselves to supply chain management. Each step or process in the supply chain can be captured as a transaction in the blockchain, which is then part of the distributed database. This transaction is immutable: it cannot be hacked because it is not in a single location but exists everywhere along the chain. Kingston indicated that the current focus is on âcleaning up the back officeâ or replacing the current complex set of independent transactions with this distributed ledger approach. He likened the potential to a smart contract with a series of ifâthen activities that were all part of the contract record. He indicated that the potential for blockchains in supply chain logistics, as an emerging technology, is strong once standards are established.
