
4
Potassium: Dietary Reference Intakes for Adequacy
Potassium is a physiologically essential nutrient. Accordingly, the Dietary Reference Intakes (DRIs) for adequacy serve as an important reference value with a variety of applications. The extent to which an indicator of potassium adequacy has been identified and characterized in the apparently healthy population is at the crux of the committee’s decision regarding which DRI for adequacy to establish and at what levels. For an Estimated Average Requirement (EAR) to be established, evidence of a causal relationship between intake of the nutrient and the indicator of adequacy, as well as evidence of an intake–response relationship, are needed to determine the distribution of requirement for adequacy in the population. As described in Chapter 1, once an EAR is determined, a Recommended Dietary Allowance (RDA) can be established. When there is insufficient evidence to establish an EAR and an RDA, a DRI for adequacy is still indispensable, as it provides a benchmark for dietary planning and assessment; in such cases, an Adequate Intake (AI) is established using other data-driven approaches and indicators.
Guided by the DRI organizing framework (see Chapter 1, Box 1-2) and the considerations under the expanded DRI model (see Chapter 2), this chapter describes the committee’s review of indicators to inform the potassium DRIs for adequacy and presents its approach and determination of updated reference values for the DRI age, sex, and life-stage groups. The committee’s decision was informed by its evaluation of evidence on potassium intake requirements in apparently healthy individuals. The Agency for Healthcare Research and Quality systematic review, Sodium and Potassium Intake: Effects on Chronic Disease Outcomes and Risks (AHRQ
Systematic Review) (Newberry et al., 2018), served as a primary source of evidence for the committee’s work. However, as described in Chapter 2, the committee sought to differentiate the evidence reviewed for the DRIs for adequacy from the evidence reviewed for the DRI based on chronic disease. None of the indicators included in the AHRQ Systematic Review (blood pressure, cardiovascular disease, coronary heart disease, kidney disease, kidney stone formation, mortality, and stroke) were considered sufficiently informative to determine potassium adequacy. Instead, the committee used evidence gathered from its supplemental literature searches and other information-gathering activities. This chapter presents the committee’s rationale and conclusions regarding the suitability of these indicators to inform the potassium DRI for adequacy. For context, the committee’s findings are preceded by a brief summary of the approach taken to establish the potassium AIs in the Dietary Reference Intakes for Water, Potassium, Sodium, Chloride, and Sulfate (2005 DRI Report) (IOM, 2005).
POTASSIUM ADEQUATE INTAKE LEVELS ESTABLISHED IN THE 2005 DRI REPORT
The 2005 report that established the DRIs for potassium served as a starting point for the committee’s review of the evidence (IOM, 2005). The approach taken in the 2005 DRI Report predated the guidance and recommendations offered in the 2017 National Academies of Sciences, Engineering, and Medicine report Guiding Principles for Developing Dietary Reference Intakes Based on Chronic Disease (Guiding Principles Report) (NASEM, 2017). Accordingly, potassium adequacy was conceptualized at that time as the following:
In generally healthy people, frank hypokalemia is not a necessary or usual expression of a subtle dietary potassium deficiency … a typical dietary intake of potassium that gives rise to a serum potassium concentration somewhat greater than 3.5 mmol/L would still be considered inadequate if a higher intake of potassium prevents, reduces, or delays expression of certain chronic diseases or conditions, such as elevated blood pressure, salt sensitivity, kidney stones, bone loss, or stroke. (IOM, 2005, pp. 192, 194)
The potassium AI for adults in the 2005 DRI Report was established based on evidence of an intake level that blunted a salt-sensitive rise in blood pressure among normotensive African American men and reduced the recurrence of kidney stone formation (IOM, 2005). The potassium AI was further supported by evidence of potassium intake being positively associated with bone mineral density and evidence of blood pressure–lowering effects among nonhypertensive individuals.
REVIEW OF POTENTIAL INDICATOR OF POTASSIUM ADEQUACY
As part of its task, the committee was asked to update, as appropriate, the potassium AIs established in the 2005 DRI Report. Owing to the expanded DRI model, the conceptual approach for the potassium DRIs for adequacy in this report is different from that taken in the 2005 DRI Report described above. For instance, the committee reviewed evidence on the relationship between potassium intake and both blood pressure and kidney stone formation in the context of establishing potassium Chronic Disease Risk Reduction Intakes (CDRRs) (see Chapter 6). Furthermore, as discussed in Chapter 3, the challenges of identifying and characterizing salt sensitivity limit the committee’s ability to use it as a defining characteristic to inform the potassium and sodium DRIs.
To explore which additional indicators could potentially be used to characterize the distribution of potassium intake requirements within the apparently healthy population, the committee first considered aspects of potassium physiology, including adaptations of blood potassium concentration to various conditions and hypokalemia.1 In generally healthy individuals with normal kidney function, serum potassium concentrations are typically kept between 3.5 and 5.0 mmol/L. Homeostatic mechanisms that help to maintain this narrow range include shifting potassium between intracellular and extracellular fluid (internal balance) and retaining or excreting potassium, primarily through the urine (external balance). Dysregulation in either the internal or external balance mechanism can lead to hypokalemia, but each has different implications for total body potassium content. Intracellular shifts maintain total body potassium, whereas excessive potassium losses can decrease total body potassium.
Given the underlying mechanisms that regulate potassium homeostasis, hypokalemia can be caused by inadequate intake, excessive losses, or transcellular shifts. Potassium depletion studies have demonstrated that, among otherwise healthy adults, consuming 0–390 mg/d (0–10 mmol/d) can lead to hypokalemia (Hernandez et al., 1987; Huth et al., 1959; Jones et al., 1982; Kaess et al., 1971; Krishna et al., 1989; Squires and Huth, 1959). These levels of intake, however, are particularly extreme and have been studied over relatively short periods of time. Furthermore, given the external balance mechanisms, potassium can be conserved when intakes are low. As such, inadequate potassium intake is rarely the primary cause of hypokalemia. Instead, hypokalemia is often caused by abnormal losses (e.g., due to renal losses, gastrointestinal losses) and certain medications that promote transcellular shifts (Viera and Wouk, 2015). Clinically, altera-
___________________
1 Generally defined as serum potassium concentrations ≤ 3.5 mmol/L.
tions in blood potassium concentrations outside of the normal range are widely recognized to be detrimental to health and to increase risk of death (Hughes-Austin et al., 2017; Kardalas et al., 2018). For the purposes of determining potassium intake requirements, however, blood potassium concentrations and hypokalemia are not reliable indicators of usual potassium intake or status in the apparently healthy population.
From its information-gathering activities and literature scoping searches (see Appendix D), the committee was unable to identify a sensitive or specific biomarker of potassium status that could be used to determine the distribution of potassium requirements in the population. In the absence of such an indicator of potassium adequacy, the committee reviewed the evidence from balance studies.
Balance Studies
Balance studies measuring total intake and losses have been used in the past to assess adequacy based on the concept that neutral balance reflects homeostasis for the nutrient in adults. Such a neutral balance can be, and has been for some nutrients, interpreted as meeting the physiological requirement and, thus, informative to specify a DRI for adequacy (NASEM, 2018). For example, the EAR for calcium in adults was specified on the basis of calcium balance (IOM, 2011). Applying this rationale to potassium would mean that for an adult to be in neutral balance, intake would be equal to the sum of all potassium losses (sweat, urine, fecal, and other). Individuals with intakes less than losses would be considered in negative balance, indicating deficient intakes. Individuals with intakes greater than losses would be considered in positive balance. In states of growth, positive balance might be necessary to support tissue accretion and, thus, be adequate; in adults, positive balance might indicate intakes above those meeting physiological requirements. To have confidence in such balance studies, intake of potassium and losses by all routes need to be rigorously determined for a sufficient duration of time in controlled feeding studies to ensure that homeostasis has been achieved. In addition, rigorous balance studies must minimize confounding factors that could affect the interpretation of balance, such as bioavailability, physical activity, and high ambient temperature.
Evidence Presented in the 2005 DRI Report
The 2005 DRI Report provided an overview of topics related to potassium balance and considered the effects of heat and physical activity on potassium losses. Urinary potassium excretion was noted to increase at higher doses of potassium intake (Hene et al., 1986). Although potassium excretion was largely unaffected by sodium intake, sodium intakes above
6,900 mg/d (300 mmol/d) have been found to result in net potassium loss (Luft et al., 1982). Fecal potassium excretion reportedly ranged from approximately 112–850 mg/d (3–22 mmol/d) among individuals with potassium intakes of 2,600–2,900 mg/d (66–74 mmol/d) (Holbrook et al., 1984). Increased wheat fiber consumption increased fecal potassium losses (336–1,114 mg/d [9–29 mmol/d]) (Cummings et al., 1976). Serum potassium concentrations were at the lower end of the normal range among nonhypertensive adults maintaining potassium balance while consuming at least 1,564 mg/d (40 mmol/d) potassium (Sebastian et al., 1971).
The concentration of potassium lost in sweat, when sweat losses were minimal, has been found to range from 90–626 mg/L (2–16 mmol/L) (Consolazio et al., 1963). Changes in potassium concentrations in sweat were also assessed in relation to heat exposure and physical activity. Among seven healthy males, sweat potassium concentration was higher during exposure to 40°C (104°F) than during a running exercise (555 ± 180 versus 442 ± 121 mg/L [14 ± 5 versus 11 ± 3 mmol/L]) (Fukumoto et al., 1988). In a study of 12 unacclimatized men performing 6 hours of intermittent treadmill activity in 40°C (104°F) heat, potassium losses from sweat were estimated to be approximately 1,200 mg/d (32 mmol/d) (Armstrong et al., 1985). Among heat acclimatized individuals exposed to heat stress (40°C [104°F]), potassium loss from sweat was estimated to be approximately 2,300 mg/d (60 mmol/d) (Malhotra et al., 1976). An evaluation of three men who were exposed to high temperatures (38°C [100°F]) for 7.5 hours per day for 16 days found that sweat potassium concentrations decreased from 3,100 mg/d (79 mmol/d) on day 2 to 516 mg/d (13 mmol/d) by day 11 (Consolazio et al., 1963). A crossover study assessed potassium losses during a 4-day exercise regimen among eight men while they consumed two different levels of potassium intake (980 versus 3,100 mg/d [25 versus 80 mmol/d]) (Costill et al., 1982). The amount of potassium lost in sweat was reduced during the lower potassium diet phase (426 versus 481 mg/d [11 versus 12 mmol/d]). The 2005 DRI Report noted that heat exposure and physical activity can increase potassium losses through sweat.
Evidence from the Committee’s Supplemental Literature Searches
Studies of potassium balance in normotensive individuals are limited in number, rigor of design, and sample size (see Table 4-1). With the exception of a study in female adolescents described below (Palacios et al., 2010), no studies were identified in which rigorous and complete balance directly measured potassium content of foods consumed and all losses (urinary, fecal using appropriate fecal markers, and whole body sweat). Without the rigorous and direct determination of potassium intake through chemical analysis of the food consumed and the complete assessment of all potas-
TABLE 4-1 Potassium Balance Studies Summarized by Completeness of Assessment of Intake and Lossesa
| Study | Population |
|---|---|
| Complete Balance—Rigorous Assessment of Intake and All Losses | |
| Palacios et al., 2010 | 30 black and 20 white American adolescent females, 11–15 years of age |
| Incomplete Balance—Limitation on Loss Assessmente | |
| Kodama et al., 2005 | 109 Japanese males and females, 18–28 years of agef |
| Holbrook et al., 1984 | 12 healthy American adult males and 16 healthy American females, 20–53 years of age |
| Consolazio et al., 1963 | 3 healthy, young American adult males, ages not reported |
| Costill et al., 1982 | 8 American males in daily running training program, 20–41 years of age |
| Potassium Intake (mg/d) | Noted Design and Limitations | ||
|---|---|---|---|
| Negative Balance | Neutral Balance | Positive Balance | |
| 2,186b | 2,186c |
|
|
| 2,034g |
|
||
| 3,300h 2,400i |
|
||
| 2,493 |
|
||
| 975 | 3,120 |
|
|
| Study | Population |
|---|---|
| Squires and Huth, 1959 | 11 American males, ages not reported |
| Incomplete Balance—Limitation on Both Intake Assessment and Lossesj | |
| Hene et al., 1986 | 6 Dutch males, 24 ± 2 years of age |
| Tasevska et al., 2006 | 13 British adults, 23–66 years of age |
| Kirkendall et al., 1976 | 8 American males, 24–47 years of age |
NOTE: Intake values are presented in milligrams. To convert the milligram value to mmol, divide the intake level by 39.1.
aOnly studies reporting balance using crossover or sequential designs in the same participants at studied intakes for a minimum of 3 days are included. Studies using parallel arm randomized controlled trial designs were not included because intra-individual variability might confound results. Studies of hypertensive participants not included.
bFor white adolescent females consuming a low-sodium diet.
cFor black adolescent females consuming a low-sodium diet and for both black and white adolescent females consuming a high-sodium diet.
dSodium intakes in Palacios et al. (2010) were reported in the units of mmol/L/d; daily intakes of sodium were drawn from a separate publication on the same protocol (Palacios et al., 2004).
eIncomplete balance studies were limited by lack of direct assessment of one or more sources of potassium loss, typically either fecal or whole body sweat or both.
| Potassium Intake (mg/d) | Noted Design and Limitations | ||
|---|---|---|---|
| Negative Balance | Neutral Balance | Positive Balance | |
| < 39 546–624 975–1,053 |
|
||
| 3,120 8,580 |
|
||
| 4,743 |
|
||
| 3,912 |
|
||
fFrom a series of 11 balance studies.
gReported to be 39.2 mg/kg body weight; estimated total based on mean body weight (Nishimuta et al., 2012).
hAverage potassium intake of male participants (n = 12), based on analysis of 1 week’s worth of food and beverage samples collected four times over the course of 1 year.
iAverage potassium intake of female participants (n = 16), based on analysis of 1 week’s worth of food and beverage samples collected four times over the course of 1 year.
jIncomplete balance studies were limited by lack of direct assessment of potassium content in foods consumed and by lack of assessment of one or more sources of potassium losses as noted for each study.
kCoffee and tea consumed ad libitum; contributions to total potassium intake estimated. Total potassium likely underestimated.
sium losses through urine, feces, and sweat, a “true” balance cannot be determined. Especially when sample sizes are small, as they need to be in this type of expensive and meticulous metabolic study, balance may be misclassified by failing to either measure true intake or true loss. Several studies were limited by a lack of rigorous assessment of potassium intake or total losses or both.
A rigorously designed balance study was conducted in adolescent females with controlled potassium intakes (2,186 mg/d [56 mmol/d]) at a high and a low sodium intake level (4,000 and 1,300 mg/d [172 and 57 mmol/d], respectively) for 20 days each (Palacios et al., 2004, 2010). A small positive cumulative daily potassium retention in both white and black adolescents was found during high sodium intakes, but only in black adolescents during low sodium intakes. On low sodium intakes, a small negative cumulative daily potassium retention was reported in white adolescents. Average potassium balance for the entire 20-day experimental period was not reported, which makes it difficult to compare the results from this study to the other studies included in Table 4-1. Nonetheless, the committee interpreted these results as likely demonstrating slight positive potassium balance in adolescents, which may be affected by sodium intakes in white adolescents.
Committee’s Synthesis of the Evidence
Current balance studies have limitations and do not offer sufficient evidence for estimating average potassium needs or the distribution of physiological requirements in the apparently healthy population. The body of evidence is potentially confounded and not suitable for use for assessing the adequacy requirements for potassium. Recognizing these limitations, the committee noted that neutral balance was reported with intakes of approximately 2,000 mg/d (51 mmol/d) in one study (Kodama et al., 2005). Negative balance was reported with potassium intakes of less than 39–1,053 mg/d (1–27 mmol/d); negative balance was also found at higher potassium intakes, and appears to vary by factors such as exposure to heat, physical activity, and race/ethnicity.
DIETARY REFERENCE INTAKES OF POTASSIUM ADEQUACY
The committee’s review of the evidence on potential indicators to inform the potassium DRIs for adequacy revealed the following:
- There is no sensitive biomarker that can be used to characterize the distribution of potassium requirements in the apparently healthy population.
- Limitations in the design of the balance studies—particularly small sample size and incomplete measurement of intake and losses—precluded the committee from using such data to estimate median requirements and the distribution of requirements in the apparently healthy population.
The committee concludes that none of the reviewed indicators for potassium requirements offer sufficient evidence to establish Estimated Average Requirement (EAR) and Recommended Dietary Allowance (RDA) values. Given the lack of evidence of potassium deficiency in the population, median intakes observed in an apparently healthy group of people are appropriate for establishing the potassium Adequate Intake (AI) values.
The AI is “a recommended average daily nutrient intake level based on observed or experimentally determined approximations or estimates of nutrient intake by a group (or groups) of apparently healthy people who are assumed to be maintaining an adequate nutritional state” (IOM, 2006, p. 11). The concept apparently healthy people (or populations) underpins the DRI. Most commonly, the concept refers to the population to which the DRIs apply (see Chapter 1). In the context of setting an AI, however, the term is used to describe the group or groups of individuals whose data were used to derive the AI values. The apparently healthy group used to inform the AI values may be a subset of the apparently healthy population at large.
To derive the potassium AI values, the committee sought to identify a group of apparently healthy individuals whose usual potassium intake would not be affected by illness, medications use, or medical nutrition management. Antihypertensive medications are known to affect blood potassium concentrations, which may in turn affect potassium intake. Some classes of medication, such as angiotensin converting enzyme inhibitors, angiotensin II receptor blockers, and potassium-sparing diuretics can increase blood potassium concentrations, which could lead to diet modification to reduce potassium intake. Conversely, loop and thiazide diuretics can cause low blood potassium concentrations, which may lead to prescription of potassium supplements and an increase in dietary intake of potassium. Therefore, individuals on hypertensive medications would not necessarily reflect the nutritional status of potassium in a group of apparently healthy people, and would not be an appropriate population group to use to derive the potassium AIs. Furthermore, although the evidence was not sufficiently strong to use blood pressure as an indicator for establishing a potassium CDRR (see Chapter 6), there is evidence of a relationship between potassium intake (based on supplement trials) and
blood pressure, particularly among adults with hypertension.2 It is not possible to establish cause-and-effect relationships using a cross-sectional data source such as a national survey to estimate both nutrient intake and disease status. Therefore, it is possible that differences in potassium intakes by hypertension or cardiovascular disease status could reflect either direct or reverse causality; in the latter case, difference in intake would reflect a response to the disease, and not reflect an intake by an apparently healthy group of people.
The committee had available for its consideration the usual potassium intake distribution tables from two nationally representative surveys: the Canadian Community Health Survey–Nutrition 2015 (CCHS Nutrition 2015) and the National Health and Nutrition Examination Survey (NHANES) 2009–2014. The methodological approaches for collecting and analyzing the 24-hour dietary recalls were similar between the two surveys (CDC/NCHS, 2018; Statistics Canada, 2017; also see Appendix G); as such, their simultaneous consideration was deemed appropriate. As described below, the committee defined the “group of apparently healthy people” used to derive the potassium AI values for adults as normotensive males and females without a self-reported history of cardiovascular disease.
The committee considered three options for using the median intake data across the two different nationally representative surveys: (1) use the lowest median intake estimate within an age and sex group, (2) use a midpoint between the median intake estimates from the two surveys, or (3) use the highest median intake estimate within an age and sex group between the two surveys. Using the lowest of the median intakes to establish the potassium AI values was determined to be not appropriate, because of uncertainties of the effect of lower intakes on the population with higher median intake. Although using a midpoint of the two estimates would increase the AI values, averaging medians is not appropriate and still suffered from the issue of being below the higher median population intake. Accordingly, the committee considered the highest median intake across the two surveys, mathematically rounded, the most appropriate basis for establishing the potassium AI values. The committee applied this general approach across the DRI age, sex, and life-stage groups for individuals 1 year of age and older. For infants 0–12 months of age, potassium intake of breastfed infants was estimated to derive the potassium AI values. The sections that follow present additional details on the committee’s derivation of potassium AI values for each of the DRI age, sex, and life-stage groups.
___________________
2 This text was revised since the prepublication release.
Infants 0–12 Months of Age
Details of the committee’s approach to estimating the concentration of potassium in breast milk and the contributions of complementary foods to total potassium intake are provided in Appendix F. To establish the potassium AIs for infants 0–6 and 7–12 months of age, the committee estimated the potassium concentration in mature breast milk. Different concentrations are used for the two infant age groups in the estimates below, as the potassium content of breast milk changes over the course of the first year. To establish the potassium AI for infants 7–12 months of age, potassium intake from complementary foods was estimated and added to the estimated potassium intake from breast milk.
The potassium AI for infants 0–6 months of age is based on estimated potassium intakes from breast milk alone. The mean potassium concentration of breast milk for this age group was estimated to be 515 mg/L (13 mmol/L). Assuming an average breast milk consumption of 780 mL/d, the potassium AI for infants 0–6 months is established at 400 mg/d (10 mmol/d).
The potassium AI for infants 7–12 months of age is based on estimated potassium intakes from breast milk and complementary foods. The mean potassium concentration in breast milk for this age group was estimated to be 435 mg/L (11 mmol/L). Assuming an average breast milk consumption of 600 mL/d, approximately 260 mg/d (7 mmol/d) potassium is consumed from breast milk. Potassium intake from complementary foods was estimated to be 600 mg/d (15 mmol/d). The potassium AI for infants 7–12 months is therefore established at 860 mg/d (22 mmol/d). A summary of the infant potassium AI values is presented in Table 4-2.
Children and Adolescents 1–18 Years of Age
Despite having a general approach to establishing the potassium AIs (selecting the highest of the median usual potassium intakes across the two nationally representative surveys), the committee had two additional
TABLE 4-2 Potassium Adequate Intakes, Infants 0–12 Months of Age
| DRI Age, Sex, and Life-Stage Group | Potassium Adequate Intake, mg/d |
|---|---|
| Infants | |
| 0–6 months | 400 |
| 7–12 months | 860 |
NOTES: Intake values are presented in milligrams. To convert the milligram value to mmol, divide the intake level by 39.1. DRI = Dietary Reference Intake; mg/d = milligrams per day.
options to consider in its derivation of potassium AIs for children and adolescents 1–18 years of age, outlined below:
- Stratification by sex: The potassium AIs for adolescents 9–13 and 14–18 years of age could either be stratified by sex or be a single value for both males and females in each age range. Both CCHS Nutrition 2015 and NHANES 2009–2014 showed differences in potassium intake by sex in these age groups. As the committee’s premise for establishing the potassium AIs is that there is a lack of evidence for potassium deficiency in the population, the different median intakes are assumed to be adequate for each sex. To that end, the committee elected to stratify the AIs for the two older children’s age groups by sex. For children 1–3 and 4–8 years of age, DRIs are not typically stratified by sex. Data from CCHS Nutrition 2015, however, provided sex-stratified estimates of usual potassium intake for these two age categories. Rather than attempting to combine the male and female data from CCHS Nutrition 2015, the committee applied its general approach to select for each of these two age groups a single AI based on the available data (i.e., the highest median usual potassium intake among Canadian males, Canadian females, and U.S. males and females, per age group).
- Use of normotensive data: The NHANES 2009–2014 intake distribution tables stratified by hypertension status included the estimates for children and adolescents 8 years of age, 9–13 years of age, and 14–18 years of age. CCHS Nutrition 2015 did not assess blood pressure status for children (Statistics Canada, 2017). The committee had the option to use the normotensive-only data from NHANES 2009–2014, particularly for the two older children’s age groups. As the majority of children in these age groups were normotensive, the median usual potassium intakes from the normotensive-only data were nearly identical to the estimate for children of all blood pressure statuses; use of normotensive-only data would not have affected the selected potassium AIs for these DRI age, sex, and life-stage groups. NHANES 2009–2014 estimates presented in this section reflect the estimates of all blood pressure statuses.
Figure 4-1 presents the median potassium intakes among U.S. and Canadian children and adolescents 1–18 years of age; for context, the figure shows the potassium AIs that were established in the 2005 DRI Report. Median intakes were higher in the Canadian estimates, as compared to the U.S. estimates. As noted above, methods for collecting
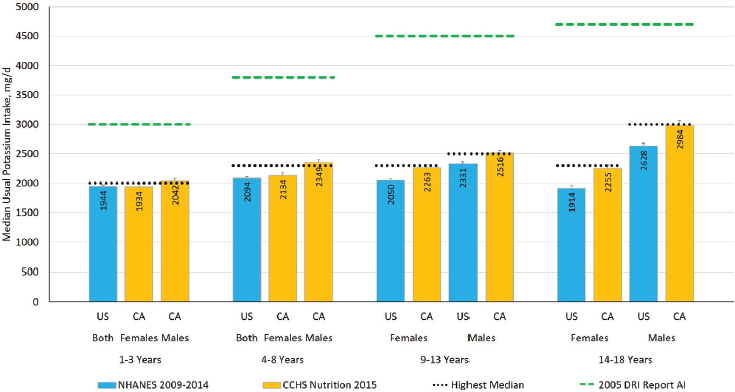
NOTES: The figure presents groups as provided in the data source. The green dashed lines are the potassium AIs that were established in the 2005 DRI Report. The black dotted line is the highest median potassium intake across two nationally representative surveys for each DRI age, sex, and life-stage group, mathematically rounded, which was used to establish the potassium AI values in this report. Intake values are presented in milligrams. To convert the milligram value to mmol, divide the intake level by 39.1. AI = Adequate Intake; CA = Canada; CCHS Nutrition 2015 = Canadian Community Health Survey–Nutrition 2015; NHANES = National Health and Nutrition Examination Survey; US = United States.
SOURCES: CCHS Nutrition 2015 (unpublished); NHANES 2009–2014 (unpublished).
24-hour dietary recalls, nutrient databases, and statistical methods used to estimate intakes were similar between the two analyses, and therefore would not be expected to explain these differences (for details of methodology, see Appendix G). The highest median intake for each DRI age, sex, and life-stage group, mathematically rounded, was used to establish the potassium AI values. The potassium AIs for children and adolescents 1–18 years of age are presented in Table 4-3.
Adults 19 Years of Age and Older
The committee defined the “group of apparently healthy people” used to derive the potassium AIs for adults as normotensive males and
TABLE 4-3 Potassium Adequate Intakes, Children and Adolescents 1–18 Years of Age
| DRI Age, Sex, and Life-Stage Group | Potassium Adequate Intake, mg/d |
|---|---|
| Children | |
| 1–3 years | 2,000 |
| 4–8 years | 2,300 |
| Males | |
| 9–13 years | 2,500 |
| 14–18 years | 3,000 |
| Females | |
| 9–13 years | 2,300 |
| 14–18 years | 2,300 |
NOTES: Intake values are presented in milligrams. To convert the milligram value to mmol, divide the intake level by 39.1. DRI = Dietary Reference Intake; mg/d = milligrams per day.
females 19 years of age and older, without a self-reported history of cardiovascular disease. CCHS Nutrition 2015 and NHANES 2009–2014 differed in their approaches to identifying and categorizing hypertension status and cardiovascular disease. CCHS Nutrition 2015 asked participants if a health professional had ever told them they had high blood pressure or had heart disease (Statistics Canada, 2017). The CCHS Nutrition 2015 data presented in this section reflect survey participants who reported that they did not have high blood pressure and that they did not have heart disease. NHANES 2009–2014 data, in contrast, identified normotensive adults based on the mean of up to three consecutive blood pressure measurements or use of hypertensive medications, using the 2017 American College of Cardiology and the American Heart Association guidelines for adults (Whelton et al., 2018). Questions also included whether a doctor or other health professional had ever told the participant they had a stroke or heart attack (myocardial infarction). The NHANES 2009–2014 data presented in this section reflect normotensive survey participants who reported that they did not have cardiovascular disease. The differences in the approach to categorizing hypertension status across the two surveys is a noted limitation; however, the alternative was to use usual median intake from the entire adult population, which would include individuals with hypertension and cardiovascular disease. Thus, the committee determined that, despite the methodological limitations of classifying blood pressure status, normotensive data were more likely to reflect a group of apparently healthy people than data from all survey participants.
The committee had two additional options to consider in its derivation of potassium AIs for adults 19 years of age and older, as outlined below:
- Stratification by sex: The potassium AIs for adults could either stratify by sex or be applicable to both males and females in age and life-stage group. The survey data showed sex differences in median usual potassium intakes. As the committee’s premise for establishing the potassium AIs is that there is a lack of evidence for potassium deficiency in the population, the different median intakes are assumed to be adequate for each sex. To that end, the committee elected to stratify the adult potassium AIs by sex.
- Stratification by age group: The DRI groups allow for age group–specific potassium AIs. Given the uncertainties associated with an AI, particularly as it relates to the requirements, the committee was concerned that different values for each age group would convey greater precision and certainty in the evidence than what is currently available. As such, the committee did not stratify the potassium AIs by adult age group.
Figure 4-2 presents the median usual potassium intakes among normotensive U.S. and Canadian adults; for context, the figure shows the potassium AIs that were established in the 2005 DRI Report. The updated potassium AIs for adults were established using the highest median intake across the two nationally representative surveys among the adults, mathematically rounded, stratified by sex. The AIs for adults 19 years of age and older are presented in Table 4-4.
Pregnancy
Very few estimates of body potassium stores during pregnancy are available. Evidence suggests that nearly all potassium accretion occurs during the final trimester of pregnancy (Butte et al., 2003; Forsum et al., 1988); potassium accretion during this time has been estimated to be 120 mg/d (3 mmol/d) (EFSA, 2016). Potassium balance and deposition may be affected by changes in hormones during pregnancy (Ehrlich and Lindheimer, 1972). Accretion rates and total potassium content in mature fetuses and full-term neonates progressively increase throughout pregnancy (EFSA, 2016).
Despite increases in mineralocorticoid activity and filtered potassium load that occur, healthy women do not normally develop hypokalemia during pregnancy (EFSA, 2016). Physiological changes that occur during pregnancy are associated with renal reabsorption of potassium. Urinary potassium excretion is maintained by adaptive mechanisms that adjust to
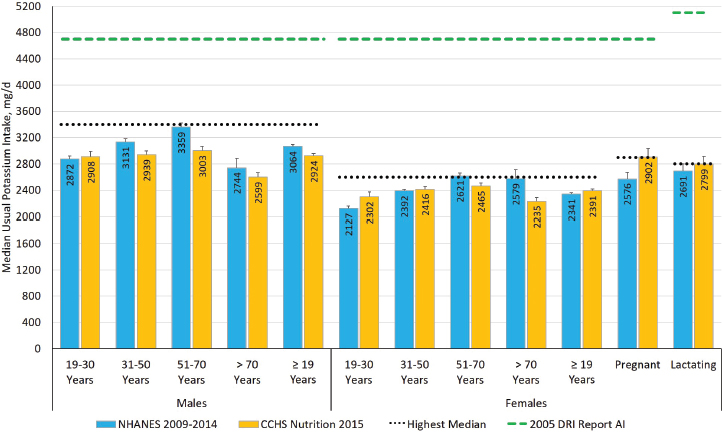
NOTES: The green dashed lines are the potassium AIs that were established in the 2005 DRI Report. The black dotted line is the highest median potassium intake across two nationally representative surveys for adult males, females, or life-stage group, mathematically rounded, which was used to establish the potassium AI values in this report. Intake values are presented in milligrams. To convert the milligram value to mmol, divide the intake level by 39.1. AI = Adequate Intake; CCHS Nutrition 2015 = Canadian Community Health Survey–Nutrition 2015; DRI = Dietary Reference Intake; NHANES = National Health and Nutrition Examination Survey.
SOURCES: CCHS Nutrition 2015 (unpublished); NHANES 2009–2014 (unpublished).
the increases in filtered potassium load and aldosterone-mediated retention of sodium (Brown et al., 1986; Cheung and Lafayette, 2013; Ehrlich and Lindheimer, 1972). The antikaliuretic effect of progesterone may contribute to the maintenance of potassium homeostasis in pregnant women (Lindheimer et al., 1987).
In the absence of evidence on differing requirements in pregnancy, the highest median usual potassium intake among pregnant females in the two nationally representative surveys is presumed to be adequate. For pregnant adolescent females, 14–18 years of age, the committee considered two options. One option would be to use the same potassium AI value for all pregnant females including those 14–18 years of age. The strength of this approach is that the potassium AI would be based on available intake data
TABLE 4-4 Potassium Adequate Intakes, Adults 19 Years of Age and Older
| DRI Age, Sex, and Life-Stage Group | Potassium Adequate Intake, mg/d |
|---|---|
| Males | |
| 19–30 years | 3,400 |
| 31–50 years | 3,400 |
| 51–70 years | 3,400 |
| > 70 years | 3,400 |
| Females | |
| 19–30 years | 2,600 |
| 31–50 years | 2,600 |
| 51–70 years | 2,600 |
| > 70 years | 2,600 |
NOTES: Intake values are presented in milligrams. To convert the milligram value to mmol, divide the intake level by 39.1. DRI = Dietary Reference Intake; mg/d = milligrams per day.
from pregnant females. However, the committee was concerned about the lack of representation of adolescent females among pregnant survey participants. Furthermore, if this approach were to be taken, the potassium AIs for pregnant adolescents would be 600 mg/d (15 mmol/d) more than for nonpregnant female adolescents of the same age (2,300 versus 2,900 mg/d [59 versus 74 mmol/d]). The second option would assume the pregnant survey participants were primarily adult females. The difference between the pregnant and nonpregnant adult female potassium AIs (300 mg/d [8 mmol/d]) could be added to the nonpregnant female adolescent potassium AI (2,300 mg/d [59 mmol/d]) to derive the pregnant adolescent potassium AI. The committee was concerned that different values for the pregnancy age groups would convey greater precision and certainty in the evidence than what is currently available. However, with no clear evidence that a 600 mg/d (15 mmol/d) increase is biologically warranted, the committee judged the second option was most appropriate. The potassium AI values for pregnant females are presented in Table 4-5.
Lactation
Little information exists on changes in body potassium content during lactation. Evidence from a study that measured total body potassium content found significantly greater losses in total body potassium content in lactating women, compared to nonlactating women (Butte and Hopkinson, 1998), suggesting that total body potassium content may decrease in lactating women. Potassium is excreted in breast milk (see the Infants
TABLE 4-5 Potassium Adequate Intakes, Pregnancy
| DRI Age, Sex, and Life-Stage Group | Potassium Adequate Intake, mg/d |
|---|---|
| Pregnancy | |
| 14–18 years | 2,600 |
| 19–30 years | 2,900 |
| 31–50 years | 2,900 |
NOTES: Intake values are presented in milligrams. To convert the milligram value to mmol, divide the intake level by 39.1. DRI = Dietary Reference Intake; mg/d = milligrams per day.
0–12 Months of Age section above), and the concentrations are determined by an electrical potential gradient (IOM, 1991). A systematic review assessing the effect of maternal diet on breast milk composition (Bravi et al., 2016) identified only one study in which potassium has been assessed; the study reported the correlation between maternal potassium intake and breast milk potassium composition to be −0.07 (Finley et al., 1985).
In the absence of evidence on differing requirements in lactation, the highest median usual potassium intake of lactating females in the two nationally representative surveys is presumed to be adequate. For lactating adolescent females, 14–18 years of age, the committee faced the same issues and concerns as for pregnant adolescent females (see above) and elected to take the same approach. The potassium AI values for lactating females are presented in Table 4-6.
SUMMARY OF UPDATED POTASSIUM ADEQUATE INTAKE VALUES
Aligned with the 2005 DRI Report, limitations in the evidence precluded the committee from establishing potassium EARs and RDAs. As such, potassium AIs were established. This report has updated the potassium AI values across the DRI age, sex, and life-stage groups. The revisions reflect, in part, the expanded DRI model. The potassium AIs established
TABLE 4-6 Potassium Adequate Intakes, Lactation
| DRI Age, Sex, and Life-Stage Group | Potassium Adequate Intake, mg/d |
|---|---|
| Lactation | |
| 14–18 years | 2,500 |
| 19–30 years | 2,800 |
| 31–50 years | 2,800 |
NOTES: Intake values are presented in milligrams. To convert the milligram value to mmol, divide the intake level by 39.1. DRI = Dietary Reference Intake; mg/d = milligrams per day.
in the 2005 DRI Report were derived from potassium supplement trials, which provided evidence that higher potassium intakes may confer benefits related to blood pressure and kidney stone reoccurrence. In the expanded DRI model, the committee has reviewed such evidence in context of establishing a potassium CDRR (see Chapter 6). A comparison of the potassium AIs established in this report and those that were established in the 2005 DRI Report is presented in Table 4-7.
TABLE 4-7 Comparison of Potassium Adequate Intakes Established in This Report to Potassium Adequate Intakes Established in the 2005 DRI Report
| DRI Age, Sex, and Life-Stage Group | Potassium AI Established in the 2005 DRI Report (mg/d) | Updated Potassium AI Values (mg/d) |
|---|---|---|
| Infants | ||
| 0–6 months | 400 | 400 |
| 7–12 months | 700 | 860 |
| Children | ||
| 1–3 years | 3,000 | 2,000 |
| 4–8 years | 3,800 | 2,300 |
| Males | ||
| 9–13 years | 4,500 | 2,500 |
| 14–18 years | 4,700 | 3,000 |
| 19–30 years | 4,700 | 3,400 |
| 31–50 years | 4,700 | 3,400 |
| 51–70 years | 4,700 | 3,400 |
| > 70 years | 4,700 | 3,400 |
| Females | ||
| 9–13 years | 4,500 | 2,300 |
| 14–18 years | 4,700 | 2,300 |
| 19–30 years | 4,700 | 2,600 |
| 31–50 years | 4,700 | 2,600 |
| 51–70 years | 4,700 | 2,600 |
| > 70 years | 4,700 | 2,600 |
| Pregnancy | ||
| 14–18 years | 4,700 | 2,600 |
| 19–30 years | 4,700 | 2,900 |
| 31–50 years | 4,700 | 2,900 |
| Lactation | ||
| 14–18 years | 5,100 | 2,500 |
| 19–30 years | 5,100 | 2,800 |
| 31–50 years | 5,100 | 2,800 |
NOTES: Intake values are presented in milligrams. To convert the milligram value to mmol, divide the intake level by 39.1. DRI = Dietary Reference Intake; mg/d = milligrams per day.
REFERENCES
Armstrong, L. E., R. W. Hubbard, P. C. Szlyk, W. T. Matthew, and I. V. Sils. 1985. Voluntary dehydration and electrolyte losses during prolonged exercise in the heat. Aviation Space and Environmental Medicine 56(8):765-770.
Bravi, F., F. Wiens, A. Decarli, A. Dal Pont, C. Agostoni, and M. Ferraroni. 2016. Impact of maternal nutrition on breast-milk composition: A systematic review. American Journal of Clinical Nutrition 104(3):646-662.
Brown, M. A., M. J. Sinosich, D. M. Saunders, and E. D. Gallery. 1986. Potassium regulation and progesterone-aldosterone interrelationships in human pregnancy: A prospective study. American Journal of Obstetrics and Gynecology 155(2):349-353.
Butte, N. F., and J. M. Hopkinson. 1998. Body composition changes during lactation are highly variable among women. Journal of Nutrition 128(2 Suppl):381s-385s.
Butte, N. F., K. J. Ellis, W. W. Wong, J. M. Hopkinson, and E. O. Smith. 2003. Composition of gestational weight gain impacts maternal fat retention and infant birth weight. American Journal of Obstetrics and Gynecology 189(5):1423-1432.
CDC/NCHS (Centers for Disease Control and Prevention/National Center for Health Statistics). 2018. National Health and Nutrition Examination Survey. https://www.cdc.gov/nchs/nhanes/index.htm (accessed October 23, 2018).
Cheung, K. L., and R. A. Lafayette. 2013. Renal physiology of pregnancy. Advances in Chronic Kidney Disease 20(3):209-214.
Consolazio, C. F., L. O. Matoush, R. A. Nelson, R. S. Harding, and J. E. Canham. 1963. Excretion of sodium, potassium, magnesium and iron in human sweat and the relation of each to balance and requirements. Journal of Nutrition 79:407-415.
Costill, D. L., R. Cote, and W. J. Fink. 1982. Dietary potassium and heavy exercise: Effects on muscle water and electrolytes. American Journal of Clinical Nutrition 36(2):266-275.
Cummings, J. H., M. J. Hill, D. J. Jenkins, J. R. Pearson, and H. S. Wiggins. 1976. Changes in fecal composition and colonic function due to cereal fiber. American Journal of Clinical Nutrition 29(12):1468-1473.
EFSA NDA Panel (European Food Safety Authority Panel on Dietetic Products, Nutrition and Allergies). 2016. Scientific opinion on dietary reference values for potassium. EFSA Journal 14(10):4592.
Ehrlich, E. N., and M. D. Lindheimer. 1972. Effect of administered mineralocorticoids or ACTH in pregnant women. Attenuation of kaliuretic influence of mineralocorticoids during pregnancy. Journal of Clinical Investigation 51(6):1301-1309.
Finley, D. A., B. Lonnerdal, K. G. Dewey, and L. E. Grivetti. 1985. Inorganic constituents of breast milk from vegetarian and nonvegetarian women: Relationships with each other and with organic constituents. Journal of Nutrition 115(6):772-781.
Forsum, E., A. Sadurskis, and J. Wager. 1988. Resting metabolic rate and body composition of healthy Swedish women during pregnancy. American Journal of Clinical Nutrition 47(6):942-947.
Fukumoto, T., T. Tanaka, H. Fujioka, S. Yoshihara, T. Ochi, and A. Kuroiwa. 1988. Differences in composition of sweat induced by thermal exposure and by running exercise. Clinical Cardiology 11(10):707-709.
Hene, R. J., H. A. Koomans, P. Boer, and E. J. Dorhout Mees. 1986. Adaptation to chronic potassium loading in normal man. Mineral and Electrolyte Metabolism 12(3):165-172.
Hernandez, R. E., M. Schambelan, M. G. Cogan, J. Colman, R. C. Morris, Jr., and A. Sebastian. 1987. Dietary NaCl determines severity of potassium depletion-induced metabolic alkalosis. Kidney International 31(6):1356-1367.
Holbrook, J. T., K. Y. Patterson, J. E. Bodner, L. W. Douglas, C. Veillon, J. L. Kelsay, W. Mertz, and J. C. Smith, Jr. 1984. Sodium and potassium intake and balance in adults consuming self-selected diets. American Journal of Clinical Nutrition 40(4):786-793.
Hughes-Austin, J. M., D. E. Rifkin, T. Beben, R. Katz, M. J. Sarnak, R. Deo, A. N. Hoofnagle, S. Homma, D. S. Siscovick, N. Sotoodehnia, B. M. Psaty, I. H. de Boer, B. Kestenbaum, M. G. Shlipak, and J. H. Ix. 2017. The relation of serum potassium concentration with cardiovascular events and mortality in community-living individuals. Clinical Journal of the American Society of Nephrology 12(2):245-252.
Huth, E. J., R. D. Squires, and J. R. Elkinton. 1959. Experimental potassium depletion in normal human subjects. II. Renal and hormonal factors in the development of extracellular alkalosis during depletion. Journal of Clinical Investigation 38(7):1149-1165.
IOM (Institute of Medicine). 1991. Nutrition during lactation. Washington, DC: National Academy Press.
IOM. 2005. Dietary Reference Intakes for water, potassium, sodium, chloride, and sulfate. Washington, DC: The National Academies Press.
IOM. 2006. Dietary Reference Intakes: The essential guide to nutrient requirements. Washington, DC: The National Academies Press.
IOM. 2011. Dietary Reference Intakes for calcium and vitamin D. Washington, DC: The National Academies Press.
Jones, J. W., A. Sebastian, H. N. Hulter, M. Schambelan, J. M. Sutton, and E. G. Biglieri. 1982. Systemic and renal acid-base effects of chronic dietary potassium depletion in humans. Kidney International 21(2):402-410.
Kaess, H., G. Schliert, W. Ehlers, J. G. von Mikulicz-Radecki, P. Hassenstein, K. Walter, W. Brech, and J. Hengstmann. 1971. The carbohydrate metabolism of normal subjects during potassium depletion. Diabetologia 7(2):82-86.
Kardalas, E., S. A. Paschou, P. Anagnostis, G. Muscogiuri, G. Siasos, and A. Vryonidou. 2018. Hypokalemia: A clinical update. Endocrine Connections 7(4):R135-R146.
Kirkendall, A. M., W. E. Connor, F. Abboud, S. P. Rastogi, T. A. Anderson, and M. Fry. 1976. The effect of dietary sodium chloride on blood pressure, body fluids, electrolytes, renal function, and serum lipids of normotensive man. Journal of Laboratory and Clinical Medicine 87(3):411-434.
Kodama, N., E. Morikuni, N. Matsuzaki, Y. H. Yoshioka, H. Takeyama, H. Yamada, H. Kitajima, and M. Nishimuta. 2005. Sodium and potassium balances in Japanese young adults. Journal of Nutritional Science and Vitaminology 51(3):161-168.
Krishna, G. G., E. Miller, and S. Kapoor. 1989. Increased blood pressure during potassium depletion in normotensive men. New England Journal of Medicine 320(18):1177-1182.
Lindheimer, M. D., D. A. Richardson, E. N. Ehrlich, and A. I. Katz. 1987. Potassium homeostasis in pregnancy. Journal of Reproductive Medicine 32(7):517-522.
Luft, F. C., M. H. Weinberger, and C. E. Grim. 1982. Sodium sensitivity and resistance in normotensive humans. American Journal of Medicine 72(5):726-736.
Malhotra, M. S., K. Sridharan, and Y. Venkataswamy. 1976. Potassium losses in sweat under heat stress. Aviation, Space, and Environmental Medicine 47(5):503-504.
NASEM (National Academies of Sciences, Engineering, and Medicine). 2017. Guiding principles for developing Dietary Reference Intakes based on chronic disease. Washington, DC: The National Academies Press.
NASEM. 2018. Harmonization of approaches to nutrient reference values: Applications to young children and women of reproductive age. Washington, DC: The National Academies Press.
Newberry, S. J., M. Chung, C. A. M. Anderson, C. Chen, Z. Fu, A. Tang, N. Zhao, M. Booth, J. Marks, S. Hollands, A. Motala, J. K. Larkin, R. Shanman, and S. Hempel. 2018. Sodium and potassium intake: Effects on chronic disease outcomes and risks. Rockville, MD: Agency for Healthcare Research and Quality.
Nishimuta, M., N. Kodama, M. Shimada, Y. Yoshitake, N. Matsuzaki, and E. Morikuni. 2012. Estimated equilibrated dietary intakes for nine minerals (Na, K, Ca, Mg, P, Fe, Zn, Cu, and Mn) adjusted by mineral balance medians in young Japanese females. Journal of Nutritional Science and Vitaminology 58(2):118-128.
Palacios, C., K. Wigertz, B. R. Martin, L. Jackman, J. H. Pratt, M. Peacock, G. McCabe, and C. M. Weaver. 2004. Sodium retention in black and white female adolescents in response to salt intake. Journal of Clinical Endocrinology and Metabolism 89(4):1858-1863.
Palacios, C., K. Wigertz, B. R. Martin, M. Braun, J. H. Pratt, M. Peacock, and C. M. Weaver. 2010. Racial differences in potassium homeostasis in response to differences in dietary sodium in girls. American Journal of Clinical Nutrition 91(3):597-603.
Sebastian, A., E. McSherry, and R. C. Morris, Jr. 1971. Renal potassium wasting in renal tubular acidosis (RTA): Its occurrence in types 1 and 2 RTA despite sustained correction of systemic acidosis. Journal of Clinical Investigation 50(3):667-678.
Squires, R. D., and E. J. Huth. 1959. Experimental potassium depletion in normal human subjects. I. Relation of ionic intakes to the renal conservation of potassium. Journal of Clinical Investigation 38(7):1134-1148.
Statistics Canada. 2017. Canadian Community Health Survey–Nutrition (CCHS). http://www23.statcan.gc.ca/imdb/p2SV.pl?Function=getSurvey&SDDS=5049 (accessed October 23, 2018).
Tasevska, N., S. A. Runswick, and S. A. Bingham. 2006. Urinary potassium is as reliable as urinary nitrogen for use as a recovery biomarker in dietary studies of free living individuals. Journal of Nutrition 136(5):1334-1340.
Viera, A. J., and N. Wouk. 2015. Potassium disorders: Hypokalemia and hyperkalemia. American Family Physician 92(6):487-495.
Whelton, P. K., R. M. Carey, W. S. Aronow, D. E. Casey, Jr., K. J. Collins, C. Dennison Himmelfarb, S. M. DePalma, S. Gidding, K. A. Jamerson, D. W. Jones, E. J. MacLaughlin, P. Muntner, B. Ovbiagele, S. C. Smith, Jr., C. C. Spencer, R. S. Stafford, S. J. Taler, R. J. Thomas, K. A. Williams, Sr., J. D. Williamson, and J. T. Wright, Jr. 2018. 2017 ACC/AHA/AAPA/ABC/ACPM/AGS/APHA/ASH/ASPC/NMA/PCNA guideline for the prevention, detection, evaluation, and management of high blood pressure in adults: A report of the American College of Cardiology/American Heart Association Task Force on Clinical Practice Guidelines. Hypertension 71(6):e13-e115.


