
10
Sodium: Dietary Reference Intakes Based on Chronic Disease
This chapter presents the evidence on indicators to inform the sodium Chronic Disease Risk Reduction Intake (CDRR) and the committee’s derivation of CDRR reference values for the Dietary Reference Intake (DRI) age, sex, and life-stage groups. In its application of the Guiding Principles for Developing Dietary Reference Intakes Based on Chronic Disease (Guiding Principles Report) (NASEM, 2017), the committee first reviewed the evidence on potential indicators and assessed the strength of evidence for causal relationships using the Grading of Recommendations Assessment, Development and Evaluation (GRADE) system. This assessment informed the selection of biologically interrelated indicators with moderate or high strength of evidence for causal relationships. The committee characterized and graded the intake–response relationships between sodium intake and the selected indicators, which informed the sodium CDRR values.1
REVIEW AND SELECTION OF CHRONIC DISEASE INDICATORS
The Guiding Principles Report recommended:
The ideal outcome used to establish chronic disease [DRIs] should be the chronic disease of interest, as defined by accepted diagnostic criteria,
___________________
1 The terminology “intake–response” is used for consistency with the DRI organizing framework (see Chapter 1, Box 1-2) and the Guiding Principles Report (NASEM, 2017). Terminology commonly used in the literature and under the GRADE system is “dose–response.”
including composite endpoints, when applicable. Surrogate markers could be considered with the goal of using the findings as supporting information of results based on the chronic disease of interest. (NASEM, 2017, p. 123)
In accordance with this guidance and the first step of the DRI organizing framework (see Chapter 1, Box 1-2), the committee reviewed evidence for the causal relationship between sodium intake and indicators that could potentially inform the sodium CDRRs, which included chronic disease endpoints and surrogate markers (see Table 10-1).
Evidence on the relationship between sodium intake and the potential indicators reviewed in this chapter was drawn primarily from the Agency for Healthcare Research and Quality systematic review, Sodium and Potassium Intake: Effects on Chronic Disease Outcomes and Risks (AHRQ Systematic Review) (Newberry et al., 2018). The evidence contained herein therefore reflects the methodologies taken in the AHRQ Systematic Review, including the approach to the literature search and application of the inclusion/exclusion criteria. The section that follows describes the committee’s approach to using the evidence provided in the
TABLE 10-1 Potential Chronic Disease Indicators Reviewed for a Causal Relationship with Sodium Intake, in Order of Presentation
| Indicator | 2005 DRI Report | AHRQ Systematic Review | Committee’s Supplemental Literature Search |
|---|---|---|---|
| Cardiovascular disease morbidity and mortality | X | ||
| Hypertension | X | X | |
| Blood pressure | X | X | |
| Cardiovascular disease mortalitya | X | X | |
| Strokea | X | X | |
| Myocardial infarctiona | X | ||
| Left ventricular mass and gross morbiditya | Xb | X | |
| Osteoporosis and related indicatorsa | Xc | X | |
| Kidney diseasea | X | ||
| All-cause mortalitya | X |
NOTE: AHRQ = Agency for Healthcare Research and Quality; DRI = Dietary Reference Intake.
aIndicators were reviewed as potentially informing the sodium CDRRs, but were ultimately not selected. A summary of evidence on these indicators is presented in Annex 10-1.
bThe 2005 DRI Report reviewed evidence on left ventricular mass.
cThe 2005 DRI Report reviewed evidence on bone demineralization.
AHRQ Systematic Review. The committee also conducted supplementary literature searches for select indicators not included in the AHRQ Systematic Review (for additional information, see Appendixes D and E).
Approach to Reviewing Indicators
Use of Different Study Designs
In its application of the Guiding Principles Report (NASEM, 2017), the committee considered the use of evidence from different study designs in its derivation of the sodium CDRRs. As compared to randomized controlled trials, observational studies are inherently weaker for establishing causal relationships and begin at a lower strength of evidence rating in the GRADE system (Guyatt et al., 2011a). The strength of evidence from observational studies can be upgraded, for instance, when the relationship cannot be explained by uncontrolled confounding, when there is a large effect size, or when there is a strong intake–response relationship.
Observational studies exploring relationships between sodium intake and chronic disease outcomes often have methodological issues (Cobb et al., 2014). The AHRQ Systematic Review accounted for such issues by assessing the risk of bias of individual studies, which was one of the domains used to determine the strength-of-evidence grade for the body of evidence. Nearly all observational studies that met the inclusion criteria for the AHRQ Systematic Review were rated as having moderate or high overall risk of bias (Newberry et al., 2018). The AHRQ Systematic Review, in turn, rated the strength of the body of evidence for associations between sodium intake and each of the indicators was assessed as either low or insufficient (Newberry et al., 2018). The AHRQ Systematic Review did not conduct meta-analyses on the results of these observational studies, as pooling results from observational studies with varied designs is not appropriate.
The committee reviewed the evidence from observational studies included in the AHRQ Systematic Review on potential J- or U-shaped relationships between sodium intake and health outcomes (for details on the committee’s assessment of the evidence, see Chapter 8). Certain intake assessment methodologies that are often used in observational studies produce estimates of sodium intake with systematic and random errors that can lead to spurious changes in size and directionality of the overall effect on the outcome of interest (for strengths and limitations of common sodium intake assessment methodologies, see Chapter 3). Therefore, in agreement with the AHRQ Systematic Review, the committee found insufficient evidence for an inverse relationship between low sodium intake levels (below 2,300 mg/d [100 mmol/d]) and risk of
the following health outcomes: all-cause mortality, cardiovascular disease mortality, combined cardiovascular disease morbidity and mortality, and heart failure.
Given the limitations of the observational studies outlined above, the committee agreed with a concept described in the AHRQ Systematic Review, which stated that “if the [randomized controlled trial] evidence is robust, observational studies may not contribute to strengthening the evidence unless they are high quality studies with large, precise effect sizes” (Newberry et al., 2018, p. 23). The committee therefore decided that if there was sufficient strength of evidence from trials alone, only such evidence would be used to establish the sodium CDRRs. Individual observational studies rated as having low risk of bias could serve as supportive evidence, particularly when evidence from randomized controlled trials were few or unavailable, but such studies would not serve as the sole evidence used to derive the sodium CDRRs. The committee acknowledges that relying primarily on randomized controlled trials limits the range of sodium intakes that have been evaluated. For example, the only studies on cardiovascular disease outcomes meeting the inclusion criteria of the AHRQ Systematic Review that characterized groups with sodium intakes below 2,300 mg/d (100 mmol/d) and above 4,100 mg/d (178 mmol/d) were observational. However, the insufficient strength of this body of evidence precluded the committee from using it to establish the sodium CDRRs. In sum, the committee focused primarily on evidence from randomized controlled trials and, as necessary, observational studies rated as having a low risk of bias.
Committee-Conducted Meta-Analyses
The committee rated the AHRQ Systematic Review as being of moderate quality, as guided by AMSTAR 2 criteria (for additional details, see Appendix C).2 One of the domains that the AHRQ Systematic Review did not adequately cover relates to the investigation and explanation of the causes of heterogeneity in the results of meta-analyses. The committee determined that exploring sources of heterogeneity was essential for fully evaluating the strength of evidence, particularly when inconsistency was a concern in the body of evidence (for an explanation of the importance of explaining heterogeneity, see Chapter 2). Thus, the committee undertook analyses to explore any heterogeneity for four indicators:
___________________
2 AMSTAR stands for A Measurement Tool to Assess Systematic Reviews.
cardiovascular disease morbidity and mortality, hypertension, systolic blood pressure, and diastolic blood pressure. Box 10-1 provides an overview of the committee’s approach to the meta-analyses it conducted. For meta-analyses of more than 10 trials, the committee examined publication bias, which was not assessed in the AHRQ Systematic Review (see Box 10-1 for overview of methods used by the committee). The committee’s approach also included evidence-based revisions to some of the data included in the AHRQ Systematic Review meta-analyses (see Box 10-2).
Review of Evidence on Indicators
The sections that follow present the body of evidence for a causal relationship between sodium intake and four indicators: cardiovascular disease incidence, hypertension incidence, systolic blood pressure, and diastolic blood pressure. For context, evidence and conclusions presented in the 2005 DRI Report and in the AHRQ Systematic Review are summarized for each of the indicators; the committee, however, relied on its analyses to assess the strength of the evidence. Potential indicators that were reviewed by the committee but not selected to inform the sodium CDRRs are presented as an annex to this chapter (see Annex 10-1).
Cardiovascular Disease Morbidity and Mortality
As summarized in Box 10-3, evidence on the relationship between sodium intake and cardiovascular disease morbidity and mortality was included in both the 2005 DRI Report (IOM, 2005) and the AHRQ Sys-
tematic Review (Newberry et al., 2018). The committee’s assessment of the evidence built on the meta-analyses presented in the AHRQ Systematic Review. The committee reviewed the trials in the meta-analyses included in the AHRQ Systematic Review for two outcomes: (1) “any cardiovascular disease” and (2) “combined cardiovascular disease morbidity and mortality.” Many of the studies were short term, some lasting only 8 weeks, with very few cardiovascular disease events, some as low as one to three outcomes. The AHRQ Systematic Review included these studies using a continuity correction, leading to very wide confidence intervals (CIs) and an appearance of heterogeneity. Because a nutritional intervention in healthy individuals is unlikely to lead to effects on cardiovascular disease incidence or mortality within a very short period of time, the committee reanalyzed the evidence restricting inclusion to studies lasting at least 1 year. Trials of cardiovascular disease mortality among those with preexisting cardiovascular disease were also excluded. With these changes, the results of the committee’s meta-analysis is based on five trials.
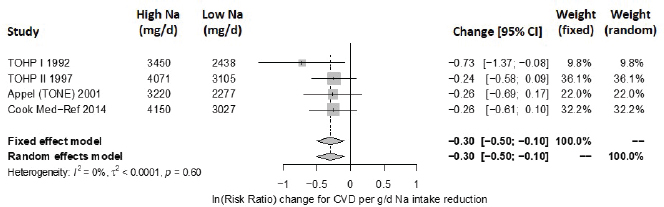
Results from the committee’s analyses The inclusion of small studies of short duration in the AHRQ Systematic Review led to the appearance of inconsistency and imprecision. As presented in Figure 10-1, using the five trials of at least 1 year and hazard ratios from survival analyses led to stronger results (risk ratio [RR] = 0.72 [95% CI: 0.59, 0.89]) than were reported in the AHRQ Systematic Review analyses for trials of any cardiovascular disease incidence and/or cardiovascular disease mortality.3 The revised analyses exhibited no heterogeneity across trials (I2 = 0 percent). When trials using salt substitutes were excluded from the meta-analysis, three large trials of
___________________
3 Cardiovascular disease events actually collected in the individual five studies were myocardial infarction, angina, congestive heart failure, coronary revascularization, stroke, transient ischemic attack, arrhythmia, or other.
cardiovascular disease incidence remained,4 and the overall risk ratio was 0.74 ([95% CI: 0.58, 0.93], I2 = 0 percent) (see Figure 10-2). There were too few studies to evaluate potential publication bias. These three studies are long-term follow-ups of randomized controlled trials of various lifestyle
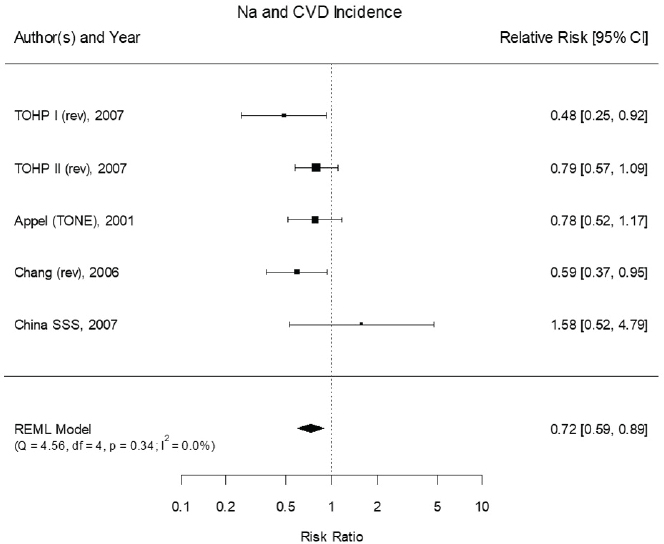
NOTES: Studies using salt substitutes are included. Meta-analysis was conducted in R with random-effects models in the metafor package. The variance was estimated using the REML approach. For comparison, in a fixed-effects meta-analysis the overall risk ratio was 0.72 [95% CI: 0.59, 0.89]. China SSS = China Salt Substitute Study; CI = confidence interval; CVD = cardiovascular disease; df = degrees of freedom; I2 = statistic that describes the percent of variation across studies due to heterogeneity; Na = sodium; Q = Q statistic; REML = restricted maximum likelihood; rev = revised as compared to estimate used in the AHRQ Systematic Review; TOHP = Trials of Hypertension Prevention; TONE = Trial of Nonpharmacologic Interventions in the Elderly.
SOURCES: Appel et al., 2001; Chang et al., 2006; Cook et al., 2007; CSSSCG, 2007.
___________________
4 Cardiovascular disease event collected in the individual three studies were myocardial infarction, angina, congestive heart failure, coronary revascularization, stroke, transient ischemic attack, arrhythmia, or other.
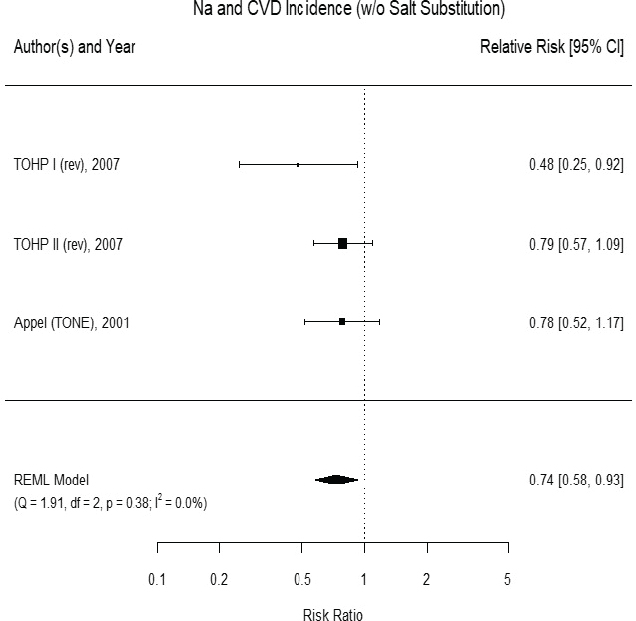
NOTES: Meta-analysis was conducted in R with random-effects models in the metafor package. The variance was estimated using the REML approach. For comparison, in a fixed-effects meta-analysis the overall risk ratio was 0.74 [95% CI: 0.58, 0.93]. CI = confidence interval; CVD = cardiovascular disease; df = degrees of freedom; I2 = statistic that describes the percent of variation across studies due to heterogeneity; Na = sodium; Q = Q statistic; REML = restricted maximum likelihood; rev = revised as compared to estimate used in the AHRQ Systematic Review; TOHP = Trials of Hypertension Prevention; TONE = Trial of Nonpharmacologic Interventions in the Elderly; w/o = without.
SOURCES: Appel et al., 2001; Cook et al., 2007.
interventions, including interventions with a single aim of sodium intake reduction as summarized below:
- For Trials of Hypertension Prevention (TOHP) I and II, the interventions in the initial trial period were dietary and behavioral counseling on reducing sodium intake without changing other
-
nutrient intakes. Participants in the control group followed their usual diets in addition to general guidance on healthy eating. The objective of the initial sodium reduction interventions in TOHP I and II was to examine the effect on blood pressure, whereas the follow-up studies compared cardiovascular disease events (15–18 years of follow-up) and mortality (23–26 years of follow-up) between the sodium intake reduction groups and the control groups. These follow-up studies, which are extensions of the TOHP I and II trials, have the randomized attributes of trials. That is, in contrast to observational studies in which selection bias will lead to distinct groups—and methods to adjust for baseline differences are paramount—allocation into the intervention groups is unbiased (i.e., selection bias is controlled) and baseline characteristics of the intervention groups should be similar. With respect to outcome assessment and compliance, the lack of measures to ensure compliance and the assessment of outcomes based on intention-to-treat in the TOHP I and II follow-up studies would bias the results to the null; therefore, if a difference between interventions can be found under the conditions of these follow-up studies then these differences will likely be found also under the strict follow-up schedule and compliance considered in a trial.
- Similar to TOHP I and II, the sodium reduction intervention in the Trial of Nonpharmacologic Interventions in the Elderly (TONE) was focused on modifying only sodium intake rather than a comprehensive diet change, with the objective of examining the effect on blood pressure. The initial trial examined the effects of sodium reduction on blood pressure among patients with hypertension who were withdrawn from medication. During the long-term follow-up period (mean 27.8 months), cardiovascular events were compared between the control and intervention groups.
Updated strength-of-evidence evaluation Using GRADE and the additional analyses described above, the committee reassessed the strength of evidence for the causal relationship between sodium intake reduction and reduction in cardiovascular disease incidence (see Table 10-2). The strength of evidence was assessed as moderate owing to imprecision related to the relatively low total number of events observed across studies (< 300) when excluding salt-substitute studies. The committee recognizes that the evidence derived from three studies that are long-term follow-ups to trials with lifestyle interventions to reduce sodium intake. Thus, there are two possible ways in which factors other than sodium intake contribute to differences in effects on cardiovascular disease incidence. One possibility is that the lifestyle interventions resulted in changes in dietary patterns other than reduced sodium intake. The
TABLE 10-2 GRADE Assessment Table: Sodium Reduction and Cardiovascular Disease Incidence
| GRADE Criteria | Ratinga |
|---|---|
| Outcome: Incidence of Cardiovascular Disease Events | |
| Study design | High |
| Risk of bias | No (0) |
| Inconsistency | No (0) |
| Indirectness | No (0) |
| Imprecision | Serious (−1) |
| Publication bias | Not measured |
| Other | None (0) |
aTable format adapted from Ryan and Hill (2016). Possible ratings as follows:
- For Study Design, strength-of-evidence rating for randomized controlled trials starts as “High” and for nonrandomized controlled trials starts as “Low”
- For Risk of Bias, Inconsistency, Indirectness, and Imprecision, the possible ratings are “No (0)” (no change), “Serious (−1)” (downgrade one level), or “Very serious (−2)” (downgrade two levels)
other possibility is that the intervention only occurred during the initial trial, so it is possible that sodium intake changed during the long-term follow-up period. Under GRADE, if these possibilities were considered serious, the strength of evidence could be down rated because of indirectness. However, these concerns were not serious enough to warrant a down rating due to the following three reasons. First, the counseling interventions in the TOHP and TONE trials were highly targeted and designed specifically to reduce sodium without changing other foods or nutrients (Appel et al., 2001; Kumanyika et al., 2005). Second, any deviation during the follow-up period from the
| Reasons for Rating | Strength of Evidenceb |
|---|---|
| Randomized controlled trials. | |
| All studies have low or moderate risk of bias. | |
| No statistical heterogeneity was detected. All study point estimates were in the same direction. | |
| Evidence directly answers the question of interest in terms of relevant populations, interventions, comparators, and outcomes. No change in overall results with inclusion of salt-substitution studies, which are more indirect because they also involve increases in other nutrients, usually potassium. Although interventions were not continued during long-term follow-up, post-intervention changes to sodium intake would tend to bias toward the null. Moreover, adherence and loss to follow-up were nondifferential and unlikely to introduce bias. | |
| Statistically significant summary effect, with meaningful size of effect (26–28 percent change in hazard ratio). However, when salt-substitution studies are excluded, upper confidence bound of 0.93 would imply a substantially smaller size of effect (7 percent change) and total cardiovascular disease events number < 300 across studies. | |
| Too few studies for analysis of publication bias. | |
| No additional upgrading factors. | |
- For Publication Bias, the ratings are “Undetected (0)” (no change) or “Strongly suspected (−1)” (downgrade one level)
- Other ratings, if present, are “Large effect,” “Intake–response,” and/or “No plausible confounding” along with “(+1)” or “(+2)” depending on whether upgrade is one or two levels
bThis terminology was used for consistency with the AHRQ Systematic Review. Preferred terminology under the GRADE system is certainty of the evidence or quality of the evidence.
interventions’ intent of reducing sodium intake would tend to bias toward the null and therefore reduce the effect size. Finally, adherence rate and loss to follow-up in the control and intervention groups were not different enough to raise concerns about introducing bias in the results.
Hypertension
As summarized in Box 10-4, evidence on the relationship between sodium intake and hypertension was included in both the 2005 DRI Report
(IOM, 2005) and the AHRQ Systematic Review (Newberry et al., 2018). The committee’s assessment of the evidence built on the meta-analyses presented in the AHRQ Systematic Review. The committee’s meta-analysis of hypertension is based on the three trials in nonpregnant individuals that were included in the AHRQ Systematic Review. Each trial was evaluated for appropriate inclusion and revisions were made, as summarized in Box 10-2.
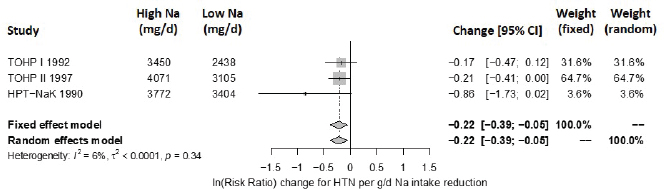
Results from the committee’s analyses With the committee’s selection of studies and updated extracted data, the overall estimate of the effect of a sodium reduction on hypertension was strengthened. The revised estimated relative risk was 0.79 [95% CI: 0.67, 0.93], with no apparent heterogeneity across studies (I2 = 0 percent) (see Figure 10-3). There were too few studies to evaluate potential publication bias.
Updated strength-of-evidence evaluation Using GRADE and the additional analysis described above, the committee reassessed the strength of evidence for a causal relationship between sodium intake reduction and reduction in hypertension incidence (see Table 10-3). The strength of evidence was
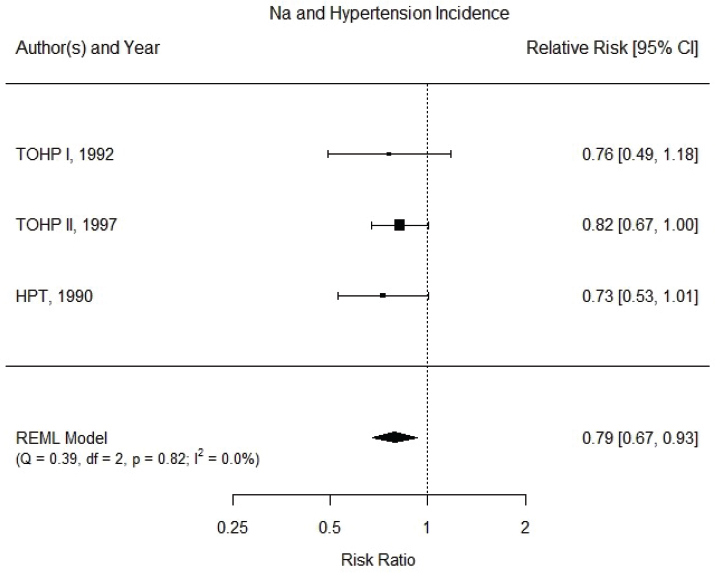
NOTES: Meta-analysis was conducted in R with random-effects models in the metafor package. The variance was estimated using the REML approach. For comparison, fixed-effects meta-analysis overall risk ratio was calculated to be 0.80 [95% CI: 0.69, 0.94]. CI = confidence interval; df = degrees of freedom; HPT = Hypertension Prevention Trial; I2 = statistic that describes the percent of variation across studies due to heterogeneity; Na = sodium; Q = Q statistic; REML = restricted maximum likelihood; TOHP = Trials of Hypertension Prevention.
SOURCES: HPTRG, 1990; TOHP Collaborative Research Group, 1992a,b, 1997.
TABLE 10-3 GRADE Assessment Table: Sodium Reduction and Incidence of Hypertension
| GRADE Criteria | Ratinga |
|---|---|
| Outcome: Incidence of Hypertension | |
| Study design | High |
| Risk of bias | No (0) |
| Inconsistency | No (0) |
| Indirectness | No (0) |
| Imprecision | Serious (−1) |
| Publication bias | Not measured |
| Other | None (0) |
aTable format same as Table 10-2.
bThis terminology was used for consistency with the AHRQ Systematic Review. Preferred terminology under the GRADE system is certainty of the evidence or quality of the evidence.
assessed as moderate owing to the relatively small size of effect (< 25 percent risk reduction) and the upper CI being close to 1.0.
Blood Pressure
As summarized in Box 10-5, evidence on the relationship between sodium intake and blood pressure was included in both the 2005 DRI Report (IOM, 2005) and the AHRQ Systematic Review (Newberry et al., 2018). The committee’s assessment of the evidence built on the meta-analyses presented in the AHRQ Systematic Review. In particular, the committee sought to explore heterogeneity in sodium reduction trials and blood pressure that was not explored in the AHRQ Systematic Review. As noted in Box 10-1, the sources of heterogeneity caused by the diversity in methods to measure blood pressure was not explored.
Methods for exploring heterogeneity The committee’s analyses are based on the studies of systolic and diastolic blood pressure, focusing on study-specific characteristics that were collected in the AHRQ Systematic Review.
| Reasons for Rating | Strength of Evidenceb |
|---|---|
| Randomized controlled trials. | |
| All studies have low or moderate risk of bias. | |
| No statistical heterogeneity was detected. All study point estimates were in the same direction. | |
| Evidence directly answers the question of interest in terms of relevant populations, interventions, comparators, and outcomes. | |
| Statistically significant summary effect, with total events numbering > 1,000 across studies. However, the 20 percent change in hazard ratio is less than the 25 percent considered “appreciable” under GRADE (Guyatt et al., 2011c), with an upper confidence limit of 0.93 that is close to 1.00. | |
| Too few studies for analysis of publication bias. | |
| No additional upgrading factors. | |
Specifically, nine variables were extracted from the evidence tables and quality assessment tables included in the AHRQ Systematic Review5: study type (parallel or crossover), year, risk of bias, sample size, duration, net change in sodium, average sodium in control, type of intervention (dietary advice, salt supplement, or food provided), and blood pressure level and status at baseline (hypertension and antihypertensive medication use). The committee corrected some of the data it extracted from the AHRQ Systematic Review (see Box 10-2) and also extracted additional variables from the original study publications.
To examine effect by hypertension status, the committee classified studies into “Hypertension” (any participants with hypertension) and “No Hypertension” (no participants with hypertension). Studies including participants described as having “high normal” blood pressure or with “prehypertension” were included in the group without hypertension. In addition, the committee’s meta-analyses extracted from the original studies an indicator of whether participants on antihypertensive medication were eligible. These categorizations are approximate because individual participant data were not available and a single blood pressure category for the study as a whole was used. In addition, the definitions for hypertension have changed over time and so may not be consistent from study to study or with current guidelines.
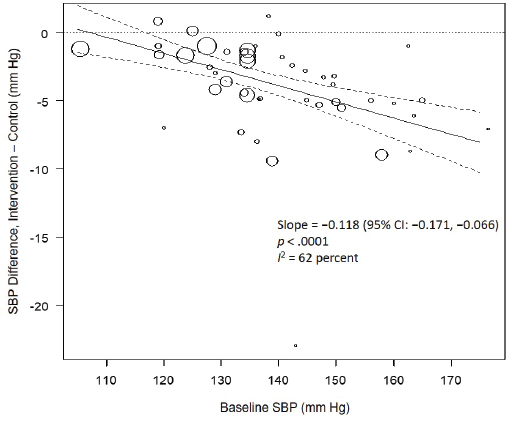
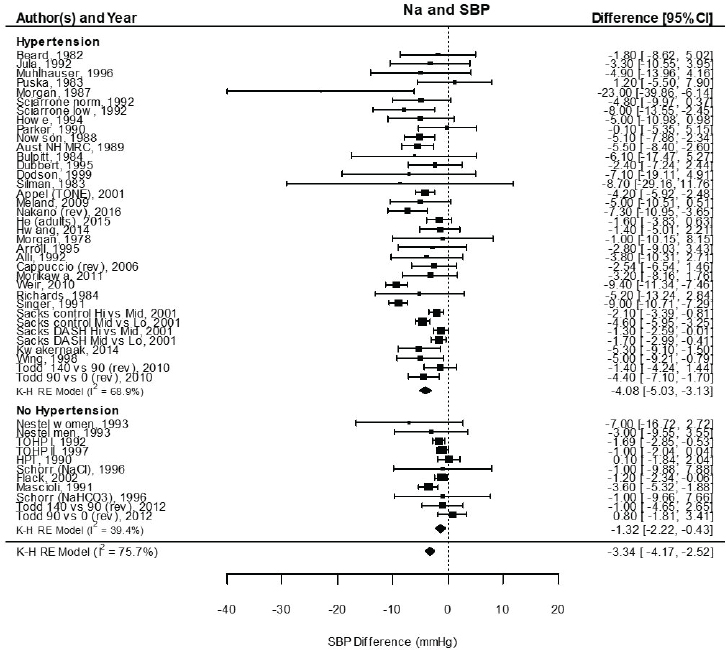
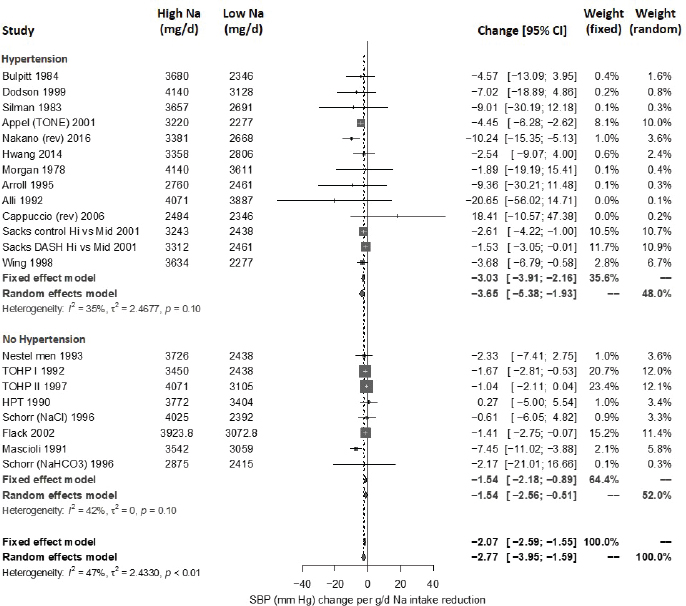
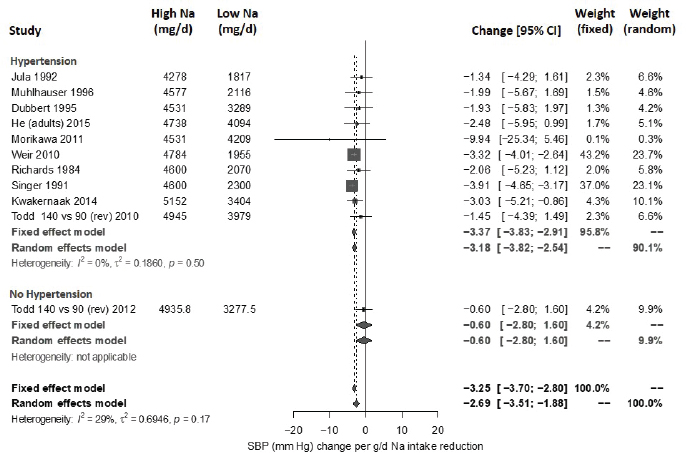
Results from the committee’s analyses on systolic blood pressure The meta-analyses results using the revised data were similar to those in the AHRQ Systematic Review. As presented in Figure 10-4, the committee’s overall estimate was a systolic blood pressure change of −3.34 mm Hg ([95% CI: −4.17, −2.52], I2 = 76 percent); the AHRQ Systematic Review estimate was −3.23 mm Hg ([95% CI: −4.07, −2.38], I2 = 77 percent). Much heterogeneity remained in the committee’s meta-analysis and was larger in the crossover trials (I2 = 88 percent) than in the parallel trials (I2 = 49 percent). In meta-regressions, both the net reduction in sodium and the baseline systolic blood pressure level were significantly associated with the size of the reduction in systolic blood pressure, though the control sodium level was not (see Figures 10-5, 10-6, and 10-7). The change in sodium and hypertension status at baseline helped to explain much of the heterogeneity, and the overall I2 value was reduced to 52 percent in meta-regressions including these three variables (net reduction in sodium, baseline systolic blood pressure level, and control sodium level). There was also a difference in the effects by categories of baseline blood pressure (see Figure 10-8). Although the effect estimates were larger among studies with any participants with hypertension (mean difference [MD] = −4.08 mm Hg [95% CI: −5.03, −3.13], I2 = 69 percent)
___________________
5 The referenced tables correspond to Appendixes C and E in the AHRQ Systematic Review (Newberry et al., 2018).
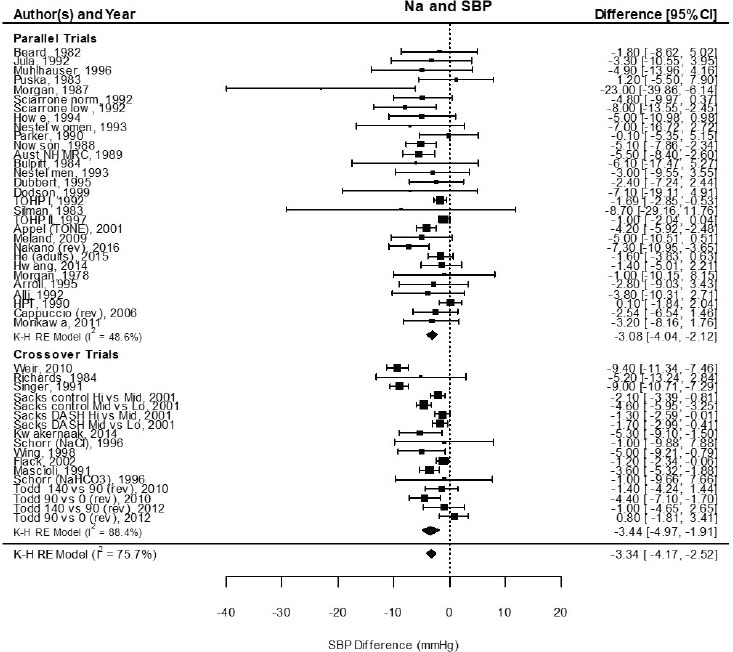
NOTES: Meta-analysis was conducted in R with random-effects models in the metafor package using the Knapp-Hartung variance. For comparison, fixed-effects meta-analysis overall MD was calculated to be –2.77 mm Hg [95% CI: –3.13, –2.42] for all, –2.26 mm Hg [95% CI: –2.81, –1.72] for parallel trials, and –3.13 mm Hg [95% CI: –3.60, –2.68] for crossover trials. Studies are listed by the last name of the first author and year of publication. For studies with multiple contrasts, a description of the comparison represented in the meta-analysis follows the author’s name. CI = confidence interval; DASH = Dietary Approaches to Stop Hypertension; HPT = Hypertension Prevention Trial; I2 = statistic that describes the percent of variation across studies due to heterogeneity; K-H = Knapp-Hartung variance estimate; Na = sodium; RE = random-effects; rev = revised as compared to estimate used in the AHRQ Systematic Review; SBP = systolic blood pressure; TOHP = Trials of Hypertension Prevention.
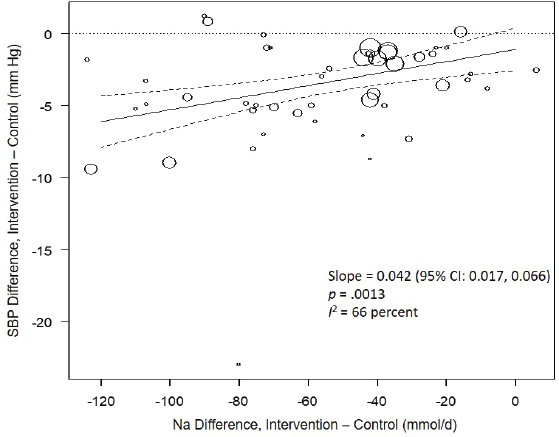
NOTES: Na differences in the figure are urinary sodium excretions, which were presented in the AHRQ Systematic Review in mmol/d. To convert to milligrams, multiply the mmol value by 23.0. CI = confidence interval; I2 = statistic that describes the percent of variation across studies due to heterogeneity; Na = sodium; SBP = systolic blood pressure.
versus those without hypertension (MD = −1.32 mm Hg [95% CI: −2.22, −0.43], I2 = 39 percent), the overall effect was statistically significant in both subgroups. The slope of change in sodium was larger and significant in trials including participants with hypertension (slope = 0.051 mm Hg per mmol change in sodium, p < .0001), but was null in those without hypertension (slope = −0.022 mm Hg per mmol change in sodium, p = .30). In regressions accounting for baseline systolic blood pressure and the net difference in sodium among participants with hypertension, the I2 value was reduced to 41 percent (see Table 10-5).
No publication bias was detected (p > .05) for all studies together as well as separately in trials including participants with hypertension and in those that did not. Summary estimates obtained by trim and fill remained statistically significant.
Given the evidence for an intake–response gradient for sodium intake and systolic blood pressure from meta-regression analyses, the committee also evaluated whether effects of sodium reduction on systolic blood pres-
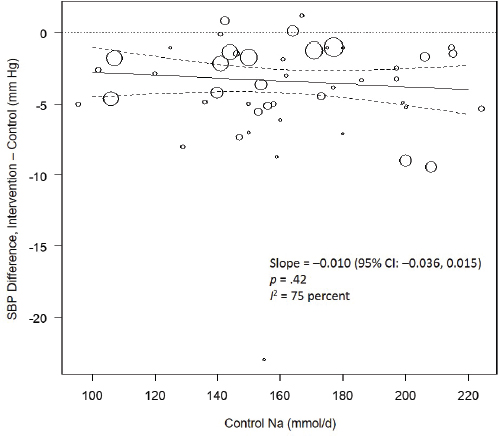
NOTES: Control Na values in the figure are urinary sodium excretions, which were presented in the AHRQ Systematic Review in mmol/d. To convert to milligrams, multiply mmol value by 23.0. CI = confidence interval; I2 = statistic that describes the percent of variation across studies due to heterogeneity; Na = sodium; SBP = systolic blood pressure.
sure were linear using semiparametric restricted cubic spline regression.6 For splines with between three and five knots, the nonlinear terms were not statistically significant. Additionally, likelihood ratio tests comparing the (null) linear meta-regression model with each of these spline regression models were not statistically significant (p = .27), supporting linearity of the effect on systolic blood pressure over the range of sodium intake levels. The Global Burden of Diseases Nutrition and Chronic Diseases Expert Group used a similar approach and reached similar conclusions about linearity (Mozaffarian et al., 2014). Based on these results, the committee focused on a linear model in its intake–response assessment.
Results from the committee’s analyses on diastolic blood pressure For diastolic blood pressure, the overall effects were similar to those in the AHRQ
___________________
6 Spline-based meta-regression was conducted using the R metafor and rms packages. Different splines were evaluated with knots placed at quantiles (0.1, 0.5, 0.9; 0.25, 0.5, 0.75; 0.1, 0.4, 0.6, 0.9; and 0.05, 0.25, 0.5, 0.75, 0.95). Maximum likelihood estimates for both linear and restricted cubic splines were compared using the likelihood ratio test through analysis of variance.
NOTE: CI = confidence interval; I2 = statistic that describes the percent of variation across studies due to heterogeneity; SBP = systolic blood pressure.
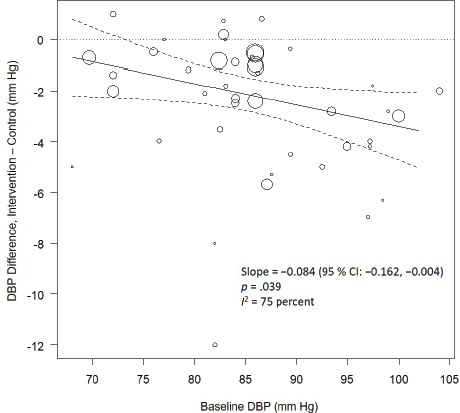
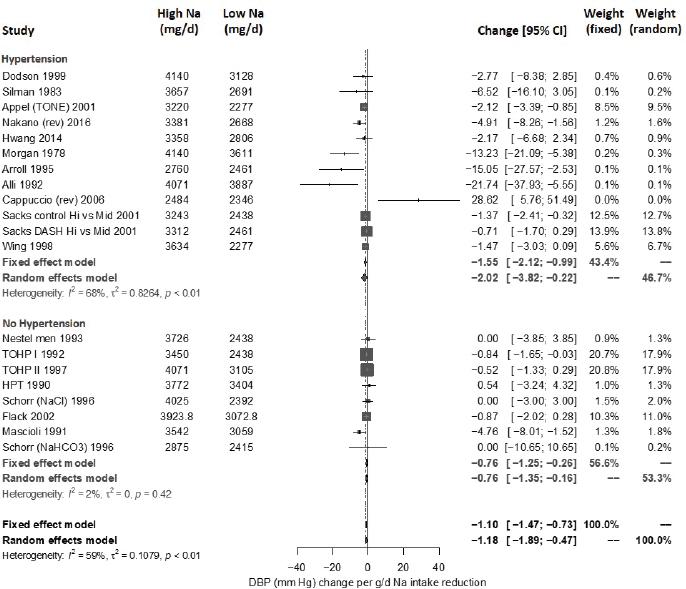
Systematic Review. As presented in Figure 10-9, the committee’s overall estimate was a diastolic blood pressure change of −2.16 mm Hg ([95% CI: −2.84, −1.48], I2 = 79 percent), which was a smaller change than what was estimated for systolic blood pressure. Heterogeneity was larger in crossover studies (I2 = 90 percent) than in parallel arm trials (I2 = 62 percent). There was some intake–response relationship with change in sodium, but this was not statistically significant (see Figure 10-10). The effect varied by baseline diastolic blood pressure (see Figure 10-11). The overall I2 remained at 73 percent after accounting for these two factors (see Table 10-5). Although the diastolic blood pressure changes were larger among studies with any participants with hypertension (MD: −2.68 mm Hg [95% CI: −3.50, −1.86], I2 = 78 percent) as compared to studies of participants without hypertension (MD: −0.72 mm Hg [95% CI: −1.20, −0.24], I2 = 0 percent), the results reached statistical significance in both subgroups (see Figure 10-12). The remaining heterogeneity was largely driven by studies with larger, more negative effect sizes. Restricting to studies with point estimates greater than −4.0 mm Hg (i.e., removing the quartile with the largest, most negative effect sizes) reduced heterogeneity (I2 = 37 percent); the summary estimate remained statistically significant (MD: −1.32 mm Hg [95% CI: −1.71, −0.94]). Thus, the observed heterogeneity relates to the size of the effect (large or small) rather than the direction of the effect.
NOTES: Meta-analysis was conducted in R with random-effects models in the metafor package using the Knapp-Hartung variance. For comparison, fixed-effects meta-analysis overall MD was calculated to be −3.79 mm Hg [95% CI: −4.24, −3.33] for studies that included participants with hypertension and −1.33 mm Hg [95% CI: −1.88, −0.78] for studies that did not include participants with hypertension. Studies are listed by the last name of the first author and year of publication. For studies with multiple contrasts, a description of the comparison represented in the meta-analysis follows the author’s name. CI = confidence interval; HPT = Hypertension Prevention Trial; I2 = statistic that describes the percent of variation across studies due to heterogeneity; K-H = Knapp-Hartung variance estimate; Na = sodium; RE = random-effects; rev = revised as compared to estimate used in the AHRQ Systematic Review; SBP = systolic blood pressure; TOHP = Trials of Hypertension Prevention.
Some nonsignificant publication bias (funnel plots not included) was suggested (p = .06) for all studies together but not by hypertension status. Summary estimates obtained by trim and fill remained statistically significant in all these cases.
TABLE 10-5 Estimated Mean Blood Pressure Change with Given Change in Sodium Excretion by Baseline Blood Pressure
| Baseline Blood Pressure Level, mm Hg | Mean Blood Pressure Change by Change in Sodium Excretion, mm Hg | Residual I2 | ||
|---|---|---|---|---|
| 0 mmol/d Change in Sodium Excretion | −50 mmol/d Change in Sodium Excretion | −100 mmol/d Change in Sodium Excretion | ||
| Systolic Blood Pressurea | 41% | |||
| 110 | −0.60 | −0.60 | −0.60 | |
| 120 | −1.19 | −1.19 | −1.19 | |
| 130 | −0.94 | −3.25 | −5.56 | |
| 140 | −1.54 | −3.85 | −6.16 | |
| 150 | −2.14 | −4.45 | −6.76 | |
| Diastolic Blood Pressureb | 73% | |||
| 70 | −0.38 | −0.95 | −1.51 | |
| 80 | −1.13 | −1.70 | −2.26 | |
| 90 | −1.88 | −2.45 | −3.01 | |
| 100 | −2.63 | −3.20 | −3.76 | |
NOTES: Sodium excretions in the table are presented as mmol/d. To convert to milligrams, multiply the mmol value by 23.0.
aThe model to estimate systolic blood pressure change included baseline systolic blood pressure, hypertension, and the change in sodium only among those with hypertension because this variable was significant only in those with hypertension.
bThe model to estimate diastolic blood pressure change included baseline diastolic blood pressure and change in sodium.
Updated strength-of-evidence evaluation Overall there was a significant reduction in both systolic blood pressure and diastolic blood pressure with sodium reduction, though there was sizeable heterogeneity among trials. Much of the heterogeneity in systolic blood pressure could be explained by the intake–response (net change in sodium) as well as baseline systolic blood pressure level, which reduced the heterogeneity substantially. The net blood pressure difference was stronger among those with hypertension at baseline for both systolic blood pressure and diastolic blood pressure but was apparent in both subgroups. There was no apparent effect of baseline sodium level on either measure, suggesting a similar effect of sodium reduction throughout the baseline range of sodium examined.
Publication bias was not detected for systolic blood pressure, but it was suggested in diastolic blood pressure. However, all the diastolic blood pressure studies also reported systolic blood pressure, so the appearance of publication bias for diastolic blood pressure may instead reflect differential effect sizes between systolic blood pressure and diastolic blood pressure. Moreover, in all cases, the statistical significance of the summary estimates
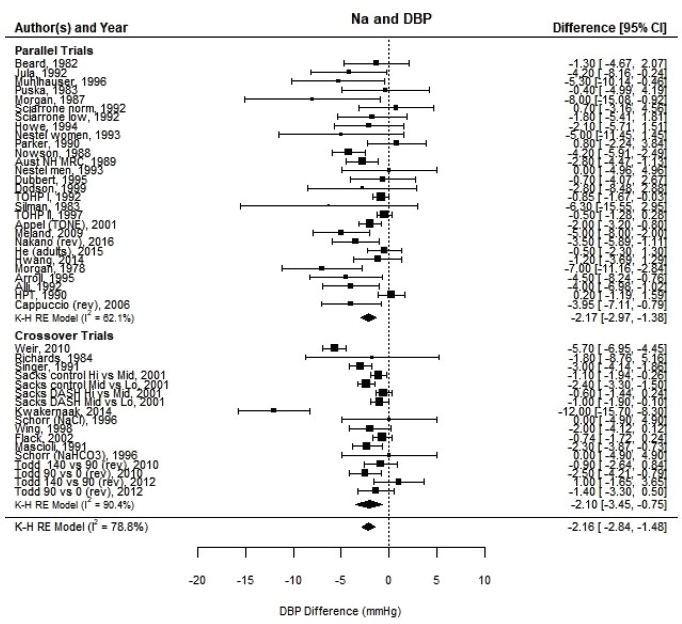
NOTES: Meta-analysis was conducted in R with random-effects models in the metafor package using the Knapp-Hartung variance. For comparison, fixed-effects meta-analysis overall MDs were calculated to be −1.64 mm Hg [95% CI: −1.89, −1.40] for all trials, −1.48 mm Hg [95% CI: −1.86, −1.10] for parallel trials and −1.76 mm Hg [95% CI: −2.09, −1.44] for crossover trials. Studies are listed by the last name of the first author and year of publication. For studies with multiple contrasts, a description of the comparison represented in the meta-analysis follows the author’s name. CI = confidence interval; DBP = diastolic blood pressure; HPT = Hypertension Prevention Trial; I2 = statistic that describes the percent of variation across studies due to heterogeneity; K-H = Knapp-Hartung variance estimate; Na = sodium; RE = random-effects; rev = revised as compared to estimate used in the AHRQ Systematic Review; TOHP = Trials of Hypertension Prevention.
remained when using trim and fill to account for potentially missing studies. Therefore, the effect of potential publication bias is not likely to be large enough to affect the overall strength of the evidence.
Using GRADE and the committee’s analyses, the committee reassessed the strength of evidence that reducing sodium intake reduces systolic blood pressure or diastolic blood pressure (see Tables 10-6 and 10-7, respectively).
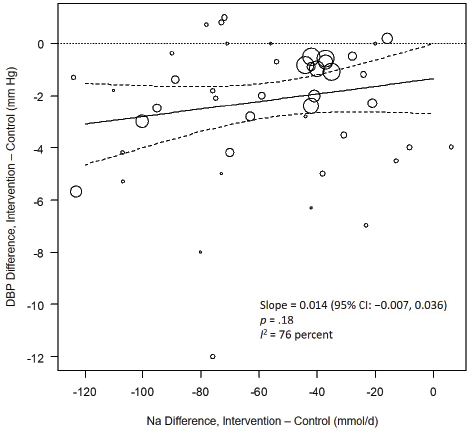
NOTES: Na differences in the figure are urinary sodium excretions, which were presented in the AHRQ Systematic Review in mmol/d. To convert to milligrams, multiply the mmol value by 23.0. CI = confidence interval; DBP = diastolic blood pressure; I2 = statistic that describes the percent of variation across studies due to heterogeneity; Na = sodium.
NOTE: CI = confidence interval; DBP = diastolic blood pressure; I2 = statistic that describes the percent of variation across studies due to heterogeneity.
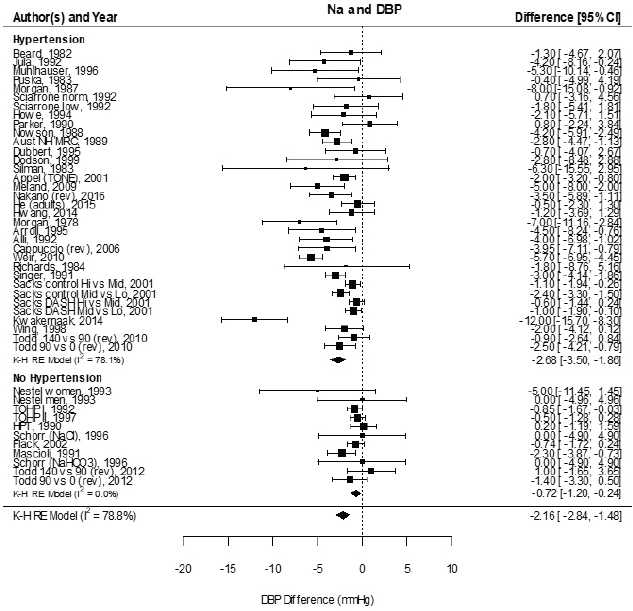
NOTES: Meta-analysis was conducted in R with random-effects models in the metafor package using the Knapp-Hartung variance. For comparison, fixed-effects meta-analysis overall MDs were calculated to be −2.12 mm Hg [95% CI: −2.42, −1.82] for studies that included participants with hypertension and −0.72 mm Hg [95% CI: −1.14, −0.29] for studies that did not include participants that did not include participants with hypertension. Studies are listed by the last name of the first author and year of publication. For studies with multiple contrasts, a description of the comparison represented in the meta-analysis follows the author’s name. CI = confidence interval; DBP = diastolic blood pressure; HPT = Hypertension Prevention Trial; I2 = statistic that describes the percent of variation across studies due to heterogeneity; K-H = Knapp-Hartung variance estimate; Na = sodium; RE = random-effects; rev = revised as compared to estimate used in the AHRQ Systematic Review; TOHP = Trials of Hypertension Prevention.
TABLE 10-6 GRADE Assessment Table: Sodium Reduction and Systolic Blood Pressure
| GRADE Criteria | Ratinga | Reasons for Rating | Strength of Evidenceb |
|---|---|---|---|
| Outcome: Change in Systolic Blood Pressure | |||
| Study design | High | Randomized controlled trials. | |
| Risk of bias | No (0) | Results similar if high-risk-of-bias studies are excluded. | |
| Inconsistency | No (0) | Although the overall summary estimate had substantial heterogeneity, with I2 = 76 percent, meta-regression and subgroup analyses showed that most of the heterogeneity is explained by the difference in sodium intake between control and intervention groups and hypertension status and/or baseline systolic blood pressure. The residual I2 = 41 percent is considered “moderate.”c | |
| Indirectness | No (0) | Evidence directly answers the question of interest in terms of relevant populations, interventions, comparators, and outcomes. | |
| Imprecision | No (0) | Statistically significant and biologically meaningful summary effect sizes across all studies and within subgroups, including those with and without individuals with hypertension. | |
| Publication bias | Undetected (0) | No detectable publication bias; summary results remained statistically significant when additional studies added using trim- and-fill procedure. | |
| Other | Intake–response (+1) | Meta-regression showed that larger contrast in sodium intake between control and intervention groups were associated with larger effect sizes. Additionally, the intercept term was not statistically significant, consistent with a linear intake–response relationship down to zero contrast in sodium intake. | |
aTable format same as Table 10-2.
bThis terminology was used for consistency with the AHRQ Systematic Review. Preferred terminology under the GRADE system is certainty of the evidence or quality of the evidence.
cThis text was revised since the prepublication release.
TABLE 10-7 GRADE Assessment Table: Sodium Reduction and Diastolic Blood Pressure
| GRADE Criteria | Ratinga | Reasons for Rating | Strength of Evidenceb |
|---|---|---|---|
| Outcome: Change in Diastolic Blood Pressure | |||
| Study design | High | Randomized controlled trials. | |
| Risk of bias | No (0) | Results similar if high-risk-of-bias studies are excluded. | |
| Inconsistency | No (0) | Meta-regression showed that the substantial heterogeneity of the overall summary estimate (I2 = 79 percent) is partially explained by baseline diastolic blood pressure and to a small extent by the difference in sodium intake between control and intervention groups. The residual I2 = 73 percent is considered substantial. However, excluding the studies with the largest effect sizes further reduced heterogeneity to “moderate,” with I2 = 37 percent. Thus, the observed heterogeneity involves differences between small and large beneficial effects, not whether an effect exists or whether an effect is beneficial or harmful. Thus, this heterogeneity is not considered serious for the strength-of-evidence grading for a causal relationship, and no downgrade for inconsistency was applied. | |
| Indirectness | No (0) | Evidence directly answers the question of interest in terms of relevant populations, interventions, comparators, and outcomes. | |
| Imprecision | No (0) | Statistically significant and biologically meaningful summary effect size across all studies and within subgroups, including those with and without individuals with hypertension. | |
| Publication bias | Detected, but no impact (0) | Some publication bias was detected; summary results remained statistically significant when additional studies added using trim-and-fill procedure. | |
| Other | None (0) | No upgrade for intake–response was applied. In all trials and crossover trials alone meta-regression of showed a nonstatistically significant trend (p > .05) of increased effect size with increased contrast in sodium intake between control and intervention groups. In parallel trials alone, no trend was evident (slope = 0, p > .99). The contrast in sodium intake explained very little of the heterogeneity. | |
aTable format same as Table 10-2.
bThis terminology was used for consistency with the AHRQ Systematic Review. Preferred terminology under the GRADE system is certainty of the evidence or quality of the evidence.
In both cases, the updated strength of evidence was assessed as high. Additionally, the evidence for systolic blood pressure exhibited an intake–response gradient across studies.
Selection of Chronic Disease Indicators
Table 10-8 presents the overall GRADE summary of findings for the four indicators with a moderate or high strength of evidence for a causal relationship with sodium intake that the committee selected to inform the sodium CDRRs. Although the strength of evidence for all-cause mortality was rated as moderate (see Annex 10-1), this indicator was not selected because it is nonspecific and because the effect sizes were notably smaller than for cardiovascular disease and hypertension. For each of the four selected indicators, the committee’s reevaluated strength of the evidence was rated higher than the rating in the AHRQ Systematic Review. For cardiovascular disease and hypertension, the higher strength-of-evidence ratings were attributable to the more stringent exclusion of short-term trials as well as the committee’s use of hazard ratios rather than relative risks based on raw counts. This difference in the analytical approach led to statistically significant summary results with no observed heterogeneity. For systolic and diastolic blood pressure, the higher strength-of-evidence ratings were attributable to the additional exploration of heterogeneity that enabled apparent inconsistencies to be explained. For systolic blood pressure, these analyses revealed that heterogeneity could be largely explained by differences across studies in the magnitude of sodium intake reduction associated with the intervention, the presence/absence of participants with hypertension in the studied populations, and baseline systolic blood pressure levels. For diastolic blood pressure, these factors reduced, but could not fully explain, the observed heterogeneity. However, the heterogeneity for diastolic blood pressure was largely the result of some studies showing large beneficial effect sizes. Removing these large effect studies reduced heterogeneity to a low to moderate level, and there remained a statistically significant reduction in diastolic blood pressure.
Based on the committee’s synthesis of the evidence, as well as the Guiding Principles Report recommendation that there should be at least moderate strength of evidence of a causal relationship between intake and chronic disease, the committee selected cardiovascular disease, hypertension, systolic blood pressure, and diastolic blood pressure as the indicators that would inform the sodium CDRRs. Although the Guiding Principles Report recommended that, in general, a “single outcome indicator on the causal pathway” be selected, the report acknowledged the possibility of using “multiple indicators of chronic disease” if there is “strong evidence suggesting that multiple indicators point to risk of a chronic disease”
TABLE 10-8 GRADE Summary of Findings Used to Determine the Causal Relationship Between Reduction in Sodium Intake and Chronic Disease Risk
| Indicator | Duration of Study or Follow-Up | Study Results and Measurements | Strength of Evidence |
|---|---|---|---|
| Cardiovascular disease event incidence | 2.5 to 12 years | Relative risk: 0.74 [95% CI: 0.58, 0.93] |
Moderate, due to imprecision |
| Hypertension incidence | 2.5 to 4 years | Relative risk: 0.79 [95% CI: 0.67, 0.93] |
Moderate, due to imprecision |
| Systolic blood pressure | 4 weeks to 4 years | See Table 10-6 | High |
| Diastolic blood pressure | 4 weeks to 4 years | See Table 10-7 | High |
(NASEM, 2017, p. 10). The committee judged that such evidence exists, as the four indicators of cardiovascular disease incidence, hypertension incidence, systolic blood pressure, and diastolic blood pressure are all biologically interrelated. The committee developed a framework for chronic disease outcomes to illustrate the interrelationships among sodium intake and the four indicators (see Figure 10-13). The evidence for the relationships between reductions in sodium intake and the four indicators was evaluated using GRADE as described above. Pursuant to the Guiding Principles Report recommendation on the use of surrogate markers, the committee further considered whether blood pressure could serve as a qualified surrogate marker in context of sodium intake reduction interventions. The evidence and rationale for qualifying systolic blood pressure and diastolic blood pressure as surrogate markers for predicting the effects of changes in sodium intake on changes in the incidence of hypertension and cardiovascular disease is presented in Annex 10-2.
ASSESSMENT OF INTAKE–RESPONSE FOR CHRONIC DISEASE INDICATORS
The Guiding Principles Report outlines two key steps in evaluating evidence related to characterizing an intake–response relationship. First, it is necessary to frame the question appropriately by identifying any differences in the body of evidence to evaluate intake–response as compared to the body of evidence used previously to evaluate causality. Second, the strength of the body of evidence needs to be reevaluated under GRADE specifically in the context of intake–response, a process that may lead to different ratings for different ranges of intake. The results of these two steps as performed by the committee are described below.
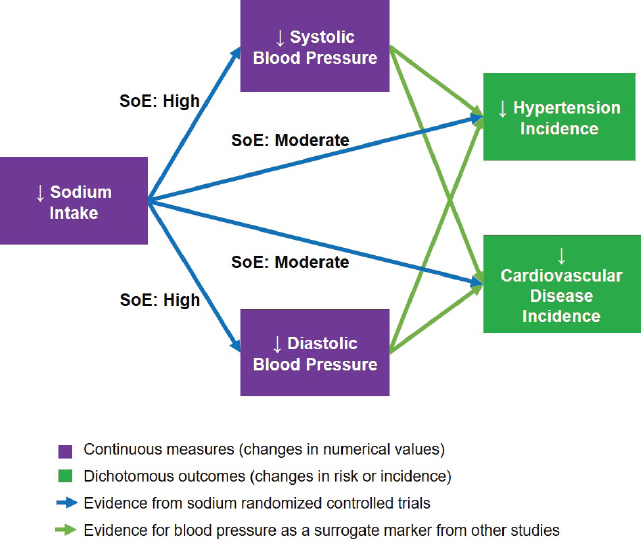
NOTES: For the committee’s evaluation of blood pressure as a qualified surrogate marker of hypertension and cardiovascular disease in context of sodium intake interventions, see Annex 10-2. SoE = strength of evidence.
Framing the Question
Combining Indicators of Chronic Disease Endpoints
As described above, the committee considered four indicators together as indicators of chronic disease risk. Cardiovascular disease incidence and hypertension incidence are direct measures of chronic disease risk. As discussed in Annex 10-2, blood pressure was considered a qualified surrogate marker for cardiovascular disease and hypertension incidence in the context of sodium reduction interventions. Of these two blood pressure measures, systolic blood pressure is more strongly related to cardiovascular disease risk than is diastolic blood pressure. Although any of these indicators alone may be adequate for supporting an intake–response relationship between sodium and chronic disease risk, the committee considered the evidence to be stronger if there were consistency across these four indicators in accordance with the relationships depicted in the framework for sodium chronic disease outcomes (see Figure 10-13).
Intake–Response Meta-Analysis
The first framing issue is considering the need to characterize a continuous intake–response relationship rather than to evaluate the presence or absence of an effect with a specific intervention. The committee applied intake–response meta-analysis methods to perform this characterization (see Box 10-6).
Sodium Intake Levels Studied in Eligible Randomized Controlled Trials
The second framing issue is to characterize the range of sodium intakes over which the available studies have examined the selected indicators of cardiovascular disease, hypertension, systolic blood pressure, and diastolic blood pressure. The Guiding Principles Report states
Rating the certainty in intake–response relationships has an additional dimension in that the level of certainty may differ across the range of intakes due to different reasons. For example, the precision of the intake–response estimate might differ across the range of intakes or by differing population characteristics. (NASEM, 2017, p. 215)
Therefore, to the extent to which the body of evidence differs in different intake ranges, the determination of the strength of evidence of a positive, negative, or zero slope also needs to be separately evaluated in different intake ranges.
Figure 10-14 summarizes the intake ranges studied for each indicator, which were primarily based on validated measures such as 24-hour urinary sodium excretions (see Chapter 3). The intake ranges for cardiovascular disease (2,300–4,100 mg/d [100–178 mmol/d]) and hypertension (2,400–4,100 mg/d [104–178 mmol/d]) are substantially narrower than the ranges for systolic blood pressure and diastolic blood pressure (850–5,200 mg/d [37–226 mmol/d]).7 Importantly, evidence was available for all four in the intake range from approximately 2,300–4,100 mg/d (100–178 mmol/d);8 evidence from trials outside of this range (< 2,300 mg/d [< 100 mmol] and > 4,100 mg/d [178 mmol/d]) was available only for blood pressure. Therefore, the committee separately evaluated the evidence for intake–response in the three intake ranges: 2,300–4,100, < 2,300, and > 4,100 mg/d (100–178, < 100, and > 178 mmol/d, respectively) (see Figure 10-14).
___________________
7 In the committee’s intake–response analyses, the sodium intake level of approximately 850 mg/d (37 mg/d) was rounded to 1,000 mg/d (43 mmol/d) and the sodium intake level of approximately 5,200 mg/d (226 mmol/d) was rounded to 5,000 mg/d (217 mmol/d).
8 The committee considered the lower end of the hypertension range of 2,400 mg/d (104 mmol/d) sufficiently close to 2,300 mg/d (100 mmol/d) to use the latter value for both.
Supporting Selection of the CDRR
The final framing issue is ensuring that the approach appropriately supports selection of a DRI based on chronic disease, as outlined by the Guiding Principles Report. First, the Guiding Principles Report recommended “Intake–response relationships should be defined as different ranges of the intake–response relationship where risk is at minimum, is decreasing, and/or is increasing (i.e., slope = 0, negative, or positive) [emphasis added]” (NASEM, 2017, p. 11). The committee’s use of “slope” as the study outcome of interest for intake–response assessment is consistent with this recommendation. The Guiding Principles Report further noted
In the simplest case, when the relationship appears linear, this characterization could include the slope of the relationship (amount of change in risk for a given change in intake), the range over which this relationship is supported, and the CIs for each of these. (NASEM, 2017, p. 219)
The committee’s approach to intake–response meta-analysis directly addresses this recommendation by evaluating outcomes based on a standardized change in sodium intake and thereby translating effect sizes into a slope. Specifically, for each intake range considered, the key question was the strength of evidence of a positive slope—that is, reductions in sodium intake reduce chronic disease risk.
Rating Evidence for Chronic Disease Intake–Response
The committee rated the evidence for chronic disease intake–response separately for the three different sodium intake ranges (2,300–4,100, > 4,100, and < 2,300 mg/d [100–178, > 178, and < 100 mmol/d, respectively]). For each intake range, the available evidence is described, followed by an intake–response meta-analysis for each indicator, using methods described above in Box 10-6. The evidence for a chronic disease intake–response relationship is then rated using GRADE, taking into account the special considerations for intake–response outlined in the Guiding Principles Report. The committee recognized that individual trials involving three or more sodium intake levels provide a stronger characterization of intake–response than using a series of individual trials at different intake levels comparing a control and a single intervention. However, in keeping with the Guiding Principles Report and the use of systematic reviews in evaluating the body of evidence, the committee used the totality of the evidence rather than focusing on the results of individual studies. Intake–response relationships characterized in individual studies can provide additional supportive evidence. The AHRQ Systematic Review identified three
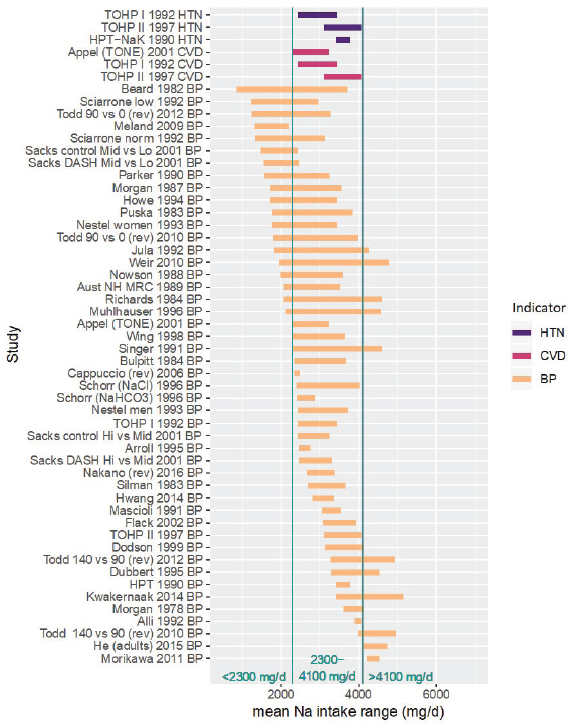
NOTES: The committee separately evaluated the strength of evidence for intake–response in three intake ranges, as indicated, owing to the differing indicators for which evidence is available. Specifically, in the middle range from 2,300–4,100 mg/d, the body of evidence consists of trials of incident cardiovascular disease, incident hypertension, and blood pressure. In the lower (< 2,300 mg/d) and upper (> 4,100 mg/d) ranges, the body of evidence used by the committee consists only of trials of blood pressure. Studies are listed by the last name of the first author, year of publication, and indicator represented in the figure. For studies with multiple contrasts, a description of the comparison represented in the figure follows the author’s name. Intake values are presented in milligrams. To convert to mmol, divide the milligram value by 23.0. BP = blood pressure; CVD = cardiovascular disease; DASH = Dietary Approaches to Stop Hypertension; HPT = Hypertension Prevention Trial; HTN = hypertension; mg/d = milligrams per day; Na = sodium; rev = revised as compared to estimate used in the AHRQ Systematic Review; TOHP = Trials of Hypertension Prevention; TONE = Trial of Nonpharmacologic Interventions in the Elderly.
trials with more than two sodium intake levels (Sacks et al., 2001; Todd et al., 2010, 2012). The intake–response results from these trials, as well as their limitations, are described in Box 10-7.
Sodium Intakes 2,300–4,100 mg/d (100–178 mmol/d)
Eligible studies All studies for which both the control and the intervention sodium intake level (rounded to the nearest 100 mg/d [4 mmol/d]) were within the range 2,300–4,100 mg/d (100–178 mmol/d) were considered eligible, as these provide direct evidence of intake–response in this intake range (see Figure 10-15). Evidence was available for all four of the selected chronic disease indicators.
Intake–response meta-analysis Intake–response meta-analyses on the slope for each of the four selected indicators are shown in Figures 10-16 through 10-20. For cardiovascular disease,9 the intake–response slopes from randomized controlled trials were statistically significant with no heterogeneity (I2 = 0 percent) (see Figure 10-16), similar to the results from evaluating evidence for causality. The linear slope reported by Cook et al. (2014),10 based on observational data for cardiovascular disease, is consistent with the slope derived from randomized controlled trials. Combining these studies together led to virtually the same results as using randomized controlled trials alone, with no observed heterogeneity (see Figure 10-17).
For hypertension, the intake–response slopes were statistically significant with little heterogeneity (I2 = 6 percent) (see Figure 10-18), similar to the results from evaluating evidence for causality. As with the analysis for causality, because of the small numbers of studies and low heterogeneity, random-effects estimates did not include the Knapp-Hartung modification.
For systolic blood pressure, the intake–response slope was statistically significant with moderate heterogeneity (I2 = 47 percent). Heterogeneity was reduced (I2 = 32 percent) when Nakano et al. (2016), the one study with high risk of bias, was excluded. Presence or absence of participants with hypertension in the study group contributed to this heterogeneity, with within-subgroup I2 of 35 and 42 percent, respectively (see Figure 10-19). Additional subgroup analyses found that the presence or absence of individuals being treated with blood pressure medication explained most of the heterogeneity (within subgroup I2 = 23 and 22 percent, respectively). The systolic blood pressure slope in all subgroup analyses remained sta-
___________________
9 Cardiovascular disease events collected in the individual studies included myocardial infarction, angina, congestive heart failure, coronary revascularization, stroke, transient ischemic attack, arrhythmia, or other.
10 This observational study was rated as low risk of bias in the AHRQ Systematic Review.
tistically significant. The funnel plot asymmetry test for publication bias was not statistically significant (p = .09). The overall effect remained statistically significant after adjusting for possible publication bias using the trim-and-fill method. All estimates for systolic blood pressure used the Knapp-Hartung modification.
For diastolic blood pressure, the intake–response slope was statistically significant with moderate to substantial heterogeneity (I2 = 59 percent). The presence or absence of participants with hypertension in the study group contributed to this heterogeneity; the subgroup of studies without participants with hypertension had I2 of 2 percent, whereas studies that included participants with hypertension had I2 of 68 percent (see Figure 10-20). Addi-
tional subgrouping did not substantially reduce this heterogeneity. However, the diastolic blood pressure slope in all subgroup analyses remained statistically significant. The funnel plot asymmetry test for publication bias was not statistically significant (p = .054). The overall effect remained statistically significant after adjusting for possible publication bias using the trim-and-fill method. All estimates for diastolic blood pressure used the Knapp-Hartung modification.
Evidence rating for intake–response Following guidance in the Guiding Principles Report, the committee did not develop an effect estimate for a composite endpoint. That is, the overall GRADE rating, while taking into
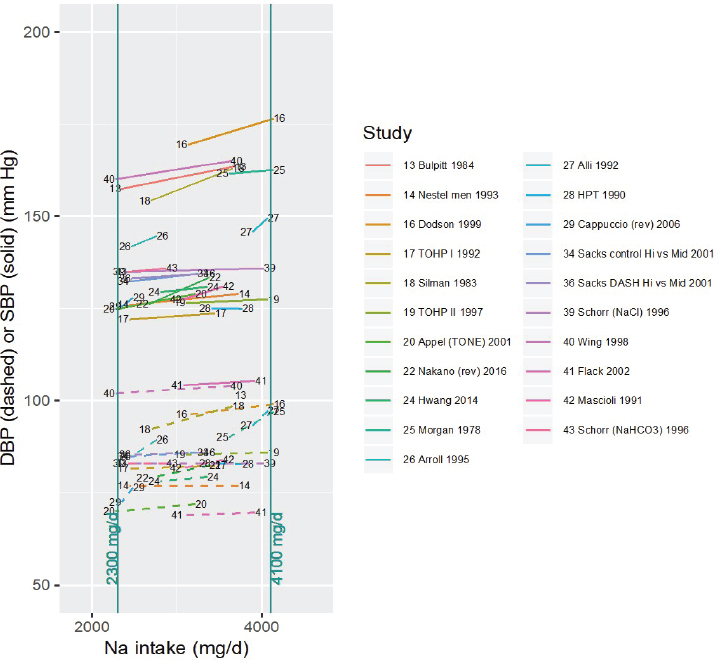
NOTES: For each study considered within this intake range, the control and intervention systolic and diastolic blood pressures along with the corresponding sodium intake values are connected by a line segment (solid line for systolic blood pressure, dashed line for diastolic blood pressure). Studies are listed by the last name of the first author and year of publication. For studies with multiple contrasts, a description of the comparison represented in the figure follows the author’s name. Sodium intake levels are presented in milligrams. To convert to mmol, divide the milligram value by 23.0. DASH = Dietary Approaches to Stop Hypertension; DBP = diastolic blood pressure; HPT = Hypertension Prevention Trial; mg/d = milligrams per day; Na = sodium; rev = revised as compared to estimate used in the AHRQ Systematic Review; SBP = systolic blood pressure; TOHP = Trials of Hypertension Prevention; TONE = Trial of Nonpharmacologic Interventions in the Elderly.
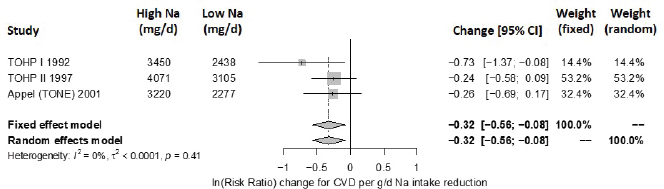
NOTES: Sodium intake levels are presented in milligrams. To convert to mmol, divide the milligram value by 23.0. CI = confidence interval; CVD = cardiovascular disease; g/d = gram per day; I2 = statistic that describes the percent of variation across studies due to heterogeneity; mg/d = milligrams per day; Na = sodium; TOHP = Trials of Hypertension Prevention; TONE = Trial of Nonpharmacologic Interventions in the Elderly.
SOURCES: Appel et al., 2001; TOHP Collaborative Research Group, 1992a,b, 1997.
NOTES: Sodium intake levels are presented in milligrams. To convert to mmol, divide the milligram value by 23.0. CI = confidence interval; CVD = cardiovascular disease; g/d = gram per day; I2 = statistic that describes the percent of variation across studies due to heterogeneity; mg/d = milligrams per day; Na = sodium; TOHP = Trials of Hypertension Prevention; TONE = Trial of Nonpharmacologic Interventions in the Elderly.
SOURCES: Appel et al., 2001; Cook et al., 2014; TOHP Collaborative Research Group, 1992a,b, 1997.
account the multiple indicators, does not combine effect sizes for different endpoints. Instead, the effect estimates are calculated separately for each outcome (cardiovascular disease incidence, hypertension incidence, systolic blood pressure, and diastolic blood pressure). However, because the goal of the intake–response analysis is to determine the strength of evidence of
NOTES: Sodium intake levels are presented in milligrams. To convert to mmol, divide the milligram value by 23.0. CI = confidence interval; g/d = gram per day; HPT = Hypertension Prevention Trial; HTN = incident hypertension; I2 = statistic that describes the percent of variation across studies due to heterogeneity; mg/d = milligrams per day; Na = sodium; TOHP = Trials of Hypertension Prevention.
SOURCES: HPTRG, 1990; TOHP Collaborative Research Group, 1992a,b, 1997.
a positive/negative/zero slope, rather than a specific effect size, the committee determined it appropriate to examine all four indicators together in the GRADE table for intake–response. In that manner, using GRADE and trials results from 3 comparisons on cardiovascular disease risk, 3 comparisons on risk of hypertension, and 21 comparisons on systolic and diastolic blood pressure, the committee assessed the strength of evidence that reducing sodium intake reduces chronic disease risk in the intake range 2,300–4,100 mg/d (100–178 mmol/d). The overall rating is high, with details as to the rationale summarized in Table 10-9.
Sodium Intakes Above 4,100 mg/d (178 mmol/d)
Eligible studies No randomized controlled trials of cardiovascular disease and hypertension involving average intakes above 4,100 mg/d (178 mmol/d) were available. The AHRQ Systematic Review rated the observational studies in this intake range as having a low strength of evidence; as discussed earlier in this chapter, the committee decided not to establish sodium CDRRs based only on observational studies owing to such studies’ potential for various biases. The one observational study of cardiovascular disease with low risk of bias (Cook et al., 2014) included intakes above 4,100 mg/d (178 mmol/d). The included comparison from this study was between two groups: one with sodium intakes 3,600 to < 4,800 mg/d (157 to < 209 mmol/d; mean intake 4,100 mg/d [178 mmol/d]) and the other with sodium intakes ≥ 4,800 mg/d (≥ 209 mmol/d; mean intake 5,800 mg/d [252 mmol/d]).
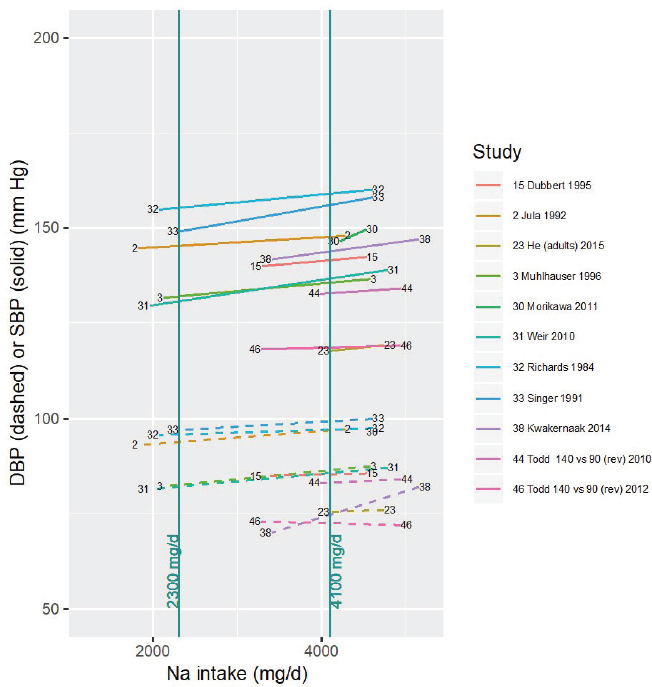
NOTES: Studies are listed by the last name of the first author and year of publication. For studies with multiple contrasts, a description of the comparison represented in the meta-analysis follows the author’s name. Sodium intake levels are presented in milligrams. To convert to mmol, divide the milligram value by 23.0. CI = confidence interval; DASH = Dietary Approaches to Stop Hypertension; g/d = gram per day; HPT = Hypertension Prevention Trial; I2 = statistic that describes the percent of variation across studies due to heterogeneity; mg/d = milligrams per day; Na = sodium; rev = revised as compared to estimate used in the AHRQ Systematic Review; SBP = systolic blood pressure; TOHP = Trials of Hypertension Prevention.
Two blood pressure trials (He et al., 2015; Morikawa et al., 2011) involved both the control and the intervention sodium intake level (rounded to the nearest 100 mg/d [4 mmol/d]) being above 4,100 mg/d (178 mmol/d). These studies were rated as having moderate risk of bias (He et al., 2015) and high risk of bias (Morikawa et al., 2011). Using the less stringent criteria that the midpoint of the control and intervention studies be above 4,100 mg/d (178 mmol/d) yielded four studies; using the least stringent criteria that only the control (high) intake level be above 4,100 mg/d (178 mmol/d) yielded 11
NOTES: Studies are listed by the last name of the first author and year of publication. For studies with multiple contrasts, a description of the comparison represented in the meta-analysis follows the author’s name. Sodium intake levels are presented in milligrams. To convert to mmol, divide the milligram value by 23.0. CI = confidence interval; DASH = Dietary Approaches to Stop Hypertension; DBP = diastolic blood pressure; g/d = gram per day; HPT = Hypertension Prevention Trial; I2 = statistic that describes the percent of variation across studies due to heterogeneity; mg/d = milligrams per day; Na = sodium; rev = revised as compared to estimate used in the AHRQ Systematic Review; TOHP = Trials of Hypertension Prevention.
studies (see Figure 10-21). To the extent that there may be nonlinearity in the intake–response relationship, these studies may be more indirect because the intake–response slope includes effects of reducing intake below 4,100 mg/d (178 mmol/d). This potential indirectness was taken into consideration in the committee’s evidence rating, as described below. Additionally, there are no data above intakes of approximately 5,000 mg/d (217 mmol/d), so this evaluation only applies to intakes up to this value.
Intake–response meta-analysis For cardiovascular disease, Cook et al. (2014) found a hazard ratio of 1.05 [95% CI: 0.68, 1.62] for the high-intake group as compared to the reference group,11 which translates to a slope of −0.03 [95% CI: −0.29, 0.23] in units of ln(risk ratio) per 1,000 mg/d (43 mmol/d) sodium intake reduction. This value is not statistically significant, and is smaller than the effect found from this study and from randomized controlled trials in the lower intake range of 2,300–4,100 mg/d (100–178 mmol/d). As only one study is available, no intake–response meta-analysis was performed.
For systolic blood pressure, the intake–response slope was statistically significant with low heterogeneity (I2 = 29 percent) (see Figure 10-22). This heterogeneity was completely explained by the one study in participants without hypertension (Todd et al., 2012), which reported no statistically significant difference in systolic blood pressure between groups. Separating this one study resulted in no observed heterogeneity in the remaining studies (I2 = 0 percent). The summary intake–response slope did not depend on whether or not the midpoint of the intake range was > 4,100 mg/d (> 178 mmol/d), consistent with a linear relationship extending from below to above 4,100 mg/d (178 mmol/d). A subgroup difference was found for blood pressure medication, with a larger slope in studies that included individuals being treated with blood pressure medication; however, the intake–response slope remained statistically significant in both subgroups. Results did not change with the exclusion of the one study with high risk of bias. The funnel plot asymmetry test for publication bias was not statistically significant (p = .059). Overall effect remained statistically significant after adjusting for possible publication bias using the trim-and-fill method. All estimates used the Knapp-Hartung modification.
For diastolic blood pressure, the intake–response slope was statistically significant with substantial or considerable heterogeneity (I2 = 76 percent) (see Figure 10-23). No studies were rated as having a high risk of bias. The heterogeneity was completely explained by two studies: Todd et al. (2012), which is the only study with nonhypertensive participants that reported no effect on diastolic blood pressure, and Kwakernaak et al. (2014), which was a study of patients with type 2 diabetic nephropathy that reported a very large change in diastolic blood pressure. Excluding these two, there is no observed heterogeneity in the remaining studies (I2 = 0 percent). The summary intake–response slope did not depend on whether the midpoint of the intake range was > 4,100 mg/d (> 178 mmol/d), consistent with a linear relationship extending from below to above 4,100 mg/d (178 mmol/d). No
___________________
11 As described above, the high intake group consumed ≥ 4,800 mg/d (≥ 209 mmol/d) sodium, while the reference group in this comparison consumed 3,600 to < 4,800 mg/d (157 to < 209 mmol/d) sodium.
TABLE 10-9 GRADE Assessment Table for Intake–Response in Range 2,300–4,100 mg/d (100–178 mmol/d)
| GRADE Criteria | Ratinga |
|---|---|
| Outcome: Reduced chronic disease risk per 1,000 mg/d (43 mmol/d) sodium intake reduction, as indicated by cardiovascular disease, hypertension, systolic blood pressure, and diastolic blood pressure, in the intake range 2,300–4,100 mg/d (100–178 mmol/d). | |
| Study design | High |
| Risk of bias | No (0) |
| Inconsistency | No (0) |
| Indirectness | No (0) |
| Imprecision | No (0) |
| Publication bias | Undetected (0) |
| Other | No (0) |
aTable format same as Table 10-2.
bThis terminology was used for consistency with the AHRQ Systematic Review. Preferred terminology under the GRADE system is certainty of the evidence or quality of the evidence.
| Reasons for Rating | Strength of Evidenceb |
|---|---|
| Randomized controlled trials. | |
| No cardiovascular disease or hypertension studies had high risk of bias. For systolic blood pressure and diastolic blood pressure, summary slope remains statistically significant, with lower heterogeneity when removing the one study with high risk of bias. | |
| Little or no heterogeneity for cardiovascular disease or hypertension. For systolic blood pressure, moderate heterogeneity overall (I2 = 47 percent), which was largely explained by hypertension or blood pressure medication status. Effects were greater in populations that included individuals with hypertension or that included those taking blood pressure medication, but effects remained statistically significant for populations without these characteristics. Heterogeneity was low to moderate within subgroups (I2 between 22 and 42 percent). For diastolic blood pressure, there was moderate to substantial heterogeneity overall (I2 = 59 percent), which can only be partially explained by hypertension or blood pressure medication status. Heterogeneity within subgroups varied from low to substantial (I2 between 2 and 68 percent). Overall, no downgrade was applied because the two more direct indicators of chronic disease risk—cardiovascular disease and hypertension—had little or no unexplained heterogeneity. | |
| All studies used control and intervention intake levels within the specified intake range. Cardiovascular disease and hypertension are direct measures of chronic disease risk; systolic blood pressure and diastolic blood pressure are indirect but serve as qualified surrogate markers. | |
| Statistically significant and biologically meaningful summary effect sizes for all indicators, across all studies and within subgroups, including those with and without individuals with hypertension. | |
| No publication bias detected; results similar if adjusted for possible publication bias using trim-and-fill procedure. | |
| Outcome already specified as an intake–response slope, so no additional upgrade for intake–response gradient. | |
NOTES: For each study considered within this intake range, the control and intervention systolic and diastolic blood pressures along with the corresponding sodium intake values are connected by a line segment (solid for systolic blood pressure, dashed for diastolic blood pressure). Studies were included if the control (high) sodium intake level was > 4,100 mg/d. Studies are listed by the last name of the first author and year of publication. For studies with multiple contrasts, a description of the comparison represented in the figure follows the author’s name. Sodium intake levels are presented in milligrams. To convert to mmol, divide the milligram value by 23.0. DBP = diastolic blood pressure; mg/d = milligrams per day; Na = sodium; rev = revised as compared to estimate used in the AHRQ Systematic Review; SBP = systolic blood pressure.
NOTES: Studies are listed by the last name of the first author and year of publication. For studies with multiple contrasts, a description of the comparison represented in the meta-analysis follows the author’s name. Sodium intake levels are presented in milligrams. To convert to mmol, divide the milligram value by 23.0. CI = confidence interval; g/d = gram per day; I2 = statistic that describes the percent of variation across studies due to heterogeneity; mg/d = milligrams per day; Na = sodium; rev = revised as compared to estimate used in the AHRQ Systematic Review; SBP = systolic blood pressure.
subgroup differences were found based on blood pressure medication. After excluding the two outliers, all studies included individuals with hypertension. A funnel plot asymmetry test for publication bias was not statistically significant (p = .94). Overall effect remains statistically significant after adjusting for possible publication bias using the trim-and-fill method. All estimates used the Knapp-Hartung modification.
Evidence rating for intake–response Using GRADE, the committee assessed the strength of evidence that reducing sodium intake reduces chronic disease risk in the intake range above 4,100 mg/d (178 mmol/d). The overall rating was moderate owing to concerns about indirectness, with details as to the rationale summarized in Table 10-10. Because of lack of data above 5,000 mg/d (217 mmol/d), this rating only applies for sodium intakes up to this value.
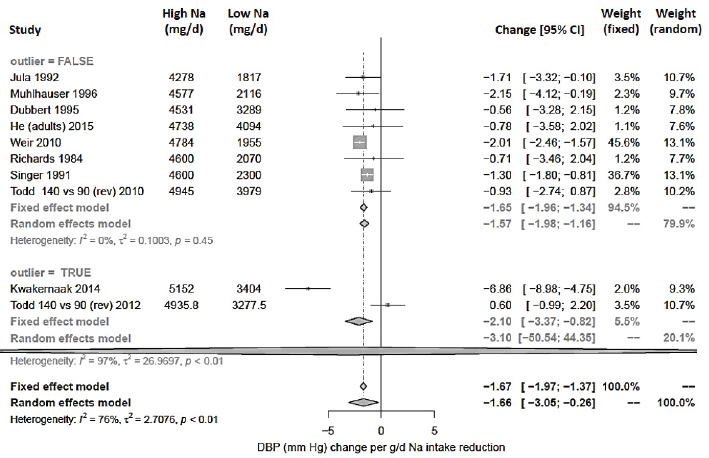
NOTES: Studies are listed by the last name of the first author and year of publication. For studies with multiple contrasts, a description of the comparison represented in the meta-analysis follows the author’s name. Sodium intake levels are presented in milligrams. To convert to mmol, divide the milligram value by 23.0. CI = confidence interval; DBP = diastolic blood pressure; g/d = gram per day; I2 = statistic that describes the percent of variation across studies due to heterogeneity; mg/d = milligrams per day; Na = sodium; rev = revised as compared to estimate used in the AHRQ Systematic Review.
The AHRQ Systematic Review identified a number of observational studies of blood pressure, cardiovascular disease, and hypertension that included participants with intakes above 5,000 mg/d (217 mmol/d). Overall, the AHRQ Systematic Review rated the strength of evidence that sodium intake was associated with these outcomes as low or insufficient owing to their observational design and concerns about risk of bias. Additionally, the AHRQ Systematic Review concluded that there was insufficient data to characterize the nature of the intake–response relationship based on observational studies. The committee, however, recognized that a portion of the general population consumes sodium at levels of intake exceeding 5,000 mg/d (217 mmol/d) (see Chapter 11, Tables 11-4 and 11-6). Although the magnitude of the risk reduction is uncertain, the committee used its expert judgment to assume that reducing sodium intakes above 5,000 mg/d (217 mmol/d) reduces chronic disease risk. Therefore, those consuming sodium
TABLE 10-10 GRADE Assessment Table for Intake–Response in Range Above 4,100 mg/d (178 mmol/d)
| GRADE Criteria | Ratinga | Reasons for Rating | Strength of Evidenceb |
|---|---|---|---|
| Outcome: Reduced chronic disease risk per 1,000 mg/d (43 mmol/d) sodium intake reduction, as indicated by cardiovascular disease, hypertension, systolic blood pressure, and diastolic blood pressure, in the intake range above 4,100 mg/d (178 mmol/d). | Moderate up to 5,000 mg/d (217 mmol/d); Insufficientc above 5,000 mg/d (217 mmol/d)d |
||
| Study design | High | Randomized controlled trials. | |
| Risk of bias | No (0) | Only one study, for systolic blood pressure, had high risk of bias; results did not change with exclusion of this study. | |
| Inconsistency | No (0) | For systolic blood pressure, there was low heterogeneity overall (I2 = 29 percent), which is completely explained by the one study that excluded individuals with hypertension. Effects were greater in studies that included those taking blood pressure medication, but effects remained statistically significant in both groups of studies. For diastolic blood pressure, there was substantial heterogeneity overall (I2 = 76 percent), all of which is explained by two studies: one study that excluded adults with hypertension, and one study reporting large effects in patients with type 2 diabetic nephropathy. Overall, no downgrade was applied because all the observed heterogeneity could be explained. | |
| Indirectness | Serious (−1) | Only one low-risk-of-bias observational study was available in this intake range for cardiovascular disease, one of the more direct measures of chronic disease risk. No data in this intake range was available for hypertension. For systolic blood pressure and diastolic blood pressure, the midpoint of control and intervention intakes were > 4,100 mg/d (> 178 mmol/d) for only 4 of the 11 randomized controlled trials studies of systolic blood pressure and diastolic blood pressure; these studies were all < 6 months in duration. All but one of the studies of systolic blood pressure and diastolic blood pressure included adults with hypertension, with the one study in normotensives reporting no effect. | |
| GRADE Criteria | Ratinga | Reasons for Rating | Strength of Evidenceb |
|---|---|---|---|
| Overall, a downgrade for indirectness was applied owing to the lack of studies fully (or mostly) within this intake range, the lack of studies in normotensives, and the lack of randomized controlled trials on cardiovascular disease and hypertension providing more direct evidence of reduced chronic disease risk. | |||
| Imprecision | No (0) | Statistically significant and biologically meaningful summary effect sizes for systolic blood pressure and diastolic blood pressure, across all studies and within all subgroups that included adults with hypertension. | |
| Publication bias | Undetected (0) | No publication bias detected; results similar if adjusted for possible publication bias using trim-and-fill procedure. | |
| Other | No (0) | Outcome already specified as an intake–response slope, so no additional upgrade for intake–response gradient. | |
aTable format same as Table 10-2.
bThis terminology was used for consistency with the AHRQ Systematic Review. Preferred terminology under the GRADE system is certainty of the evidence or quality of the evidence.
cThis terminology was used for consistency with the AHRQ Systematic Review. Preferred terminology under the GRADE system is very low certainty or quality of the evidence.
dFor intakes above 5,000 mg/d (217 mmol/d), based on the totality of the evidence, the committee exercised expert judgment in assuming that, for the purposes of public health decision making, reducing sodium intake would reduce chronic disease risk.
at levels of intake exceeding 5,000 mg/d (217 mmol/d) would be expected to benefit from reducing sodium intake.
Sodium Intakes Below 2,300 mg/d (100 mmol/d)
Eligible studies No randomized controlled trials of cardiovascular disease and hypertension involving average sodium intakes in this range were available. The one observational study of cardiovascular disease with a low risk of bias included intakes below 2,300 mg/d (100 mg/d) (Cook et al., 2014). The included comparison from this study was between two groups: one with intakes 3,600 to < 4,800 mg/d (157 to < 209 mmol/d; mean intake
4,100 mg/d [178 mmol/d]) and the other < 2,300 mg/d (< 100 mmol/d; mean intake 1,900 mg/d [83 mmol/d]).
One blood pressure study involved both the control and the intervention sodium intake level (rounded to the nearest 100 mg/d) below 2,300 mg/d (100 mmol/d) (Meland and Aamland, 2009). Using the less stringent criterion that the midpoint of the control and intervention studies be below 2,300 mg/d (100 mmol/d) yielded five studies with a total of seven comparisons; using the least stringent criterion that only the intervention (low) intake level be below 2,300 mg/d (100 mmol/d) yielded 17 studies with 19 comparisons (see Figure 10-24). To the extent that there may be nonlinearity in the intake–response relationship, these studies may be more indirect because the intake–response slope includes effects of reducing intake above 2,300 mg/d (100 mmol/d). This potential indirectness was taken into consideration in the committee’s evidence rating, as described below. Additionally, there are no data below intakes of approximately 1,000 mg/d (43 mmol/d), so this evaluation only applies to intakes down to this value.
Intake–response meta-analysis For cardiovascular disease, Cook et al. (2014) found a hazard ratio of 0.68 [95% CI: 0.34, 137] for the low sodium intake group as compared to the reference group,12 which translates to a slope of −0.17 [95% CI: −0.48, 0.14] in units of ln(risk ratio) per 1,000 mg/d (43 mmol/d) sodium intake reduction. This value is not statistically significant, but it is about the same as the effect found from this study and from randomized controlled trials in the higher intake range of 2,300 to 4,100 mg/d (100 to 178 mmol/d). As only one study is available, no intake–response meta-analysis was performed.
For systolic blood pressure, the intake–response slope was statistically significant with substantial heterogeneity (I2 = 67 percent) (see Figure 10-25). Studies for which the midpoint of intakes between the control and intervention groups was < 2,300 mg/d (< 100 mmol/d) were more heterogeneous than studies for which the midpoint intake was ≥ 2,300 mg/d (≥ 100 mmol/d; I2 = 82 versus 38 percent, respectively) (see Figure 10-25). Some of the heterogeneity was attributable to one of the two studies that included participants without hypertension that reported no statistically significant difference in systolic blood pressure between groups (Todd et al., 2012). Separating this one study resulted in less, but still moderate, heterogeneity in the remaining studies (I2 = 47 percent); however, studies for which the midpoint of intakes between the control and intervention groups was < 2,300 mg/d (< 100 mmol/d) were still more heterogeneous (I2 = 65
___________________
12 As described above, the low intake group consumed < 2,300 mg/d (< 100 mmol/d) sodium, while the reference group in this comparison consumed 3,600 to < 4,800 mg/d (157 to < 209 mmol/d) sodium.
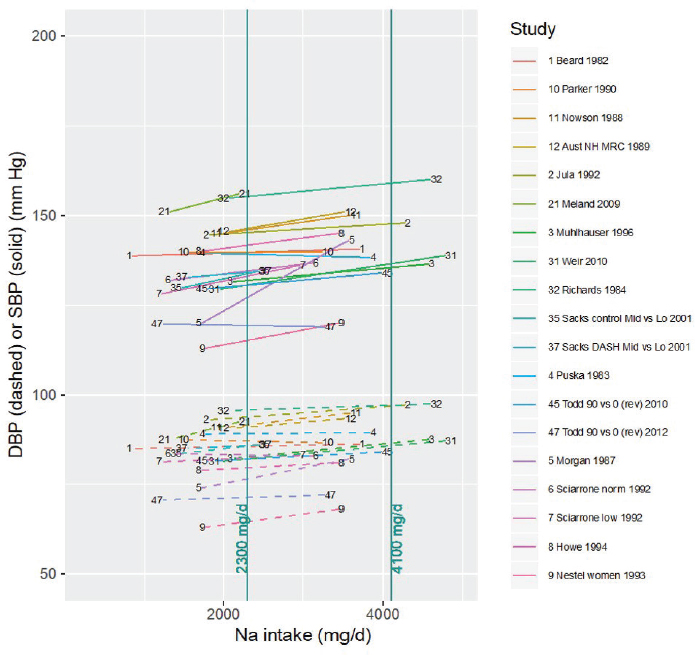
NOTES: For each study considered within this intake range, the control and intervention systolic and diastolic blood pressures along with the corresponding sodium intake values are connected by a line segment (solid line for systolic blood pressure, dashed line for diastolic blood pressure). Studies were included if the intervention (low) sodium intake level was < 2,300 mg/d. Studies are listed by the last name of the first author and year of publication. For studies with multiple contrasts, a description of the comparison represented in the figure follows the author’s name. Sodium intake levels are presented in milligrams. To convert to mmol, divide the milligram value by 23.0. DASH = Dietary Approaches to Stop Hypertension; DBP = diastolic blood pressure; mg/d = milligrams per day; Na = sodium; rev = revised as compared to estimate used in the AHRQ Systematic Review; SBP = systolic blood pressure.
percent). Some, but not all, subgroups by hypertension status or blood medication had somewhat lower heterogeneity (I2 = 23 to 68 percent), but subgroup differences were not statistically significant. Meta-regression by baseline blood pressure and control sodium intake level also could not explain observed heterogeneity. The summary intake–response slope did not
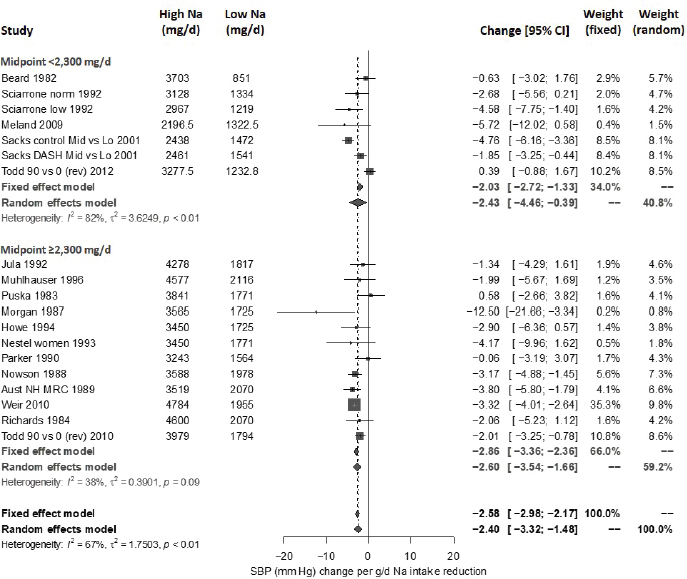
NOTES: Studies are listed by the last name of the first author and year of publication. For studies with multiple contrasts, a description of the comparison represented in the meta-analysis follows the author’s name. Sodium intake levels are presented in milligrams To convert to mmol, divide the milligram value by 23.0. CI = confidence interval; g/d = gram per day; I2 = statistic that describes the percent of variation across studies due to heterogeneity; mg/d = milligrams per day; Na = sodium; rev = revised as compared to estimate used in the AHRQ Systematic Review; SBP = systolic blood pressure.
depend on whether or not the midpoint of the intake range was < 2,300 mg/d (< 100 mmol/d), consistent with a linear relationship extending from above to below 2,300 mg/d (100 mmol/d). Results did not change with the exclusion of the one study with a high risk of bias. The funnel plot asymmetry test for publication bias was not statistically significant (p = .86). The overall effect remains statistically significant after adjusting for possible publication bias using the trim-and-fill method. All estimates used the Knapp-Hartung modification.
For diastolic blood pressure, the intake–response slope was statistically significant with moderate heterogeneity (I2 = 54 percent; see Figure 10-26).
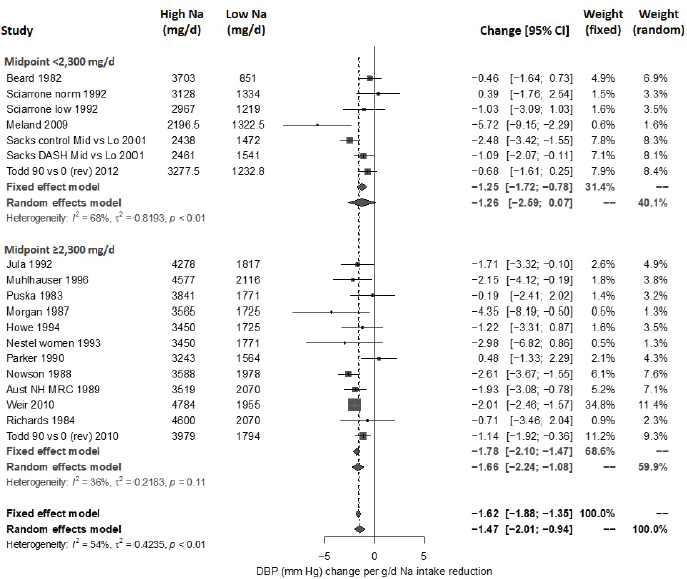
NOTES: Studies are listed by the last name of the first author and year of publication. For studies with multiple contrasts, a description of the comparison represented in the meta-analysis follows the author’s name. Sodium intake levels are presented in milligrams. To convert to mmol, divide the milligram value by 23.0. CI = confidence interval; DBP = diastolic blood pressure; g/d = gram per day; I2 = statistic that describes the percent of variation across studies due to heterogeneity; mg/d = milligrams per day; Na = sodium; rev = revised as compared to estimate used in the AHRQ Systematic Review.
Studies for which the midpoint of intakes between the control and intervention groups was < 2,300 mg/d (< 100 mmol/d) were more heterogeneous (I2 = 68 percent) than studies for which the midpoint intake was ≥ 2,300 mg/d (≥ 100 mmol/d; I2 = 36 percent). Some, but not all, subgroups by hypertension status or blood pressure medication had somewhat lower heterogeneity (I2 = 41 to 76 percent). Meta-regression by baseline blood pressure and control sodium intake level also could not explain observed heterogeneity. The summary intake–response slope did not depend on whether the midpoint of the intake range was < 2,300 mg/d (< 100 mmol/d) or not, consistent with a linear relationship extending from above to below
2,300 mg/d (100 mmol/d). Results did not change with the exclusion of the one study with a high risk of bias. A funnel plot asymmetry test for publication bias was not statistically significant (p = .57). The overall effect remained statistically significant after adjusting for possible publication bias using the trim-and-fill method. All estimates used the Knapp-Hartung modification.
Evidence rating for intake–response Using GRADE, the committee assessed the strength of evidence that reducing sodium intake reduces chronic disease risk in the intake range below 2,300 mg/d (100 mmol/d). The overall rating is low owing to concerns about inconsistency and indirectness, with details as to the rationale summarized in Table 10-11. Because of lack of data below 1,000 mg/d (43 mmol/d), this rating only applies for intakes down to this value.
Summary of Intake–Response Assessment
Table 10-12 presents the overall GRADE summary of findings for the intake–response relationship between the three sodium intake ranges evaluated above and cardiovascular chronic disease:
- The strongest evidence is in the intake range from 2,300–4,100 mg/d (100–178 mmol/d), with a high strength of evidence for chronic disease intake–response. In this intake range, a 1,000 mg/d (43 mmol/d) reduction of intake is expected to reduce chronic disease risk, as indicated by risk reduction for cardiovascular disease and hypertension, as well as by lowering of systolic blood pressure and diastolic blood pressure. These four related indicators, illustrated in the framework for sodium chronic disease outcomes (see Figure 10-13), are all concordant, pointing to decreased risk of chronic disease with decreased sodium intake in this range.
- Chronic disease intake–response for intakes of sodium above 4,100 mg/d (178 mmol/d) has a moderate strength of evidence up to a sodium intake of 5,000 mg/d (217 mmol/d). In this intake range, a 1,000 mg/d (43 mmol/d) intake reduction is expected to reduce chronic disease risk, as indicated by lowering of systolic blood pressure and diastolic blood pressure. Uncertainty in this intake range is primarily attributable to indirectness of evidence, including the lack of studies directly measuring cardiovascular disease or hypertension risk reduction, and lack of studies in which both control and intervention intake levels are above 4,100 mg/d (178 mmol/d). Additionally, the control intakes in the available studies only extended up to approximately 5,000 mg/d (217 mmol/d).
TABLE 10-11 GRADE Assessment Table for Intake–Response in Range Below 2,300 mg/d (100 mmol/d)
| GRADE Criteria | Ratinga | Reasons for Rating | Strength of Evidenceb |
|---|---|---|---|
| Outcome: Reduced chronic disease risk per 1,000 mg/d (43 mmol/d) sodium intake reduction, as indicated by cardiovascular disease, hypertension, systolic blood pressure, and diastolic blood pressure, in the intake range below 2,300 mg/d (100 mmol/d). | |||
| Study design | High | Randomized controlled trials. | |
| Risk of bias | No (0) | Only one study, for systolic blood pressure and diastolic blood pressure, had high risk of bias; results did not change with exclusion of this study. | |
| Inconsistency | Serious (−1) | For systolic blood pressure, there was substantial heterogeneity overall (I2 = 67 percent), which could only be partially explained. Removing one study reduced heterogeneity to moderate (I2 = 47 percent). Some, but not all, subgroups based on hypertension status or blood pressure medication use had lower heterogeneity, though subgroup differences were not statistically significant. For diastolic blood pressure, there was moderate heterogeneity overall (I2 = 54 percent), which could only be partially explained. Subgroups based on hypertension status or blood pressure medication use had moderate or substantial heterogeneity, though subgroup differences were not statistically significant. For both systolic blood pressure and diastolic blood pressure, several individual studies showed no effect. Additionally, studies more directly informative of intake–response in this range (where the midpoint of the intakes between the control and intervention was < 2,300 mg/d [< 100 mmol/d]) had substantial heterogeneity (I2 > 60 percent). Overall, a downgrade was applied because heterogeneity remained moderate after sources of heterogeneity were explored and was substantial in more directly informative studies; additionally, several studies individually showed no effect. | |
| Indirectness | Serious (−1) | Only one observational study with low risk of bias was available in this intake range for cardiovascular disease, one of the more direct measures of chronic disease risk. No data in this intake range were available for hypertension. | Low down to 1,000 mg/d (43 mmol/d); Insufficient below 1,000 mg/d (43 mmol/d)c |
| For systolic blood pressure and diastolic blood pressure, the midpoint of control and intervention intakes were < 2,300 mg/d for only 4 of the 17 randomized controlled trials studies of systolic blood pressure and diastolic blood pressure considered, totaling 6 comparisons; these 4 studies were all < 6 months in duration. All but 2 of the studies of systolic blood pressure and diastolic blood pressure included adults with hypertension, with the summary estimate for normotensives not statistically significant. Overall, a downgrade for indirectness was applied owing to the lack of studies fully (or mostly) within this intake range, the lack of studies in normotensives, and the lack of randomized controlled trials on cardiovascular disease and hypertension providing more direct evidence of reduced chronic disease risk. | |||
| Imprecision | No (0) | Statistically significant and biologically meaningful summary effect sizes for systolic blood pressure and diastolic blood pressure, across all studies and within all subgroups that included adults with hypertension. | |
| Publication bias | Undetected (0) | No publication bias detected; results similar if adjusted for possible publication bias using trim-and-fill procedure. | |
| Other | No (0) | Outcome already specified as an intake–response slope, so no additional upgrade for intake–response gradient. |
aTable format same as Table 10-2.
bThis terminology was used for consistency with the AHRQ Systematic Review. Preferred terminology under the GRADE system is certainty of the evidence or quality of the evidence.
cThis terminology was used for consistency with the AHRQ Systematic Review. Preferred terminology under the GRADE system is very low certainty or quality of the evidence.
-
Above this level of intake, the committee identified three studies with intakes up to approximately 8,000 mg/d (348 mmol/d) (He et al., 2009; Koolen et al., 1983; Takeshita et al., 1982). However, the interventions in these studies were of short duration (only up to 2 weeks) and therefore were excluded from the evidence. The absence of evidence above 8,000 mg/d (348 mmol/d) and the paucity of evidence between 5,000 and 8,000 mg/d (217 and 348 mmol/d) is not to be interpreted as indicating a safe level of intake. It is likely that cardiovascular disease risk will continue to increase above intake levels for which randomized controlled trial data are available.
- For intakes of sodium below 2,300 mg/d (100 mmol/d), there was a low strength of evidence for a chronic disease intake–response down to an intake of 1,000 mg/d (43 mmol/d). In this intake range, reduction in sodium intake may reduce chronic disease risk, as indicated by lowering of systolic blood pressure and diastolic blood pressure. Uncertainty in this intake range is primarily attributable to unexplained inconsistency across studies and indirectness of evidence. Failure to identify chronic disease risk reduction at intakes below 2,300 mg/d (100 mmol/d) likely reflects a lack of evidence rather than a lack of effect.
These ratings are consistent with the only available observational study rated as having low risk of bias that measured cardiovascular disease risk with sodium intake reduction (Cook et al., 2014). The findings from this study are consistent with the available randomized controlled trial data; linear regression that treats intakes as continuous indicated a 17 percent risk reduction [95% CI: 0, 36] per 1,000 mg/d (43 mmol/d) reduction in sodium intake. Additionally, as shown in Figure 10-27, results from spline regression indicated that the CIs begin to diverge below approximately 2,300 mg/d (100 mmol/d), consistent with the committee’s determination of a low strength of evidence from randomized controlled trial data in this intake range. As noted above, the committee did not use the evidence from observational studies on the potential J- or U-shaped relationships between sodium intake and health outcomes owing to the insufficient strength of evidence (see Chapter 8).
CHRONIC DISEASE RISK REDUCTION INTAKES FOR SODIUM
In the sections above, the committee reviewed the evidence on potential indicators to inform the sodium DRIs based on chronic disease, which included consideration of both causal and intake–response relationships
(see Tables 10-8 and 10-12 for summary). Specifically, the committee’s review of evidence for the four indicators above revealed the following:
- The committee’s meta-analyses and reassessment of the evidence provided in the AHRQ Systematic Review indicated a moderate strength of evidence for a causal relationship between reductions in sodium intake and any cardiovascular event. Likewise, there was a moderate strength of evidence from randomized controlled trials to suggest that reducing sodium intake reduces hypertension incidence.
- The committee’s meta-analyses and reassessment of the evidence provided in the AHRQ Systematic Review indicated a high strength of evidence from randomized controlled trials that reducing sodium intake reduces systolic and diastolic blood pressure. Much of the observed heterogeneity among trials examining systolic blood pressure could be explained by the net reduction in sodium (intake–response) and the baseline systolic blood pressure level. Among trials examining diastolic blood pressure, heterogeneity was mainly related to the difference in the size rather than in direction of the effect. The effect of sodium reduction was greater among adults with hypertension, but it was also evident among nonhypertensive adults.
The committee concludes there is moderate to high strength of evidence for both a causal relationship and an intake–response relationship between sodium and several interrelated chronic disease indicators: cardiovascular disease, hypertension, systolic blood pressure, and diastolic blood pressure. Evidence from these indicators can be synthesized to inform the development of a sodium Chronic Disease Risk Reduction Intake (CDRR).
The committee carefully considered how the guidance in the Guiding Principles Report applied to the evidence on the relationship between sodium intake and chronic disease. As introduced in Chapter 2, the committee encountered challenges in implementing the Guiding Principles Report recommendation that the DRI based on chronic disease be established as a range rather than a single value (see Chapter 2, Box 2-1, Recommendation 6). Based on the analyses in the preceding section, the committee could characterize an intake–response relationship of at least moderate strength up to sodium intakes of approximately 5,000 mg/d (217 mmol/d), but the committee did not have sufficient evidence from randomized controlled trials or low-risk-of-bias observational studies for sodium intakes above this level. The Guiding Principles Report anticipated that there may be
TABLE 10-12 Summary of Evidence Used to Determine the Intake–Response Relationship Between Reduction in Sodium Intake and Reduction in Chronic Disease Risk
| Sodium Intake Range, mg/d | Chronic Disease Indicator | Evidence Informing Intake–Response Relationshipa | Intake–Response, per 1,000 mg/d Reduction in Sodium Intake | Strength of Evidence for an Intake–Response Relationship Between Sodium Intake Reduction and Chronic Disease Risk Reductionb | |
|---|---|---|---|---|---|
| Estimate | [95% CI] | ||||
| > 8,000 | CVD, HTN, SBP, DBP | No eligible RCTs or low-risk-of-bias observational studies extend into this intake range | — | — | Insufficient, due to lack of eligible RCTs and no low-risk-of-bias observational studies |
| 5,000–8,000 | CVD, HTN, SBP, DBP | No eligible RCTs extend into this intake range; 1 low-risk-of-bias observational study on cardiovascular disease extends into this intake range | — | — | Insufficient, due to lack of eligible RCTs and only 1 low-risk-of-bias observational study |
| 4,100–5,000 | CVD | No eligible RCTs extend into this intake range; 1 low-risk-of-bias observational study extends into this intake range | — | — | Moderate, due to indirectness |
| HTN | No eligible RCTs or low-risk-of-bias observational studies extend into this intake range | — | — | ||
| SBP | 11 RCTs extend into this range (2 fully in this range) | 2.7 mm Hg reduction | [1.9, 3.5] | ||
| DBP | 10 RCTs extend into this range (1 fully in this range) | 1.7 mm Hg reduction | [0.3, 3.1] | ||
| 2,300–4,100 | CVD | 3 RCTs fully in this range; 1 low-risk-of-bias observational study extends into this intake range | 27% risk reductionc | [8, 43] | High |
| HTN | 3 RCTs fully in this range | 20% risk reductiond | [5, 32] | ||
| SBP | 21 RCTs fully in this rangee | 2.8 mm Hg reduction | [1.6, 4.0] | ||
| DBP | 20 RCTs fully in this rangef | 1.2 mm Hg reduction | [0.5, 1.9] | ||
| 1,000–2,300 | CVD | No eligible RCTs extend into this intake range; 1 low-risk-of-bias observational study extends into this range | — | — | Low, due to inconsistency and indirectness |
| HTN | No eligible RCTs or low-risk-of-bias observational studies extend into this intake range | — | — | ||
| SBP | 19 RCTs extend into this range (1 fully in this range)g | 2.4 mm Hg reduction | [1.5, 3.3] | ||
| DBP | 19 RCTs extend into this range (1 fully in this range)g | 1.5 mm Hg reduction | [0.9, 2.0] | ||
| < 1,000 | CVD, HTN, SBP, DBP | No eligible RCTs or low-risk-of-bias observational studies extend into this intake range | — | — | Insufficient, due to lack of eligible RCTs and no low-risk-of-bias observational studies |
NOTES: Sodium intake levels are present in mg/d. To convert to mmol, divide the milligram value by 23. CI = confidence interval; CVD = cardiovascular disease; DBP = diastolic blood pressure; HTN = hypertension; RCT = randomized controlled trial; SBP = systolic blood pressure.
aThe number of studies do not directly correspond to the strength of the evidence rating. For details on the evidence rating, see Tables 10-9, 10-10, and 10-11.
bThe purpose of the intake–response analysis is to determine the strength of evidence of a positive/negative/zero slope. All four indicators were examined together for assessing the strength of evidence for an intake–response relationship.
cTo calculate the percent reduction from the size effect ln(RR) = −0.32 in cardiovascular disease incidence the following conversion was made: RR = exp(−0.32) = 0.726; 0.726 corresponds to a 27 percent reduction in cardiovascular disease (1.0 − 0.27 = 0.73).
dTo calculate the percent reduction from the size effect ln(RR) = −0.22 in hypertension incidence the following conversion was made: RR = exp(−0.22) = 0.803; 0.803 corresponds to a 20 percent risk reduction in hypertension incidence (1.0 – 0.20 = 0.80).
eNumber of comparisons from 19 different studies.
fNumber of comparisons from 18 different studies.
gNumber of comparisons from 17 different studies.
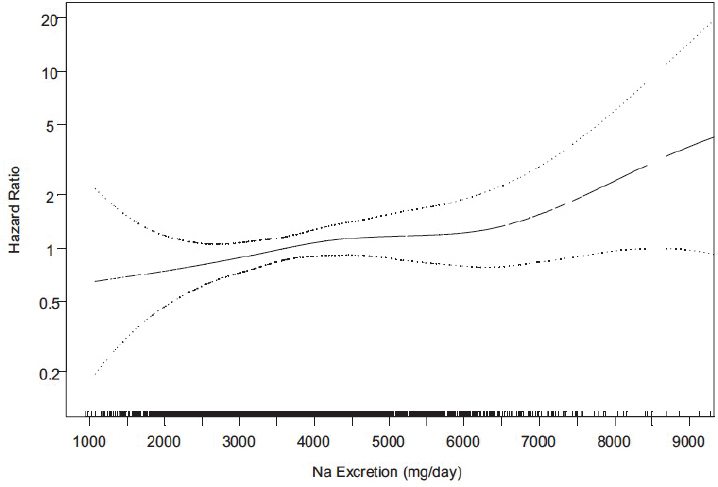
SOURCE: Cook et al., 2014. Reprinted with permission from Wolters Kluwer Health, Inc.
instances in which a lower strength of evidence could be used in the derivation of the DRI based on chronic disease, particularly when the nutrient increases chronic disease risk. The committee applied this guidance and assumed that sodium intakes above 5,000 mg/d (217 mmol/d) are likely to pose a continuing risk. Given the committee’s concerns that specifying an upper end of a range could be interpreted as suggesting that higher sodium intakes are not associated with chronic disease risk, the committee expressed the sodium CDRR as the lowest intake level for which there was sufficient evidence to characterize chronic disease risk reduction (see Box 10-8). For additional details regarding the committee’s selection of nomenclature and the conceptual underpinnings of the CDRR, see Chapter 2.
In addition, pursuant to the guidance in the Guiding Principles Report, the committee assessed the evidence by population subgroups defined by characteristics such as demographics and health status. The AHRQ Systematic Review concluded that there was insufficient strength of evidence that sex, age, ethnicity/race, diabetes status, kidney disease, or obesity and overweight moderate the effect of sodium intake on cardiovascular disease, hypertension, or blood pressure (see Boxes 10-3 through 10-5). Although
stronger effects of sodium intake have been reported among African Americans and older individuals (He et al., 2009; Vollmer et al., 2001; Weinberger and Fineberg, 1991; Weinberger et al., 1982; Wright et al., 2003), such evidence is based on short-term trials of blood pressure effects with little or no data on chronic disease outcomes. Thus, in keeping with the guidance in the Guiding Principles Report, the committee had insufficient basis to establish a different CDRR for specific population subgroups. The committee did not have access to individual patient data that may have allowed for additional analyses with respect to population subgroups and consideration of sodium CDRRs specific to them. The committee identified this limitation as a future direction in Chapter 12.
Specification of the Sodium CDRR Values
In the sections that follow, the committee specifies the sodium CDRR values for adults 19–70 years of age, and provides its rationale for extrapolating the sodium CDRR to adults > 70 years of age, to pregnant and lactating females, and to children and adolescents 1–18 years of age. A summary of the sodium CDRRs is presented at the end of this chapter.
Adults 19–70 Years of Age
In the sodium intake range 2,300–4,100 mg/d (100–178 mmol/d), there was high strength of evidence that reducing sodium intake reduces chronic disease risk, based on evidence of reduction in cardiovascular disease incidence, reduction in hypertension incidence, and lowering of systolic and diastolic blood pressure. At sodium intake levels above 4,100–5,000 mg/d (178–217 mmol/d), there was moderate strength of evidence of an intake–response relationship that reductions in sodium intake reduce chronic dis-
ease risk, based on evidence of reductions in systolic and diastolic blood pressure and one low-risk-of-bias observational study on cardiovascular disease. There were no eligible randomized controlled trials on cardiovascular disease, hypertension, or blood pressure identified at sodium intakes above 5,000 mg/d (217 mmol/d). The committee determined that the evidence for intakes above 5,000 mg/d (217 mmol/d) was insufficient, but assumed that sodium intakes above 5,000 mg/d (217 mmol/d) are likely to pose a continuing risk. For intakes below 2,300 mg/d (100 mmol/d), there is low strength of evidence that reducing sodium intakes reduces chronic disease risk, based on evidence of reductions in systolic and diastolic blood pressure down to 1,000 mg/d (43 mmol/d) and one low-risk-of-bias observational study on cardiovascular disease. There were, however, no eligible randomized controlled trials on cardiovascular disease, hypertension, or blood pressure identified at sodium intakes below 1,000 mg/d (43 mmol/d); therefore, the evidence was determined to be insufficient. Furthermore, for intakes below 2,300 mg/d (100 mmol/d), there was insufficient strength of evidence that reducing sodium intake is associated with harm, such as increased risk in mortality (for the committee’s review of this evidence, see Chapter 8). Finally, because the sodium AI for adults 19 years of age and older was established at 1,500 mg/d (65 mmol/d) (see Chapter 8), the committee restricted the options for the sodium CDRR to be at least this value or higher.
The committee considered two options for establishing the sodium CDRR for adults 19–70 years of age:
Based on its synthesis of the evidence and its interpretation of the guidance provided in the Guiding Principles Report, the committee selected Option 1 for the following reasons:
- The committee conceptualized the sodium CDRR as the lowest level of intake for which there was sufficient strength of evidence to characterize a chronic disease risk reduction. In its identification of the lowest level of intake, the committee followed the Guiding Principles Report recommendation that a DRI based on chronic disease be based on at least moderate strength of evidence for both the causal and the intake–response relationships. Such strength of evidence existed for sodium intakes down to 2,300 mg/d (100 mmol/d).
- For sodium intakes below 2,300 mg/d (100 mmol/d) down to the sodium AI for adults (1,500 mg/d [65 mmol/d]), there was evidence from randomized controlled trials that reducing sodium intake lowers blood pressure. Although blood pressure was considered a qualified surrogate maker in the context of sodium intake reductions (see Annex 10-2), the strength of evidence for an intake–response relationship between reductions in sodium intake and reductions in chronic disease risk was rated as low.
- Observational studies on associations between sodium intakes below 2,300 mg/d (100 mmol/d) and chronic disease endpoints are sparse. Such observational studies are also diverse in design and can have methodological issues that create challenges in interpreting their body of evidence as a whole (see Chapter 8).
Although there might be long-term health benefits of reducing usual sodium intake below 2,300 mg/d (100 mmol/d), there was enough uncertainty to not establish the CDRR below this intake level. A sodium CDRR of reducing intakes if above 2,300 mg/d (100 mmol/d) is supported by multiple indicators in study populations that include normotensive individuals, individuals with prehypertension, and individuals with hypertension. There was insufficient evidence to specify different CDRRs based on parameters such as baseline systolic or diastolic blood pressure. Likewise, there was insufficient evidence of a moderating effect of sex, age, or race/ethnicity. In addition, based on the AHRQ Systematic Review conclusion that the evidence is insufficient about the moderating effects of diabetes status, kidney
disease, or obesity and overweight, the committee was unable to determine whether the sodium CDRR applies to groups with those conditions. The sodium CDRR is applicable to adults with and without hypertension, irrespective of sex, age, or race/ethnicity.
Extrapolation to Other DRI Age and Life-Stage Groups
Adults > 70 years of age The AHRQ Systematic Review concluded that there was insufficient evidence to determine a moderating effect of age on the effects of sodium reduction on cardiovascular disease. Several of the randomized controlled trials included in the committee’s analyses reported allowing participants older than 70 years of age to be included in the study (Appel et al., 2001; Cappuccio et al., 2006; Howe et al., 1994; Hwang et al., 2014; Meland and Aamland, 2009; Nakano et al., 2016; Nestel et al., 1993; Schorr et al., 1996; Wing et al., 1998). None of the studies were conducted exclusively in individuals in this age range. One study reported on a subgroup analysis among participants 70–80 years of age (Appel et al., 2001). Systolic and diastolic blood pressure were not statistically different after 3.5 months in the sodium reduction group (n = 66), as compared to the usual lifestyle group (n = 66) (systolic MD = −1.5 mm Hg [95% CI: −5.4, 2.4], p = .46; diastolic MD = −1.4 mm Hg [95% CI: −3.9, 1.0], p = .25). During a mean of 27.8 months of follow-up, risk of the trial endpoints (high blood pressure, resumption of antihypertensive medications, or cardiovascular event) was not statistically significant (relative HR = 0.75 [95% CI: 0.50, 1.14], p = .18). The investigators suggested that the lack of statistical significance could have been caused by small sample size. No other studies included in the committee’s analyses reported results specifically on this age group.
Given the high risk of hypertension and cardiovascular disease and the higher prevalence of hypertension and use of any antihypertensive medications with increasing age (Carson et al., 2011; Fang et al., 2018; Fryar et al., 2017; Gu et al., 2012), the committee considered it appropriate from a public health context to extrapolate the sodium CDRR to this age group. Therefore, the committee established a sodium CDRR for individuals > 70 years of age as reducing intakes if above 2,300 mg/d (100 mmol/d).13
Pregnancy and lactation There was insufficient evidence that a different CDRR is needed for pregnant or lactating females. The committee establishes the same CDRR for pregnant and lactating females as for their nonpregnant, nonlactating age group counterparts.
___________________
13 This text was revised since the prepublication release.
Children and adolescents 1–18 years of age As described in Box 10-5, the AHRQ Systematic Review concluded that there was low strength of evidence that reductions in sodium intake may not decrease systolic blood pressure and low strength of evidence that reductions in sodium intake reduce diastolic blood pressure (based on only low and moderate risk of bias studies). Given that this strength of evidence is not of sufficient strength, based on GRADE, to derive sodium CDRRs for children, the committee considered other evidence to determine if extrapolation was appropriate.
In addition to the randomized controlled trials included in the AHRQ Systematic Review, the committee also assessed the evidence from prospective cohort studies that examined the association of sodium intake (urinary excretion or dietary assessment) and longitudinal change in blood pressure in children and adolescents (Buendia et al., 2015; Geleijnse et al., 1990; Setayeshgar et al., 2017; Shi et al., 2014). Setayeshgar et al. (2017) followed 448 schoolchildren 10–17 years of age for 2 years and reported borderline significance in the association between sodium intake and diastolic but not systolic blood pressure. None of the other studies reported a significant change in either systolic or diastolic blood pressure. These observational studies were rated as having a high risk of bias. Based on the findings from the randomized controlled trials and the prospective cohort studies, there was insufficient evidence to assess the relationship between sodium intake and blood pressure in children and adolescents.
Longitudinal cohort studies have documented blood pressure tracking from childhood to adulthood (Chen and Wang, 2008; Toschke et al., 2010). In a systematic review and meta-analysis of 50 longitudinal cohort studies, pooled correlation coefficients of blood pressure tracking from childhood to adulthood were 0.38 for systolic blood pressure and 0.28 for diastolic blood pressure (Chen and Wang, 2008). The tracking correlation coefficients varied significantly according to baseline age (0.18, 0.40, 0.42, and 0.43 for systolic blood pressure and 0.09, 0.29, 0.29, and 0.32 for diastolic blood pressure among children < 5, 5–9, 10–14, and ≥ 15 years of age, respectively). In another meta-analysis, Toschke et al. (2010) assessed 29 studies among individuals 10 years of age or older and reported higher pooled tracking correlation coefficients of 0.37–0.47 for systolic and 0.36–0.46 for diastolic blood pressure. In addition, several prospective cohort studies have reported that elevated blood pressure in childhood predicted the subsequent risk of hypertension in adulthood (Bao et al., 1995; Gillman et al., 1993; Xi et al., 2017). Despite results from two trials in newborn infants suggesting a relationship between dietary sodium intake and blood pressure during the first few months of life (Hofman et al., 1983; Pomeranz et al., 2002), blood pressure tracking from children younger than 5 years of age to adulthood is weak (Chen and Wang, 2008). There is also a lack
of data on the association between blood pressure in children 1–3 years of age and the subsequent risk of hypertension and cardiovascular disease in adulthood.
Despite the insufficient evidence to assess the relationship between sodium intake and chronic disease risk in children and adolescents, and the uncertainties about the long-term chronic disease benefits of reduced sodium intake beginning in childhood, the committee considered the risk of not setting a CDRR to outweigh the risk of setting a sodium CDRR for children and adolescents. The committee rationale for extrapolating the sodium CDRR to children and adolescents 1–18 years of age is based on evidence of blood pressure tracking to adulthood, the public health importance, and consideration of salt-taste sensitivity and preferences starting to develop as early as 3–4 months of age (Liem, 2017; Stein et al., 2012).
The sodium CDRR for children and adolescents was extrapolated from the adult sodium CDRR. To extrapolate, the committee used rounded average Estimated Energy Requirements (EERs) for sedentary individuals for each age group (see Table 10-13), as compared to an EER for adults of 2,000 kcal/d. EERs were used instead of self- or proxy-reported energy intake owing to potential biases in reported dietary intake data. Extrapolated sodium CDRRs were mathematically rounded to the nearest 100 mg/d increment.
TABLE 10-13 Estimated Energy Requirements for Sedentary Children and Adolescents 1–18 Years of Age, by Age Group
| Age Group | Average EER (kcal/d) | Rounded Average EER (kcal/d) |
|---|---|---|
| 1–3 years | 1,000a | 1,000a |
| 4–8 years | 1,280 | 1,300 |
| 9–13 years | 1,640 | 1,600 |
| 14–18 years | 2,040 | 2,000 |
NOTES: Unless otherwise noted, sedentary EERs were drawn from a summary table in the 2015–2020 Dietary Guidelines for Americans (HHS/USDA, 2015), which were derived from the EER equations (IOM, 2002/2005). The average estimated requirements were determined by a simple average of the estimated energy needs for sedentary males and females within each age range. Average intakes were mathematically rounded. EER = Estimated Energy Requirement; kcal = kilocalorie.
aThe 2015–2020 Dietary Guidelines for Americans provides dietary guidance for individuals 2 years of age and older. The summary table of sedentary EERs did not include children 1 year of age. The committee considered the effect of the EER for children 1 year of age on the rounded average for the 1–3-year-old age group. The average of EERs for children 12–24 months are estimated to be below 1,000 kcal/d (IOM, 2002/2005, pp. 169–170), but are not low enough to affect the rounded average EER. As such, 1,000 kcal/d was used in extrapolating the adult sodium Adequate Intake (AI) to children 1–3 years of age.
TABLE 10-14 Chronic Disease Risk Reduction Intake (CDRR) by Age Group
| Nutrient | Population Group | Recommendation |
|---|---|---|
| Sodium | Children, 1–3 years | Reduce intakes if above 1,200 mg/daya |
| Children, 4–8 years | Reduce intakes if above 1,500 mg/daya | |
| Adolescents, 9–13 years | Reduce intakes if above 1,800 mg/daya | |
| Adolescents, 14–18 years | Reduce intakes if above 2,300 mg/daya | |
| Adults, ≥ 19 years | Reduce intakes if above 2,300 mg/day |
NOTES: The sodium CDRRs are presented in milligrams. To convert to mmol, divide the milligram value by 23.0.
aExtrapolated from the adult CDRR based on sedentary Estimated Energy Requirements.
SUMMARY
The sodium CDRRs are established through a synthesis of evidence from sodium reduction trials and outcomes of incident cardiovascular disease, incident hypertension, systolic blood pressure, and diastolic blood pressure. The sodium CDRR is the lowest level of intake for which there was sufficient strength of evidence to characterize a chronic disease risk reduction. For sodium, the CDRR is the intake above which intake reduction is expected to reduce chronic disease risk within an apparently healthy population. Among adults, further reductions in sodium intake below the CDRR have demonstrated a lowering effect on blood pressure, but the effect on chronic disease risk could not be characterized. A summary of the sodium CDRRs is presented in Table 10-14.
REFERENCES
AHRQ (Agency for Healthcare Research and Quality). 2014. Methods guide for effectiveness and comparative effectiveness reviews. Rockville, MD: AHRQ.
Appel, L. J., M. A. Espeland, L. Easter, A. C. Wilson, S. Folmar, and C. R. Lacy. 2001. Effects of reduced sodium intake on hypertension control in older individuals: Results from the Trial of Nonpharmacologic Interventions in the Elderly (TONE). Archives of Internal Medicine 161(5):685-693.
Applegate, W. B., S. T. Miller, J. T. Elam, W. C. Cushman, D. el Derwi, A. Brewer, and M. J. Graney. 1992. Nonpharmacologic intervention to reduce blood pressure in older patients with mild hypertension. Archives of Internal Medicine 152(6):1162-1166.
Bao, W., S. A. Threefoot, S. R. Srinivasan, and G. S. Berenson. 1995. Essential hypertension predicted by tracking of elevated blood pressure from childhood to adulthood: The Bogalusa Heart Study. American Journal of Hypertension 8(7):657-665.
Beard, T. C., H. M. Cooke, W. R. Gray, and R. Barge. 1982. Randomised controlled trial of a no-added-sodium diet for mild hypertension. Lancet 2(8296):455-458.
Bender, R., T. Friede, A. Koch, O. Kuss, P. Schlattmann, G. Schwarzer, and G. Skipka. 2018. Methods for evidence synthesis in the case of very few studies. Research Synthesis Methods 9(3):382-392.
Berlin, J. A., M. P. Longnecker, and S. Greenland. 1993. Meta-analysis of epidemiologic dose-response data. Epidemiology 4(3):218-228.
Buendia, J. R., M. L. Bradlee, S. R. Daniels, M. R. Singer, and L. L. Moore. 2015. Longitudinal effects of dietary sodium and potassium on blood pressure in adolescent girls. JAMA Pediatrics 169(6):560-568.
Bulpitt, C. J., M. Daymond, P. F. Bulpitt, G. Ferrier, R. Harrison, P. J. Lewis, and C. T. Dollery. 1984. Is low salt dietary advice a useful therapy in hypertensive patients with poorly controlled blood pressure? Annals of Clinical Research 16(Suppl 43):143-149.
Cappuccio, F. P., S. M. Kerry, F. B. Micah, J. Plange-Rhule, and J. B. Eastwood. 2006. A community programme to reduce salt intake and blood pressure in Ghana [ISRCTN88789643]. BMC Public Health 6:13.
Carson, A. P., G. Howard, G. L. Burke, S. Shea, E. B. Levitan, and P. Muntner. 2011. Ethnic differences in hypertension incidence among middle-aged and older adults: The MultiEthnic Study of Atherosclerosis. Hypertension 57(6):1101-1107.
Chang, H. Y., Y. W. Hu, C. S. Yue, Y. W. Wen, W. T. Yeh, L. S. Hsu, S. Y. Tsai, and W. H. Pan. 2006. Effect of potassium-enriched salt on cardiovascular mortality and medical expenses of elderly men. American Journal of Clinical Nutrition 83(6):1289-1296.
Charlton, K. E., K. Steyn, N. S. Levitt, N. Peer, D. Jonathan, T. Gogela, K. Rossouw, N. Gwebushe, and C. J. Lombard. 2008. A food-based dietary strategy lowers blood pressure in a low socio-economic setting: A randomised study in South Africa. Public Health Nutrition 11(12):1397-1406.
Chen, X., and Y. Wang. 2008. Tracking of blood pressure from childhood to adulthood: A systematic review and meta-regression analysis. Circulation 117(25):3171-3180.
Cobb, L. K., C. A. Anderson, P. Elliott, F. B. Hu, K. Liu, J. D. Neaton, P. K. Whelton, M. Woodward, and L. J. Appel. 2014. Methodological issues in cohort studies that relate sodium intake to cardiovascular disease outcomes: A science advisory from the American Heart Association. Circulation 129(10):1173-1186.
Cook, N. R., J. A. Cutler, E. Obarzanek, J. E. Buring, K. M. Rexrode, S. K. Kumanyika, L. J. Appel, and P. K. Whelton. 2007. Long term effects of dietary sodium reduction on cardiovascular disease outcomes: Observational follow-up of the Trials of Hypertension Prevention (TOHP). BMJ 334(7599):885-888.
Cook, N. R., L. J. Appel, and P. K. Whelton. 2014. Lower levels of sodium intake and reduced cardiovascular risk. Circulation 129(9):981-989.
Crippa, A., and N. Orsini. 2016. Dose-response meta-analysis of differences in means. BMC Medical Research Methodology 16:91.
CSSSCG (China Salt Substitute Study Collaborative Group). 2007. Salt substitution: A low-cost strategy for blood pressure control among rural Chinese. A randomized, controlled trial. Journal of Hypertension 25(10):2011-2018.
Deeks, J. J., J. P. Higgins, and D. G. Altman. 2008. Analysing data and undertaking meta-analyses. In Cochrane handbook for systematic reviews of interventions, edited by J. P. Higgins and S. Green. https://onlinelibrary.wiley.com/action/showCitFormats?doi=10.1002%2F9780470712184.ch9 (accessed January 18, 2019).
Del Gobbo, L. C., F. Imamura, J. H. Wu, M. C. de Oliveira Otto, S. E. Chiuve, and D. Mozaffarian. 2013. Circulating and dietary magnesium and risk of cardiovascular disease: A systematic review and meta-analysis of prospective studies. American Journal of Clinical Nutrition 98(1):160-173.
Del Gobbo, L. C., M. C. Falk, R. Feldman, K. Lewis, and D. Mozaffarian. 2015. Effects of tree nuts on blood lipids, apolipoproteins, and blood pressure: Systematic review, meta-analysis, and dose-response of 61 controlled intervention trials. American Journal of Clinical Nutrition 102(6):1347-1356.
Duval, S., and R. Tweedie. 2000. Trim and fill: A simple funnel-plot-based method of testing and adjusting for publication bias in meta-analysis. Biometrics 56(2):455-463.
Egger, M., G. Davey Smith, M. Schneider, and C. Minder. 1997. Bias in meta-analysis detected by a simple, graphical test. BMJ 315(7109):629-634.
Fang, J., C. Gillespie, C. Ayala, and F. Loustalot. 2018. Prevalence of self-reported hypertension and antihypertensive medication use among adults aged ≥18 Years—United States, 2011–2015. Morbidity and Mortality Weekly Report 67(7):219-224.
Fryar, C. D., Y. Ostchega, C. M. Hales, G. Zhang, and D. Kruszon-Moran. 2017. Hypertension prevalence and control among adults: United States, 2015-2016. NCHS Data Brief (289):1-8.
Geleijnse, J. M., D. E. Grobbee, and A. Hofman. 1990. Sodium and potassium intake and blood pressure change in childhood. BMJ 300(6729):899-902.
Gilleran, G., M. O’Leary, W. A. Bartlett, H. Vinall, A. F. Jones, and P. M. Dodson. 1996. Effects of dietary sodium substitution with potassium and magnesium in hypertensive type II diabetics: A randomised blind controlled parallel study. Journal of Human Hypertension 10(8):517-521.
Gillman, M. W., N. R. Cook, B. Rosner, D. A. Evans, M. E. Keough, J. O. Taylor, and C. H. Hennekens. 1993. Identifying children at high risk for the development of essential hypertension. Journal of Pediatrics 122(6):837-846.
Gonnermann, A., T. Framke, A. Grosshennig, and A. Koch. 2015. No solution yet for combining two independent studies in the presence of heterogeneity. Statistics in Medicine 34(16):2476-2480.
Greenland, S., and M. P. Longnecker. 1992. Methods for trend estimation from summarized dose-response data, with applications to meta-analysis. American Journal of Epidemiology 135(11):1301-1309.
Gu, Q., V. L. Burt, C. F. Dillon, and S. Yoon. 2012. Trends in antihypertensive medication use and blood pressure control among United States adults with hypertension: The National Health and Nutrition Examination Survey, 2001 to 2010. Circulation 126(17):2105-2114.
Guyatt, G., A. D. Oxman, E. A. Akl, R. Kunz, G. Vist, J. Brozek, S. Norris, Y. Falck-Ytter, P. Glasziou, H. DeBeer, R. Jaeschke, D. Rind, J. Meerpohl, P. Dahm, and H. J. Schunemann. 2011a. GRADE guidelines: 1. Introduction-GRADE evidence profiles and summary of findings tables. Journal of Clinical Epidemiology 64(4):383-394.
Guyatt, G. H., A. D. Oxman, V. Montori, G. Vist, R. Kunz, J. Brozek, P. Alonso-Coello, B. Djulbegovic, D. Atkins, Y. Falck-Ytter, J. W. Williams, Jr., J. Meerpohl, S. L. Norris, E. A. Akl, and H. J. Schunemann. 2011b. GRADE guidelines: 5. Rating the quality of evidence—publication bias. Journal of Clinical Epidemiology 64(12):1277-1282.
Guyatt, G. H., A. D. Oxman, R. Kunz, J. Brozek, P. Alonso-Coello, D. Rind, P. J. Devereaux, V. M. Montori, B. Freyschuss, G. Vist, R. Jaeschke, J. W. Williams, Jr., M. H. Murad, D. Sinclair, Y. Falck-Ytter, J. Meerpohl, C. Whittington, K. Thorlund, J. Andrews, and H. J. Schunemann. 2011c. GRADE guidelines 6. Rating the quality of evidence—imprecision. Journal of Clinical Epidemiology 64(12):1283-1293.
He, F. J., Y. Wu, X. X. Feng, J. Ma, Y. Ma, H. Wang, J. Zhang, J. Yuan, C. P. Lin, C. Nowson, and G. A. MacGregor. 2015. School based education programme to reduce salt intake in children and their families (School-EduSalt): Cluster randomised controlled trial. BMJ 350:h770.
He, J., P. K. Whelton, L. J. Appel, J. Charleston, and M. J. Klag. 2000. Long-term effects of weight loss and dietary sodium reduction on incidence of hypertension. Hypertension 35(2):544-549.
He, J., D. Gu, J. Chen, C. E. Jaquish, D. C. Rao, J. E. Hixson, J. C. Chen, X. Duan, J. F. Huang, C. S. Chen, T. N. Kelly, L. A. Bazzano, and P. K. Whelton. 2009. Gender difference in blood pressure responses to dietary sodium intervention in the GenSalt study. Journal of Hypertension 27(1):48-54.
HHS/USDA (U.S. Department of Health and Human Services/U.S. Department of Agriculture). 2015. 2015–2020 Dietary Guidelines for Americans, 8th ed. http://health.gov/dietaryguidelines/2015/guidelines (accessed February 14, 2019).
Hofman, A., A. Hazebroek, and H. A. Valkenburg. 1983. A randomized trial of sodium intake and blood pressure in newborn infants. JAMA 250(3):370-373.
Howe, P. R., Y. K. Lungershausen, L. Cobiac, G. Dandy, and P. J. Nestel. 1994. Effect of sodium restriction and fish oil supplementation on BP and thrombotic risk factors in patients treated with ACE inhibitors. Journal of Human Hypertension 8(1):43-49.
HPTRG (Hypertension Prevention Trial Research Group). 1990. The Hypertension Prevention Trial: Three-year effects of dietary changes on blood pressure. Hypertension Prevention Trial Research Group. Archives of Internal Medicine 150(1):153-162.
Hwang, J. H., H. J. Chin, S. Kim, D. K. Kim, S. Kim, J. H. Park, S. J. Shin, S. H. Lee, B. S. Choi, and C. S. Lim. 2014. Effects of intensive low-salt diet education on albuminuria among nondiabetic patients with hypertension treated with olmesartan: A single-blinded randomized, controlled trial. Clinical Journal of the American Society of Nephrology 9(12):2059-2069.
IntHout, J., J. P. Ioannidis, and G. F. Borm. 2014. The Hartung-Knapp-Sidik-Jonkman method for random effects meta-analysis is straightforward and considerably outperforms the standard DerSimonian-Laird method. BMC Medical Research Methodology 14:25.
IOM (Institute of Medicine). 2002/2005. Dietary Reference Intakes for energy, carbohydrate, fiber, fat, fatty acids, cholesterol, protein, and amino acids. Washington, DC: The National Academies Press.
IOM. 2005. Dietary Reference Intakes for water, potassium, sodium, chloride, and sulfate. Washington, DC: The National Academies Press.
Jackson, D., M. Law, G. Rucker, and G. Schwarzer. 2017. The Hartung-Knapp modification for random-effects meta-analysis: A useful refinement but are there any residual concerns? Statistics in Medicine 36(25):3923-3934.
Knuist, M., G. J. Bonsel, H. A. Zondervan, and P. E. Treffers. 1998. Low sodium diet and pregnancy-induced hypertension: A multi-centre randomised controlled trial. British Journal of Obstetrics and Gynaecology 105(4):430-434.
Koolen, M. I., E. Bussemaker-Verduyn den Boer, and P. van Brummelen. 1983. Clinical biochemical and haemodynamic correlates of sodium sensitivity in essential hypertension. Journal of Hypertension. Supplement 1(2):21-23.
Kumanyika, S. K., N. R. Cook, J. A. Cutler, L. Belden, A. Brewer, J. D. Cohen, P. R. Hebert, V. I. Lasser, J. Raines, J. Raczynski, L. Shepek, L. Diller, P. K. Whelton, and M. Yamamoto. 2005. Sodium reduction for hypertension prevention in overweight adults: Further results from the Trials of Hypertension Prevention Phase II. Journal of Human Hypertension 19(1):33-45.
Kwakernaak, A. J., J. A. Krikken, S. H. Binnenmars, F. W. Visser, M. H. Hemmelder, A. J. Woittiez, H. Groen, G. D. Laverman, and G. Navis. 2014. Effects of sodium restriction and hydrochlorothiazide on RAAS blockade efficacy in diabetic nephropathy: A randomised clinical trial. Lancet Diabetes and Endocrinology 2(5):385-395.
Liem, D. G. 2017. Infants’ and children’s salt taste perception and liking: A review. Nutrients 9(9):1011.
Meland, E., and A. Aamland. 2009. Salt restriction among hypertensive patients: Modest blood pressure effect and no adverse effects. Scandinavian Journal of Primary Health Care 27(2):97-103.
Meuleman, Y., T. Hoekstra, F. W. Dekker, G. Navis, L. Vogt, P. J. M. van der Boog, W. J. W. Bos, G. A. van Montfrans, and S. van Dijk. 2017. Sodium restriction in patients with CKD: A randomized controlled trial of self-management support. American Journal of Kidney Diseases 69(5):576-586.
Morgan, T., W. Adam, A. Gillies, M. Wilson, G. Morgan, and S. Carney. 1978. Hypertension treated by salt restriction. Lancet 1(8058):227-230.
Morikawa, N., K. Yamasue, O. Tochikubo, and S. Mizushima. 2011. Effect of salt reduction intervention program using an electronic salt sensor and cellular phone on blood pressure among hypertensive workers. Clinical and Experimental Hypertension 33(4):216-222.
Morton, S. C., M. H. Murad, E. O’Connor, C. S. Lee, M. Booth, B. W. Vandermeer, J. M. Snowden, K. E. D’Anci, R. Fu, G. Gartlehner, Z. Wang, and D. W. Steele. 2018. Quantitative synthesis—An update. Methods guide for comparative effectiveness reviews. Rockville, MD: Agency for Healthcare Research and Quality.
Mozaffarian, D., S. Fahimi, G. M. Singh, R. Micha, S. Khatibzadeh, R. E. Engell, S. Lim, G. Danaei, M. Ezzati, J. Powles, and Global Burden of Diseases Nutrition and Chronic Diseases Expert Group. 2014. Global sodium consumption and death from cardiovascular causes. New England Journal of Medicine 371(7):624-634.
Murtaugh, M. A., J. M. Beasley, L. J. Appel, P. M. Guenther, M. McFadden, T. Greene, and J. A. Tooze. 2018. Relationship of sodium intake and blood pressure varies with energy intake: Secondary analysis of the DASH (Dietary Approaches to Stop Hypertension)Sodium Trial. Hypertension 71(5):858-865.
Nakano, M., K. Eguchi, T. Sato, A. Onoguchi, S. Hoshide, and K. Kario. 2016. Effect of intensive salt-restriction education on clinic, home, and ambulatory blood pressure levels in treated hypertensive patients during a 3-month education period. Journal of Clinical Hypertension (Greenwich, Conn.) 18(5):385-392.
NASEM (National Academies of Sciences, Engineering, and Medicine). 2017. Guiding principles for developing Dietary Reference Intakes based on chronic disease. Washington, DC: The National Academies Press.
Nestel, P. J., P. M. Clifton, M. Noakes, R. McArthur, and P. R. Howe. 1993. Enhanced blood pressure response to dietary salt in elderly women, especially those with small waist:hip ratio. Journal of Hypertension 11(12):1387-1394.
Newberry, S. J., M. Chung, C. A. M. Anderson, C. Chen, Z. Fu, A. Tang, N. Zhao, M. Booth, J. Marks, S. Hollands, A. Motala, J. K. Larkin, R. Shanman, and S. Hempel. 2018. Sodium and potassium intake: Effects on chronic disease outcomes and risks. Rockville, MD: Agency for Healthcare Research and Quality.
Nowson, C. A., and T. O. Morgan. 1988. Change in blood pressure in relation to change in nutrients effected by manipulation of dietary sodium and potassium. Clinical and Experimental Pharmacology and Physiology 15(3):225-242.
Pomeranz, A., T. Dolfin, Z. Korzets, A. Eliakim, and B. Wolach. 2002. Increased sodium concentrations in drinking water increases blood pressure in neonates. Journal of Hypertension 20(2):203-207.
Ryan, R., and S. Hill. 2016. How to GRADE the quality of the evidence. https://cc.cochrane.org/sites/cc.cochrane.org/files/public/uploads/how_to_grade.pdf (accessed February 18, 2019).
Sacks, F. M., L. P. Svetkey, W. M. Vollmer, L. J. Appel, G. A. Bray, D. Harsha, E. Obarzanek, P. R. Conlin, E. R. Miller, 3rd, D. G. Simons-Morton, N. Karanja, and P. H. Lin. 2001. Effects on blood pressure of reduced dietary sodium and the Dietary Approaches to Stop Hypertension (DASH) diet. DASH-Sodium Collaborative Research Group. New England Journal of Medicine 344(1):3-10.
Santos, A., M. J. Martins, J. T. Guimaraes, M. Severo, and I. Azevedo. 2010. Sodium-rich carbonated natural mineral water ingestion and blood pressure. Revista Portuguesa de Cardiologia 29(2):159-172.
Sarkkinen, E. S., M. J. Kastarinen, T. H. Niskanen, P. H. Karjalainen, T. M. Venalainen, J. K. Udani, and L. K. Niskanen. 2011. Feasibility and antihypertensive effect of replacing regular salt with mineral salt—rich in magnesium and potassium—in subjects with mildly elevated blood pressure. Nutrition Journal 10:88.
Schorr, U., A. Distler, and A. M. Sharma. 1996. Effect of sodium chloride- and sodium bicarbonate-rich mineral water on blood pressure and metabolic parameters in elderly normotensive individuals: A randomized double-blind crossover trial. Journal of Hypertension 14(1):131-135.
Seals, D. R., H. Tanaka, C. M. Clevenger, K. D. Monahan, M. J. Reiling, W. R. Hiatt, K. P. Davy, and C. A. DeSouza. 2001. Blood pressure reductions with exercise and sodium restriction in postmenopausal women with elevated systolic pressure: Role of arterial stiffness. Journal of the American College of Cardiology 38(2):506-513.
Setayeshgar, S., J. P. Ekwaru, K. Maximova, S. R. Majumdar, K. E. Storey, J. McGavock, and P. J. Veugelers. 2017. Dietary intake and prospective changes in cardiometabolic risk factors in children and youth. Applied Physiology, Nutrition, and Metabolism. Physiologie Appliquée, Nutrition et Métabolisme 42(1):39-45.
Shi, L., D. Krupp, and T. Remer. 2014. Salt, fruit and vegetable consumption and blood pressure development: A longitudinal investigation in healthy children. British Journal of Nutrition 111(4):662-671.
Silman, A. J., C. Locke, P. Mitchell, and P. Humpherson. 1983. Evaluation of the effectiveness of a low sodium diet in the treatment of mild to moderate hypertension. Lancet 1(8335):1179-1182.
Steegers, E. A., H. P. Van Lakwijk, H. W. Jongsma, J. H. Fast, T. De Boo, T. K. Eskes, and P. R. Hein. 1991. (Patho)physiological implications of chronic dietary sodium restriction during pregnancy; A longitudinal prospective randomized study. British Journal of Obstetrics and Gynaecology 98(10):980-987.
Stein, L. J., B. J. Cowart, and G. K. Beauchamp. 2012. The development of salty taste acceptance is related to dietary experience in human infants: A prospective study. American Journal of Clinical Nutrition 95(1):123-129.
Sterne, J. A., A. J. Sutton, J. P. Ioannidis, N. Terrin, D. R. Jones, J. Lau, J. Carpenter, G. Rücker, R. M. Harbord, C. H. Schmid, J. Tetzlaff, J. J. Deeks, J. Peters, P. Macaskill, G. Schwarzer, S. Duval, D. G. Altman, D. Moher, and J. P. Higgins. 2011. Recommendations for examining and interpreting funnel plot asymmetry in meta-analyses of randomized controlled trials. BMJ 343:d4002.
Takahashi, Y., S. Sasaki, S. Okubo, M. Hayashi, and S. Tsugane. 2006. Blood pressure change in a free-living population-based dietary modification study in Japan. Journal of Hypertension 24(3):451-458.
Takeshita, A., T. Imaizumi, T. Ashihara, and M. Nakamura. 1982. Characteristics of responses to salt loading and deprivation in hypertensive subjects. Circulation Research 51(4):457-464.
Todd, A. S., R. J. Macginley, J. B. Schollum, R. J. Johnson, S. M. Williams, W. H. Sutherland, J. I. Mann, and R. J. Walker. 2010. Dietary salt loading impairs arterial vascular reactivity. American Journal of Clinical Nutrition 91(3):557-564.
Todd, A. S., R. J. Macginley, J. B. Schollum, S. M. Williams, W. H. Sutherland, J. I. Mann, and R. J. Walker. 2012. Dietary sodium loading in normotensive healthy volunteers does not increase arterial vascular reactivity or blood pressure. Nephrology (Carlton) 17(3):249-256.
TOHP (Trials of Hypertension Prevention) Collaborative Research Group. 1992a. Erratum. The effects of nonpharmacologic interventions on blood pressure of persons with high normal levels. Results of the Trials of Hypertension Prevention, Phase I. JAMA 267(17):2330.
TOHP Collaborative Research Group. 1992b. The effects of nonpharmacologic interventions on blood pressure of persons with high normal levels. Results of the Trials of Hypertension Prevention, Phase I. JAMA 267(9):1213-1220.
TOHP Collaborative Research Group. 1997. Effects of weight loss and sodium reduction intervention on blood pressure and hypertension incidence in overweight people with high-normal blood pressure. The Trials of Hypertension Prevention, phase II. The Trials of Hypertension Prevention Collaborative Research Group. Archives of Internal Medicine 157(6):657-667.
Toschke, A. M., L. Kohl, U. Mansmann, and R. von Kries. 2010. Meta-analysis of blood pressure tracking from childhood to adulthood and implications for the design of intervention trials. Acta Paediatrica 99(1):24-29.
van Buul, B. J. A., E. A. P. Steegers, G. D. van der Maten, F. M. C. Delemarre, H. W. Jongsma, H. P. Oosterbaan, and P. A. de Jong. 1997. Dietary sodium restriction does not prevent gestational hypertension: A Dutch two-center randomized trial. Hypertension in Pregnancy 16(3):335-346.
Vollmer, W. M., F. M. Sacks, J. Ard, L. J. Appel, G. A. Bray, D. G. Simons-Morton, P. R. Conlin, L. P. Svetkey, T. P. Erlinger, T. J. Moore, N. Karanja, and DASH-Sodium Trial Collaborative Research Group. 2001. Effects of diet and sodium intake on blood pressure: Subgroup analysis of the DASH-Sodium trial. Annals of Internal Medicine 135(12):1019-1028.
Weinberger, M. H., and N. S. Fineberg. 1991. Sodium and volume sensitivity of blood pressure. Age and pressure change over time. Hypertension 18(1):67-71.
Weinberger, M. H., F. C. Luft, R. Bloch, D. P. Henry, J. H. Pratt, A. E. Weyman, L. I. Rankin, R. H. Murray, L. R. Willis, and C. E. Grim. 1982. The blood pressure-raising effects of high dietary sodium intake: Racial differences and the role of potassium. Journal of the American College of Nutrition 1(2):139-148.
Wing, L. M., L. F. Arnolda, P. J. Harvey, J. Upton, D. Molloy, G. M. Gabb, A. J. Bune, and J. P. Chalmers. 1998. Low-dose diuretic and/or dietary sodium restriction when blood pressure is resistant to ACE inhibitor. Blood Pressure 7(5-6):299-307.
Wright, Jr., J. T., M. Rahman, A. Scarpa, M. Fatholahi, V. Griffin, R. Jean-Baptiste, M. Islam, M. Eissa, S. White, and J. G. Douglas. 2003. Determinants of salt sensitivity in black and white normotensive and hypertensive women. Hypertension 42(6):1087-1092.
Xi, B., T. Zhang, S. Li, E. Harville, L. Bazzano, J. He, and W. Chen. 2017. Can pediatric hypertension criteria be simplified? A prediction analysis of subclinical cardiovascular outcomes from the Bogalusa Heart Study. Hypertension 69(4):691-696.
Xie, J., J. Wang, and H. Yang. 1998. Hypertension control improved through patient education. Chinese PEP Investigators. Chinese Medical Journal (English) 111(7):581-584.
References in Figures
Alli, C., F. Avanzini, G. Bettelli, M. Bonati, F. Colombo, R. Corso, M. Di Tullio, M. G. Gentile, L. Sangalli, E. Taioli, and the participating doctors. 1992. Feasibility of a long-term low-sodium diet in mild hypertension. Journal of Human Hypertension 6(4):281-286.
Appel, L. J., M. A. Espeland, L. Easter, A. C. Wilson, S. Folmar, and C. R. Lacy. 2001. Effects of reduced sodium intake on hypertension control in older individuals: Results from the Trial of Nonpharmacologic Interventions in the Elderly (TONE). Archives of Internal Medicine 161(5):685-693.
Arroll, B., and R. Beaglehole. 1995. Salt restriction and physical activity in treated hypertensives. New Zealand Medical Journal 108(1003):266-268.
Australian National Health and Medical Research Council. 1989. Fall in blood pressure with modest reduction in dietary salt intake in mild hypertension. Australian National Health and Medical Research Council Dietary Salt Study Management Committee. Lancet 1(8635):399-402.
Beard, T. C., H. M. Cooke, W. R. Gray, and R. Barge. 1982. Randomised controlled trial of a no-added-sodium diet for mild hypertension. Lancet 2(8296):455-458.
Bulpitt, C. J., M. Daymond, P. F. Bulpitt, G. Ferrier, R. Harrison, P. J. Lewis, and C. T. Dollery. 1984. Is low salt dietary advice a useful therapy in hypertensive patients with poorly controlled blood pressure? Annals of Clinical Research 16(Suppl 43):143-149.
Cappuccio, F. P., S. M. Kerry, F. B. Micah, J. Plange-Rhule, and J. B. Eastwood. 2006. A community programme to reduce salt intake and blood pressure in Ghana [ISRCTN88789643]. BMC Public Health 6:13.
Chang, H. Y., Y. W. Hu, C. S. Yue, Y. W. Wen, W. T. Yeh, L. S. Hsu, S. Y. Tsai, and W. H. Pan. 2006. Effect of potassium-enriched salt on cardiovascular mortality and medical expenses of elderly men. American Journal of Clinical Nutrition 83(6):1289-1296.
Cook, N. R., L. J. Appel, and P. K. Whelton. 2014. Lower levels of sodium intake and reduced cardiovascular risk. Circulation 129(9):981-989.
CSSSCG (China Salt Substitute Study Collaborative Group). 2007. Salt substitution: A low-cost strategy for blood pressure control among rural Chinese. A randomized, controlled trial. Journal of Hypertension 25(10):2011-2018.
Dodson, P. M., M. Beevers, R. Hallworth, M. J. Webberley, R. F. Fletcher, and K. G. Taylor. 1989. Sodium restriction and blood pressure in hypertensive type II diabetics: Randomised blind controlled and crossover studies of moderate sodium restriction and sodium supplementation. BMJ 298(6668):227-230.
Dubbert, P. M., W. C. Cushman, E. F. Meydrech, A. K. Rowland, and P. Maury. 1995. Effects of dietary instruction and sodium-excretion feedback in hypertension clinic patients. Behavior Therapy 26(4):721-732.
Flack, J. M., R. H. Grimm, Jr., B. A. Staffileno, P. Elmer, C. Yunis, L. Hedquist, and A. Dudley. 2002. New salt-sensitivity metrics: Variability-adjusted blood pressure change and the urinary sodium-to-creatinine ratio. Ethnicity and Disease 12(1):10-19.
He, F. J., Y. Wu, X. X. Feng, J. Ma, Y. Ma, H. Wang, J. Zhang, J. Yuan, C. P. Lin, C. Nowson, and G. A. MacGregor. 2015. School based education programme to reduce salt intake in children and their families (School-EduSalt): Cluster randomised controlled trial. BMJ 350:h770.
Howe, P. R., Y. K. Lungershausen, L. Cobiac, G. Dandy, and P. J. Nestel. 1994. Effect of sodium restriction and fish oil supplementation on BP and thrombotic risk factors in patients treated with ACE inhibitors. Journal of Human Hypertension 8(1):43-49.
HPTRG (Hypertension Prevention Trial Research Group). 1990. The Hypertension Prevention Trial: Three-year effects of dietary changes on blood pressure. Hypertension Prevention Trial Research Group. Archives of Internal Medicine 150(1):153-162.
Hwang, J. H., H. J. Chin, S. Kim, D. K. Kim, S. Kim, J. H. Park, S. J. Shin, S. H. Lee, B. S. Choi, and C. S. Lim. 2014. Effects of intensive low-salt diet education on albuminuria among nondiabetic patients with hypertension treated with olmesartan: A single-blinded randomized, controlled trial. Clinical Journal of the American Society of Nephrology 9(12):2059-2069.
Jula, A., T. Ronnemaa, I. Tikkanen, and H. Karanko. 1992. Responses of atrial natriuretic factor to long-term sodium restriction in mild to moderate hypertension. Journal of Internal Medicine 231(5):521-529.
Kwakernaak, A. J., J. A. Krikken, S. H. Binnenmars, F. W. Visser, M. H. Hemmelder, A. J. Woittiez, H. Groen, G. D. Laverman, and G. Navis. 2014. Effects of sodium restriction and hydrochlorothiazide on RAAS blockade efficacy in diabetic nephropathy: A randomised clinical trial. Lancet Diabetes and Endocrinology 2(5):385-395.
Mascioli, S., R. Grimm, Jr., C. Launer, K. Svendsen, J. Flack, N. Gonzalez, P. Elmer, and J. Neaton. 1991. Sodium chloride raises blood pressure in normotensive subjects. The study of sodium and blood pressure. Hypertension 17(1 Suppl):I21-I26.
Meland, E., and A. Aamland. 2009. Salt restriction among hypertensive patients: Modest blood pressure effect and no adverse effects. Scandinavian Journal of Primary Health Care 27(2):97-103.
Morgan, T., and A. Anderson. 1987. Sodium restriction can delay the return of hypertension in patients previously well-controlled on drug therapy. Canadian Journal of Physiology and Pharmacology 65(8):1752-1755.
Morgan, T., W. Adam, A. Gillies, M. Wilson, G. Morgan, and S. Carney. 1978. Hypertension treated by salt restriction. Lancet 1(8058):227-230.
Morikawa, N., K. Yamasue, O. Tochikubo, and S. Mizushima. 2011. Effect of salt reduction intervention program using an electronic salt sensor and cellular phone on blood pressure among hypertensive workers. Clinical and Experimental Hypertension 33(4):216-222.
Muhlhauser, I., K. Prange, P. T. Sawicki, R. Bender, A. Dworschak, W. Schaden, and M. Berger. 1996. Effects of dietary sodium on blood pressure in IDDM patients with nephropathy. Diabetologia 39(2):212-219.
Nakano, M., K. Eguchi, T. Sato, A. Onoguchi, S. Hoshide, and K. Kario. 2016. Effect of intensive salt-restriction education on clinic, home, and ambulatory blood pressure levels in treated hypertensive patients during a 3-month education period. Journal of Clinical Hypertension (Greenwich, Conn.) 18(5):385-392.
Nestel, P. J., P. M. Clifton, M. Noakes, R. McArthur, and P. R. Howe. 1993. Enhanced blood pressure response to dietary salt in elderly women, especially those with small waist:hip ratio. Journal of Hypertension 11(12):1387-1394.
Nowson, C. A., and T. O. Morgan. 1988. Change in blood pressure in relation to change in nutrients effected by manipulation of dietary sodium and potassium. Clinical and Experimental Pharmacology and Physiology 15(3):225-242.
Parker, M., I. B. Puddey, L. J. Beilin, and R. Vandongen. 1990. Two-way factorial study of alcohol and salt restriction in treated hypertensive men. Hypertension 16(4):398-406.
Puska, P., J. M. Iacono, A. Nissinen, H. J. Korhonen, E. Vartianinen, P. Pietinen, R. Dougherty, U. Leino, M. Mutanen, S. Moisio, and J. Huttunen. 1983. Controlled, randomised trial of the effect of dietary fat on blood pressure. Lancet 1(8314-5):1-5.
Richards, A. M., M. G. Nicholls, E. A. Espiner, H. Ikram, A. H. Maslowski, E. J. Hamilton, and J. E. Wells. 1984. Blood-pressure response to moderate sodium restriction and to potassium supplementation in mild essential hypertension. Lancet 1(8380):757-761.
Sacks, F. M., L. P. Svetkey, W. M. Vollmer, L. J. Appel, G. A. Bray, D. Harsha, E. Obarzanek, P. R. Conlin, E. R. Miller, 3rd, D. G. Simons-Morton, N. Karanja, and P. H. Lin. 2001. Effects on blood pressure of reduced dietary sodium and the Dietary Approaches to Stop Hypertension (DASH) diet. DASH-Sodium Collaborative Research Group. New England Journal of Medicine 344(1):3-10.
Schorr, U., A. Distler, and A. M. Sharma. 1996. Effect of sodium chloride- and sodium bicarbonate-rich mineral water on blood pressure and metabolic parameters in elderly normotensive individuals: A randomized double-blind crossover trial. Journal of Hypertension 14(1):131-135.
Sciarrone, S. E., L. J. Beilin, I. L. Rouse, and P. B. Rogers. 1992. A factorial study of salt restriction and a low-fat/high-fibre diet in hypertensive subjects. Journal of Hypertension 10(3):287-298.
Silman, A. J., C. Locke, P. Mitchell, and P. Humpherson. 1983. Evaluation of the effectiveness of a low sodium diet in the treatment of mild to moderate hypertension. Lancet 1(8335):1179-1182.
Singer, D. R., N. D. Markandu, A. L. Sugden, M. A. Miller, and G. A. MacGregor. 1991. Sodium restriction in hypertensive patients treated with a converting enzyme inhibitor and a thiazide. Hypertension 17(6 Pt 1):798-803.
Todd, A. S., R. J. Macginley, J. B. Schollum, R. J. Johnson, S. M. Williams, W. H. Sutherland, J. I. Mann, and R. J. Walker. 2010. Dietary salt loading impairs arterial vascular reactivity. American Journal of Clinical Nutrition 91(3):557-564.
Todd, A. S., R. J. Macginley, J. B. Schollum, S. M. Williams, W. H. Sutherland, J. I. Mann, and R. J. Walker. 2012. Dietary sodium loading in normotensive healthy volunteers does not increase arterial vascular reactivity or blood pressure. Nephrology (Carlton) 17(3):249-256.
TOHP (Trials of Hypertension Prevention) Collaborative Research Group. 1992. The effects of nonpharmacologic interventions on blood pressure of persons with high normal levels. Results of the Trials of Hypertension Prevention, Phase I. JAMA 267(9):1213-1220.
TOHP Collaborative Research Group. 1997. Effects of weight loss and sodium reduction intervention on blood pressure and hypertension incidence in overweight people with high-normal blood pressure. The Trials of Hypertension Prevention, phase II. The Trials of Hypertension Prevention Collaborative Research Group. Archives of Internal Medicine 157(6):657-667.
Weir, M. R., A. M. Yadao, D. Purkayastha, and A. N. Charney. 2010. Effects of high- and low-sodium diets on ambulatory blood pressure in patients with hypertension receiving aliskiren. Journal of Cardiovascular Pharmacology and Therapeutics 15(4):356-363.
Wing, L. M., L. F. Arnolda, P. J. Harvey, J. Upton, D. Molloy, G. M. Gabb, A. J. Bune, and J. P. Chalmers. 1998. Low-dose diuretic and/or dietary sodium restriction when blood pressure is resistant to ACE inhibitor. Blood Pressure 7(5-6):299-307.
ANNEX 10-1
INDICATORS REVIEWED BUT NOT SELECTED
Cardiovascular Disease Mortality
Evidence Presented in the 2005 DRI Report
The 2005 DRI Report (IOM, 2005) discussed results from one prospective study (Alderman et al., 1998) that reported an inverse relationship between sodium intake and cardiovascular disease mortality, based on follow-up data from National Health and Nutrition Examination Survey (NHANES) I participants. The 2005 DRI Report noted that the analytical model variables in this study were correlated with sodium intake, such as energy intake. The results of this study were inconsistent with other studies in which no significant relationship was found (e.g., Cohen et al., 1999) and with a different analysis of the same NHANES I data in which individuals with a history of cardiovascular disease or under treatment were excluded because of possible reverse causation (He et al., 1999). In the 2005 DRI Report, cardiovascular disease mortality was considered but not selected as the critical adverse outcome to inform the sodium UL.
Evidence Provided in the AHRQ Systematic Review
Two trials were identified in the AHRQ Systematic Review (Newberry et al., 2018) that examined cardiovascular disease mortality as an endpoint of reducing sodium intake. Morgan et al. (1978) studied a moderate restriction in sodium for 2 years; although blood pressure decreased in the intervention group, the cardiovascular disease mortality rate was similar in the control and intervention groups. Chang et al. (2006) conducted a trial in elderly men and found a significant decrease in cardiovascular disease mortality in the experimental group that used a potassium-rich salt substitute (age-adjusted hazard ratio [HR] = 0.59 [95% CI: 0.37, 0.95]). Because of inconsistency in the results and dearth of studies, the evidence was determined to be insufficient to assess the effect of sodium reduction on cardiovascular disease mortality.
Committee’s Synthesis of the Evidence
The committee is in agreement with the assessment of the evidence in the AHRQ Systematic Review. The committee also notes that the salt substitute used as the intervention in the Chang et al. (2006) trial does not allow attribution of effects to sodium reduction because of the concurrent
increase in potassium intake. There is insufficient evidence to be able to assess the effect of sodium reduction on cardiovascular disease mortality and, therefore, cardiovascular disease mortality could not be used as an indicator to inform the sodium CDRRs.
Stroke
Evidence Presented in the 2005 DRI Report
In the exploration of adverse effects related to excessive sodium intake, the 2005 DRI Report presented evidence from observational studies that measured stroke as an outcome. Results varied from no significant effects of sodium intake on stroke (Kagan et al., 1985), to a significant increase in stroke with increasing sodium intake only in overweight individuals (He et al., 1999), to a negative relationship between sodium intake and stroke (Alderman et al., 1997). The 2005 DRI Report stated concerns over observational studies, which show high intra-individual variability owing to intake measurement methods, contributing to low statistical power to observe effects. In the 2005 DRI Report, stroke was considered, but was not selected as the critical adverse effect to inform the sodium UL.
Evidence Provided in the AHRQ Systematic Review
Three sodium-reduction trials were included in the AHRQ Systematic Review that explored stroke as an outcome among adults (Appel et al., 2001; Charlton et al., 2008; Gilleran et al., 1996). None of the studies showed any significant effect of sodium reduction in stroke whether results were considered either separately or pooled in a meta-analysis (pooled RR = 0.72 [95% CI: 0.05, 9.88]; I2 = 0 percent). The AHRQ Systematic Review concluded that there is a low strength of evidence that sodium reduction in adults may not decrease the risk of stroke.
Committee’s Synthesis of the Evidence
The committee is in agreement with the assessment of the strength-of-evidence rating in the AHRQ Systematic Review, and, therefore, stroke could not be used as an indicator to inform the sodium CDRRs.
Myocardial Infarction
Evidence Presented in the 2005 DRI Report
The 2005 DRI Report described results from one prospective study (Alderman et al., 1995) that reported a significant inverse association between sodium intake and incident myocardial infarction. The 2005 DRI Report noted limitations of the study, particularly in the likelihood of variables that confounded the results and the potential for incomplete measurement of sodium intake. In the 2005 DRI Report, myocardial infarction was considered but was not selected as the critical adverse effect to inform the sodium UL.
Evidence Provided in the AHRQ Systematic Review
One trial, TONE (Appel et al., 2001), examined myocardial infarction as an adverse effect in older adults. A nonsignificant lower event rate, four compared to two events, was observed in the group consuming less sodium after a mean follow-up of 27.8 months. Based on the low number of studies, the AHRQ Systematic Review concluded that there was insufficient evidence that sodium reduction has an effect on risk of myocardial infarction.
Committee’s Synthesis of the Evidence
The committee is in agreement with the assessment of the strength of evidence in the AHRQ Systematic Review, and, therefore, myocardial infarction could not be used as an indicator to inform the sodium CDRRs.
Left Ventricular Mass and Gross Morbidity
Evidence Presented in the 2005 DRI Report
Left ventricular mass was discussed in the 2005 DRI Report because of its potential as a predictor of cardiovascular disease morbidity and mortality, as well as it being mechanistically related to increases in blood pressure. In particular, two cross-sectional studies were described that reported on left ventricular mass and sodium intake, but the results were not consistent (Alderman et al., 1997; du Cailar et al., 2002). Only one trial was identified, which reported that reduction in sodium intake resulted in small decreases in left ventricular mass, whereas no change occurred in the control group (Jula and Karanko, 1994). In the 2005 DRI Report, left ventricular mass was considered but was not selected as the critical adverse effect to inform the sodium UL.
Evidence Provided in the AHRQ Systematic Review
Two studies that examined the relationship between sodium intake reduction and gross morbidity (HPTRG, 1990) and left ventricular mass (Xie et al., 1998) met the AHRQ Systematic Review inclusion criteria. No significant difference in these outcomes was reported with sodium reduction. The AHRQ Systematic Review could not make conclusions based on this evidence.
Committee’s Synthesis of the Evidence
The committee is in agreement with the assessment of the evidence in the AHRQ Systematic Review, and therefore neither gross morbidity nor left ventricular mass could be used as indicators to establish the sodium CDRRs (for the committee’s rationale for excluding left ventricular mass from its supplementary literature search, see Appendix D).
Osteoporosis and Related Indicators
Evidence Presented in the 2005 DRI Report
The 2005 DRI Report summarized the findings from four observational studies on the relationship between sodium intake and bone mineral density (Devine et al., 1995; Greendale et al., 1994; Jones et al., 1997; Matkovic et al., 1995), but it noted that the role of sodium intake was unclear and that there was no evidence on the relationship between sodium intake and fracture.
Evidence from the Committee’s Supplemental Literature Search
One trial examining the relationship between sodium intake and bone mineral density in postmenopausal women was identified. The intervention group received dietary advice to lower sodium intake to 1,500 mg/d (65 mmol/d) whereas the control group was advised to maintain sodium intake of 3,000 mg/d (130 mmol/d) (Ilich et al., 2010). After 3 years, there was no statistically significant difference in mean bone mineral density.
Committee’s Synthesis of the Evidence
The committee considered the evidence insufficient and therefore osteoporosis and related indicators could not be used as indicators to establish the sodium CDRRs.
Kidney Disease
Evidence Presented in the 2005 DRI Report
The 2005 DRI Report did not review evidence on kidney disease as an indicator of adverse effect of excessive sodium intake.
Evidence Provided in the AHRQ Systematic Review
One observational study based on data from the Prevention of Renal and Vascular End-Stage Disease study (Kieneker et al., 2016) was identified that assessed the association between sodium intake and kidney disease. The observational study found no association between sodium intake and risk of chronic kidney disease, as measured by either estimated glomerular filtration rate or urinary albumin excretion. No other studies on kidney disease outcomes met the AHRQ Systematic Review inclusion criteria. The AHRQ Systematic Review concluded there was insufficient evidence on the relationship between sodium intake and kidney disease.
Committee’s Synthesis of the Evidence
The committee is in agreement with the assessment of the evidence in the AHRQ Systematic Review and, therefore, kidney disease could not be used as an indicator to inform the sodium CDRRs.
All-Cause Mortality
Evidence Presented in the 2005 DRI Report
The 2005 DRI Report described results from one prospective study (Alderman et al., 1998) that reported an inverse relationship between sodium intake and all-cause mortality, based on an analysis of follow-up data from NHANES I participants. As discussed above, the 2005 DRI Report noted concerns about the analytical model used and the inclusion of individuals with chronic diseases. Using a different analytical model, He et al. (1999) found higher sodium intakes to be associated with all-cause mortality in overweight individuals. In the 2005 DRI Report, all-cause mortality was considered but was not selected as the critical adverse effect to inform the sodium UL.
Evidence Provided in the AHRQ Systematic Review
The AHRQ Systematic Review identified seven trials that examined the relationship between sodium intake and all-cause mortality, either as the
outcome of interest (Chang et al., 2006; Cook et al., 2016; Morgan et al., 1978) or as an adverse effect (CSSSCG, 2007; de Brito-Ashurst et al., 2013; Weir et al., 2010). A random-effects meta-analysis of the trials found a nonsignificant effect of sodium reduction on decreasing the risk of all-cause mortality (pooled RR = 0.97 [95% CI: 0.94, 1.00], I2 = 0 percent). Despite seven trials being identified, the AHRQ Systematic Review determined the evidence to be insufficient because the outcomes were not powered to assess mortality and the results showed inconsistency in the direction of the size effect, as well as imprecision of the effect across studies.
Committee’s Synthesis of the Evidence
The committee reviewed the analyses of trials of sodium and all-cause mortality included in the AHRQ Systematic Review. Some of the trials were short term, one lasting only 4 weeks with no deaths (Weir et al., 2010). One trial lasted for 6 months and had only one death (de Brito-Ashurst et al., 2013). The AHRQ Systematic Review included these studies by using a continuity correction, leading to very wide CIs and an appearance of no heterogeneity. Because a nutritional intervention in healthy individuals is unlikely to lead to effects on mortality within such a short timeframe, the committee conducted a meta-analysis that restricted inclusion to studies lasting at least 1 year and in healthy participants with no preexisting cardiovascular disease. For the committee’s revisions to data from individual trials, as compared to the AHRQ Systematic Review, see Box 10-2.
Results from the committee’s analyses Use of hazard ratios from survival analyses led to a nonsignificant RR of 0.89 [95% CI: 0.78, 1.01], with no detectable heterogeneity across trials (I2 = 0 percent) (see Figure 10-28). The inclusion in the AHRQ Systematic Review of small studies of short duration led to the appearance of inconsistency and imprecision. When trials using salt substitutes were excluded, the meta-analysis led to an overall RR of 0.85 [95% CI: 0.66, 1.08], with no heterogeneity (see Figure 10-29). This is consistent with the analysis of the pooled TOHP I and II data that reported a RR of 0.85 [95% CI: 0.66, 1.09] (Cook et al., 2016). There were too few studies to evaluate potential publication bias.
Updated strength-of-evidence evaluation Using GRADE and the committee’s additional analyses, the committee reassessed the strength of evidence that reducing sodium intake reduces all-cause mortality (see Table 10-15). The strength of evidence was rated as moderate owing to imprecision related to small effect size, lack of statistical significance, and the relatively low total number of events observed across studies (< 300). Despite the evidence being
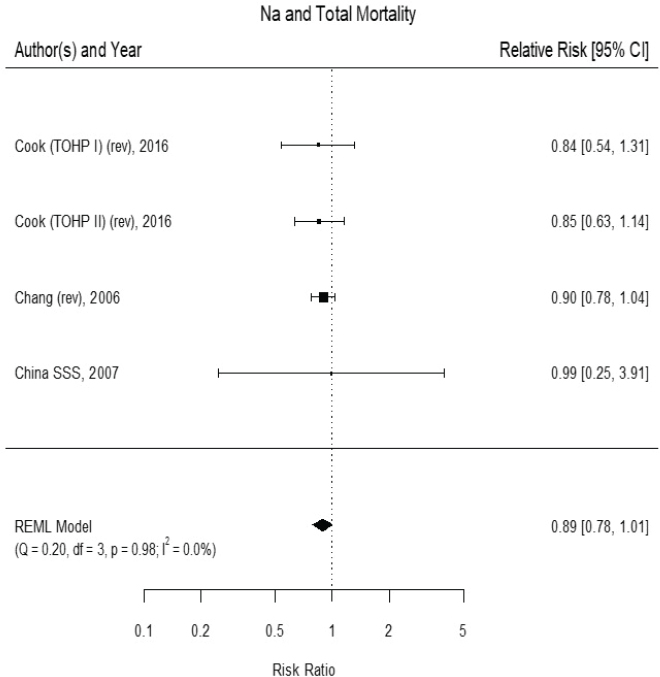
NOTES: Studies using salt substitutes are included. Meta-analysis was conducted in R with random-effects models in the metafor package. The variance was estimated using the REML approach. China SSS = China Salt Substitute Study; CI = confidence interval; df = degrees of freedom; I2 = statistic that describes the percent of variation across studies due to heterogeneity; Na = sodium; Q = Q statistic; REML = restricted maximum likelihood; rev = revised as compared to estimate used in the AHRQ Systematic Review; TOHP = Trials of Hypertension Prevention.
SOURCES: Chang et al., 2006; Cook et al., 2016; CSSSCG, 2007.
rated as moderate strength, the committee did not use all-cause mortality because of its nonspecificity and the existence of more specific endpoints, described in Chapter 10.
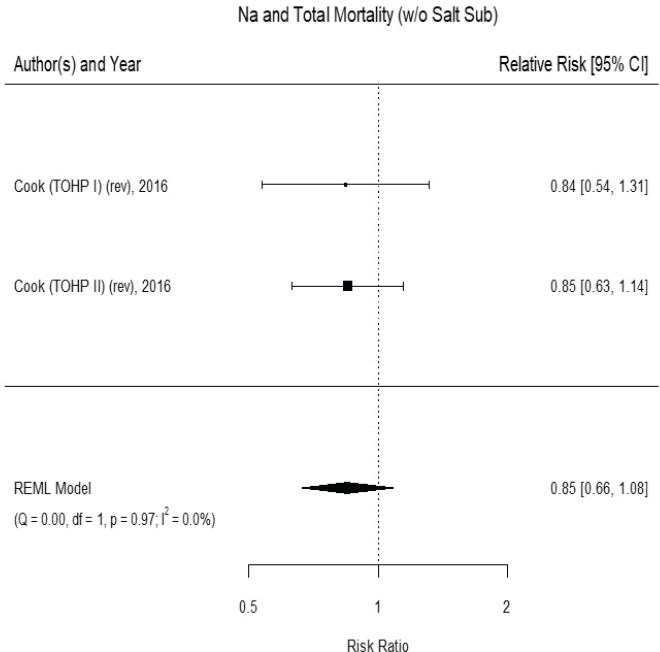
NOTES: Meta-analysis was conducted in R with random-effects models in the metafor package. The variance was estimated using the REML approach. CI = confidence interval; df = degrees of freedom; I2 = statistic that describes the percent of variation across studies due to heterogeneity; Na = sodium; Q = Q statistic; REML = restricted maximum likelihood; rev = revised as compared to estimate used in the AHRQ Systematic Review; TOHP = Trials of Hypertension Prevention; w/o = without.
SOURCE: Cook et al., 2016.
TABLE 10-15 GRADE Assessment Table: Sodium Reduction and All-Cause Mortality
| GRADE Criteria | Ratinga | Reasons for Rating | Strength of Evidenceb |
|---|---|---|---|
| Outcome: All-Cause Mortality | |||
| Study design | High | Randomized controlled trial. | |
| Risk of bias | No (0) | All studies have low or moderate risk of bias. | |
| Inconsistency | No (0) | No statistical heterogeneity was detected. All study point estimates were in the same direction. | |
| Indirectness | No (0) | Evidence directly answers the question of interest in terms of relevant populations, interventions, comparators, and outcomes. No change in overall results with inclusion of salt-substitution studies, which are more indirect because they also involve increases in other nutrients, usually potassium. | |
| Imprecision | Serious (−1) | Summary effect not statistically significant, whether including or excluding salt-substitution studies. Additionally, effect size is relatively small (11–15 percent change in hazard ratio), and the total number of events number < 300 across studies. | |
| Publication bias | Not measured | Too few studies for analysis of publication bias. | |
| Other | None (0) | No additional upgrading factors. | |
aTable format adapted from Ryan and Hill (2016). Possible ratings as follows:
- For Study Design, strength-of-evidence rating for randomized controlled trial starts as “High” and for nonrandomized controlled trial starts as “Low”
- For Risk of Bias, Inconsistency, Indirectness, and Imprecision, the possible ratings are “No (0)” (no change), “Serious (–1)” (downgrade one level), or “Very serious (–2)” (downgrade two levels)
- For Publication Bias, the ratings are “Undetected (0)” (no change) or “Strongly suspected (–1)” (downgrade one level)
- Other ratings, if present, are “Large effect,” “Intake–response,” and/or “No plausible confounding” along with “(+1)” or “(+2)” depending on whether upgrade is one or two levels
bThis terminology was used for consistency with the AHRQ Systematic Review. Preferred terminology under the GRADE system is certainty of the evidence or quality of the evidence.
ANNEX 10-1 REFERENCES
Alderman, M. H., S. Madhavan, H. Cohen, J. E. Sealey, and J. H. Laragh. 1995. Low urinary sodium is associated with greater risk of myocardial infarction among treated hypertensive men. Hypertension 25(6):1144-1152.
Alderman, M., J. Sealey, H. Cohen, S. Madhavan, and J. Laragh. 1997. Urinary sodium excretion and myocardial infarction in hypertensive patients: A prospective cohort study. American Journal of Clinical Nutrition 65(2 Suppl):682s-686s.
Alderman, M. H., H. Cohen, and S. Madhavan. 1998. Dietary sodium intake and mortality: The National Health and Nutrition Examination Survey (NHANES I). Lancet 351(9105):781-785.
Appel, L. J., M. A. Espeland, L. Easter, A. C. Wilson, S. Folmar, and C. R. Lacy. 2001. Effects of reduced sodium intake on hypertension control in older individuals: Results from the Trial of Nonpharmacologic Interventions in the Elderly (TONE). Archives of Internal Medicine 161(5):685-693.
Chang, H. Y., Y. W. Hu, C. S. Yue, Y. W. Wen, W. T. Yeh, L. S. Hsu, S. Y. Tsai, and W. H. Pan. 2006. Effect of potassium-enriched salt on cardiovascular mortality and medical expenses of elderly men. American Journal of Clinical Nutrition 83(6):1289-1296.
Charlton, K. E., K. Steyn, N. S. Levitt, N. Peer, D. Jonathan, T. Gogela, K. Rossouw, N. Gwebushe, and C. J. Lombard. 2008. A food-based dietary strategy lowers blood pressure in a low socio-economic setting: A randomised study in South Africa. Public Health Nutrition 11(12):1397-1406.
Cohen, J. D., G. Grandits, J. A. Cutler, J. D. Neaton, L. H. Kuller, and J. Stamler. 1999. Dietary sodium intake and mortality: MRFIT follow-up study results. Circulation 100(18):524.
Cook, N. R., L. J. Appel, and P. K. Whelton. 2016. Sodium intake and all-cause mortality over 20 years in the Trials of Hypertension Prevention. Journal of the American College of Cardiology 68(15):1609-1617.
CSSSCG (China Salt Substitute Study Collaborative Group). 2007. Salt substitution: A low-cost strategy for blood pressure control among rural Chinese. A randomized, controlled trial. Journal of Hypertension 25(10):2011-2018.
de Brito-Ashurst, I., L. Perry, T. A. Sanders, J. E. Thomas, H. Dobbie, M. Varagunam, and M. M. Yaqoob. 2013. The role of salt intake and salt sensitivity in the management of hypertension in South Asian people with chronic kidney disease: A randomised controlled trial. Heart 99(17):1256-1260.
Devine, A., R. A. Criddle, I. M. Dick, D. A. Kerr, and R. L. Prince. 1995. A longitudinal study of the effect of sodium and calcium intakes on regional bone density in postmenopausal women. American Journal of Clinical Nutrition 62(4):740-745.
du Cailar, G., J. Ribstein, and A. Mimran. 2002. Dietary sodium and target organ damage in essential hypertension. American Journal of Hypertension 15(3):222-229.
Gilleran, G., M. O’Leary, W. A. Bartlett, H. Vinall, A. F. Jones, and P. M. Dodson. 1996. Effects of dietary sodium substitution with potassium and magnesium in hypertensive type II diabetics: A randomised blind controlled parallel study. Journal of Human Hypertension 10(8):517-521.
Greendale, G. A., E. Barrett-Connor, S. Edelstein, S. Ingles, and R. Haile. 1994. Dietary sodium and bone mineral density: Results of a 16-year follow-up study. Journal of the American Geriatrics Society 42(10):1050-1055.
He, J., L. G. Ogden, S. Vupputuri, L. A. Bazzano, C. Loria, and P. K. Whelton. 1999. Dietary sodium intake and subsequent risk of cardiovascular disease in overweight adults. JAMA 282(21):2027-2034.
HPTRG (Hypertension Prevention Trial Research Group). 1990. The Hypertension Prevention Trial: Three-year effects of dietary changes on blood pressure. Hypertension Prevention Trial Research Group. Archives of Internal Medicine 150(1):153-162.
Ilich, J. Z., R. A. Brownbill, and D. C. Coster. 2010. Higher habitual sodium intake is not detrimental for bones in older women with adequate calcium intake. European Journal of Applied Physiology 109(4):745-755.
IOM (Institute of Medicine). 2005. Dietary Reference Intakes for water, potassium, sodium, chloride, and sulfate. Washington, DC: The National Academies Press.
Jones, G., T. Beard, V. Parameswaran, T. Greenaway, and R. von Witt. 1997. A population-based study of the relationship between salt intake, bone resorption and bone mass. European Journal of Clinical Nutrition 51(8):561-565.
Jula, A. M., and H. M. Karanko. 1994. Effects on left ventricular hypertrophy of long-term nonpharmacological treatment with sodium restriction in mild-to-moderate essential hypertension. Circulation 89(3):1023-1031.
Kagan, A., J. S. Popper, G. G. Rhoads, and K. Yano. 1985. Dietary and other risk factors for stroke in Hawaiian Japanese men. Stroke 16(3):390-396.
Kieneker, L. M., S. J. Bakker, R. A. de Boer, G. J. Navis, R. T. Gansevoort, and M. M. Joosten. 2016. Low potassium excretion but not high sodium excretion is associated with increased risk of developing chronic kidney disease. Kidney International 90(4):888-896.
Matkovic, V., J. Z. Ilich, M. B. Andon, L. C. Hsieh, M. A. Tzagournis, B. J. Lagger, and P. K. Goel. 1995. Urinary calcium, sodium, and bone mass of young females. American Journal of Clinical Nutrition 62(2):417-425.
Morgan, T., W. Adam, A. Gillies, M. Wilson, G. Morgan, and S. Carney. 1978. Hypertension treated by salt restriction. Lancet 1(8058):227-230.
Newberry, S. J., M. Chung, C. A. M. Anderson, C. Chen, Z. Fu, A. Tang, N. Zhao, M. Booth, J. Marks, S. Hollands, A. Motala, J. K. Larkin, R. Shanman, and S. Hempel. 2018. Sodium and potassium intake: Effects on chronic disease outcomes and risks. Rockville, MD: Agency for Healthcare Research and Quality.
Ryan, R., and S. Hill. 2016. How to GRADE the quality of the evidence. http://cccrg.cochrane.org/author-resources (accessed January 29, 2019).
Weir, M. R., A. M. Yadao, D. Purkayastha, and A. N. Charney. 2010. Effects of high- and low-sodium diets on ambulatory blood pressure in patients with hypertension receiving aliskiren. Journal of Cardiovascular Pharmacology and Therapeutics 15(4):356-363.
Xie, J., J. Wang, and H. Yang. 1998. Hypertension control improved through patient education. Chinese PEP investigators. Chinese Medical Journal (English) 111(7):581-584.
ANNEX 10-2
EVALUATION OF BLOOD PRESSURE AS A SURROGATE MARKER OF HYPERTENSION AND CARDIOVASCULAR DISEASE FOR SODIUM INTAKE INTERVENTIONS
The Guiding Principles Report recommends that, in general, a DRI based on chronic disease be developed when there is at least moderate strength of evidence for both causality and intake–response (NASEM, 2017). Based on its review of the evidence, there is moderate strength of evidence relating sodium intake to both hypertension and cardiovascular disease (see Chapter 10); accordingly, this moderate rating satisfies the causality criterion for establishing a sodium CDRR. However, the evidence on the intake–response relationship between sodium intake and both hypertension and cardiovascular disease is less robust. As such, the committee considered whether evidence on the relationship between sodium intake and blood pressure could be used together with the evidence on hypertension and cardiovascular disease, in support of setting the sodium CDRR. There is high strength of evidence relating sodium intake to blood pressure and the available evidence on blood pressure can help in characterizing an intake–response relationship. However, unlike hypertension and cardiovascular disease, blood pressure is not a chronic disease endpoint. Blood pressure therefore has different considerations in its use for establishing a CDRR. These considerations were described in the Guiding Principles Report, which offered the following recommendation:
Surrogate markers could be considered with the goal of using the findings as supporting information of results based on the chronic disease of interest. To be considered, surrogate markers should meet the qualification criteria for their purpose. Qualification of surrogate markers must be specific to each nutrient or other food substance, although some surrogates will be applicable to more than one causal pathway. (NASEM, 2017, p. 8)
Pursuant to the guidance in the Guiding Principles Report, the committee explored whether blood pressure could serve as a surrogate marker for the relationship between sodium intake, hypertension, and cardiovascular disease.14 Qualification of blood pressure as a surrogate marker implies that studies measuring blood pressure as an outcome of reducing sodium intake can be used in support of establishing a CDRR. The committee’s evaluation of blood pressure as a surrogate marker for cardiovascular
___________________
14 A surrogate marker (e.g., blood pressure) is “a biomarker that is intended to substitute for a clinical endpoint” (e.g., cardiovascular disease risk) by accurately predicting the effect of a measured intervention (e.g., sodium intake) on an unmeasured clinical outcome (e.g., cardiovascular disease risk) (IOM, 2010, p. 250).
disease and hypertension with sodium intake reduction was guided by the 2010 Institute of Medicine (IOM) report Evaluation of Biomarkers and Surrogate Endpoints in Chronic Disease (hereafter referred to as the 2010 IOM Report), which recommends a three-step process for evaluation of biomarkers: analytical validation, qualification, and utilization. Analytic validation concerns “analyses of available evidence on the analytical performance of an assay.” Analytic validation of blood pressure is well established in clinical practice and research (IOM, 2010, p. 2), so it will not be discussed further. The discussion below thus focuses on the “Qualification” and “Utilization” steps.
Qualification
Qualification involves “assessment of available evidence on associations between the biomarker and disease states, including data showing effects of interventions on both the biomarker and clinical outcomes” (IOM, 2010, p. 2). The 2010 IOM Report further recommends that this step involve two components: evaluating the “prognostic value of the biomarker–disease relationship” and “gather available evidence showing the biomarker’s ability to predict the effects of interventions on clinical endpoints of interest” (IOM, 2010, p. 9). This section focuses on blood pressure as the potential surrogate marker for hypertension and cardiovascular disease because of its relevance in the committee’s assessment of the evidence about the relationship between sodium intake and those health outcomes (see Figure 10-13). Therefore, the specific questions in this case are (1) Does blood pressure have a prognostic value for hypertension and cardiovascular disease? and (2) Does blood pressure accurately predict the effect of interventions on hypertension and cardiovascular disease? The evaluations are based on probabilistic rather than deterministic reasoning as it is likely that not all contributing factors will be fully understood. These evaluations generally require robust, adequately controlled study data that include studies that measure clinical outcomes.
Evidence of Blood Pressure’s Prognostic Value
The 2010 IOM Report noted that “blood pressure is often looked to as an exemplar surrogate endpoint for cardiovascular mortality and morbidity due to the levels and types of evidence that support its use” (IOM, 2010, p. 39). The 2010 IOM Report further summarized the extensive epidemiological and clinical trial literature on the relationship between blood pressure and cardiovascular disease outcomes. In brief, epidemiological studies, including meta-analyses summarizing outcomes from hundreds of thousands of individuals, consistently demonstrate this relationship to be
highly robust. Additionally, both placebo- and active-controlled clinical trials robustly demonstrate that pharmacological reductions in blood pressure lead to reductions in cardiovascular mortality and morbidity.
Evidence That Blood Pressure Accurately Predicts the Effect of Interventions
Drug trials involving more than 75 different hypertensive agents from nine drug classes with varying mechanisms of action have consistently shown that reductions in blood pressure will reduce the risk of cardiovascular disease (Israili et al., 2007). The benefits were observed across different assessment variables (e.g., systolic alone, diastolic alone, and systolic and diastolic together) and in diverse populations (e.g., different sexes, across a range of adult age groups, in different races and ethnicities, and among both participants with and without hypertension) (Desai et al., 2006). Thus, blood pressure lowering, per se, had a beneficial effect on cardiovascular disease risk. As a consequence, blood pressure guidelines have underscored the central role of blood pressure reduction during antihypertensive drug treatment (Mancia et al., 2013; Whelton et al., 2018). The results from blood pressure–lowering agents, as well as the abundant observational data linking hypertension to cardiovascular events, provided the basis for use of blood pressure as a surrogate endpoint for antihypertensive drugs by the Food and Drug Administration (Desai et al., 2006; Temple, 1999).
The effect of interventions on blood pressure “may or may not capture an intervention’s entire risk–benefit balance” (IOM, 2010, p. 40). For instance, there may be beneficial effects of an intervention that are independent of the effects on blood pressure. Additionally, there may be adverse effects that run counter to the beneficial effects owing to changes in blood pressure. Ultimately, however, the 2010 IOM Report concluded that “the fact that pharmacologically distinct agents have directionally similar effects on cardiovascular outcomes has provided more support for the use of blood pressure as a surrogate endpoint” (IOM, 2010, p. 41). However, these issues are to be revisited in the “Utilization” step, specifically in the context of use considered for the surrogate endpoint—in this case for interventions involving reduced sodium intake—discussed next.
Utilization
Utilization involves “contextual analysis based on the specific use proposed and the applicability of available evidence to this use. This includes a determination of whether the validation and qualification conducted provide sufficient support for the use proposed” (IOM, 2010, p. 2). The need for this “fit-for-purpose” evaluation stemmed from the recognition
that caution is needed when generalizing surrogate marker qualification status from one context to another (IOM, 2010; Yetley et al., 2017). Consistent with the criteria that surrogate markers need to be fit for purpose (i.e., qualified for a specific intake and outcome context) (IOM, 2010), the Guiding Principles Report recommended that “qualification of surrogate markers must be specific to each nutrient or other food substance, although some surrogates will be applicable to more than one causal pathway” (NASEM, 2017, p. 8). The 2010 IOM Report provided detailed guidance and recommendations as to the critical and important factors to consider in this “Utilization” step. The committee’s evaluation of blood pressure presented below is organized by these seven factors.
1. Is the Biomarker Being Used as a Surrogate? (Critical Factor)
The 2010 IOM Report noted that “If the biomarker is used as a surrogate, enhanced scrutiny would be necessary” (IOM, 2010, p. 112). In this case, the answer to this question is “Yes,” as blood pressure is to be used as a surrogate for hypertension and cardiovascular disease. The need for “enhanced scrutiny” is the reason that this detailed evaluation is being conducted as to whether use of blood pressure as a surrogate is “fit for purpose” in the context of establishing a sodium DRI based on chronic disease.
2. What Is the Prevalence of the Disease? What Are the Morbidities and Mortalities Associated with This Disease? (Critical Factor)
The 2010 IOM Report noted that “A highly prevalent or serious disease might have a lower threshold for use of biomarkers in clinical and regulatory decisions” (IOM, 2010, p. 112). In this case, hypertension and cardiovascular disease have high prevalence, with high associated morbidity and mortality (Bundy et al., 2018; Padwal et al., 2016). Therefore, the committee took into account the possibility of requiring a “lower threshold of use,” particularly with respect to the extent to which effects of sodium intake reduction on blood pressure could account for the full extent of the benefits with respect to hypertension and cardiovascular disease (discussed further below in factor 5).
3. What Are the Risks and Benefits Associated with the Intervention? Has Due Attention Been Paid to Both Safety and Efficacy? (Critical Factor)
The 2010 IOM Report noted that “The benefits of the intervention must be weighed against the risks of biomarker failure to define a range of tolerable biomarker performance for each specific biomarker” (IOM, 2010, p. 112). The evidence for the risks and benefits of reducing sodium intake were
reviewed extensively throughout this chapter. Moreover, the question of balancing benefits and harms was explicitly discussed, as the question of the safety of interventions reducing sodium intake has been studied extensively. The committee found no evidence suggesting benefits from increasing intake above 2,300 mg/d (100 mmol/d), and that studies suggesting increased risks from decreasing intake below 2,300 mg/d (100 mmol/d) suffer from high risk of bias. Therefore, no concerns are raised with respect to unintended risks that would argue against using blood pressure as a surrogate endpoint in the case of sodium intake reduction, at least as low as the Adequate Intake of 1,500 mg/d (65 mmol/d). Thus, based on the committee’s assessment, the benefits of reducing sodium intake to specific levels as specified by the CDRR outweigh the possible concerns about harms.
4. What Are the Advantages and Disadvantages Associated with Use of the Biomarker When Compared with the Best Available Alternative? How Does the Biomarker Benefit Management and Outcomes? (Critical Factor)
The 2010 IOM Report reported noted that “The evaluation may proceed differently depending upon whether a variety of valid treatment options are available compared to if no treatments have yet been developed, for example” (IOM, 2010, p. 112). In this case, the advantages of using blood pressure as a surrogate endpoint, as opposed to only using data on hypertension and cardiovascular disease incidence, are three-fold:
- First, the range of intakes over which clinical trial data for sodium reduction are available is much wider for blood pressure than it is for hypertension and cardiovascular disease. Thus, blood pressure data have much wider applicability to the populations of interest.
- Second, there is much more intake–response information for blood pressure, owing to the fact that clinical trial data for blood pressure involve a wide range of intervention sizes from less than 100 mg/d (4 mmol/d) reduction to almost 3,000 mg/d (130 mmol/d) reduction. By contrast, almost all the interventions for hypertension and cardiovascular disease were clustered around an intervention size of 1,000 mg/d (43 mmol/d) reduction.
- Third, use of blood pressure as a surrogate endpoint is beneficial to management and outcomes because it is a continuous marker, and thus can be used as a target for prevention.
Together, these factors support that using blood pressure as a surrogate endpoint has many comparative advantages to using the best available alternatives of hypertension incidence and cardiovascular disease incidence.
5. Is the Biomarker for Drugs, Biologics, or Device Development; for Relationships Between Diet or Nutrients and Disease; or for Public Health Monitoring and Interventions? (Critical Factor)
The 2010 IOM Report noted that “While the highest level of scientific rigor is needed in biomarker evaluations for all uses, each category of use has different risks and regulatory frameworks, which carry implications for appropriate evidence thresholds and requirements for biomarker use” (IOM, 2010, p. 112). In this case, blood pressure is used as a biomarker for relationships between “nutrients and disease” and “public health … interventions.” The appropriate evidence thresholds were previously delineated in the Guiding Principles Report (NASEM, 2017), and applied rigorously by the committee in Chapter 10.
One key issue has been whether blood pressure is on the causal pathway between sodium intake reduction and hypertension or cardiovascular disease risk such that it reliably predicts changes in hypertension and cardiovascular disease risk when sodium intake is reduced. To address this question, the committee evaluated the results of three long-term followups to previously completed large intervention trials that measured both blood pressure and cardiovascular outcomes (Appel et al., 2001; Cook et al., 2016). The study participants for the TOHP I and II trials were adults 30–54 years of age with prehypertension (Cook et al., 2016). The participants in the TONE trial (Appel et al., 2001) were 60–80 years of age with hypertension. Assessments of sodium intakes in all three trials were obtained from multiple 24-hour urine samples, the methodology considered to be the most accurate. The original trials all showed reductions in systolic and diastolic blood pressure and in the incidence of hypertension after 18–36 months in which reduced sodium intakes were compared to control (usual) intakes. Information on the long-term follow-ups of participants was collected via questionnaires with additional data collected from medical records and the national death index.
To be able to measure cardiovascular outcomes, the available evidence is from long-term follow-up data from randomized controlled trials. In those studies, the interventions in the initial trial period were aimed at reducing blood pressure through dietary and behavioral counseling to reduce sodium intake (without changing other nutrient intakes) (see also the description of the evidence in the Chapter 10 section Cardiovascular Disease Morbidity and Mortality, Updated Strength-of-Evidence Evaluation). The consistency in both the direction and the persistence of these effects over relatively long periods of time provides some of the strongest evidence that blood pressure is on the causal pathway between sodium intake and cardiovascular disease risk. However, given the lack of quantitative information on the sodium intakes of study participants between the completion
of these trials and the follow-up data on cardiovascular outcomes, it is not possible to estimate whether the blood pressure changes due to sodium intake reductions explain a significant portion of the effect of sodium on cardiovascular disease risk or if there are additional effects of sodium that occur outside the blood pressure pathway.
Thus, while the available data clearly meet almost all criteria for qualifying a surrogate marker for a specific context (Prentice, 1989), there remains some uncertainty as to whether blood pressure fully explains the effect of sodium intake reductions on cardiovascular risk. In considering whether blood pressure is a qualified surrogate marker for predicting the effect of sodium intakes on cardiovascular disease risk within the DRI context, this uncertainty does not negate the committee’s ability to qualify blood pressure as a surrogate marker for the purposes of establishing a CDRR for sodium and cardiovascular disease. Although the available data cannot accurately estimate what fraction of disease prevention from sodium reduction is directly attributable to blood pressure reduction, the directionality of the relationship is consistent, and appears persistent for up to 18 years of follow-up. These results are also consistent with drug trials relating blood pressure to cardiovascular disease, in which different classes of drugs with different mechanisms of action for lowering blood pressure had consistent effects on cardiovascular disease risk. Overall, the committee considered blood pressure to be a sufficiently accurate surrogate specifically for the purposes of establishing the positive slope of the intake–response relationship between sodium intake and chronic disease risk. Pursuant to the guidance provided in the Guiding Principles Report, the blood pressure data served as supporting evidence. The committee did not solely rely on the biomarker of blood pressure in making its decisions, but instead used blood pressure in tandem with trial-based evidence on incident hypertension and cardiovascular disease in determining the sodium CDRR.
6. What Is the Biomarker’s Purpose with Respect to Phase of Development in Clinical Trials? (Important Factor)
This factor is not applicable in this case.
7. Is the Biomarker for Primary or Secondary Disease Prevention? (Important Factor)
The 2010 IOM Report noted that “Biomarkers used for these purposes carry especially high risk and should be evaluated with this consideration in mind” (IOM, 2010, p. 112). In this case, the biomarker is being used for primary disease prevention, although the context is public health interventions rather than patient-level interventions. The “high-risk” nature of
using a biomarker for primary prevention informed the committee’s decision to use blood pressure in tandem with hypertension and cardiovascular disease in establishing the sodium CDRR. Thus, the committee did not solely rely on the biomarker in making its decisions.
Summary
In the main body of Chapter 10, the committee rigorously evaluated the evidence supporting the fact that blood pressure is on the causal pathway between sodium intake and cardiovascular risk and accurately predicts the directional benefits of sodium intake reduction on cardiovascular disease risk. In this annex, the committee evaluated whether blood pressure is qualified to serve as a surrogate marker within the DRI context when sodium is the intervention of interest and chronic disease is the outcome of interest (i.e., is fit for purpose). Based on the committee’s evaluation, the overall scientific evidence provides a sufficient basis both to qualify blood pressure as a surrogate marker for predicting the effects on hypertension and cardiovascular disease as well as to utilize blood pressure as a surrogate endpoint specifically in the case of interventions to reduce sodium intake. Therefore, the committee uses blood pressure as a surrogate marker for hypertension and cardiovascular disease in establishing the sodium CDRR.
ANNEX 10-2 REFERENCES
Appel, L. J., M. A. Espeland, L. Easter, A. C. Wilson, S. Folmar, and C. R. Lacy. 2001. Effects of reduced sodium intake on hypertension control in older individuals: Results from the Trial of Nonpharmacologic Interventions in the Elderly (TONE). Archives of Internal Medicine 161(5):685-693.
Bundy, J. D., K. T. Mills, J. Chen, C. Li, P. Greenland, and J. He. 2018. Estimating the association of the 2017 and 2014 hypertension guidelines with cardiovascular events and deaths in U.S. adults: An analysis of national data. JAMA Cardiology 3(7):572-581.
Cook, N. R., L. J. Appel, and P. K. Whelton. 2016. Sodium intake and all-cause mortality over 20 years in the Trials of Hypertension Prevention. Journal of the American College of Cardiology 68(15):1609-1617.
Desai, M., N. Stockbridge, and R. Temple. 2006. Blood pressure as an example of a biomarker that functions as a surrogate. American Association of Pharmaceutical Scientists Journal 8(1):E146-E152.
IOM (Institute of Medicine). 2010. Evaluation of biomarkers and surrogate endpoints in chronic disease. Washington, DC: The National Academies Press.
Israili, Z. H., R. Hernandez-Hernandez, and M. Valasco. 2007. The future of antihypertensive treatment. American Journal of Therapeutics 14(2):121-134.
Mancia, G., R. Fagard, K. Narkiewicz, J. Redon, A. Zanchetti, M. Böhm, T. Christiaens, R. Cifkova, G. De Backer, A. Dominiczak, M. Galderisi, D. E. Grobbee, T. Jaarsma, P. Kirchhof, S. E. Kjeldsen, S. Laurent, A. J. Manolis, P. M. Nilsson, L. M. Ruilope, R. E. Schmieder, P. A. Sirnes, P. Sleight, M. Viigimaa, B. Waeber, and F. Zannad. 2013. 2013 ESH/ESC Guidelines for the management of arterial hypertension. Blood Pressure 22(4):193-278.
NASEM (National Academies of Sciences, Engineering, and Medicine). 2017. Guiding principles for developing Dietary Reference Intakes based on chronic disease. Washington, DC: The National Academies Press.
Padwal, R. S., A. Bienek, F. A. McAlister, N. R. Campbell, and Outcomes Research Task Force of the Canadian Hypertension Education Program. 2016. Epidemiology of hypertension in Canada: An update. Canadian Journal of Cardiology 32(5):687-694.
Prentice, R. L. 1989. Surrogate endpoints in clinical trials: Definition and operational criteria. Statistics in Medicine 8(4):431-440.
Temple, R. 1999. Are surrogate markers adequate to assess cardiovascular disease drugs? JAMA 282(8):790-795.
Whelton, P. K., R. M. Carey, W. S. Aronow, D. E. Casey, Jr., K. J. Collins, C. Dennison Himmelfarb, S. M. DePalma, S. Gidding, K. A. Jamerson, D. W. Jones, E. J. MacLaughlin, P. Muntner, B. Ovbiagele, S. C. Smith, Jr., C. C. Spencer, R. S. Stafford, S. J. Taler, R. J. Thomas, K. A. Williams, Sr., J. D. Williamson, and J. T. Wright, Jr. 2018. 2017 ACC/AHA/AAPA/ABC/ACPM/AGS/APHA/ASH/ASPC/NMA/PCNA guideline for the prevention, detection, evaluation, and management of high blood pressure in adults: A report of the American College of Cardiology/American Heart Association task force on clinical practice guidelines. Hypertension 71(6):e13-e115.
Yetley, E. A., A. J. MacFarlane, L. S. Greene-Finestone, C. Garza, J. D. Ard, S. A. Atkinson, D. M. Bier, A. L. Carriquiry, W. R. Harlan, D. Hattis, J. C. King, D. Krewski, D. L. O’Connor, R. L. Prentice, J. V. Rodricks, and G. A. Wells. 2017. Options for basing Dietary Reference Intakes (DRIs) on chronic disease endpoints: Report from a joint US-/Canadian-sponsored working group. American Journal of Clinical Nutrition 105(1):249S-285S.
This page intentionally left blank.


