
11
Sodium Dietary Reference Intakes: Risk Characterization and Special Considerations for Public Health
The final two steps of the Dietary Reference Intake (DRI) organizing framework provide public health context for the revised or newly established reference values. One of the hallmarks of these steps is to compare the DRI values to intake distributions in the United States and Canada for the nutrient of interest, to assess whether population intakes are likely to be adequate, and to determine if the population is at risk due to excessive intake. Use of biochemical and clinical measures, if available, can also supplement this risk characterization. With the expansion of the DRI model, this step now also examines intakes in relevant populations in relation to the Chronic Disease Risk Reduction Intake (CDRR), if established. This information is then used to describe the public health implications of the established DRI values. This chapter provides the committee’s risk characterization and special considerations for public health as they relate to the sodium DRI values established in this report.
RISK CHARACTERIZATION BASED ON SODIUM INTAKE LEVELS IN THE U.S. AND CANADIAN POPULATIONS
Adequate Intakes (AIs) are usually established when the evidence is not sufficient to derive Estimated Average Requirements and Recommended Dietary Allowances. The sodium AIs were derived using evidence from the lowest level of sodium intakes evaluated in trials and evidence from the best-designed balance study in adults, and were extrapolated to children and adolescents based on sedentary Estimated Energy Requirements (EERs). Because the committee lacked information as to how the AIs relate to actual
requirements, caution is required in use and interpretation of the AI values (IOM, 2000, 2003). With sodium, the AI represents a level of intake that, based on the lack of adverse effects, appears to be adequate. Therefore, “similar groups with mean intakes at or above the AI can be assumed to have a low prevalence of inadequate intakes. When mean intakes of groups are below the AI, it is not possible to make any assumptions about the extent of intake inadequacy” (IOM, 2000, p. 12).
Reducing sodium intakes that are above the CDRR is expected to reduce the risk of chronic disease. Evidence on the effect of sodium reduction on risk of cardiovascular disease, risk of hypertension, and blood pressure was synthesized in order to establish the sodium CDRR. Assessing the public health context of usual sodium intakes of the U.S. and Canadian populations requires an assessment of the distribution of intakes above the CDRR to determine what proportion of the population might benefit from reductions in usual sodium intakes.
The sections that follow compare the sodium AIs and CDRRs established in this report to current sodium intakes in the U.S. and Canadian populations. Appendix G provides methodological details about the surveys used for these comparisons, namely the U.S. National Health and Nutrition Examination Survey (NHANES), Canadian Community Health Survey–Nutrition 2015 (CCHS Nutrition 2015), and the Feeding Infants and Toddlers Study 2016 (FITS 2016). Data are presented by sex and age groups, as provided in these data sources. Estimates from NHANES and CCHS Nutrition 2015 exclude salt added at the table or sodium intakes from supplements or medications, which would be expected to lead to a slight underestimation of intake (CDC/NCHS, 2019; Statistics Canada, 2017). Supplementary figures for select comparisons are provided in Appendix H.
Characterization by DRI Age, Sex, and Life-Stage Groups
Infants 0–12 Months of Age
The committee was provided with evidence on the distribution of usual sodium intake of U.S. infants (see Table 11-1). Among NHANES 2009–2014 infants 0–6 months of age who did not consume breast milk, estimated median sodium intake was 215 mg/d (9 mmol/d). Among FITS 2016 infants, which include both infants who did and did not consume breast milk, estimated median sodium intake was 195 mg/d (8 mmol/d). These median sodium intakes exceed the AI, which was derived by estimating sodium intake of breastfed infants and assumes an average sodium concentration in breast milk of 140 mg/L and an average consumption of 780 mL of breast milk per day (for additional details, see Chapter 8 and Appendix F).
TABLE 11-1 Usual Sodium Intake Among U.S. Infants 0–6 Months of Age, as Compared to the Sodium Adequate Intake
| Comparison Data Source | Age Range (Months) | Breastfeeding Status of Infants | Adequate Intake (mg/d) | Mean (mg/d)a | Percentile | ||
|---|---|---|---|---|---|---|---|
| 25th (mg/d) | 50th (mg/d) | 75th (mg/d) | |||||
| NHANES 2009–2014 | 0–6 | Not BF | 110 | 230 (7) | 169 | 215 | 275 |
| FITS 2016 | 0–5.9 | All | 110 | 214 (4) | 143 | 195 | 265 |
NOTES: Bold indicates the value is higher than the Adequate Intake for the DRI age, sex, and life-stage group. Intake values are presented in milligrams. To convert the milligram value to mmol, divide the intake level by 23.0. No analyses were identified that estimated usual sodium intake distribution for breastfed infants 0–6 months of age. FITS 2016 = Feeding Infants and Toddlers Study 2016; mg/d = milligrams per day; NHANES = National Health and Nutrition Examination Survey; Not BF = analysis of infants who did not consume breast milk.
aPresented as intake (standard error). SOURCES: Bailey et al., 2018; NHANES 2009–2014 (unpublished).
Intake estimates for infants 7–12 months of age include sodium intakes from breast milk, formula, and/or other milks in addition to complementary foods. Median usual sodium intakes among infants 7–12 months of age ranged from approximately 341–537 mg/d (15–23 mmol/d) and varied by the survey and by whether infants included in the analyses consumed breast milk (see Table 11-2). Infants in the NHANES 2003–2010 analysis who consumed some breast milk and FITS 2016 infants of all breastfeeding statuses had median intake slightly below the sodium AI; median sodium intakes for all other survey groups exceeded the AI. Estimated sodium intake was slightly higher in the analyses that did not include breastfed infants. This difference may reflect both the lower sodium content of breast milk compared to infant formula, as well as lower energy intakes (Heinig et al., 1993; Whitehead, 1995). Because breast milk is considered to be nutritionally adequate, the intake of breastfed infants in this age group is not a public health concern.
Children and Adolescents 1–18 Years of Age
Because it is unknown how the AI relates to actual requirements, caution must be exercised when interpreting the prevalence of intakes above or below the AI in terms of adequacy. However, Table 11-3 indicates that more than 95 percent, and in many cases almost all, of U.S. and Canadian children and adolescents consume sodium at levels above the AI. The occurrence of a relatively low prevalence of intakes less than the AI for some groups in Table 11-4 cannot be interpreted as inadequate (IOM, 2000, 2003). Thus, the high prevalence of intakes above the AI likely reflect a low chance of inadequacy.
TABLE 11-2 Usual Sodium Intake Among U.S. Infants 7–12 Months of Age, as Compared to the Sodium Adequate Intake
| Comparison Data Source | Age Range (months) | Breastfeeding Status of Infants | Adequate Intake (mg/d) | Mean (mg/d)a | Percentile | ||
|---|---|---|---|---|---|---|---|
| 25th (mg/d) | 50th (mg/d) | 75th (mg/d) | |||||
| NHANES 2009–2014 | 7–12 | Not BF | 370 | 680 (38) | 334 | 537 | 861 |
| NHANES 2003–2010 | 7–11 | Not BF | 370 | 538 (22) | 370 | 484 | 650 |
| 7–11 | BFb | 370 | 383 (53) | 254 | 341 | 463 | |
| FITS 2016 | 6–11.9 | All | 370 | 400 (60) | 273 | 367 | 492 |
| NHANES 2003–2010 | 7–11 | All | 370 | 500 (19) | 320 | 438 | 614 |
| NHANES 2009–2012 | 6–11 | Allc | 370 | 497 (25) | 247 | 395 | 625 |
NOTES: Bold indicates the value is higher than the Adequate Intake for the DRI age, sex, and life-stage group. Intake values are presented in milligrams. To convert the milligram value to mmol, divide the intake level by 23.0. BF = analysis of infants who consumed breast milk; FITS 2016 = Feeding Infants and Toddlers Study 2016; mg/d = milligrams per day; NHANES = National Health and Nutrition Examination Survey; Not BF = analysis of infants who did not consume breast milk.
aPresented as intake (standard error).
bConsumption of at least some breast milk, as reported on the 24-hour dietary recall.
cEstimated 23.9 ± 3.3 percent of this sample reported consuming any breast milk.
SOURCES: Ahluwalia et al., 2016; Bailey et al., 2018; NHANES 2009–2014 (unpublished); Tian et al., 2013.
The sodium CDRR represents the lowest level of intake for which there was sufficient strength of evidence to characterize a chronic disease risk reduction. The sodium CDRR, therefore, is the intake above which intake reduction is expected to reduce chronic disease risk within an apparently healthy population. For children and adolescents, the sodium CDRRs were extrapolated from the adult value, based on sedentary EERs. For all DRI groups for children and adolescents 1–18 years of age, the 50th percentile of sodium intake exceeded the CDRR and in some cases, even the 5th percentile intake is greater than the CDRR (see Table 11-4). More than 80 percent of U.S. children and adolescents 1–18 years of age exceed the CDRR. Similarly, more than 80 percent of Canadian children and adolescents 1 year of age and older exceed the CDRR, with the exception of females 14–18 years of age, for whom more than 60 percent exceeded the CDRR. These results indicate that the majority of U.S. and Canadian children and adolescents may benefit from reduction in sodium intake. Reductions from current high levels of sodium intakes down to the CDRR
TABLE 11-3 5th and 50th Percentiles of Usual Sodium Intake Among U.S. and Canadian Children and Adolescents 1–18 Years of Age, as Compared to the Sodium Dietary Reference Intake Values
| DRI Group | AI (mg/d) | CDRR (mg/d)a | 5th Percentile (mg/d)b | 50th Percentile (mg/d)b |
|---|---|---|---|---|
| Both sexes, 1–3 years | ||||
| U.S., both sexes | 800 | 1,200 | 1,169 (50) | 1,935 (24) |
| Canada, males | 800 | 1,200 | 948 (141) | 1,645 (49) |
| Canada, females | 800 | 1,200 | 872 (137) | 1,547 (55) |
| Both sexes, 4–8 years | ||||
| U.S., both sexes | 1,000 | 1,500 | 1,800 (33) | 2,663 (23) |
| Canada, males | 1,000 | 1,500 | 1,845 (243) | 2,406 (63) |
| Canada, females | 1,000 | 1,500 | 1,692 (228) | 2,212 (53) |
| Males, 9–13 years | ||||
| U.S. | 1,200 | 1,800 | 2,348 (96) | 3,320 (51) |
| Canada | 1,200 | 1,800 | 1,871 (107) | 2,910 (61) |
| Males, 14–18 years | ||||
| U.S. | 1,500 | 2,300 | 2,434 (117) | 3,905 (77) |
| Canada | 1,500 | 2,300 | 2,380 (138) | 3,519 (77) |
| Females, 9–13 years | ||||
| U.S. | 1,200 | 1,800 | 2,002 (72) | 2,894 (36) |
| Canada | 1,200 | 1,800 | 1,672 (88) | 2,555 (51) |
| Females, 14–18 years | ||||
| U.S. | 1,500 | 2,300 | 1,883 (152) | 2,886 (61) |
| Canada | 1,500 | 2,300 | 1,546 (88) | 2,499 (67) |
NOTES: Bold indicates the value is higher than the AI for the DRI age, sex, and life-stage group; italics indicates the value is higher than the CDRR for the DRI group. Intake values are presented in milligrams. To convert the milligram value to mmol, divide the intake level by 23.0. AI = Adequate Intake; CDRR = Chronic Disease Risk Reduction Intake; mg/d = milligrams per day.
aThe sodium CDRR represents the lowest level of intake for which there was sufficient strength of evidence to characterize a chronic disease risk reduction. If sodium intakes are above the CDRR, intake reduction is expected to reduce chronic disease risk within an apparently healthy population. The sodium CDRRs for children and adolescents were extrapolated from the adult CDRR based on sedentary Estimated Energy Requirements.
bPresented as intake (standard error).
SOURCES: CCHS Nutrition 2015 (unpublished); NHANES 2009–2014 (unpublished).
TABLE 11-4 Percent of U.S. and Canadian Children and Adolescents 0–18 Years of Age Exceeding the Adequate Intake, Chronic Disease Risk Reduction Intake, and Select Sodium Intake Levels
| DRI Group | AI (mg/d) | CDRR (mg/d)a | % of Population with Sodium Intake | |||||||
|---|---|---|---|---|---|---|---|---|---|---|
| > AI | > CDRR | > 4,100 mg/d | > 5,000 mg/d | |||||||
| U.S. | Canada | U.S. | Canada | U.S. | Canada | U.S. | Canada | |||
| Both sexes, 0–6 months | 120 | N/A | 94 | —b | N/A | N/A | 1 | —b | 1 | —b |
| Both sexes, 7–12 months | 370 | N/A | 70 | —b | N/A | N/A | 1 | —b | 1 | —b |
| Both sexes, 1–3 years | 800 | 1,200 | 99 | 97 | 94 | 81 | 1 | 1 | 1 | 1 |
| Both sexes, 4–8 years | 1,000 | 1,500 | 99 | 99 | 99 | 99 | 2 | 1 | 1 | 1 |
| Males, 9–13 years | 1,200 | 1,800 | 99 | 99 | 99 | 96 | 13 | 8 | 1 | 1 |
| Males, 14–18 years | 1,500 | 2,300 | 99 | 99 | 96 | 96 | 42 | 24 | 17 | 5 |
| Females, 9–13 years | 1,200 | 1,800 | 99 | 99 | 98 | 91 | 3 | 1 | 1 | 1 |
| Females, 14–18 years | 1,500 | 2,300 | 99 | 95 | 81 | 62 | 5 | 2 | 1 | 1 |
NOTES: Intake values are presented in milligrams. To convert the milligram value to mmol, divide the intake level by 23.0. AI = Adequate Intake; CDRR = Chronic Disease Risk Reduction Intake; mg/d = milligrams per day; N/A = not applicable.
aThe sodium CDRR represents the lowest level of intake for which there was sufficient strength of evidence to characterize a chronic disease risk reduction. If sodium intakes are above the CDRR, intake reduction is expected to reduce chronic disease risk within an apparently healthy population. The sodium CDRRs for children and adolescents were extrapolated from the adult CDRR based on sedentary Estimated Energy Requirements.
bCCHS Nutrition 2015 did not collect dietary intake data on children younger than 1 year of age (Statistics Canada, 2017).
SOURCES: CCHS Nutrition 2015 (unpublished); NHANES 2009–2014 (unpublished).
intake levels are expected to benefit the population’s health. This would be unlikely to increase the risk of inadequacy because the sodium CDRR is higher than the AI.
Adults 19 Years of Age and Older
The vast majority of U.S. and Canadian adults have usual sodium intakes higher than the AI (see Tables 11-5 and 11-6). In the United States,
the 5th percentile of usual sodium intake exceeds the AI for all adult DRI groups. In Canada, the 5th percentile of usual sodium intake exceeds the AI for all adult DRI groups with the exception of females 51 years of age or older, and the combined category of females 19 years of age and older. Because the AI is not based on the distribution of requirements, caution must be exercised when interpreting the prevalence of intakes above or below the AI in terms of adequacy. However, more than 90 percent, and in many cases almost all, of U.S. and Canadian adults are consuming sodium at values above the AI (see Table 11-6), indicating a very low probability of inadequacy of sodium. Because of uncertainties in how the AI relates to requirements, prevalence of intakes below the AI cannot be interpreted as being inadequate.
The sodium CDRR is the intake above which intake reduction is expected to reduce chronic disease risk within an apparently healthy population. For the U.S. population, the 50th percentile sodium intake exceeded the CDRR for all adult DRI groups; in many cases, the 5th percentile is greater than the CDRR. For the Canadian population, the 50th percentile exceeded the CDRR, except for females 51 years of age or older, and the combined category of females 19 years of age and older (see Tables 11-5 and 11-6). At least half or more of the U.S. and Canadian adult populations consume more sodium than the CDRR for most DRI groups, putting them at increased risk of cardiovascular disease. More than 80 percent of U.S. adult females, 97 percent of U.S. male adults, and, combined, 88 percent of all U.S. adults exceed the CDRR. Among Canadian adults, 80 percent of males and 46 percent of females exceed the CDRR, with 65 percent of all adults above the CDRR. Among U.S. and Canadian adults, the proportion above the CDRR tended to decline with increasing age, with the lowest proportion in adults 71 years of age and older. These high sodium intakes for all adults are a public health concern, as cardiovascular disease is a major health burden. These results indicate that the majority of U.S. and Canadian adults could benefit from sodium reduction, which would be expected to decrease risk of cardiovascular disease in the population.
Characterization by Sex and Life Stage
On average, males have higher usual intakes of sodium than women, and pregnant and lactating females have higher usual sodium intakes than nonpregnant or lactating females. These relationships are likely attributed to higher energy intakes in males than females, and pregnant and lactating females as compared to their nonpregnant and nonlactating counterparts. As noted in Chapter 3, sodium intake is highly correlated with energy intake, leading to higher intakes of sodium with greater energy intakes.
TABLE 11-5 5th and 50th Percentiles of Usual Sodium Intake Among U.S. and Canadian Adults 19 Years of Age and Older, as Compared to the Sodium Dietary Reference Intake Values
| DRI Group | AI (mg/d) | CDRR (mg/d)a | 5th Percentile (mg/d)b | 50th Percentile (mg/d)b |
|---|---|---|---|---|
| Males, 19–30 years | ||||
| U.S. | 1,500 | 2,300 | 2,688 (91) | 4,271 (54) |
| Canada | 1,500 | 2,300 | 2,307 (490) | 3,547 (136) |
| Males, 31–50 years | ||||
| U.S. | 1,500 | 2,300 | 2,709 (76) | 4,275 (44) |
| Canada | 1,500 | 2,300 | 1,630 (298) | 3,149 (74) |
| Males, 51–70 years | ||||
| U.S. | 1,500 | 2,300 | 2,397 (57) | 3,837 (47) |
| Canada | 1,500 | 2,300 | 1,798 (260) | 2,972 (65) |
| Males, > 70 years | ||||
| U.S. | 1,500 | 2,300 | 2,093 (57) | 3,256 (39) |
| Canada | 1,500 | 2,300 | 1,705 (93) | 2,626 (52) |
| Males, ≥ 19 years | ||||
| U.S. | 1,500 | 2,300 | 2,487 (39) | 4,027 (24) |
| Canada | 1,500 | 2,300 | 1,723 (62) | 3,093 (42) |
| Females, 19–30 years | ||||
| U.S. | 1,500 | 2,300 | 2,082 (77) | 3,055 (38) |
| Canada | 1,500 | 2,300 | 1,565 (138) | 2,326 (86) |
| Females, 31–50 years | ||||
| U.S. | 1,500 | 2,300 | 1,900 (42) | 2,995 (21) |
| Canada | 1,500 | 2,300 | 1,649 (135) | 2,383 (48) |
| Females, 51–70 years | ||||
| U.S. | 1,500 | 2,300 | 1,803 (61) | 2,813 (26) |
| Canada | 1,500 | 2,300 | 1,264 (55) | 2,150 (33) |
| Females, > 70 years | ||||
| U.S. | 1,500 | 2,300 | 1,610 (56) | 2,547 (33) |
| Canada | 1,500 | 2,300 | 1,241 (63) | 2,054 (39) |
| Females, ≥ 19 years | ||||
| U.S. | 1,500 | 2,300 | 1,846 (26) | 2,888 (13) |
| Canada | 1,500 | 2,300 | 1,425 (46) | 2,253 (25) |
| DRI Group | AI (mg/d) | CDRR (mg/d)a | 5th Percentile (mg/d)b | 50th Percentile (mg/d)b |
|---|---|---|---|---|
| Pregnant | ||||
| U.S. | 1,500 | 2,300 | 2,294 (224) | 3,337 (88) |
| Canada | 1,500 | 2,300 | 1,782 (421) | 2,579 (164) |
| Lactating | ||||
| U.S. | 1,500 | 2,300 | 2,721 (325) | 3,633 (135) |
| Canada | 1,500 | 2,300 | 1,849 (418) | 2,708 (119) |
NOTES: Bold indicates the value is higher than the AI for the DRI age, sex, and life-stage group; italics indicates the value is higher than the CDRR for the DRI group. Intake values are presented in milligrams. To convert the milligram value to mmol, divide the intake level by 23.0. AI = Adequate Intake; CDRR = Chronic Disease Risk Reduction Intake; mg/d = milligrams per day.
aThe sodium CDRR represents the lowest level of intake for which there was sufficient strength of evidence to characterize a chronic disease risk reduction. If sodium intakes are above the CDRR, intake reduction is expected to reduce chronic disease risk within an apparently healthy population.
bPresented as intake (standard error).
SOURCES: CCHS Nutrition 2015 (unpublished); NHANES 2009–2014 (unpublished).
Characterization by Country
Because the DRIs are established jointly for use in the U.S. and Canadian populations, there is interest in whether intakes vary by country. The 50th percentile of usual sodium intake was lower in Canada than in the United States for all of the DRI age, sex, and life-stage groups. Methods for collecting 24-hour dietary recalls, nutrient databases, and statistical methods used to estimate intakes were similar between the U.S. and Canadian surveys, and therefore would not be expected to explain these differences (CDC/NCHS, 2019; Statistics Canada, 2017; and see Appendix G for details of the methodology). Although no statistical comparisons were made, in many cases, the sodium intakes were substantially lower in Canada. For example, the median intake among adult males 19 years of age and older was more than 900 mg/d lower in Canada compared to the United States, and the median intake among adult females 19 years of age and older was more than 600 mg/d lower in Canada compared to the United States. The vast majority of both the U.S. and Canadian populations are above the AI so inadequate intakes are not a concern. Although the majority of the U.S. and Canadian populations have usual sodium intakes above the CDRR, the percent exceeding the CDRR were consistently equivalent or lower in the Canadian population.1 Notably, 80 percent of U.S. women and 46 percent
___________________
1 This text was revised since the prepublication release.
TABLE 11-6 Percent of U.S. and Canadian Adults 19 Years of Age and Older Exceeding the Adequate Intake, Chronic Disease Risk Reduction Intake, and Select Sodium Intake Levels
| DRI Group | AI (mg/d) | CDRR (mg/d)a | % of Population with Sodium Intake | |||||||
|---|---|---|---|---|---|---|---|---|---|---|
| > AI | > CDRR | > 4,100 mg/d | > 5,000 mg/d | |||||||
| U.S. | Canada | U.S. | Canada | U.S. | Canada | U.S. | Canada | |||
| Males, 19–30 years | 1,500 | 2,300 | 99 | 99 | 98 | 95 | 56 | 26 | 25 | 6 |
| Males, 31–50 years | 1,500 | 2,300 | 99 | 96 | 98 | 79 | 56 | 21 | 26 | 7 |
| Males, 51–70 years | 1,500 | 2,300 | 99 | 98 | 96 | 80 | 39 | 11 | 14 | 2 |
| Males, > 70 years | 1,500 | 2,300 | 99 | 98 | 90 | 70 | 17 | 2 | 3 | 1 |
| Males, ≥ 19 years | 1,500 | 2,300 | 99 | 97 | 97 | 80 | 47 | 17 | 20 | 5 |
| Females, 19–30 years | 1,500 | 2,300 | 99 | 96 | 89 | 51 | 7 | 1 | 1 | 1 |
| Females, 31–50 years | 1,500 | 2,300 | 99 | 97 | 83 | 56 | 9 | 1 | 1 | 1 |
| Females, 51–70 years | 1,500 | 2,300 | 98 | 87 | 78 | 41 | 5 | 1 | 1 | 1 |
| Females, > 70 years | 1,500 | 2,300 | 96 | 85 | 65 | 34 | 2 | 1 | 1 | 1 |
| Pregnant | 1,500 | 2,300 | 99 | 98 | 94 | 70 | 16 | 1 | 2 | 1 |
| Lactating | 1,500 | 2,300 | 99 | 98 | 99 | 76 | 22 | 1 | 1 | 1 |
| Females, ≥ 19 years | 1,500 | 2,300 | 99 | 92 | 80 | 46 | 6 | 1 | 1 | 1 |
| Both sexes, ≥ 19 years | 1,500 | 2,300 | 99 | 94 | 88 | 65 | 27 | 7 | 9 | 1 |
NOTES: Intake values are presented in milligrams. To convert the milligram value to mmol, divide the intake level by 23.0. AI = Adequate Intake; CDRR = Chronic Disease Prevention Intake; mg/d = milligrams per day.
aThe sodium CDRR represents the lowest level of intake for which there was sufficient strength of evidence to characterize a chronic disease risk reduction. If sodium intakes are above the CDRR, intake reduction is expected to reduce chronic disease risk within an apparently healthy population.
SOURCES: CCHS Nutrition 2015 (unpublished); NHANES 2009–2014 (unpublished).
of Canadian women exceed the CDRR. Additionally, although overall 5 percent of adult men in Canada exceed an average sodium intake of 5,000 mg/d, 20 percent of adult males in the United States exceed this intake level. Nevertheless, the evidence indicates that reducing sodium intakes if they are above the CDRR is warranted for both the Canadian and U.S. populations.
Characterization by Race and Ethnicity Groups
For the United States, distributions of the usual sodium intake were estimated by three race/ethnicity categories: non-Hispanic white, non-Hispanic black, and Hispanic (see Figures 11-1 and 11-2). Although no statistical comparisons were made, in nonpregnant and nonlactating adults, non-Hispanic whites tended to have highest sodium intakes; this pattern was not seen in children and adolescents.
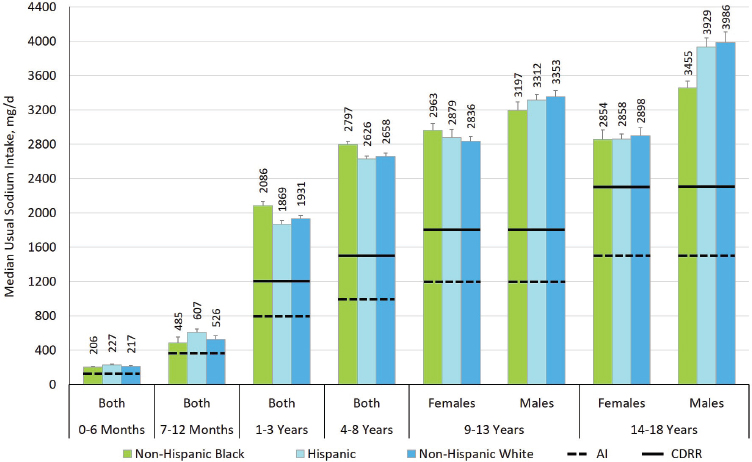
NOTES: Intake values are presented in milligrams. To convert the milligram value to mmol, divide the intake level by 23.0. AI = Adequate Intake; CDRR = Chronic Disease Risk Reduction Intake; mg/d = milligrams per day.
SOURCE: NHANES 2009–2014 (unpublished).
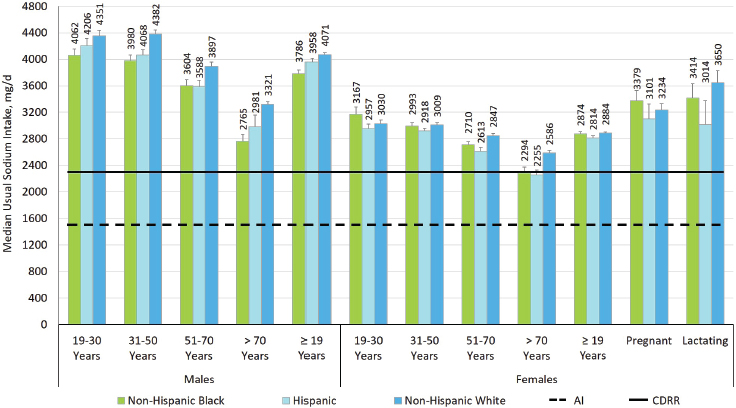
NOTES: Intake values are presented in milligrams. To convert the milligram value to mmol, divide the intake level by 23.0. AI = Adequate Intake; CDRR = Chronic Disease Risk Reduction Intake; mg/d = milligrams per day.
SOURCE: NHANES 2009–2014 (unpublished).
Characterization by Hypertension Status
Distributions of the usual sodium intakes in the United States and Canada were stratified by hypertension status. In the Canadian distributions, hypertension status was self-reported and stratified into two categories based on the question “Do you have high blood pressure?” (Statistics Canada, 2017). In the U.S. distributions, hypertension status was stratified into three categories—normotensive, elevated blood pressure, and hypertensive. Hypertension status was defined using the 2017 American College of Cardiology and the American Heart Association guidelines for adults (Whelton et al., 2018), based on the mean of up to three consecutive blood pressure measurements or use of hypertensive medications. In both analyses, individuals who self-reported having a history of cardiovascular disease were excluded.2 For comparability between the United States and Canada,
___________________
2 The NHANES usual sodium intake distribution stratified by hypertension status excluded anyone who had reported that a doctor or other health professional had ever told them they had a stroke or heart attack (myocardial infarction). The CCHS Nutrition 2015 usual sodium intake distribution stratified by hypertension status excluded anyone who had reported that a health professional had ever told them they had heart disease. Participants who answered that they did not know or refused to answer were also excluded.
the elevated blood pressure group from the NHANES 2009–2014 data are omitted in this characterization.
Although no statistical comparisons were made, in some DRI age, sex, and life-stage groups, usual sodium intakes were comparable in normotensive adults and in adults with hypertension (see Figure 11-3). However, median usual sodium intakes were higher among normotensive adult males and females (≥ 19 years of age and older) compared to their hypertensive counterparts. Normotensive pregnant women also had higher median sodium intakes compared to hypertensive women in the United States. Estimates of usual sodium intake among hypertensive pregnant women were statistically unstable in the U.S. data and were too variable to be reported in the Canadian data. Both hypertensive and normotensive population groups in the United States and Canada have sodium intakes that exceed the CDRR; reductions in usual sodium intakes above the CDRR are expected to reduce risk of chronic disease in the apparently healthy population.
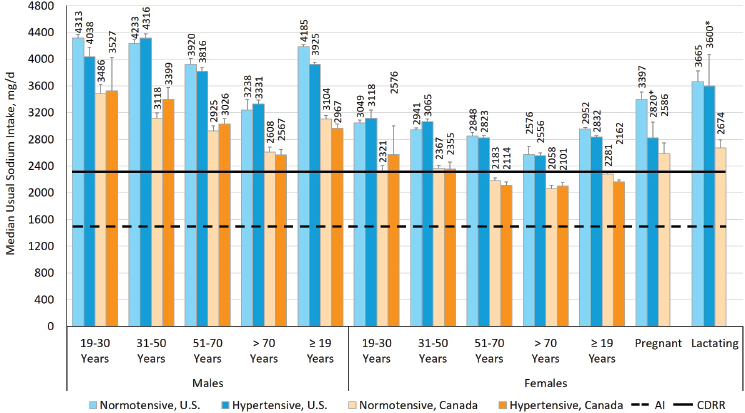
NOTES: Intake values are presented in milligrams. To convert the milligram value to mmol, divide the intake level by 23.0. * = estimate is statistically unstable; AI = Adequate Intake; CDRR = Chronic Disease Risk Reduction Intake; mg/d = milligrams per day.
SOURCES: CCHS Nutrition 2015 (unpublished); NHANES 2009–2014 (unpublished).
THE ROLE OF SODIUM IN THE FOOD SUPPLY AND SOURCES OF SODIUM IN THE DIET
The sections that follow further contextualize sodium intake levels in the U.S. and Canadian populations by first considering the roles of sodium in the food supply and then reviewing the evidence regarding the top contributors to sodium intake.
Roles of Sodium in the Food Supply
To understand the top contributors of sodium in the diet, the roles of sodium in the food supply are useful to consider. Sodium, typically in the form of sodium chloride (commonly referred to as “salt”), has many functional applications and imparts desirable qualities. Brief summaries of some of those key roles are described below.
Preserving and Fermenting Foods
Salt has long been used to preserve food. As water is critical for the growth of microorganisms, a primary mechanism by which salt can preserve food is by reducing water content. The binding of salt to water reduces water’s chemical and biological activity and makes it unavailable to microorganisms. The water activity of foods can be decreased by means of osmotic gradients that promote migration of water out of the food (e.g., surface application of dry salt crystals, brining) or direct addition of salt into a food formulation. Salt can also slow microbial growth by disrupting the activity of enzymes and DNA replication. Salt added during processing can selectively inhibit the growth of food pathogens such as Salmonella or Clostridium botulinum. These beneficial effects are attributed to inhibition of bacterial growth rather than cell death.
Salt is a critical ingredient in food fermentations. Food fermentation in products like sauerkraut, cheese, and salami is aided by the presence of salt, which selectively promotes the growth of lactic acid bacteria. Lactic acid–producing bacteria are tolerant of high-salt environments and thus can grow in the presence of salt faster than other spoilage microorganisms and food pathogens. Lactic acid is produced by these bacteria as they metabolize (ferment) carbohydrates, which decreases the pH of the food. Thus, the salting of vegetables, cheese, and meats allows for selective bacterial lactic acid fermentation and creates a low-pH environment that preserves the food.
Altering the Texture of Foods
Salt can alter the texture of foods, especially meats. During the brining of a meat product, salt migrates into the muscle where it increases the solubil-
ity of meat proteins. When the meat is cooked, the solubilized proteins can entrap water and produce a juicer texture. The solubilized proteins can form gels that further entrap water. Brining of meat increases its salt content. For instance, brined fresh pork contains more than 350 mg of sodium per 100 grams of meat whereas unbrined pork has 50 mg sodium per 100 g of meat.
Salt can also interact with proteins to increase their association with water to make them more water soluble (salting-in) and can also interact with proteins to decrease their charge, change their structure, and produce protein aggregation, which results in decreased water solubility (salting-out). Salting-in is important to the production of processed meat. The proteins in meats (myofibrillar proteins) have very low solubility in water with low sodium levels. Adding salt to meats increases protein solubility and thus the ability of myofibrillar proteins to associate with other components in the foods such as water and fat. When solubilized myofibrillar proteins are heated, they form gels that can entrap both water and fat droplets. This is the premise behind why meat products, such as emulsified sausages (e.g., hot dogs), require high levels of salt. If salt is not present in these products, the protein does not form gels and emulsify fat, resulting in separation of the water and fat from the protein to form a defective product. In other meat products, salt solubilization of the proteins allows the meat to bind together forming a cohesive product that does not fall apart (e.g., breakfast sausages and deli meats).
The quality of bread produced by yeast fermentation is also influenced by salt. Salt binds water and can penetrate yeast cells to modify the growth rate, slowing the fermentation process. Salt also alters the functionality of bread proteins (gluten) and promotes formation of a physical matrix that slows bread rising, entraps gas, and resists collapsing. This occurs because salt decreases the extendibility of gluten networks and thereby increases stability. Salt also helps decrease water activity, which both decreases spoilage and affects the flavor of bread products (Silow et al., 2016). Typical salt concentrations in bread are around 2 percent of the flour weight.
Imparting and Enhancing Flavor
Salt is added to food as a flavoring agent and can enhance the perception of other flavors by acting as a flavor modifier. Even in applications where it is added to affect microbial growth or the functional properties of food components, salt also contributes to flavor (see illustrative example in Box 11-1). In some processed foods, the amount of salt needed to affect flavor can be higher if the salt migrates into large pieces of food and associates with other food components. This internalized salt might not migrate to the taste buds during food consumption and thus is not perceived as flavor. This can result in the need for higher salt concentrations to obtain the desired salty flavor in many processed foods.
Other Forms of Sodium Used in Food Production
In addition to sodium chloride, sodium in foods can originate from food ingredients that are in the form of sodium salts. For example, phosphates are commonly added to foods to improve protein solubility, inhibit lipid oxidation, alter pH, and control bacterial growth. The most common forms of phosphates are sodium pyrophosphate and sodium tripolyphosphates. Sodium lactate and sodium diacetate are commonly added to precooked, processed meats along with sodium chloride to reduce or prevent the growth of the food pathogens (Seman et al., 2002). Sodium bicarbonate is used in chemically leavened baked goods (e.g., cakes) as a source of carbon dioxide. Sodium caseinate is a water-soluble form of the dairy protein casein. Sodium caseinate is used as a light-scattering agent to form a white appearance in products such as nondairy creamers, an emulsifier in salad dressing and sauces, and as a water binder in meats. Sodium benzoate and sodium proprionate are common antimicrobial agents added to foods. Sodium bisulfite and metabisulfite are added to food to prevent browning. Nonsodium salts (e.g., potassium) are available for most of these food ingredients, but their use can be limited by lower solubility, higher costs, and off flavors.
Source of Sodium in the Diet
Sources of Sodium Intake
The various roles of sodium in the food supply provide context for understanding the evidence on the various sources of sodium intake. In a 26-week study of 62 adult participants who reported regularly using
discretionary salt, estimated median sodium intake came from the following sources: 77 percent was from processing-added sources, 11.6 percent was inherent in the food, 6.2 percent was added at the table, 5.1 percent was added during cooking, and 0.1 percent was from water (Mattes and Donnelly, 1991). A more recent evaluation of 450 adults in three geographic locations in the United States reported similar findings: 70.9 percent of sodium intake came from sources outside the home, 14.2 came from sodium inherent in food, 5.6 percent came from in-home preparation, and 4.9 percent came from salt added at the table (Harnack et al., 2017). Tap water has small amounts of sodium, and along with dietary supplements and nonprescription antacids each contributed less than 0.5 percent to total sodium intake (Harnack et al., 2017). Findings from these studies indicate that the majority of sodium intake is not from sodium naturally inherent in the food, added during cooking, or at the table; rather, it is added during commercial processing and preparation.
Top Contributors to Sodium Intake in the United States and Canada
Various cycles of NHANES data have been used to characterize leading contributors of sodium intake in the U.S. population (O’Neil et al., 2012, 2018; Quader et al., 2017) (see Tables 11-7 through 11-9). Sources of dietary sodium among Canadians have been characterized using CCHS Nutrition 2015 data (Health Canada, 2018) (see Figure 11-4). The food categories in each analysis differ, making direct comparisons challenging. In Table 11-8, for instance, cheese is the top contributor to sodium intake, as the analysis disaggregated dairy intake from nondairy food (e.g., mixed dishes). Without this disaggregation of dairy intake, cheese would have been ranked as the 8th top sodium contributor among children 2–5 years of age and the 10th top contributor among children 6–11 and 12–18 years of age (O’Neil et al., 2018), a similar ranking as to what is found among the U.S. population (Quader et al., 2017). Thus, disaggregation of the different components of mixed dishes (e.g., the bread in sandwiches, cheese on pizza) would likely change the rankings of specific foods or food categories. This level of precision, however, does not currently exist in the available data.
In general, the major sources of sodium in the diet come from foods in which sodium chloride serves a functional purpose, including baked goods, processed meats, and cheese. The age-stratified analyses provide evidence that there are certain foods that commonly contribute a sizeable proportion of sodium intake in the diets of children, adolescents, and adults, but that there is variation in relative contribution and some differences in top food contributors.
TABLE 11-7 Top 10 Food Categories Contributing to Sodium Intake Among U.S. Persons 2 Years of Age and Older, Ranked by Percent Contribution—National Health and Nutrition Examination Survey, 2013–2014 (N = 8,067)
| Rank | Food Categorya | Percent Contributionb |
|---|---|---|
| 1 | Yeast breadc | 6.2 |
| 2 | Pizza | 5.9 |
| 3 | All single code sandwichesd | 5.7 |
| 4 | Cold cuts and cured meats | 5.4 |
| 5 | Soups | 3.8 |
| 6 | Burritos and tacos | 3.8 |
| 7 | All savory snackse | 3.7 |
| 8 | Chicken, whole pieces | 3.7 |
| 9 | Cheesef | 3.5 |
| 10 | Eggs and omelets | 2.6 |
aWhat We Eat In America food categories are available at http://www.ars.usda.gov/Services/docs.htm?docid=23429 (accessed October 22, 2018).
bThe percent sodium consumed is defined as the sum of the amount of sodium consumed from each specific What We Eat In America food category for all participants 2 years of age and older, divided by the sum of sodium consumed from all food categories for all participants 2 years of age and older, multiplied by 100. All estimates use one 24-hour dietary recall, take into account the complex sampling design, and use the 1-day diet sample weights to account for nonresponse and weekend/weekday recalls.
cYeast breads, rolls, buns, bagels, and English muffins.
dSandwiches, identified by a single What We Eat In America food code, include burgers, frankfurter sandwiches, chicken/turkey sandwiches, egg/breakfast sandwiches, and other sandwiches.
eChips, popcorn, pretzels, snack mixes, and crackers.
fNatural and processed cheese.
SOURCE: Adapted from Quader et al., 2017.
TABLE 11-8 Top 10 Food Categories Contributing to Sodium Intake Among U.S. Persons 2–18 Years of Age, Ranked by Percent Contribution—National Health and Nutrition Examination Survey, 2011–2014 (N = 5,876)
| Rank | 2–5 Years of Age (n = 1,511) |
6–11 Years of Age (n = 2,193) |
12–18 Years of Age (n = 2,172) |
|||
|---|---|---|---|---|---|---|
| Food Group | Percent Contributiona | Food Group | Percent Contributionb | Food Group | Percent Contributionc | |
| 1 | Cheese | 8.3 | Cheese | 9.1 | Cheese | 8.8 |
| 2 | Cured meats/poultry | 8.0 | Mixed dishes, pizza | 6.8 | Cured meats/poultry | 6.5 |
| 3 | Breads, rolls, tortillas | 6.4 | Cured meats/poultry | 6.5 | Mixed dishes, pizza | 6.4 |
| 4 | Mixed dishes, grain-based | 6.2 | Breads, rolls, tortillas | 6.4 | Breads, rolls, tortillas | 6.2 |
| 5 | Milk | 5.9 | Mixed dishes, sandwiches | 6.0 | Poultry | 5.7 |
| 6 | Poultry | 5.8 | Poultry | 5.6 | Mixed dishes, sandwiches | 5.7 |
| 7 | Mixed dishes, sandwiches | 4.1 | Mixed dishes, Mexican | 5.5 | Mixed dishes, grain-based | 5.3 |
| 8 | Sweet bakery products | 4.0 | Mixed dishes, grain-based | 5.4 | Mixed dishes, Mexican | 5.3 |
| 9 | Mixed dishes, Mexican | 3.9 | Sweet bakery products | 4.2 | Condiments and sauces | 4.3 |
| 10 | Savory snacks | 3.8 | Milk | 3.6 | Mixed dishes, meat/poultry/fish | 3.8 |
NOTES: Food groups are from the 47 subgroups defined by the What We Eat In America food category classification system. The percent contributions reflected in the table were adjusted to disaggregate dairy intake from nondairy foods (e.g., mixed dishes) and reallocate them to the milk, cheese, and yogurt subgroups, as appropriate.
aMean sodium intake for this group was 2,267 mg/d (99 mmol/d).
bMean sodium intake for this group was 3,036 mg/d (132 mmol/d).
cMean sodium intake for this group was 3,395 mg/d (148 mmol/d).
SOURCE: Adapted from O’Neil et al., 2018. Reprinted with permission under the Creative Commons Attribution (CC BY) license (http://creativecommons.org/licenses/by/4.0) (accessed January 18, 2019).
TABLE 11-9 Top 10 Food Categories Contributing to Sodium Intake Among U.S. Persons 19 Years of Age and Older, Ranked by Percent Contribution—National Health and Nutrition Examination Survey, 2003–2006 (N = 9,490)
| Rank | 19–50 Years of Age (n = 5,429) | ≥ 51 Years of Age (n = 4,061) | ||
|---|---|---|---|---|
| Food Group | Percent Contribution | Food Group | Percent Contribution | |
| 1 | Salt | 23.0 | Salt | 21.7 |
| 2 | Yeast breads and rolls | 8.0 | Yeast breads and rolls | 10.1 |
| 3 | Cheese | 7.9 | Cheese | 6.4 |
| 4 | Frankfurters, sausages, luncheon meats | 6.6 | Frankfurters, sausages, luncheon meats | 6.4 |
| 5 | Condiments and sauces | 5.7 | Pork, ham, bacon | 4.9 |
| 6 | Biscuits, corn bread, pancakes, tortillas | 4.4 | Condiments and sauces | 4.4 |
| 7 | Pork, ham, bacon | 4.3 | Soup, broth, bouillon | 3.9 |
| 8 | Crackers, popcorn, pretzels, chips | 4.2 | Cake, cookies, quick bread, pastry, pie | 3.8 |
| 9 | Cake, cookies, quick bread, pastry, pie | 3.1 | Crackers, popcorn, pretzels, chips | 3.7 |
| 10 | Tomatoes, tomato/vegetable juice | 2.8 | Biscuits, corn bread, pancakes, tortillas | 3.5 |
NOTES: Food groups were defined by the U.S. Department of Agriculture Dietary Sources Nutrient database, which were collapsed into 51 categories for the analysis. This text was revised since the prepublication release.
SOURCE: Adapted from O’Neil et al., 2012. Reprinted with permission under the Creative Commons Attribution license (http://creativecommons.org/licenses/by/3.0) (accessed January 18, 2019).
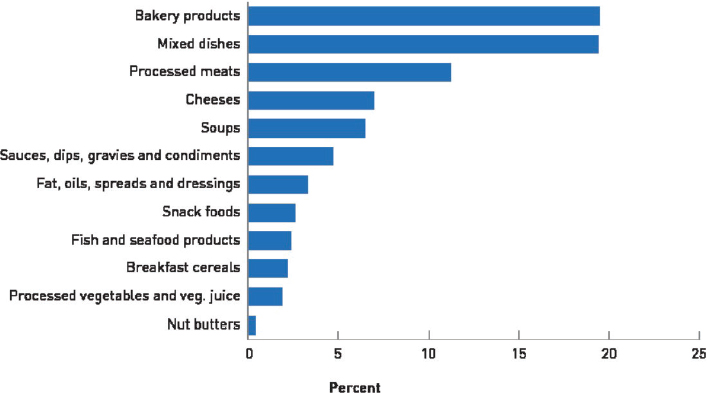
NOTE: Figure based on 2015 Canadian Community Health Survey, Health Canada Food Label Data 2017, and Canadian Nutrient File 2015 for top categories as classified in Health Canada’s 2012 sodium reduction targets.
SOURCE: © All rights reserved. Sodium Intake of Canadians in 2017. Health Canada. Adapted and reproduced with permission from the Minister of Health, 2018.
PUBLIC HEALTH IMPLICATIONS AND SPECIAL CONSIDERATIONS
To interpret the findings from the risk characterization analysis presented above, consideration is given to the meaning and use of AIs and the new DRI category, the CDRR. AIs are recommended average daily nutrient intake levels that are established when the intake distribution of requirements could not be established. To that end, an AI, including the sodium AI established in this report, does not necessarily reflect requirements; rather, it reflects the best estimate of intakes assumed to be adequate for an apparently healthy population. Despite the uncertainties that exist with the sodium AIs, the values presented in this report reflect intake levels that are broadly applicable to the U.S. and Canadian populations. The CDRR for sodium, in contrast, is the intake above which intake reduction is expected to reduce chronic disease risk within an apparent healthy population.
Sodium inadequacy is not a concern in the U.S. or Canadian populations. The vast majority of the U.S. and Canadian populations consume more sodium than what is recommended by the CDRR, which indicates that cardiovascular disease risk in the population is expected to be reduced with reductions in current sodium intakes. Most of the DRI age, sex, and
life-stage groups exceed the CDRR, indicating that the need for sodium reduction is broadly applicable in the population.
Despite the sodium CDRR not characterizing absolute risk for an individual, the public health implications are apparent. Hypertension and cardiovascular disease are prevalent in both the United States and Canada (Bundy et al., 2018; Padwal et al., 2016). Hypertension prevalence increases with age, and is more prevalent among non-Hispanic black adults than among non-Hispanic white, non-Hispanic Asian, and Hispanic adults (Bundy et al., 2018). Heart disease is the leading cause of death in the United States and the second leading cause of death in Canada (Health Canada, 2018; NCHS, 2017); cerebrovascular diseases are also among the leading causes of death in both countries (Health Canada, 2018; NCHS, 2017). Given the prevalence and effect of hypertension and cardiovascular disease, the public health context for the sodium CDRR is clear: Reductions in sodium intakes above the CDRR are expected to reduce chronic disease risk within the apparently healthy population.
Special Considerations
Normotensive and Hypertensive Individuals
A meta-analysis in the Agency for Healthcare Research and Quality systematic review, Sodium and Potassium Intake: Effects on Chronic Disease Outcomes and Risks (AHRQ Systematic Review), found that reducing sodium intakes led to a larger reduction in blood pressure among those with hypertension at baseline than among those who were normotensive at baseline (Newberry et al., 2018). This was verified by the committee’s reanalysis, as well as by an intake–response relation with baseline blood pressure in continuous form. It is plausible that those with hypertension may be particularly susceptible to the effects of sodium because of an increased sodium sensitivity (He et al., 2009; Wright et al., 2003). The prevalence of hypertension in the United States and Canada is high and increases with age. An estimated 45.4 percent [95% confidence interval (CI): 43.9, 46.9] of the U.S. general population 20 years of age and older have hypertension (blood pressure ≥ 130/80 mm Hg) (Bundy et al., 2018). The prevalence of hypertension increased to 49.6 percent [95% CI: 47.1, 52.2] among those 40–59 years of age, and to 73.7 percent [95% CI: 70.7, 76.7] among those 60 years of age and older. Approximately 90 percent of U.S. and Canadian adults will develop hypertension in their lifetimes (Vasan et al., 2002).
Although larger effects of sodium reduction on blood pressure have been seen in adults with hypertension as compared to normotensive adults, the benefits of sodium intake reduction are applicable to both. Moreover,
considering approximately 90 percent of adults will develop hypertension in their lifetimes (Vasan et al., 2002) and the currently excessive intakes of sodium by the majority of U.S. and Canadian adults, a population-based approach will likely significantly improve public health. The sodium CDRR, therefore, applies to those both with and without existing hypertension in order to lower blood pressure and reduce the incidence of both hypertension and its cardiovascular sequelae.
Excessive Sweat Losses
Individuals who are exposed to high temperatures or who engage in high levels of physical activity, especially at high temperatures, may require higher intakes of sodium than the AI owing to elevated sodium loss through higher sweat loss (Allsopp et al., 1998; Baker, 2017; Bates and Miller, 2008; Cogswell et al., 2015; Sharp, 2006). As an example, the sodium same intake of 1,525 mg/d (66 mmol/d) resulted in a positive sodium balance at ambient temperature, but it resulted in an approximately neutral balance at high temperatures (40°C [104°F]) because of increased sweat losses (Allsopp et al., 1998).
Sodium concentration in sweat among adults varies widely from 230–3,358 mg/L (10–146 mmol/L) (Sawka and Montain, 2000; Verde et al., 1982) with an average of 1,012 mg/L (44 mmol/L) (Kaptein et al., 2016). Sodium concentrations can vary with overall diet, sodium intake, sweating rate, hydration status, heat exposure and stress, heat acclimatization, duration and intensity of physical activity, and intra-individual variability of sodium reabsorption in the sweat gland (Allan and Wilson, 1971; Brouns, 1991; Brown et al., 2011; Palacios et al., 2004). Older adults likely have similar sweat sodium concentrations based on limited evidence (Inoue et al., 1999).
At ambient temperatures with moderate physical activity, several studies suggest sweat sodium losses are limited to a few mmol per day (Heer et al., 2000; Palacios et al., 2004). In a balance study in adolescent females, Palacios et al. (2004) reported that sodium sweat loss was 3 percent of a high sodium intake (4,000 mg/d [174 mmol/d]) and 10 percent of a low sodium intake (1,300 mg/d [57 mmol/d]), both within the estimated range of loss. Limited evidence suggests that pregnant women may have greater sweat losses than nonpregnant women possibly attributable to the onset of sweating at a lower temperature (Clapp, 1991). Sodium sweat concentrations increase up to 1,932–2,829 mg/L (84–123 mmol/L) at high temperatures (Fukumoto et al., 1988), but sodium sweat concentrations are lower in heat-acclimatized individuals exposed to high temperatures (Allsopp et al., 1998; Bates and Miller, 2008; Buono et al., 2007, 2018; Consolazio et al., 1963). Furthermore, heat acclimatization occurs rapidly and results in
a linear decrease in sweat sodium concentration over time (Buono et al., 2018). Even in heat-acclimatized individuals exposed to high temperatures and high physical activity, total sodium sweat loss is still greater because of greater sweat losses—up to 8 L/d (Malhotra et al., 1976). Because of the variability in heat acclimatization and sweat sodium losses, an individualized approach considering intensity of physical activity, temperature exposure, and sweat loss is needed.
Orthostatic Hypotension
Orthostatic hypotension is often related to dehydration and it tends to be transient. It can also be associated with specific diseases, such as advanced diabetes or Parkinson’s disease. These conditions are often characterized by symptomatic low blood pressure, which may increase risk of falls. Although the prevalence is debated (Saedon et al., 2018), objective measurement in the Systolic Blood Pressure Intervention Trial (SPRINT) reported that among 14,692 hypertensive patients screened for the SPRINT, 2.4 percent showed low standing systolic blood pressure (< 110 mm Hg) (Wright et al., 2015). In individuals with these conditions, ingestion of low-sodium diets may be ill advised; therefore, targeted guidance from health care providers on sodium intake is needed for individuals with orthostatic hypotension.
Implications of the Sodium DRI Values in Context of the Previous Values and the Expanded DRI Model
The sodium DRI values in this report reflect the committee’s synthesis of a broad range of evidence on adequate and safe levels of sodium intake and the relationship between sodium and chronic disease. To contextualize the public health implications, the committee provides comment on each of the DRI categories.
The sodium AIs, as with all AIs, are intake levels that do not necessarily reflect requirements; rather they are the best estimates for intake levels that are associated with health. The adult sodium AIs established in this report are similar to the values established in the Dietary Reference Intakes for Water, Potassium, Sodium, Chloride, and Sulfate (2005 DRI Report) (IOM, 2005). For adults 51 years of age and older, the committee did not extrapolate the sodium AI values downward based on energy intake. This departure from decisions made in the 2005 DRI Report reflects insufficient evidence specific to the sodium requirements in older individuals and a limited number of clinical trials conducted in older individuals at sodium intakes below 1,500 mg/d (65 mmol/d). The sodium AIs for children and adolescents were also updated, and the values are now extrapolated based
on EERs for sedentary individuals, rather than being based on reported energy intake. This decision was guided by concerns over measurement bias in self-reported energy intake and a possible disconnect between actual intakes and requirements. The different approach to extrapolating the sodium AI for adults to children resulted in slightly lower values for children 1–13 years of age3 than those established in the 2005 DRI Report.
In contrast to the approach taken in the 2005 DRI Report, chronic disease–related indicators were not considered for the sodium Tolerable Upper Intake Level (UL) in this report. This difference in approach stems from the expansion of the DRI model, as the UL now focuses on toxicological risks from excessive intake. The committee was unable to identify a specific toxicological risk outcome associated with high levels of sodium intake, except in extreme circumstances that do not necessarily reflect risk of habitual intake. The committee acknowledges that the absence of evidence is not necessarily an absence of effect. However, because sodium has a CDRR that characterizes chronic disease risk reduction with reductions in intake, the absence of a UL may be less problematic for sodium than for a nutrient that has an inverse relationship between intake and chronic disease risk.
The expansion of the DRI model now allows for the relationship between nutrient intake and chronic disease risk reduction to be characterized in a separate DRI category. Sodium is one of the first two nutrients to be considered under this expanded model, and is the first nutrient for which there was sufficient evidence to guide the selection CDRR values. Although the CDRR values are similar to the ULs established in the 2005 DRI Report, the methodological approach and the process of evaluating the totality of the evidence differs. The new DRI category provides specificity of the nature and direction of the relationship—in this case a positive relationship between sodium intake and cardiovascular disease risk. There was sufficient evidence from randomized controlled trials to support sodium reductions down to 2,300 mg/d (100 mmol/d) for adults. Although the evidence was insufficient to further define the CDRR by characteristics such as age, weight status, race/ethnicity, or comorbidities, the committee notes that there are population groups with higher prevalence and risk for hypertension and cardiovascular disease (e.g., older individuals, certain race/ethnicity groups, particularly non-Hispanic blacks). Reducing sodium intake toward the CDRR level is expected to be particularly beneficial for these groups. However, with evidence in both normotensive adults and adults with hypertension, the sodium CDRR is broadly applicable.
Guided by evidence on the tracking of blood pressure from childhood into adulthood, the committee extrapolated the sodium CDRR for adults to children and adolescents 1–18 years of age. There is less certainty in
___________________
3 This text was revised since the prepublication release.
the evidence regarding the long-term benefits of sodium reductions among children. However, the continuity of lower sodium intake from childhood into adulthood was viewed as prudent for public health, as there is insufficient evidence to determine when sodium reductions are most effective or become beneficial. Moreover, salt preferences develop in childhood and therefore can affect longer-term sodium intakes. The sodium CDRRs for children and adolescents was extrapolated based on EERs for sedentary individuals, rather than being based on reported energy intake. Although they are not equivalent DRI categories, compared to the sodium ULs established in the 2005 DRI Report, the sodium CDRRs for children are lower. From an applications standpoint, the committee acknowledges that these lower sodium DRIs may pose challenges for those developing diets and food programs for children.
Significant reductions in sodium intake are needed to alleviate the major public health burden associated with cardiovascular disease and to ensure that burden does not persist or worsen into the future. It was beyond the scope of this committee’s task to determine how the reductions are best achieved; however, based on the evidence reviewed herein regarding sources of sodium in the diet, continued efforts to reduce sodium intake in the population are warranted, such as those previously recommended (IOM, 2010). The evidence guiding the committee’s decision to establish the sodium CDRRs, coupled with evidence that intakes are above the sodium CDRRs for the vast majority of the population, indicate that both the U.S. and Canadian populations would benefit from reducing sodium intakes.
REFERENCES
Ahluwalia, N., K. A. Herrick, L. M. Rossen, D. Rhodes, B. Kit, A. Moshfegh, and K. W. Dodd. 2016. Usual nutrient intakes of US infants and toddlers generally meet or exceed Dietary Reference Intakes: Findings from NHANES 2009-2012. American Journal of Clinical Nutrition 104(4):1167-1174.
Allan, J. R., and C. G. Wilson. 1971. Influence of acclimatization on sweat sodium concentration. Journal of Applied Physiology 30(5):708-712.
Allsopp, A. J., R. Sutherland, P. Wood, and S. A. Wootton. 1998. The effect of sodium balance on sweat sodium secretion and plasma aldosterone concentration. European Journal of Applied Physiology and Occupational Physiology 78(6):516-521.
Bailey, R. L., D. J. Catellier, S. Jun, J. T. Dwyer, E. F. Jacquier, A. S. Anater, and A. L. Eldridge. 2018. Total usual nutrient intake of US children (under 48 months): Findings from the Feeding Infants and Toddlers Study (FITS) 2016. Journal of Nutrition 148(9S):1557S-1566S.
Baker, L. B. 2017. Sweating rate and sweat sodium concentration in athletes: A review of methodology and intra/interindividual variability. Sports Medicine 47(Suppl 1):111-128.
Bates, G. P., and V. S. Miller. 2008. Sweat rate and sodium loss during work in the heat. Journal of Occupational Medicine and Toxicology 3:4.
Brouns, F. 1991. Heat–sweat–dehydration–rehydration: A praxis oriented approach. Journal of Sports Sciences 9(Suppl 1):143-152.
Brown, M. B., K. K. Haack, B. P. Pollack, M. Millard-Stafford, and N. A. McCarty. 2011. Low abundance of sweat duct Cl– channel CFTR in both healthy and cystic fibrosis athletes with exceptionally salty sweat during exercise. American Journal of Physiology: Regulatory, Integrative and Comparative Physiology 300(3):R605-R615.
Bundy, J. D., K. T. Mills, J. Chen, C. Li, P. Greenland, and J. He. 2018. Estimating the association of the 2017 and 2014 Hypertension Guidelines with cardiovascular events and deaths in US adults: An analysis of national data. JAMA Cardiology 3(7):572-581.
Buono, M. J., K. D. Ball, and F. W. Kolkhorst. 2007. Sodium ion concentration vs. sweat rate relationship in humans. Journal of Applied Physiology (1985) 103(3):990-994.
Buono, M. J., M. Kolding, E. Leslie, D. Moreno, S. Norwood, A. Ordille, and R. Weller. 2018. Heat acclimation causes a linear decrease in sweat sodium ion concentration. Journal of Thermal Biology 71:237-240.
CDC/NCHS (Centers for Disease Control and Prevention/National Center for Health Statistics). 2019. National Health and Nutrition Examination Survey. https://www.cdc.gov/nchs/nhanes/index.htm (accessed February 12, 2019).
Clapp, J. F., 3rd. 1991. The changing thermal response to endurance exercise during pregnancy. American Journal of Obstetrics and Gynecology 165(6 Pt 1):1684-1689.
Cogswell, M. E., J. Maalouf, P. Elliott, C. M. Loria, S. Patel, and B. A. Bowman. 2015. Use of urine biomarkers to assess sodium intake: Challenges and opportunities. Annual Review of Nutrition 35:349-387.
Consolazio, C. F., L. O. Matoush, R. A. Nelson, R. S. Harding, and J. E. Canham. 1963. Excretion of sodium, potassium, magnesium and iron in human sweat and the relation of each to balance and requirements. Journal of Nutrition 79:407-415.
Fukumoto, T., T. Tanaka, H. Fujioka, S. Yoshihara, T. Ochi, and A. Kuroiwa. 1988. Differences in composition of sweat induced by thermal exposure and by running exercise. Clinical Cardiology 11(10):707-709.
Harnack, L. J., M. E. Cogswell, J. M. Shikany, C. D. Gardner, C. Gillespie, C. M. Loria, X. Zhou, K. Yuan, and L. M. Steffen. 2017. Sources of sodium in US adults from 3 geographic regions. Circulation 135(19):1775-1783.
He, J., D. Gu, J. Chen, C. E. Jaquish, D. C. Rao, J. E. Hixson, J. C. Chen, X. Duan, J. F. Huang, C. S. Chen, T. N. Kelly, L. A. Bazzano, and P. K. Whelton. 2009. Gender difference in blood pressure responses to dietary sodium intervention in the GenSalt study. Journal of Hypertension 27(1):48-54.
Health Canada. 2018. Sodium intake of Canadians in 2017. https://www.canada.ca/en/health-canada/services/publications/food-nutrition/sodium-intake-canadians-2017.html (accessed December 28, 2018).
Heer, M., F. Baisch, J. Kropp, R. Gerzer, and C. Drummer. 2000. High dietary sodium chloride consumption may not induce body fluid retention in humans. American Journal of Physiology: Renal Physiology 278(4):F585-F595.
Heinig, M. J., L. A. Nommsen, J. M. Peerson, B. Lonnerdal, and K. G. Dewey. 1993. Energy and protein intakes of breast-fed and formula-fed infants during the first year of life and their association with growth velocity: The DARLING Study. American Journal of Clinical Nutrition 58(2):152-161.
Inoue, Y., G. Havenith, W. L. Kenney, J. L. Loomis, and E. R. Buskirk. 1999. Exercise- and methylcholine-induced sweating responses in older and younger men: Effect of heat acclimation and aerobic fitness. International Journal of Biometeorology 42(4):210-216.
IOM (Institute of Medicine). 2000. Dietary Reference Intakes: Applications in dietary assessment. Washington, DC: National Academy Press.
IOM. 2003. Dietary Reference Intakes: Applications in dietary planning. Washington, DC: The National Academies Press.
IOM. 2005. Dietary Reference Intakes for water, potassium, sodium, chloride, and sulfate. Washington, DC: The National Academies Press.
IOM. 2010. Strategies to reduce sodium intake in the United States. Washington, DC: The National Academies Press.
Kaptein, E. M., D. Sreeramoju, J. S. Kaptein, and M. J. Kaptein. 2016. A systematic literature search and review of sodium concentrations of body fluids. Clinical Nephrology 86(10):203-228.
Malhotra, M. S., K. Sridharan, and Y. Venkataswamy. 1976. Potassium losses in sweat under heat stress. Aviation Space and Environmental Medicine 47(5):503-504.
Mattes, R. D., and D. Donnelly. 1991. Relative contributions of dietary sodium sources. Journal of the American College of Nutrition 10(4):383-393.
NCHS (National Center for Health Statistics). 2017. Health, United States, 2016: With chart-book on long-term trends in health. Washington, DC: U.S. Government Printing Office.
Newberry, S. J., M. Chung, C. A. M. Anderson, C. Chen, Z. Fu, A. Tang, N. Zhao, M. Booth, J. Marks, S. Hollands, A. Motala, J. K. Larkin, R. Shanman, and S. Hempel. 2018. Sodium and potassium intake: Effects on chronic disease outcomes and risks. Rockville, MD: Agency for Healthcare Research and Quality.
O’Neil, C. E., D. R. Keast, V. L. Fulgoni, and T. A. Nicklas. 2012. Food sources of energy and nutrients among adults in the US: NHANES 2003-2006. Nutrients 4(12):2097-2120.
O’Neil, C. E., T. A. Nicklas, and V. L. Fulgoni, 3rd. 2018. Food sources of energy and nutrients of public health concern and nutrients to limit with a focus on milk and other dairy foods in children 2 to 18 years of age: National Health and Nutrition Examination Survey, 2011-2014. Nutrients 10(8):1050.
Padwal, R. S., A. Bienek, F. A. McAlister, N. R. Campbell, and Outcomes Research Task Force of the Canadian Hypertension Education Program. 2016. Epidemiology of hypertension in Canada: An update. Canadian Journal of Cardiology 32(5):687-694.
Palacios, C., K. Wigertz, B. R. Martin, L. Jackman, J. H. Pratt, M. Peacock, G. McCabe, and C. M. Weaver. 2004. Sodium retention in black and white female adolescents in response to salt intake. Journal of Clinical Endocrinology and Metabolism 89(4):1858-1863.
Quader, Z. S., L. Zhao, C. Gillespie, M. E. Cogswell, A. L. Terry, A. Moshfegh, and D. Rhodes. 2017. Sodium intake among persons aged ≥2 years—United States, 2013–2014. Morbidity and Mortality Weekly Report 66(12):324-328.
Saedon, N. I., M. P. Tan, and J. Frith. 2018. The prevalence of orthostatic hypotension: A systematic review and meta-analysis. Journals of Gerontology. Series A: Biological Sciences and Medical Sciences. doi: 10.1093/gerona/gly188.
Sawka, M. N., and S. J. Montain. 2000. Fluid and electrolyte supplementation for exercise heat stress. American Journal of Clinical Nutrition 72(2 Suppl):564S-572S.
Seman, D. L., A. C. Borger, J. D. Meyer, P. A. Hall, and A. L. Milkowski. 2002. Modeling the growth of Listeria monocytogenes in cured ready-to-eat processed meat products by manipulation of sodium chloride, sodium diacetate, potassium lactate, and product moisture content. Journal of Food Protection 65(4):651-658.
Sharp, R. L. 2006. Role of sodium in fluid homeostasis with exercise. Journal of the American College of Nutrition 25(3 Suppl):231s-239s.
Silow, C., E. Zannini, C. Axel, K. M. Lynch, and E. K. Arendt. 2016. Effect of salt reduction on wheat-dough properties and quality characteristics of puff pastry with full and reduced fat content. Food Research International (Ottawa, Ontario) 89(Pt 1):330-337.
Statistics Canada. 2017. Canadian Community Health Survey–Nutrition (CCHS). http://www23.statcan.gc.ca/imdb/p2SV.pl?Function=getSurvey&SDDS=5049 (accessed October 23, 2018.
Tian, N., Z. Zhang, F. Loustalot, Q. Yang, and M. E. Cogswell. 2013. Sodium and potassium intakes among US infants and preschool children, 2003–2010. American Journal of Clinical Nutrition 98(4):1113-1122.
Vasan, R. S., A. Beiser, S. Seshadri, M. G. Larson, W. B. Kannel, R. B. D’Agostino, and D. Levy. 2002. Residual lifetime risk for developing hypertension in middle-aged women and men: The Framingham Heart Study. JAMA 287(8):1003-1010.
Verde, T., R. J. Shephard, P. Corey, and R. Moore. 1982. Sweat composition in exercise and in heat. Journal of Applied Physiology 53(6):1540-1545.
Whelton, P. K., R. M. Carey, W. S. Aronow, D. E. Casey, Jr., K. J. Collins, C. Dennison Himmelfarb, S. M. DePalma, S. Gidding, K. A. Jamerson, D. W. Jones, E. J. MacLaughlin, P. Muntner, B. Ovbiagele, S. C. Smith, Jr., C. C. Spencer, R. S. Stafford, S. J. Taler, R. J. Thomas, K. A. Williams, Sr., J. D. Williamson, and J. T. Wright, Jr. 2018. 2017 ACC/AHA/AAPA/ABC/ACPM/AGS/APHA/ASH/ASPC/NMA/PCNA guideline for the prevention, detection, evaluation, and management of high blood pressure in adults: A report of the American College of Cardiology/American Heart Association Task Force on clinical practice guidelines. Hypertension 71(6):e13-e115.
Whitehead, R. G. 1995. For how long is exclusive breast-feeding adequate to satisfy the dietary energy needs of the average young baby? Pediatric Research 37(2):239-243.
Wright, Jr., J. T., M. Rahman, A. Scarpa, M. Fatholahi, V. Griffin, R. Jean-Baptiste, M. Islam, M. Eissa, S. White, and J. G. Douglas. 2003. Determinants of salt sensitivity in black and white normotensive and hypertensive women. Hypertension 42(6):1087-1092.
Wright, Jr., J. T., J. D. Williamson, P. K. Whelton, J. K. Snyder, K. M. Sink, M. V. Rocco, D. M. Reboussin, M. Rahman, S. Oparil, C. E. Lewis, P. L. Kimmel, K. C. Johnson, D. C. Goff, Jr., L. J. Fine, J. A. Cutler, W. C. Cushman, A. K. Cheung, and W. T. Ambrosius. 2015. A randomized trial of intensive versus standard blood-pressure control. New England Journal of Medicine 373(22):2103-2116.
This page intentionally left blank.


