
Suggested Citation:"Appendix H: Supplemental Risk Characterization Figures." National Academies of Sciences, Engineering, and Medicine. 2019. Dietary Reference Intakes for Sodium and Potassium. Washington, DC: The National Academies Press. doi: 10.17226/25353.
×
Appendix H
Supplemental Risk Characterization Figures
In Chapters 7 and 11, the committee compared the potassium and sodium Dietary Reference Intake (DRI) values established in this report to reported usual intakes in U.S. and Canadian populations. Figures in this appendix, which supplement the information presented in those chapters, use data from the National Health and Nutrition Examination Survey (NHANES) 2009–2014 and the Canadian Community Health Survey–Nutrition 2015 (CCHS Nutrition 2015) (for additional details about these data sources, see Appendix G). The figures contained in this appendix are as follows:
- FIGURE H-1 Median and 75th percentile of usual potassium intakes among U.S. and Canadian children and adolescents 1–18 years of age, by DRI age, sex, and life-stage group.
- FIGURE H-2 Median and 75th percentile of usual potassium intakes among U.S. and Canadian adults 19 years of age and older, by DRI age, sex, and life-stage group.
- FIGURE H-3 Fifth percentile and median usual sodium intakes among U.S. and Canadian children and adolescents 1–18 years of age, as compared to the sodium DRIs.
- FIGURE H-4 Usual sodium intakes among U.S. and Canadian children and adolescents 1–18 years of age and older, as compared to the sodium DRIs and select intake levels.
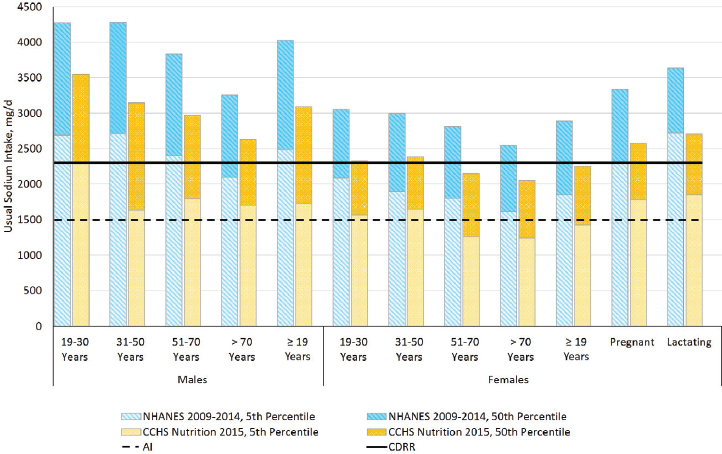
- FIGURE H-5 Fifth percentile and median usual sodium intakes among U.S. and Canadian adults 19 years of age and older, as compared to the sodium DRIs.
Suggested Citation:"Appendix H: Supplemental Risk Characterization Figures." National Academies of Sciences, Engineering, and Medicine. 2019. Dietary Reference Intakes for Sodium and Potassium. Washington, DC: The National Academies Press. doi: 10.17226/25353.
×
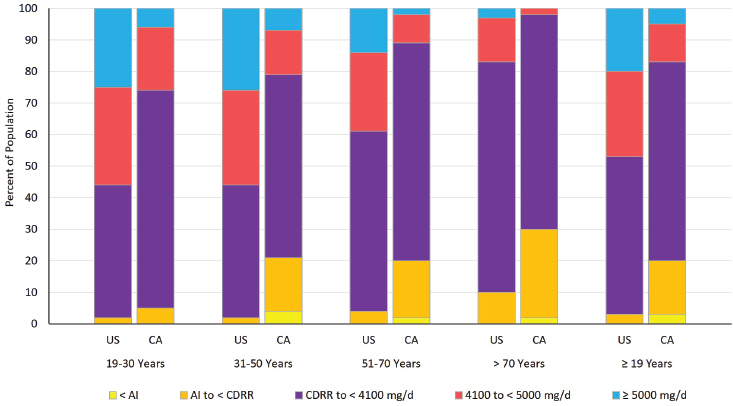
- FIGURE H-6 Usual sodium intakes among U.S. and Canadian males 19 years of age and older, as compared to the sodium DRIs and select intake levels.
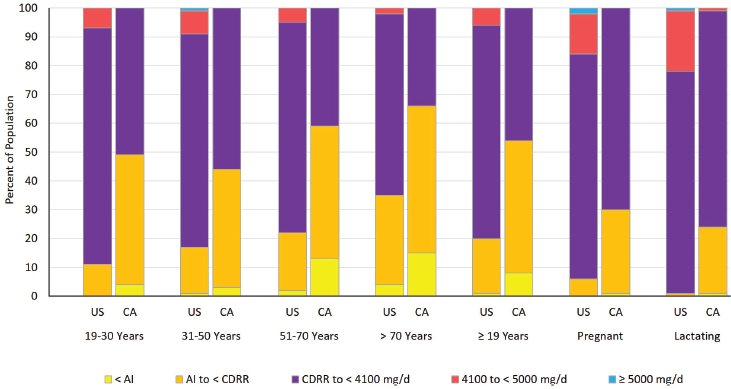
- FIGURE H-7 Usual sodium intakes among U.S. and Canadian females 19 years of age and older, as compared to the sodium DRIs and select intake levels.
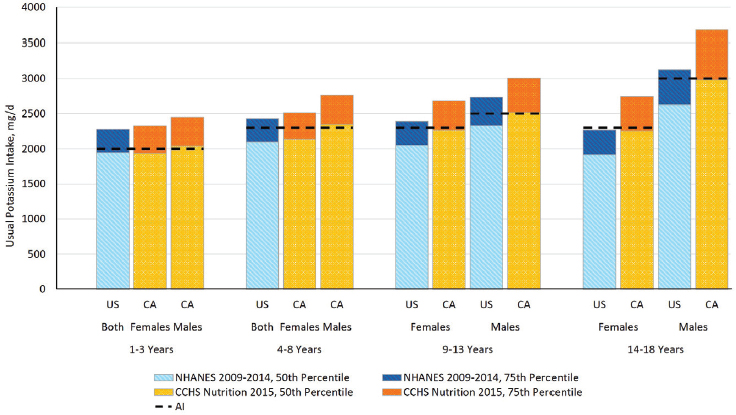
NOTE: AI = Adequate Intake; CA = Canada; CCHS Nutrition 2015 = Canadian Community Health Survey–Nutrition 2015; mg/d = milligrams per day; NHANES = National Health and Nutrition Examination Survey; U.S. = United States.
SOURCES: CCHS Nutrition 2015 (unpublished); NHANES 2009–2014 (unpublished).
Suggested Citation:"Appendix H: Supplemental Risk Characterization Figures." National Academies of Sciences, Engineering, and Medicine. 2019. Dietary Reference Intakes for Sodium and Potassium. Washington, DC: The National Academies Press. doi: 10.17226/25353.
×
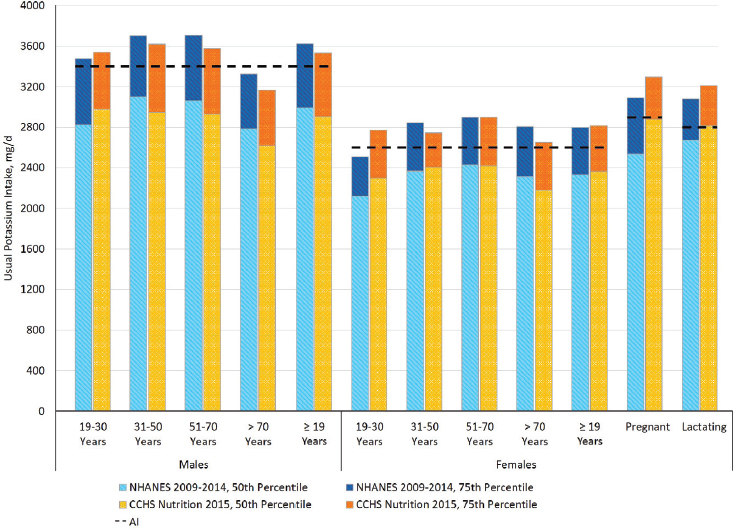
NOTE: AI = Adequate Intake; CCHS Nutrition 2015 = Canadian Community Health Survey–Nutrition 2015; mg/d = milligrams per day; NHANES = National Health and Nutrition Examination Survey.
SOURCES: CCHS Nutrition 2015 (unpublished); NHANES 2009–2014 (unpublished).
Suggested Citation:"Appendix H: Supplemental Risk Characterization Figures." National Academies of Sciences, Engineering, and Medicine. 2019. Dietary Reference Intakes for Sodium and Potassium. Washington, DC: The National Academies Press. doi: 10.17226/25353.
×
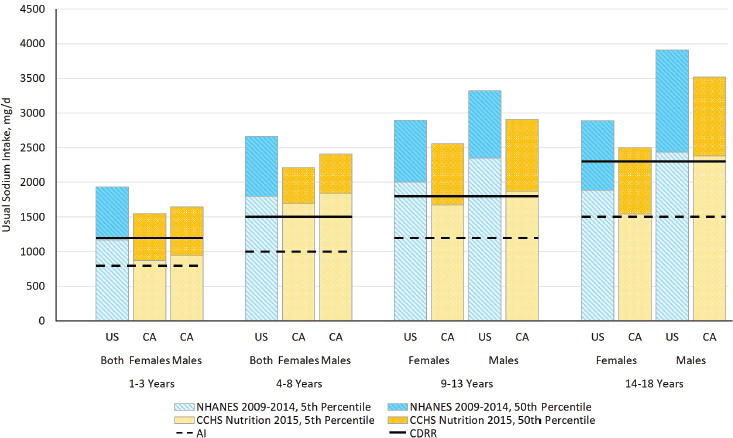
NOTE: AI = Adequate Intake; CA = Canada; CCHS Nutrition 2015 = Canadian Community Health Survey–Nutrition 2015; CDRR = Chronic Disease Risk Reduction Intake; mg/d = milligrams per day; NHANES = National Health and Nutrition Examination Survey; U.S. = United States.
SOURCES: CCHS Nutrition 2015 (unpublished); NHANES 2009–2014 (unpublished).
Suggested Citation:"Appendix H: Supplemental Risk Characterization Figures." National Academies of Sciences, Engineering, and Medicine. 2019. Dietary Reference Intakes for Sodium and Potassium. Washington, DC: The National Academies Press. doi: 10.17226/25353.
×
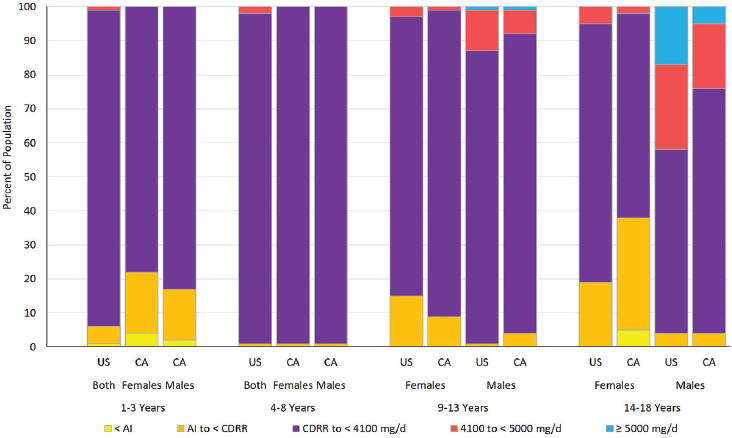
NOTE: AI = Adequate Intake; CA = Canada; CDRR = Chronic Disease Risk Reduction Intake; mg/d = milligrams per day; U.S. = United States.
SOURCES: CCHS Nutrition 2015 (unpublished); NHANES 2009–2014 (unpublished).
Suggested Citation:"Appendix H: Supplemental Risk Characterization Figures." National Academies of Sciences, Engineering, and Medicine. 2019. Dietary Reference Intakes for Sodium and Potassium. Washington, DC: The National Academies Press. doi: 10.17226/25353.
×
NOTE: AI = Adequate Intake; CCHS Nutrition 2015 = Canadian Community Health Survey–Nutrition 2015; CDRR = Chronic Disease Risk Reduction Intake; mg/d = milligrams per day; NHANES = National Health and Nutrition Examination Survey.
SOURCES: CCHS Nutrition 2015 (unpublished); NHANES 2009–2014 (unpublished).
Suggested Citation:"Appendix H: Supplemental Risk Characterization Figures." National Academies of Sciences, Engineering, and Medicine. 2019. Dietary Reference Intakes for Sodium and Potassium. Washington, DC: The National Academies Press. doi: 10.17226/25353.
×
NOTE: AI = Adequate Intake; CA = Canada; CDRR = Chronic Disease Risk Reduction Intake; mg/d = milligrams per day; U.S. = United States.
SOURCES: CCHS Nutrition 2015 (unpublished); NHANES 2009–2014 (unpublished).
Suggested Citation:"Appendix H: Supplemental Risk Characterization Figures." National Academies of Sciences, Engineering, and Medicine. 2019. Dietary Reference Intakes for Sodium and Potassium. Washington, DC: The National Academies Press. doi: 10.17226/25353.
×
NOTE: AI = Adequate Intake; CA = Canada; CDRR = Chronic Disease Risk Reduction Intake; mg/d = milligrams per day; U.S. = United States.
SOURCES: CCHS Nutrition 2015 (unpublished); NHANES 2009–2014 (unpublished).


