
Appendix D
2015 Multi-Sector General Permit (MSGP) Data Analysis
The committee obtained MSGP monitoring data that have been reported in the Environmental Protection Agency (EPA) Network Discharge Monitoring Report (NetDMR) database in response to the monitoring and reporting requirements of the 2015 MSGP (see Table 1-1). Stormwater samples are collected by the permittees at stormwater outfalls. An individual facility may have multiple outfalls at a site at which samples are collected. The samples are analyzed for sector-specific pollutants and any additional local requirements, typically by contract analytical laboratories, and the results are reported by the permittee using NetDMR. Permittees certify the data to be accurate and maintain laboratory reports on file, which are available for review upon request and during site inspections. In addition to MSGP benchmark monitoring, local monitoring requirements are often prescribed to inform compliance with effluent limitation guidelines, local or state regulations, or development or implementation of total maximum daily loads (TMDLs; labeled “required monitoring” in the database). The committee analyzed the data to assess the general extent to which individual reported results were above the benchmarks and whether there are sectors or subsectors that have a large percentage of facilities for which individual reported results exceed benchmark threshold values. The results of this data analysis are presented in this appendix through a series of graphs and tables of descriptive statistics, organized by pollutant. Summary tables are provided in Chapter 2.
The data obtained from EPA represented sites that were required under the 2015 MSGP to report their compliance information to the NetDMR database. The period of record for reported results was from mid-2015 through February 13, 2018. The data include more than 17,000 reported results from MSGP sites in the four states where EPA has primacy for the regulations (Idaho, Massachusetts, New Hampshire, and New Mexico), the District of Columbia, all U.S. territories, Indian country, and some federal facilities throughout the United States. The data analyzed by the committee are available upon request to the National Academies Public Access Records Office.
ANALYSIS METHODOLOGY
The outfall monitoring data were analyzed by pollutant and sector or subsector (see Table D-1 for sector classifications). Standard industrial classification (SIC) codes were used to identify the appropriate sector or subsector for each data point. Where SIC codes were lacking, other identifying information (e.g., “primary permit SIC description”) was used to identify the appropriate sector or subsector. One SIC code (1021, copper ores) fell under both G1 and G2 and in these circumstances, the code was assigned G1.
All results reported in the NetDMR database and delivered to the committee were used in the analysis, unless key data or identifying information was lacking. Where reported results lacked SIC codes and the sector could not be determined through other identifying information, those results were excluded from the analysis. Results were also excluded in cases where no units were provided and where the units associated
TABLE D-1
Industrial Sectors and Subsectors
| Subsector | Subsector Detail |
|---|---|
| A1 | General sawmills and planing mills |
| A2 | Wood preserving |
| A3 | Log storage and handling |
| A4 | Hardwood and wood product facilities; sawmills |
| B1 | Paperboard mills |
| B2 | Pulp and paper mills |
| C1 | Agricultural chemicals |
| C2 | Industrial inorganic chemicals |
| C3 | Soaps, detergents, cosmetics, and perfumes |
| C4 | Plastics, synthetics, and resins |
| C5 | Industrial organic chemicals, paints, lacquers, pharmaceuticals |
| D1 | Asphalt paving and roofing materials |
| D2 | Miscellaneous products of petroleum and coal |
| E1 | Clay product manufacturers |
| E2 | Concrete and gypsum product manufacturers |
| E3 | Glass and stone products |
| F1 | Steel works, blast furnaces, and rolling and finishing mills |
| F2 | Iron and steel foundries |
| F3 | Rolling, drawing, and extruding of nonferrous metals |
| F4 | Nonferrous foundries |
| F5 | Smelting and refining of nonferrous metals, miscellaneous primary metal products |
| G1 | Active copper ore mining and dressing facilities |
| G2 | Active metal mining facilities |
| H | Coal mines and related areas |
| I | Oil and gas extraction facilities |
| J1 | Sand and gravel mining |
| J2 | Mining of dimension and crushed stone and nonmetallic minerals |
| J3 | Clay, chemical, and fertilizer mineral mining |
| K1 | Hazardous waste treatment storage, or disposal facilities |
| L1 | Landfills, land application sites, and open dumps |
| L2 | L1 except municipal solid waste landfill areas closed |
| M | Automobile salvage yards |
| N1 | Scrap recycling and waste recycling facilities |
| N2 | Source separated recycling facilities |
| O | Steam electric generating facilities |
| P | Motor freight transportation facilities |
| Q | Water transportation facilities |
| R | Ship and boat building or repair yards |
| S | Airports |
| T | Treatment works |
| U1 | Grain mill products |
| U2 | Fats and oils products |
| Subsector | Subsector Detail |
|---|---|
| U3 | Meat, dairy, and other food products and beverages |
| V | Textile mills, apparel, and other fabric products |
| W | Furniture and fixture manufacturing facilities |
| X | Printing and publishing facilities |
| Y1 | Rubber products manufacturing |
| Y2 | Miscellaneous plastic products and manufacturing industries |
| Z | Leather tanning and finishing facilities |
| AA1 | Fabricated metal products, except coating |
| AA2 | Fabricated metal coating and engraving |
| AB | Transportation equipment, industrial, or commercial machinery manufacturing facilities |
| AC | Electronic and electrical equipment and components, photographic, and optical goods manufacturing facilities |
with the result could not be reasonably determined. The number of these excluded reported results are noted as footnotes to the tables that follow. The committee excluded a few reported results that were several orders of magnitude below known detection limits based on the current capabilities of chemical analysis. These exclusions are described in the pollutant-specific descriptions that follow. No high reported results were excluded because although some of the results appear suspect, it was not possible to associate the result with a reporting error with a high level of confidence. There could be additional reporting errors that are masked by the wide range of reported results.
The reported results for each pollutant were converted to consistent units (e.g., mg/L, µg/L), based on Table 1-3. In the analysis, results that were labeled as “less than” a specific value (e.g., some form of analytical detection limit) are analyzed as the value reported. Therefore, “less than 0.01 µg/L” becomes 0.01 µg/L for this analysis. In some cases the “less than” values reported were higher than the benchmark. For example, among the silver data reported, four of the reported results were higher than the hardness-specific benchmark (including <20 µg/L and <25 µg/L). For the purposes of this analysis, those results were analyzed and graphed as the value reported. Occurrences of “less than” values exceeding benchmarks are noted in footnotes in the tables where they occur. Similar to the “less than” values, for the few reported values where the data were labeled as “greater than,” the value used in the analysis was the value reported, which may represent the upper limit of detection or a reporting error.
The committee performed several levels of verification on this analysis. Three committee members helped review the methodology, and this appendix was reviewed by staff from the National Academies of Sciences, Engineering, and Medicine’s Committee on National Statistics and one independent reviewer. The spreadsheets containing the calculations were reviewed in detail by National Academies’ staff to check for errors. A few minor errors were detected that were discussed with the committee and subsequently corrected.
In the tables that follow, descriptive statistics are presented for all sectors and subsectors with at least one reported value (statistics generated from Excel), including
- The number of reported values,
- The minimum and maximum (e.g., the range of concentrations observed),
- The median (to highlight the center value of the data), and
- The 75th percentile to show a relatively common upper concentration.
The data were also analyzed by subsector to calculate the percentage of individual reported results that were below the benchmark limit (or four or eight times
the benchmark, consistent with suggested Additional Implementation Measure [AIM] thresholds; see Box 1-3). The data were not processed to determine whether data exceeding benchmarks warranted corrective action in accordance with the permit, because that determination is based on the average of four quarterly monitoring values. For pollutants with a benchmark threshold not dependent on hardness, all reported results were analyzed. This includes data (flagged “required monitoring” in the database) that may have been reported for other reasons, such as TMDLs. For the six metals where the benchmark threshold is dependent on receiving water hardness (cadmium, copper, lead, nickel, silver, and zinc), the reported results were compared to the facility-specific hardness-based benchmark entered into the database. Reported results flagged as “required monitoring” that lacked information on a hardness-based benchmark or permit limit or sufficient receiving water quality information to determine the appropriate benchmark were excluded from the analysis. The number of excluded reported results is noted in a footnote to each pollutant with hardness-dependent benchmarks.
The box-plot figures that follow illustrate the 25th, 50th, and 75th percentiles of the data, with the whiskers identifying the 10th and 90th percentiles. Data points outside of the 10th and 90th percentiles are shown as individual data points. Graphs for each pollutant only include sectors with at least eight reported results. Fewer than eight reported results were considered to be too few to provide a reasonable graphical representation of the data range and where the data were primarily centered. For pollutants with a single benchmark, the benchmark value as well as four and eight times the benchmark are plotted for ease of comparison. For the six metals where each sample benchmark is based on the receiving water hardness (cadmium, copper, lead, nickel, silver, and zinc), two benchmarks (plus eight times the benchmark) are presented for comparison based on generic hardness values—one representing soft water (60 mg/L as CaCO3) and the other representing hard water (200 mg/L CaCO3). The graphs include “required monitoring” reported results that were not included in the comparison against hardness-related benchmarks.
ANALYSIS LIMITATIONS
The data set has the following limitations. No information is known about the elements of the stormwater pollution prevention plan, including whether structural stormwater control measures were operating on site (and if so, whether those were designed or maintained appropriately) or whether the stormwater quality was managed using nonstructural activities, such as good housekeeping and site sweeping. In addition, no information is provided in the database on the hydrological characteristics of the site or the storm event, such as rainfall intensity or drainage area.
In addition, it was apparent that the data set contained some errors related to reporting. For example, one reported concentration for copper was in the range of 10−7 µg/L, which is not achievable given current detection limits for instrumentation. Some very low or high concentrations may have been the result of unit conversion errors.
The data represent more than 2 years of data collection, including the early part of the MSGP permit when all permittees are required to monitor and sample outfalls quarterly, at a minimum. If the average of four quarterly monitoring results meets the benchmark, those permittees are allowed to discontinue monitoring for the remainder of the permit cycle. Those that did not meet the benchmark continued to sample for an additional year. Therefore, the results are likely to be biased toward the higher concentrations, based on those permittees that had to collect additional samples. Therefore, the data should not be used to determine the percentage of permittees that had data exceeding benchmarks. The committee chose to analyze this longer data set rather than only the first year of reported results to capture more storms, given inherent variability in stormwater quality (see Chapter 3). A primary objective of the analysis was to identify sectors and pollutants with recurrent benchmark exceedances, and longer periods of reported results were helpful in this regard. For this 2-plus-year period, the effect would be less than it would be in past MSGP data analyses, which included data over either only year 2 or 4 of the permit (Harcum et al., 2005) or up to 4 years of the permit (EPA, 2012).
ANALYSIS RESULTS
The following sections summarize the 2015 MSGP reported results for individual pollutants, sorted by sector or subsector. Some of the pollutants (e.g., antimony, cadmium, cyanide, mercury, nickel, selenium) had a relatively small data set, and some of the subsectors only represent a single facility. The largest data sets include aluminum, copper, iron, lead, total suspended solids (TSS), and zinc. The results are summarized in Chapter 2 and in Tables 2-3 and 2-4.
Aluminum
Figure D-1 shows the NetDMR 2015 MSGP data for aluminum. For most sectors where aluminum was measured, the benchmark (750 µg/L) was achieved by at least 50 percent of the reported results. The exception was Sector H (coal mines and coal-mine-related facilities), which had no reported results that met the benchmark and for which most reported results exceeded a value eight times the benchmark. Among the sectors with at least eight reported results, Sectors N (scrap recycling), P (motor freight transportation), Q (water transportation facilities), and R (ship building) all had frequent individual results that exceeded the benchmark (>35 percent) and many (7–13 percent) had very high values reported. The complete data set is summarized in Table D-2.
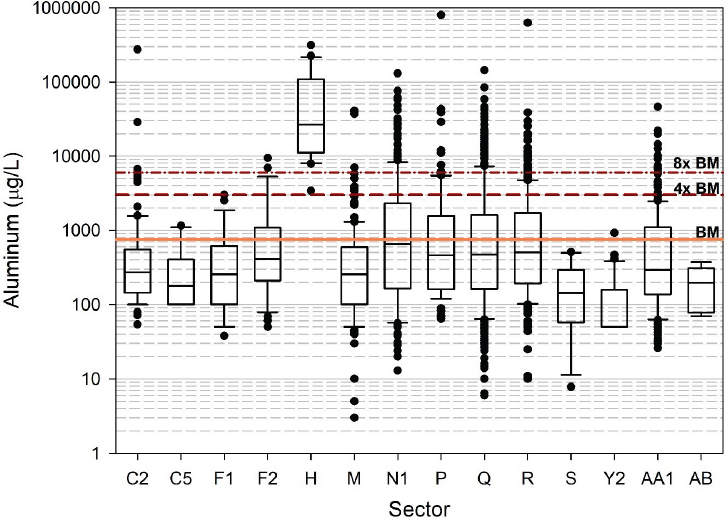
Aluminum results from NetDMR 2015 MSGP reported results through February 2018.
NOTES: Orange line denotes benchmark of 750 μg/L. Dashed purple lines represent four and eight times the benchmark.
TABLE D-2
Statistical Summary and Benchmark Comparison of 2015 MSGP Reported Results for Aluminum
| No. Reported Results | No. Facilities | Min. (µg/L) | Max. (µg/L) | Median (µg/L) | 75th Percentile (µg/L) | Percent >BM | Percent >4× BM | Percent >8× BM | |
|---|---|---|---|---|---|---|---|---|---|
| C2 | 89 | 5 | 54 | 274,000 | 270 | 540 | 19 | 7 | 3 |
| C5 | 10 | 2 | <100 | 1,150 | 178 | 310 | 10 | 0 | 0 |
| D1 | 2 | 1 | 70 | 120 | 95 | 108 | 0 | 0 | 0 |
| E2 | 2 | 1 | 1,900 | 2,100 | 2,000 | 2,050 | 100 | 0 | 0 |
| F1 | 31 | 2 | 38 | 3,000 | 255 | 571 | 23 | 0 | 0 |
| F2 | 52 | 4 | <50 | 9,470 | 412 | 1,080 | 27 | 12 | 8 |
| F3 | 6 | 2 | 37 | 270 | 50 | 73 | 0 | 0 | 0 |
| H | 22 | 3 | 3,410 | 315,000 | 26,700 | 99,975 | 100 | 100 | 95 |
| J2 | 1 | 1 | 80 | 80 | 80 | 80 | 0 | 0 | 0 |
| M | 190 | 39 | 3 | 41,000 | 255 | 588 | 18 | 5 | 2 |
| N1 | 318 | 53 | 13 | 130,000 | 649 | 2,290 | 46 | 21 | 13 |
| O | 2 | 1 | <100 | 100 | 100 | 100 | 0 | 0 | 0 |
| P | 91 | 10 | 64 | 800,000 | 460 | 1,450 | 38 | 15 | 9 |
| Q | 577 | 66 | <6 | 144,000 | 470 | 1,600 | 38 | 17 | 12 |
| R | 335 | 37 | 10 | 628,000 | 500 | 1,670 | 38 | 16 | 7 |
| S | 10 | 2 | 7.8 | 509 | 144 | 261 | 0 | 0 | 0 |
| T | 3 | 1 | 130 | 810 | 310 | 560 | 33 | 0 | 0 |
| U3 | 2 | 1 | 690 | 9,670 | 5,180 | 7,425 | 50 | 50 | 50 |
| V | 4 | 2 | <50 | 2,320 | 1,397 | 1,646 | 75 | 0 | 0 |
| Y2 | 36 | 3 | <50 | 920 | 50 | 153 | 3 | 0 | 0 |
| AA1 | 387 | 35 | 26 | 46,100 | 292 | 1,100 | 30 | 8 | 4 |
| AB | 8 | 1 | 70 | 370 | 195 | 263 | 0 | 0 | 0 |
NOTE: Twenty-seven reported results were not included because they did not have units or the sector/subsector could not be identified (9 without units, 18 without sector/subsector information).
Ammonia
Figure D-2 highlights the NetDMR 2015 MSGP data for ammonia. In general, most reported results met the benchmark (2.14 mg N/L). The complete data set is summarized in Table D-3.
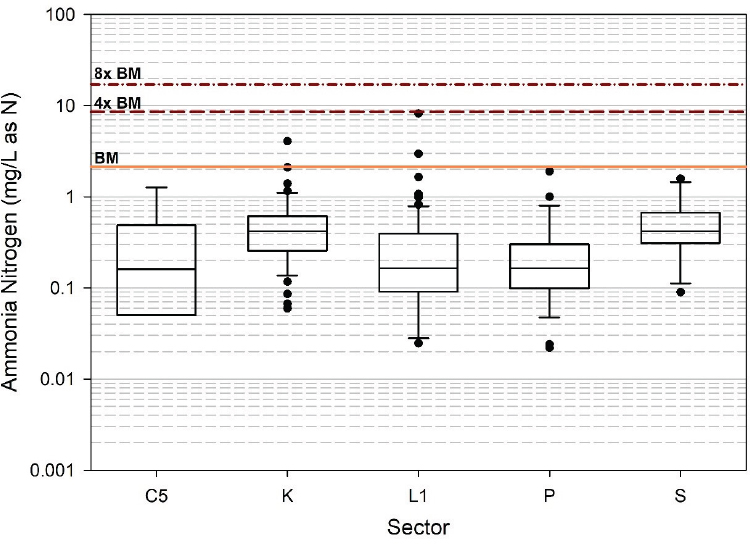
Ammonia results from NetDMR 2015 MSGP reported data through February 2018.
NOTES: Orange line denotes benchmark of 2.14 mg N/L. Dashed purple lines represent four and eight times the benchmark.
TABLE D-3
Statistical Summary and Benchmark Comparison of 2015 MSGP Reported Results for Ammonia
| No. Reported Results | No. Facilities | Min. (mg/L) | Max. (mg/L) | Median (mg/L) | 75th Percentile (mg/L) | Percent >BM | Percent >4× BM | Percent >8× BM | |
|---|---|---|---|---|---|---|---|---|---|
| C5 | 8 | 2 | <0.05 | 1.3 | 0.16 | 0.28 | 0 | 0 | 0 |
| K | 78 | 7 | 0.06 | <1,000 | 0.42 | 0.61 | 3a | 1a | 1a |
| L1 | 81 | 14 | 0.02 | 8.2 | 0.16 | 0.34 | 4 | 0 | 0 |
| L2 | 1 | 1 | 0.04 | 0.04 | 0.04 | 0.04 | 0 | 0 | 0 |
| N1 | 2 | 2 | 0.10 | 0.75 | 0.42 | 0.59 | 0 | 0 | 0 |
| P | 38 | 8 | 0.02 | 1.9 | 0.16 | 0.29 | 0 | 0 | 0 |
| Q | 4 | 1 | 0.10 | 0.45 | 0.24 | 0.39 | 0 | 0 | 0 |
| S | 11 | 2 | 0.09 | 1.6 | 0.42 | 0.66 | 0 | 0 | 0 |
| AA1 | 2 | 1 | 0.05 | 3.5 | 1.8 | 2.6 | 50 | 0 | 0 |
| AC | 4 | 1 | 0.11 | 1.1 | 0.17 | 0.43 | 0 | 0 | 0 |
NOTE: Four reported results were not included because the sector/subsector could not be identified.
a Includes one reported result with reported detection limit exceeding the benchmark (2.14 mg N/L).
Antimony
Data were reported for antimony for only two sectors and the data were not graphed because there were fewer than eight reported results for each. Table D-4 shows the results for the limited results reported for Sectors G1 and G2, metal mining (ore mining and dressing), both of which were able to meet the benchmark (640 µg/L).
TABLE D-4
Statistical Summary and Benchmark Comparison of 2015 MSGP Reported Results for Antimony
| No. Reported Results | No. Facilities | Min. (µg/L) | Max. (µg/L) | Median (µg/L) | 75th Percentile (µg/L) | Percent >BM | Percent >4× BM | Percent >8× BM | |
|---|---|---|---|---|---|---|---|---|---|
| G1 | 2 | 1 | <7.5 | <20 | <14 | <17 | 0 | 0 | 0 |
| G2 | 4 | 2 | <20 | <500 | <260 | <500 | 0 | 0 | 0 |
Arsenic
Figure D-3 shows the NetDMR 2015 MSGP data for arsenic. For all sectors where arsenic was measured and a sufficient number of reported results were in the database to allow graphing, the freshwater benchmark (150 µg/L) was achieved by greater than 75 percent of the reported data. Sectors K (hazardous waste facilities) and P (motor freight transportation) had one result and two results, respectively, that did not meet the benchmark. The complete data set is summarized in Table D-5.
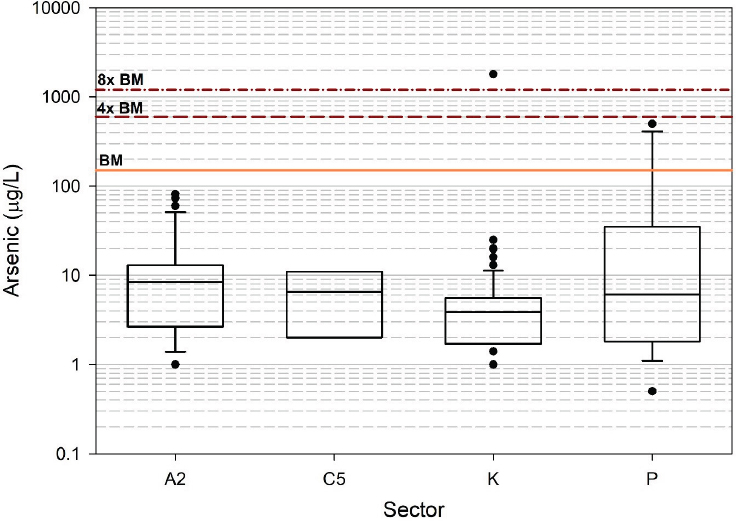
Arsenic results from NetDMR 2015 MSGP reported data through February 2018.
NOTES: Orange line denotes benchmark of 150 μg/L. Dashed purple lines represent four and eight times the benchmark.
TABLE D-5
Statistical Summary and Benchmark Comparison of 2015 MSGP Reported Results for Arsenic
| No. Reported Results | No. Facilities | Min. (µg/L) | Max. (µg/L) | Median (µg/L) | 75th Percentile (µg/L) | Percent >BM | Percent >4× BM | Percent >8× BM | |
|---|---|---|---|---|---|---|---|---|---|
| A2 | 34 | 3 | <1 | 81.5 | 8.5 | 13 | 0 | 0 | 0 |
| C3 | 4 | 1 | <10 | <10 | <10 | <10 | 0 | 0 | 0 |
| C5 | 8 | 2 | <2 | <11 | <6.5 | <11 | 0 | 0 | 0 |
| G1 | 4 | 1 | <25 | <25 | <25 | <25 | 0 | 0 | 0 |
| G2 | 4 | 2 | <25 | <40 | <32.5 | <40 | 0 | 0 | 0 |
| K1 | 88 | 7 | <1 | 1,800 | 3.9 | 5.5 | 1 | 1 | 1 |
| N1 | 1 | 1 | <5 | <5 | <5 | <5 | 0 | 0 | 0 |
| O | 3 | 1 | <5 | 18 | <5 | 12 | 0 | 0 | 0 |
| P | 21 | 8 | 0.5 | <500 | 6.1 | 20 | 10a | 0 | 0 |
| R | 5 | 1 | <1 | 14 | 1.4 | 1.9 | 0 | 0 | 0 |
| AA1 | 3 | 1 | 0.22 | 2.5 | 0.69 | 1.6 | 0 | 0 | 0 |
| AC | 2 | 1 | <5 | 6 | 5.5 | 5.8 | 0 | 0 | 0 |
a All exceedances were for reported results that had stated detection limits above the benchmark (150 μg/L).
Beryllium
Data were reported for beryllium for only Sectors G1 and G2, metal mining (ore mining and dressing), and were not graphed because there were fewer than eight reported results for each. Table D-6 shows the limited results for the data reported, which were able to meet the benchmark of 130 µg/L.
TABLE D-6
Statistical Summary and Benchmark Comparison of 2015 MSGP Reported Results for Beryllium
| No. Reported Results | No. Facilities | Min. (µg/L) | Max. (µg/L) | Median (µg/L) | 75th Percentile (µg/L) | Percent >BM | Percent >4× BM | Percent >8× BM | |
|---|---|---|---|---|---|---|---|---|---|
| G1 | 1 | 1 | <2 | <2 | <2 | <2 | 0 | 0 | 0 |
| G2 | 4 | 2 | <2 | <100 | <51 | <100 | 0 | 0 | 0 |
Biochemical Oxygen Demand (5 day) (BOD5)
Figure D-4 highlights the NetDMR 2015 MSGP data for BOD5. Of the three sectors with at least eight reported results, most of the data met the benchmark of 30 mg/L for Sectors L1 (landfills) and P (motor freight transportation facilities), but 44 percent of reported results in Sector S (airports) were not able to meet the benchmark. The complete data set is summarized in Table D-7.
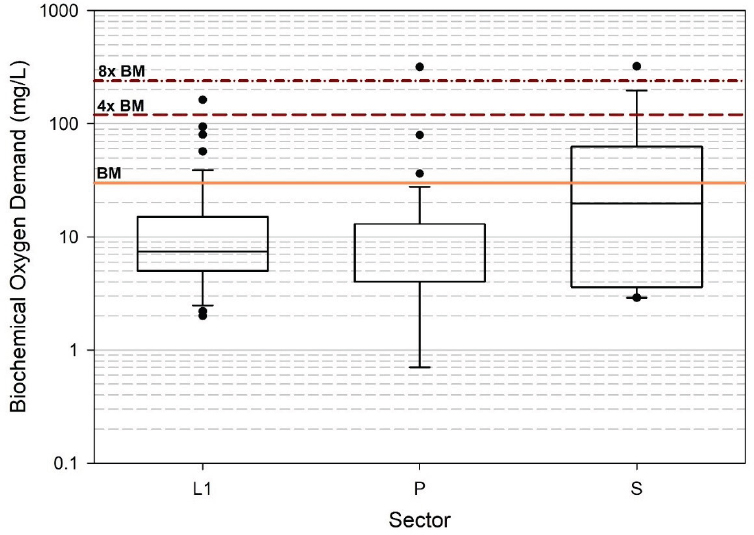
Five-day biochemical oxygen demand (BOD5) results from NetDMR 2015 MSGP reported data through February 2018.
NOTES: Orange line denotes benchmark of 30 mg/L. Dashed purple lines represent four and eight times the benchmark.
TABLE D-7
Statistical Summary and Benchmark Comparison of 2015 MSGP Reported Results for BOD5
| No. Reported Results | No. Facilities | Min. (mg/L) | Max. (mg/L) | Median (mg/L) | 75th Percentile (mg/L) | Percent >BM | Percent >4× BM | Percent >8× BM | |
|---|---|---|---|---|---|---|---|---|---|
| L1 | 68 | 12 | <2 | 163 | 7.4 | 15 | 13 | 1 | 0 |
| L2 | 1 | 1 | 78 | 78 | 78 | 78 | 100 | 0 | 0 |
| N1 | 1 | 1 | 9 | 9 | 9 | 9 | 0 | 0 | 0 |
| P | 36 | 4 | <0.0015 | 318 | 4 | 13 | 8 | 3 | 3 |
| Q | 1 | 1 | 13 | 13 | 13 | 13 | 0 | 0 | 0 |
| S | 18 | 2 | 2.9 | 322 | 20 | 61 | 44 | 11 | 6 |
Cadmium
Figure D-5 highlights the NetDMR 2015 MSGP data for cadmium. The cadmium benchmark value is determined by the hardness in the receiving water (see Analysis Methodology). For the graphs, two cadmium benchmark values are presented—one representing soft water (60 mg/L as CaCO3; 1.3 µg/L Cd) and one representing hard water (200 mg/L as CaCO3; 4.5 µg/L Cd), although these are presented for visualization purposes only. Benchmarks are based on site-specific hardness values. Of the sectors with at least eight reported results, only Sector K (hazardous waste facilities) exhibited benchmark exceedances (14 percent of reported results).
The figure and the descriptive statistics in Table D-8 include data collected for required monitoring that did not include hardness-specific benchmarks. Data entries without a hardness-specific benchmark were not included for the evaluation of the percentage of reported results that met benchmark thresholds.
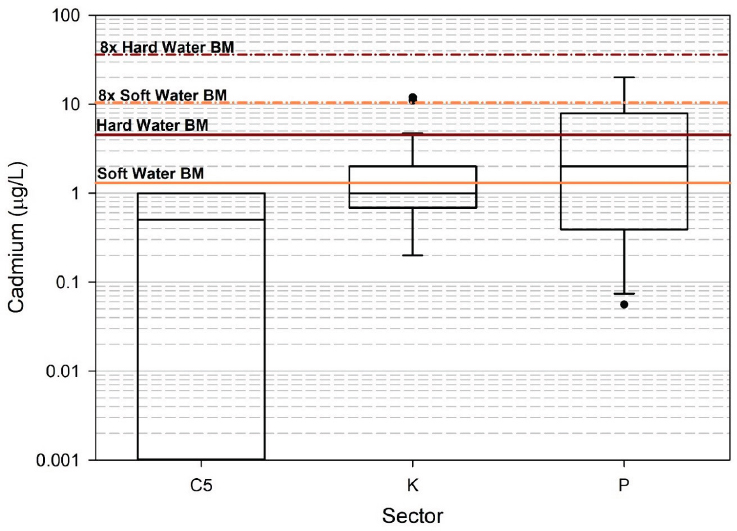
Cadmium results from NetDMR 2015 MSGP reported data through February 2018.
NOTES: Orange lines denote the soft-water benchmark of 1.3 μg/L or eight times the benchmark and the purple lines denote the hard-water benchmark of 4.5 μg/L or eight times the benchmark. Benchmark compliance is assessed based on site-specific water quality data.
TABLE D-8
Statistical Summary and Benchmark Comparison of 2015 MSGP Reported Results for Cadmium
| No. Reported Results | No. Facilities | Min. (µg/L) | Max. (µg/L) | Median (µg/L) | 75th Percentile (µg/L) | Percent >BM | Percent >4× BM | Percent >8× BM | |
|---|---|---|---|---|---|---|---|---|---|
| C5 | 8 | 2 | 0.001 | 1 | 0.50 | 1 | 0 | 0 | 0 |
| G1 | 2 | 1 | 2 | 2 | 2 | 2 | 0 | 0 | 0 |
| G2 | 5 | 2 | 0.1 | 0.44 | 0.44 | 0.44 | 0 | 0 | 0 |
| K | 26 | 5 | 0.2 | 12 | 1 | 2 | 14a | 7 | 0 |
| N1 | 7 | 2 | 0.5 | 41 | 1 | 4.4 | NA | NA | NA |
| O | 2 | 1 | 5 | 5 | 5 | 5.0 | NA | NA | NA |
| P | 10 | 4 | 0.056 | 20 | 2 | 3.4 | 0 | 0 | 0 |
| T | 4 | 1 | 2 | 10 | 3.5 | 6.3 | 25a | 0 | 0 |
| AA1 | 3 | 1 | 0.00047 | 2.9 | 0.23 | 1.6 | 0 | 0 | 0 |
NOTES: NA, required monitoring for purpose other than MSGP benchmark compliance; no regulatory limit established for those sites. Fifteen reported results were excluded from the hardness analysis because no regulatory limit was established for these sites. In addition to the sectors noted with NA above, the following were excluded from the analysis (the number of data points in parentheses): G2(1), P(5).
a Includes one reported result with stated detection limit exceeding the benchmark.
Chemical Oxygen Demand (COD)
Figure D-6 highlights the NetDMR 2015 MSGP data for COD. Only Sector A2 (wood preserving) was unable to meet the COD benchmark of 120 mg/L for at least 50 percent of the reported results. The complete data set is summarized in Table D-9. Sectors A2, A4 (hardwood, sawmills), N1 (scrap recycling), and S (airports) reported 5 percent or more of data points in excess of four times the benchmark.
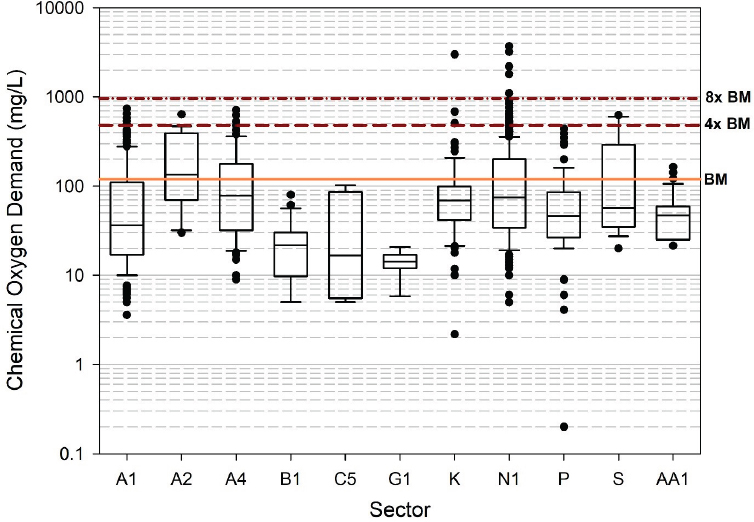
Chemical oxygen demand (COD) results from NetDMR 2015 MSGP reported data through February 2018.
NOTES: Orange line denotes benchmark of 120 mg/L. Dashed purple lines represent four and eight times the benchmark.
TABLE D-9
Statistical Summary and Benchmark Comparison of 2015 MSGP Reported Results for COD
| No. Reported Results | No. Facilities | Min. (mg/L) | Max. (mg/L) | Median (mg/L) | 75th Percentile (mg/L) | Percent >BM | Percent >4× BM | Percent >8× BM | |
|---|---|---|---|---|---|---|---|---|---|
| A1 | 220 | 28 | 3.6 | 740 | 37 | 109 | 21 | 2 | 0 |
| A2 | 19 | 1 | 30 | 640 | 135 | 337 | 58 | 5 | 0 |
| A4 | 66 | 9 | 9 | 711 | 79 | 176 | 36 | 5 | 0 |
| B1 | 22 | 1 | <5 | 80 | 22 | 29 | 0 | 0 | 0 |
| C5 | 8 | 2 | <5 | 103 | 17 | 66 | 0 | 0 | 0 |
| G1 | 8 | 1 | 5.8 | 21 | 14 | 16 | 0 | 0 | 0 |
| K | 88 | 8 | 2.2 | 3,000 | 69 | 99 | 19 | 3 | 1 |
| M | 6 | 2 | 22 | 150 | 78 | 122 | 33 | 0 | 0 |
| N1 | 303 | 52 | <5 | 3,700 | 75 | 198 | 36 | 7 | 2 |
| P | 66 | 6 | 0.2 | 440 | 46 | 85 | 15 | 0 | 0 |
| Q | 4 | 2 | 14 | 147 | 23 | 56 | 25 | 0 | 0 |
| S | 18 | 3 | 20 | 625 | 57 | 240 | 33 | 11 | 0 |
| AA1 | 36 | 2 | 22 | 164 | 47 | 59 | 8 | 0 | 0 |
NOTE: Eighteen reported results were not included because they did not have units.
Copper
Figure D-7 highlights the NetDMR 2015 MSGP data for copper. The copper benchmark value is determined by the hardness in the receiving water. For the graphs, two copper benchmark values are presented—one representing soft water (60 mg/L as CaCO3; 9 µg/L) and one representing hard water
(200 mg/L as CaCO3; 28.5 µg/L). Two reported results were deleted from the analysis because their reported values were several orders of magnitude below the expected detection limit for copper. Of the sectors that had at least eight reported results, many sectors (A2 [wood preserving], F2 [iron and steel foundries], F4 [nonferrous foundries], M [auto salvage], N1 [scrap recycling], Q [water transportation], R [ship building], AA1 [fabricated metal products]) were unable to meet the benchmark for at least 50 percent of the reported results. Most of these sectors (A2, F4, N1, Q, R, and AA1) also had a large percentage of reported results (at least 25 percent) exceeding eight times the benchmark, and many results were reported that were orders of magnitude higher than this level.
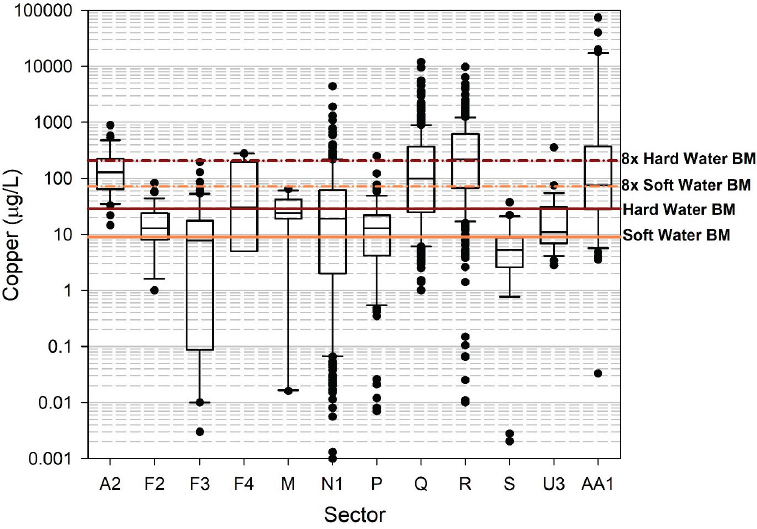
Copper results from NetDMR 2015 MSGP reported data through February 2018.
NOTES: Orange lines denote the soft-water benchmark of 1.3 μg/L or eight times the benchmark and the purple lines denote the hard-water benchmark of 4.5 μg/L or eight times the benchmark. Benchmark exceedance is assessed based on site-specific water quality data.
The figure and the descriptive statistics in Table D-10 include data collected for required monitoring that did not include hardness-specific benchmarks. Data
TABLE D-10
Statistical Summary and Benchmark Comparison of 2015 MSGP Reported Results for Copper
| No. Reported Results | No. Facilities | Min. (µg/L) | Max. (µg/L) | Median (µg/L) | 75th Percentile (µg/L) | Percent >BM | Percent >4× BM | Percent >8× BM | |
|---|---|---|---|---|---|---|---|---|---|
| A2 | 32 | 3 | 15 | 888 | 129 | 213 | 97 | 84 | 81 |
| A4 | 2 | 1 | 7 | 21 | 14 | 18 | NA | NA | NA |
| B2 | 2 | 1 | <2 | 8 | 5 | 6.5 | NA | NA | NA |
| C4 | 1 | 1 | 22 | 22 | 22 | 22 | NA | NA | NA |
| C5 | 6 | 3 | 6 | 57 | 18 | 22 | NA | NA | NA |
| E2 | 2 | 2 | 20 | 42 | 31 | 37 | NA | NA | NA |
| F2 | 35 | 4 | <1 | 83 | 13 | 22 | 63a | 9 | 0 |
| F3 | 100 | 9 | 0.003 | 195 | 7.8 | 17 | 40b | 22 | 14 |
| F4 | 10 | 2 | 5 | 279 | 31 | 169 | 70 | 60 | 50 |
| G1 | 2 | 1 | 24 | 67 | 45 | 56 | 50 | 0 | 0 |
| G2 | 4 | 2 | <3 | 9.5 | 6.2 | 9.5 | 25 | 0 | 0 |
| M | 11 | 2 | 0.016 | 64 | 24 | 36 | 82 | 9 | 0 |
| N1 | 330 | 49 | <0.001 | 4,380 | 19 | 62 | 62b | 37a | 26 |
| O | 4 | 1 | 18 | 86 | 30 | 52 | NA | NA | NA |
| P | 97 | 14 | 0.007 | 250 | 13 | 22 | 32c | 1 | 1 |
| Q | 415 | 60 | 1 | 12,000 | 100 | 360 | 86d | 73c | 61b |
| R | 335 | 38 | 0.01 | 796,000 | 219 | 615 | 96d | 90c | 81 |
| S | 22 | 1 | 0.0020 | 37 | 5.3 | 8.3 | 18 | 0 | 0 |
| U3 | 27 | 6 | 2.8 | 357 | 11 | 31 | NA | NA | NA |
| V | 2 | 1 | 18 | 28 | 23 | 26 | NA | NA | NA |
| Y2 | 1 | 1 | 17 | 17 | 17 | 17 | NA | NA | NA |
| AA1 | 93 | 5 | 0.033 | 74,000 | 76 | 370 | 82 | 60 | 46 |
| AC1 | 7 | 1 | 4 | 30 | 6 | 21.5 | NA | NA | NA |
NOTES: NA, required monitoring for purpose other than MSGP benchmark compliance; no regulatory limit established for those sites. Nine reported results were not included because they did not have units; 82 reported results were excluded from the hardness-based benchmark analysis because no regulatory limit was established for these sites. In addition to the sectors noted with NA above, the following were excluded from the benchmark analysis: A4(2), B2(2), C4(1), C5(6), E2(2), N1(1), O(4), P(24), Q(1), R(1), U3(27), V(2), Y2(1), AA1(1), and AC1(7).
a Includes one result with reported detection limit exceeding the benchmark.
b Includes two to four results with reported detection limit exceeding the benchmark.
c Includes nine results with reported detection limit exceeding the benchmark.
d Includes five to seven results with reported detection limit exceeding the benchmark.
entries without a hardness-specific benchmark were not included for the evaluation of the percentage of reported results that met benchmark thresholds.
Cyanide
Figure D-8 highlights the NetDMR 2015 MSGP data for cyanide. The sectors with sufficient reported results to graph were able to meet the cyanide benchmark of 22 µg/L for all but one of the reported results in the database (from Sector K, hazardous waste facility). The complete data set is summarized in Table D-11.
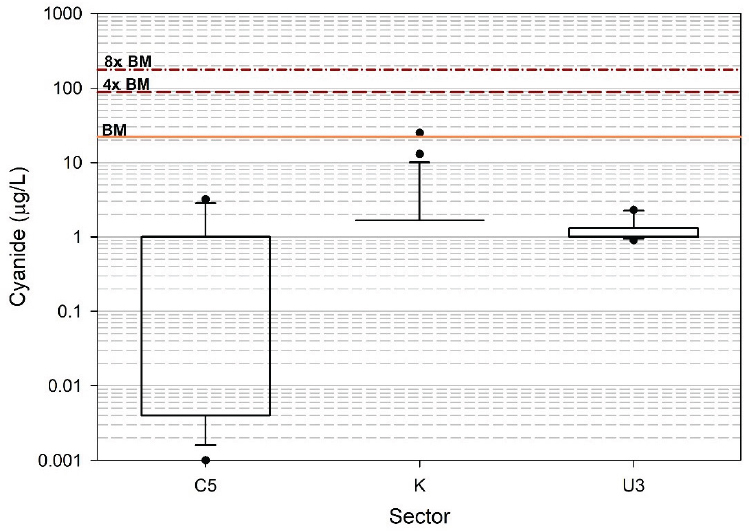
Cyanide results from NetDMR 2015 MSGP reported data through February 2018.
NOTES: Orange line denotes benchmark of 22 μg/L. Dashed purple lines represent four and eight times the benchmark.
TABLE D-11
Statistical Summary and Benchmark Comparison of 2015 MSGP Reported Results for Cyanide
| No. Reported Results | No. Facilities | Min. (µg/L) | Max. (µg/L) | Median (µg/L) | 75th Percentile (µg/L) | Percent >BM | Percent >4× BM | Percent >8× BM | |
|---|---|---|---|---|---|---|---|---|---|
| A4 | 1 | 1 | 1.9 | 1.9 | 1.9 | 1.9 | 0 | 0 | 0 |
| B2 | 2 | 1 | <1 | <1 | <1 | <1 | 0 | 0 | 0 |
| C3 | 4 | 1 | <0.8 | 2.1 | 1.4 | 2.0 | 0 | 0 | 0 |
| C5 | 11 | 3 | <0.001 | 3.2 | <1 | 1 | 0 | 0 | 0 |
| E2 | 2 | 2 | <1 | 2.4 | 1.7 | 2.1 | 0 | 0 | 0 |
| J1 | 2 | 2 | <2 | <2 | <2 | <2 | 0 | 0 | 0 |
| K | 61 | 4 | <0.00001 | 25 | 1.7 | 1.7 | 2 | 0 | 0 |
| P | 7 | 3 | 1 | 17 | 2.8 | 5.1 | 0 | 0 | 0 |
| Q | 1 | 1 | 1 | 1 | 1 | 1 | 0 | 0 | 0 |
| U3 | 14 | 6 | 0.9 | 2.3 | 1 | 1.3 | 0 | 0 | 0 |
| Y2 | 1 | 1 | 2.2 | 2.2 | 2.2 | 2.2 | 0 | 0 | 0 |
| AC | 4 | 2 | <1 | 1.6 | 1 | 1.2 | 0 | 0 | 0 |
Iron
Figure D-9 shows the NetDMR 2015 MSGP data for iron. For sectors with at least eight reported results, Sectors A1 (general sawmills), E2 (concrete and gypsum), E3 (glass and stone products), F2 (iron and steel foundries), H (coal mines), L2 (landfills, excluding municipal solid waste), N1 (scrap recycling), and P (motor freight transportation) exceeded the benchmark for ≥50 percent of the reported results. At least 10 percent of the reported results in Sectors C1 (agrochemicals), E2, H, L2, N1, Q (water transportation), and S (airports) exceeded eight times the benchmark. About 95 percent of the reported results from Sector H exceeded eight times the benchmark. The complete data set is summarized in Table D-12.
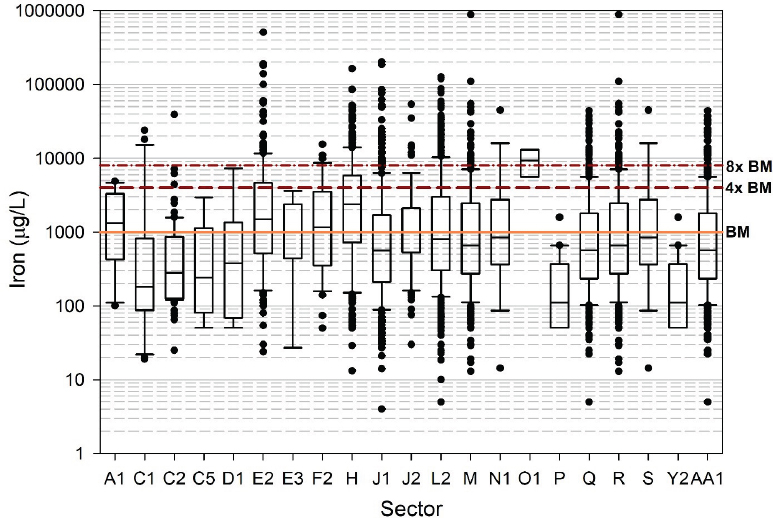
Iron results from NetDMR 2015 MSGP reported data through February 2018.
NOTES: Orange line denotes benchmark of 1,000 μg/L. Dashed purple lines represent four and eight times the benchmark.
TABLE D-12
Statistical Summary and Benchmark Comparison of 2015 MSGP Reported Results for Iron
| No. Reported Results | No. Facilities | Min. (µg/L) | Max. (µg/L) | Median (µg/L) | 75th Percentile (µg/L) | Percent >BM | Percent >4× BM | Percent >8× BM | |
|---|---|---|---|---|---|---|---|---|---|
| A1 | 12 | 1 | 100 | 4,880 | 1,320 | 2,398 | 58 | 17 | 0 |
| B2 | 1 | 1 | <50 | <50 | <50 | <50 | 0 | 0 | 0 |
| C1 | 23 | 2 | 19 | 24,000 | 181 | 752 | 17 | 17 | 13 |
| C2 | 84 | 5 | 25 | 39,100 | 280 | 776 | 21 | 5 | 1 |
| C5 | 14 | 2 | <50 | 2,940 | 240 | 750 | 21 | 0 | 0 |
| D1 | 9 | 3 | <50 | 7,290 | 380 | 1,220 | 33 | 11 | 0 |
| E2 | 228 | 46 | 24 | 510,000 | 1,500 | 4,613 | 59 | 28 | 17 |
| E3 | 8 | 2 | 27 | 3,600 | 994.5 | 1,700 | 50 | 0 | 0 |
| F2 | 34 | 4 | <50 | 15,400 | 1,165 | 2,950 | 53 | 24 | 9 |
| F3 | 4 | 1 | 370 | 1,010 | 695 | 1,003 | 25 | 0 | 0 |
| G1 | 1 | 1 | <100 | 100 | 100 | 100 | 0 | 0 | 0 |
| G2 | 4 | 2 | <1,000 | 1,270 | 1,135 | 1,270 | 50 | 0 | 0 |
| H | 22 | 3 | 5,980 | 604,000 | 34,650 | 113,650 | 100 | 100 | 95 |
| J1 | 9 | 2 | 190 | 540 | 280 | 340 | 0 | 0 | 0 |
| J2 | 35 | 7 | <50 | 9,100 | 250 | 905 | 20 | 11 | 3 |
| L2 | 120 | 14 | <50 | 92,000 | 1,300 | 3,493 | 59 | 22 | 17 |
| M | 196 | 39 | <13 | 34,000 | 400 | 1,000 | 24 | 4 | 2 |
| N1 | 329 | 53 | 13 | 164,000 | 2,360 | 5,800 | 69 | 31 | 18 |
| O1 | 420 | 34 | 4 | 203,000 | 564 | 1,700 | 33 | 15 | 9 |
| P | 89 | 9 | 30 | 54,100 | 1,010 | 2,110 | 52 | 11 | 9 |
| Q | 626 | 70 | 5 | 126,000 | 800 | 2,983 | 45 | 20 | 12 |
| R | 345 | 37 | 13 | 881,000 | 656 | 2,420 | 41 | 17 | 9 |
| S | 19 | 3 | 14 | 45,000 | 842 | 2,575 | 42 | 16 | 16 |
| U3 | 2 | 1 | 5,600 | 13,000 | 9,300 | 11,150 | 100 | 100 | 50 |
| Y1 | 4 | 1 | 620 | 1,800 | 880 | 1,200 | 25 | 0 | 0 |
| Y2 | 30 | 3 | <50 | 1,600 | 110 | 289 | 7 | 0 | 0 |
| AA1 | 430 | 35 | <5 | 44,100 | 566 | 1,795 | 37 | 14 | 6 |
NOTE: Twenty-four reported results were not included because they did not have units.
Lead
Figure D-10 highlights the NetDMR 2015 MSGP data for lead. The lead benchmark value is determined by the hardness in the receiving water. For the graphs, two lead benchmark values are presented—one representing soft water (60 mg/L as CaCO3; 45 µg/L) and one representing hard water (200 mg/L as CaCO3; 213 µg/L). Of the sectors that had at least eight reported results, Sector N1 (scrap recycling) had the largest percentage of benchmark exceedances (41 percent), with 7 percent exceeding eight times the benchmark, while Sector R (ship and boat building or repair years) had about 25 percent exceedances compared to the soft-water benchmark.
The figure and the descriptive statistics in Table D-13 include data collected for required monitoring that did not include hardness-specific benchmarks. Data entries without a hardness-specific benchmark were not included for the evaluation of the percentage of reported results that met benchmark thresholds.
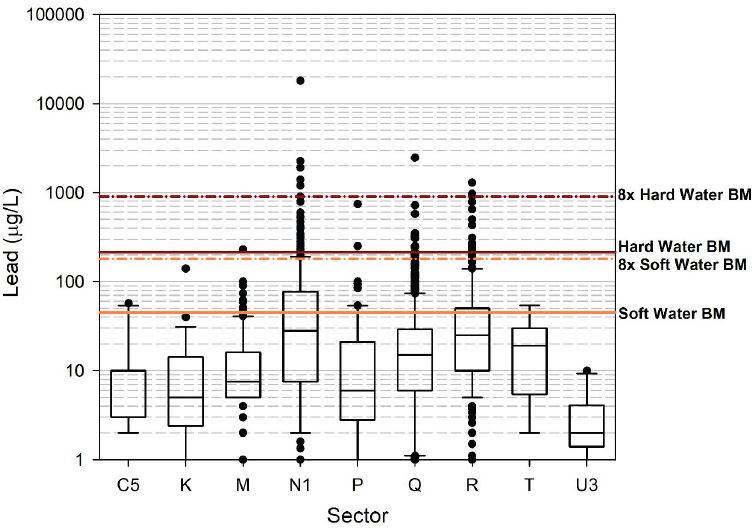
Lead results from NetDMR 2015 MSGP reported data through February 2018.
NOTES: Orange lines denote the soft-water benchmark of 45 μg/L or eight times the benchmark and the purple lines denote the hard-water benchmark of 213 μg/L or eight times the benchmark. Benchmark exceedance is assessed based on site-specific water quality data.
TABLE D-13
Statistical Summary and Benchmark Comparison of 2015 MSGP Reported Results for Lead
| No. Reported Results | No. Facilities | Min. (µg/L) | Max. (µg/L) | Median (µg/L) | 75th Percentile (µg/L) | Percent >BM | Percent >4× BM | Percent >8× BM | |
|---|---|---|---|---|---|---|---|---|---|
| C1 | 7 | 2 | <3 | 10 | <3 | <10 | 0 | 0 | 0 |
| C5 | 11 | 3 | <2 | 57 | <3 | 9 | 10 | 0 | 0 |
| D1 | 2 | 1 | <5 | <8 | <6.5 | <7.2 | NA | NA | NA |
| G1 | 2 | 1 | <7.5 | <7.5 | <7.5 | <7.5 | 0 | 0 | 0 |
| G2 | 5 | 2 | <4 | 44 | 44 | 44 | 0 | 0 | 0 |
| K | 28 | 5 | <0.5 | 140 | 5 | 13 | 7 | 0 | 0 |
| M | 172 | 39 | 0.75 | 230 | 7.5 | 16 | 6 | 1 | 1 |
| N1 | 311 | 51 | 0.6 | 18,000 | 28 | 77 | 41 | 16 | 7 |
| O | 2 | 1 | <10 | <10 | <10 | <10 | NA | NA | NA |
| P | 81 | 10 | 0.35 | 742 | 6 | 20 | 2 | 2 | 0 |
| Q | 410 | 57 | 0.08 | 2,467 | 15 | 29 | 4a | 0 | 0 |
| R | 276 | 35 | 0.5 | 1,300 | 25 | 50 | 8b | 1 | 0 |
| S | 6 | 1 | 0.22 | 3.5 | 0.47 | 2.0 | 0 | 0 | 0 |
| T | 9 | 2 | 2 | 54 | 19 | 29 | 0 | 0 | 0 |
| U3 | 16 | 4 | <0.5 | <10 | 2 | 4.0 | NA | NA | NA |
| AA1 | 6 | 1 | 0.37 | 3.6 | 1.5 | 2.9 | 0 | 0 | 0 |
| AC | 1 | 1 | 4 | 4 | 4 | 4 | NA | NA | NA |
NOTES: NA, required monitoring for purpose other than MSGP benchmark compliance; no regulatory limit established for those sites. Nine reported results were not included because they did not have units; 67 reported results were excluded from the hardness-based benchmark analysis because no regulatory limit was established for these sites. In addition to the sectors noted with NA above, the following were excluded from the benchmark analysis (the number of reported results in parentheses): C5(1), D1(2), G2(1), M(2), N1(8), O1(2), P(28), Q(1), T(5), U3(16), and AC1(1).
a Includes one result with reported detection limit exceeding the benchmark.
b Includes five results with reported detection limit exceeding the benchmark.
Magnesium
Figure D-11 shows the NetDMR 2015 MSGP data for magnesium. Only two sectors had at least eight reported results for graphical analysis. Half of the reported results in Sectors C5 (industrial organic chemicals) and all the reported results in Sector K (hazardous waste facilities) exceeded the benchmark of 64 µg/L. A large proportion of these reported results also exceeded eight times the benchmark. The complete data set is summarized in Table D-14. None of the reported results submitted in either Sectors P (motor freight transportation facilities) or AA1 (fabricated metal) were able to meet the magnesium benchmark.
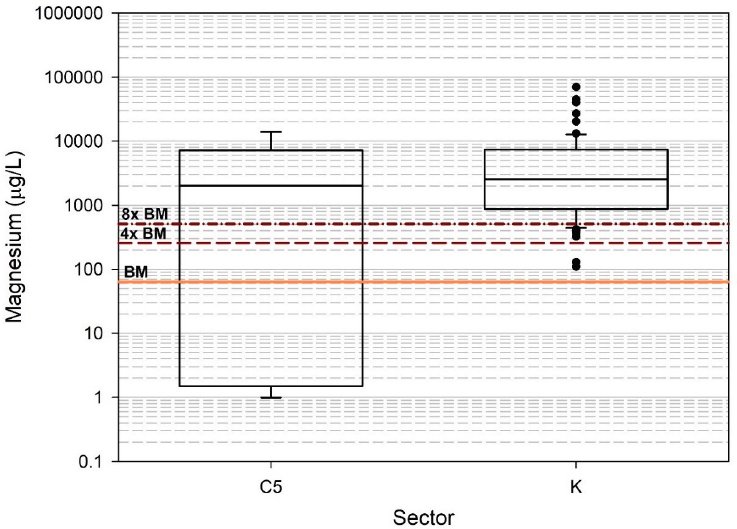
Magnesium results from NetDMR 2015 MSGP reported data through February 2018.
NOTES: Orange line denotes benchmark of 64 μg/L. Dashed purple lines represent four and eight times the benchmark.
TABLE D-14
Statistical Summary and Benchmark Comparison of 2015 MSGP Reported Results for Magnesium
| No. Reported Results | No. Facilities | Min. (µg/L) | Max. (µg/L) | Median (µg/L) | 75th Percentile (µg/L) | Percent >BM | Percent >4× BM | Percent >8× BM | |
|---|---|---|---|---|---|---|---|---|---|
| C5 | 8 | 2 | 0.99 | 13,900 | 2,031 | 7,168 | 50 | 50 | 50 |
| K | 95 | 8 | 110 | 70,000 | 2,520 | 7,295 | 100a | 98a | 83a |
| P | 5 | 1 | 300 | 16,000 | 2,600 | 11,000 | 100 | 100 | 80 |
| AA1 | 3 | 1 | 505 | 1,590 | 1,410 | 1,500 | 100 | 100 | 67 |
a Includes two results with reported detection limit exceeding the benchmark (and eight times the benchmark).
Mercury
Figure D-12 shows the NetDMR 2015 MSGP data for mercury. For sectors with at least eight reported results, Sectors K (hazardous waste facilities) and U3 (food and beverage production) each exceeded the benchmark of 1.4 µg/L in only one reported result. The plot for Sector U3 was skewed by a single result that was >1,000 µg/L, three orders of magnitude greater than other results in the database. One potential explanation for this is that the result was in micrograms per liter and was reported in milligrams per liter and was converted for these purposes to micrograms per liter by multiplying by 1,000. Because the analytical result is possible, although highly unlikely, it was retained in the analysis. The complete data set is summarized in Table D-15.
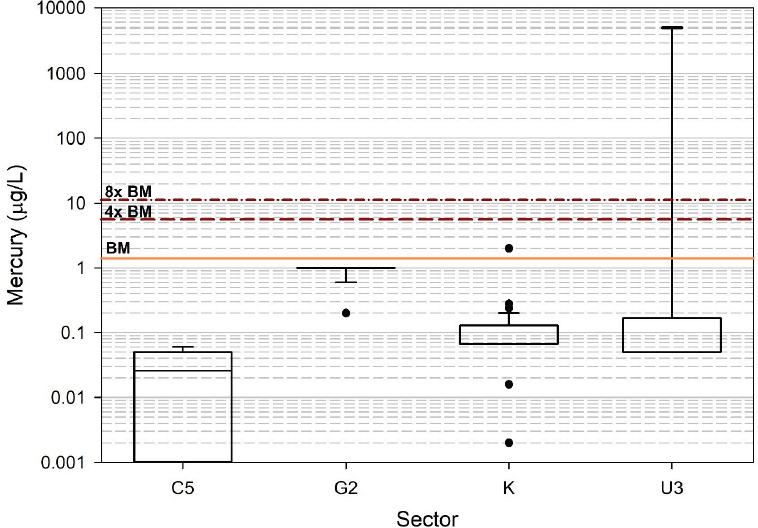
Mercury results from NetDMR 2015 MSGP reported data through February 2018.
NOTES: Orange line denotes benchmark of 1.4 μg/L. Dashed purple lines represent four and eight times the benchmark.
TABLE D-15
Statistical Summary and Benchmark Comparison of 2015 MSGP Reported Results for Mercury
| No. Reported Results | No. Facilities | Min. (µg/L) | Max. (µg/L) | Median (µg/L) | 75th Percentile (µg/L) | Percent >BM | Percent >4× BM | Percent >8× BM | |
|---|---|---|---|---|---|---|---|---|---|
| C3 | 4 | 1 | <0.2 | <4 | <0.3 | <1.3 | 25a | 0 | 0 |
| C5 | 8 | 2 | <0.00001 | 0.06 | <0.026 | <0.05 | 0 | 0 | 0 |
| G1 | 4 | 1 | <0.2 | <0.2 | <0.2 | <0.2 | 0 | 0 | 0 |
| G2 | 24 | 3 | <0.2 | 1 | <1 | <1 | 0 | 0 | 0 |
| K | 90 | 8 | <0.002 | <2 | <0.067 | 0.12 | 1a | 0 | 0 |
| N1 | 5 | 3 | <0.1 | 0.2 | <0.2 | <0.2 | 0 | 0 | 0 |
| P | 4 | 1 | 0.027 | 0.062 | 0.044 | 0.049 | 0 | 0 | 0 |
| Q | 4 | 1 | 0.06 | 0.29 | 0.095 | 0.17 | 0 | 0 | 0 |
| R | 5 | 1 | <0.1 | <0.15 | <0.1 | <0.1 | 0 | 0 | 0 |
| U3 | 8 | 3 | <0.05 | 5000 | <0.05 | 0.10 | 13 | 13 | 13 |
NOTE: One result was not included because the sector/subsector could not be identified.
a Includes one result with reported detection limit exceeding the benchmark.
Nickel
The NetDMR 2015 MSGP data for nickel are summarized in Table D-16. No sector had at least eight reported results for graphical analysis. Those facilities with hardness-specific benchmarks identified all met the benchmarks. Even for the data entries that lacked hardness-specific limits, all the reported results submitted met both the soft-water benchmark of 320 µg/L and the hard-water benchmark of 890 µg/L.
TABLE D-16
Statistical Summary and Benchmark Comparison of 2015 MSGP Reported Results for Nickel
| No. Reported Results | No. Facilities | Min. (µg/L) | Max. (µg/L) | Median (µg/L) | 75th Percentile (µg/L) | Percent >BM | Percent >4× BM | Percent >8× BM | |
|---|---|---|---|---|---|---|---|---|---|
| G1 | 1 | 1 | <10 | <10 | <10 | <10 | 0 | 0 | 0 |
| G2 | 4 | 2 | <10 | <10 | <10 | <10 | 0 | 0 | 0 |
| N1 | 1 | 1 | 13 | 13 | 13 | 13 | NA | NA | NA |
| O1 | 2 | 1 | <25 | <25 | <25 | <25 | NA | NA | NA |
| P | 5 | 3 | <25 | <250 | <25 | <250 | NA | NA | NA |
NOTES: NA, required monitoring for purpose other than MSGP benchmark compliance; no regulatory limit established for those sites. These eight reported results were excluded from the benchmark analysis.
Nitrite Plus Nitrate
Figure D-13 shows the NetDMR 2015 MSGP data for nitrite plus nitrate. For sectors with at least eight reported results, only Sector C1 (agricultural chemicals) exceeded the benchmark of 0.68 mg/L in more than 50 percent of the reported results, although Sectors C1, J2 (crushed stone), and AA2 (fabricated metal coating) exceeded four times the benchmark in at least 10 percent of the reported results. The complete data set is summarized in Table D-17.
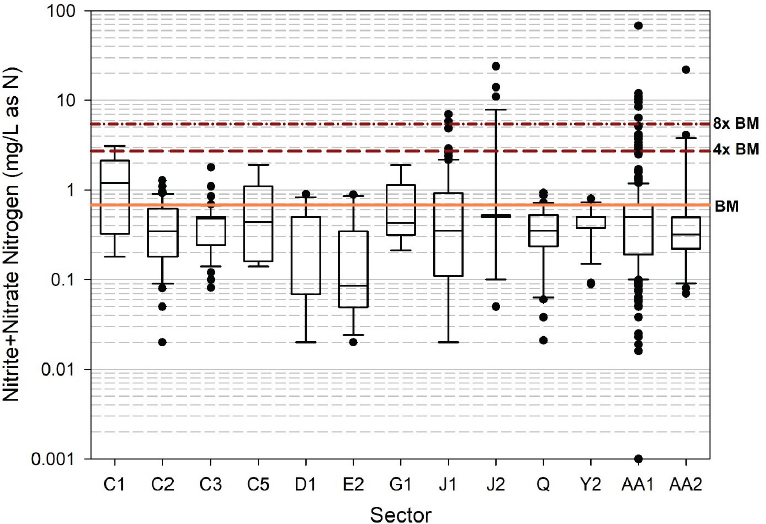
Nitrite plus nitrate nitrogen results from NetDMR 2015 MSGP reported data through February 2018.
NOTES: Orange line denotes benchmark of 0.68 mg/L. Dashed purple lines represent four and eight times the benchmark.
TABLE D-17
Statistical Summary and Benchmark Comparison of 2015 MSGP Reported Results for Nitrite Plus Nitrate Nitrogen
| No. Reported Results | No. Facilities | Min. (µg/L) | Max. (µg/L) | Median (µg/L) | 75th Percentile (µg/L) | Percent >BM | Percent >4× BM | Percent >8× BM | |
|---|---|---|---|---|---|---|---|---|---|
| C1 | 8 | 1 | 0.18 | 3.1 | 1.2 | 2.0 | 63 | 13 | 0 |
| C2 | 62 | 3 | <0.02 | 1.3 | 0.35 | 0.60 | 16 | 0 | 0 |
| C3 | 42 | 3 | 0.081 | 1.8 | 0.48 | 0.5 | 10 | 0 | 0 |
| C5 | 15 | 2 | 0.14 | 1.9 | 0.44 | 0.90 | 33 | 0 | 0 |
| D1 | 11 | 4 | 0.02 | 0.9 | 0.5 | 0.5 | 9 | 0 | 0 |
| E2 | 13 | 4 | <0.02 | 0.89 | 0.09 | 0.16 | 15 | 0 | 0 |
| F2 | 4 | 1 | 0.14 | 0.46 | 0.29 | 0.39 | 0 | 0 | 0 |
| F3 | 4 | 1 | <0.2 | 0.97 | 0.47 | 0.64 | 25 | 0 | 0 |
| G1 | 8 | 1 | 0.21 | 1.9 | 0.43 | 0.88 | 38 | 0 | 0 |
| J1 | 99 | 25 | <0.02 | 7 | 0.35 | 0.89 | 29 | 4 | 2 |
| J2 | 38 | 5 | <0.05 | 24 | <0.5 | <0.5 | 21 | 13 | 11 |
| P | 3 | 2 | <0.1 | 0.48 | 0.17 | 0.33 | 0 | 0 | 0 |
| Q | 31 | 2 | 0.021 | 0.94 | 0.35 | 0.52 | 13 | 0 | 0 |
| Y2 | 26 | 2 | 0.089 | 0.8 | 0.5 | 0.5 | 12 | 0 | 0 |
| AA1 | 357 | 30 | <0.001 | <68 | 0.5 | 0.68 | 21a | 6b | 2b |
| AA2 | 20 | 4 | 0.07 | 22 | 0.32 | 0.49 | 20 | 10 | 5 |
a Includes seven results with reported detection limit exceeding the benchmark.
b Includes one result with reported detection limit exceeding four and eight times the benchmark.
pH
Figure D-14 shows the NetDMR 2015 MSGP data for pH. The pH benchmark is set based on maintaining an optimum range for water quality between pH 6 and 9. The complete data set is summarized in Table D-18, including the last column which sums the percentage of reported results in each sector that were below pH of 6.0 or above pH of 9.0. Sectors with at least eight reported results where ≥10 percent of the data were outside the pH benchmark range were G1 (copper mining), L1 (landfills), and AB (transportation equipment).
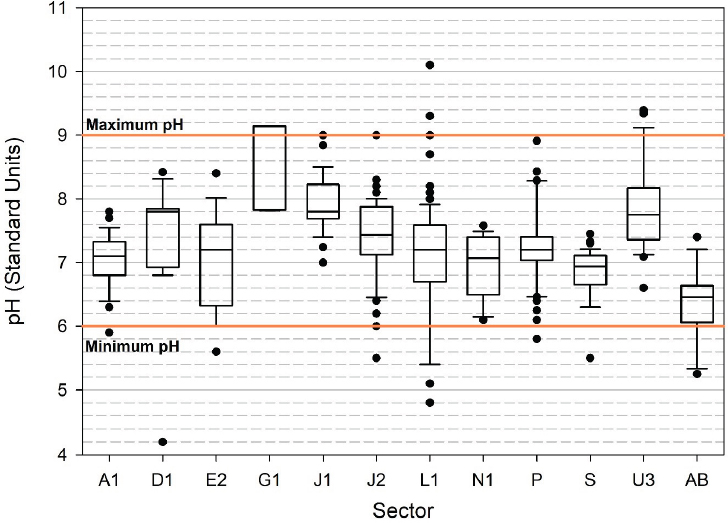
pH results from NetDMR 2015 MSGP reported data through February 2018.
NOTE: Orange lines denote minimum and maximum of optimal pH range of 6.0–9.0.
TABLE D-18
Statistical Summary and Benchmark Comparison of 2015 MSGP Reported Results for pH
| No. Reported Results | No. Facilities | Min. | Max. | Median | 75th Percentile | Percent <6 | Percent >9 | Percent Outside BM Range | |
|---|---|---|---|---|---|---|---|---|---|
| A1 | 78 | 6 | 5.9 | 7.8 | 7.1 | 7.3 | 4 | 0 | 4 |
| A3 | 2 | 1 | 6.4 | 6.8 | 6.6 | 6.7 | 0 | 0 | 0 |
| D1 | 21 | 8 | 4.2 | 8.4 | 7.8 | 7.8 | 5 | 0 | 5 |
| E2 | 24 | 6 | 5.6 | 8.4 | 7.2 | 7.6 | 4 | 0 | 4 |
| E3 | 1 | 1 | 7.8 | 7.8 | 7.8 | 7.8 | 0 | 0 | 0 |
| F3 | 2 | 1 | 7.1 | 7.3 | 7.2 | 7.3 | 0 | 0 | 0 |
| G1 | 10 | 1 | 7.8 | 9.1 | 7.8 | 9.1 | 0 | 40 | 40 |
| G2 | 6 | 2 | 7.1 | 7.4 | 7.2 | 7.4 | 0 | 0 | 0 |
| J1 | 44 | 8 | 7.0 | <9 | 7.8 | 8.2 | 0 | 0 | 0 |
| J2 | 104 | 20 | 5.5 | <9 | 7.4 | 7.8 | 2 | 0 | 2 |
| L1 | 118 | 14 | 1.6 | 10.1 | 7.2 | 7.6 | 10 | 2 | 12 |
| L2 | 1 | 1 | 7.5 | 7.5 | 7.5 | 7.5 | 0 | 0 | 0 |
| N1 | 14 | 6 | 6.1 | 7.6 | 7.1 | 7.4 | 0 | 0 | 0 |
| O | 4 | 1 | 6.8 | 7.2 | 7.0 | 7.2 | 0 | 0 | 0 |
| P | 57 | 10 | 5.8 | 8.9 | 7.2 | 7.4 | 2 | 0 | 2 |
| Q | 2 | 2 | 0.9 | 9.2 | 5.1 | 7.1 | 50 | 50 | 100 |
| S | 38 | 4 | 5.5 | 7.5 | 6.9 | 7.1 | 5 | 0 | 5 |
| U3 | 22 | 7 | 6.6 | 9.4 | 7.8 | 8.1 | 0 | 9 | 9 |
| V | 4 | 2 | 5.9 | 6.7 | 6.3 | 6.5 | 25 | 0 | 25 |
| Y2 | 7 | 2 | 6.4 | 8.1 | 7.7 | 7.9 | 0 | 0 | 0 |
| AA1 | 2 | 1 | 8.3 | 8.9 | 8.6 | 8.7 | 0 | 0 | 0 |
| AB | 12 | 2 | 5.3 | 7.4 | 6.5 | 6.6 | 17 | 0 | 17 |
NOTE: Twenty-four reported results were not included because they did not have units or the sector/subsector could not be identified (6 reported results without units; 18 without sector/subsector information).
Phosphorus
Figure D-15 shows the NetDMR 2015 MSGP data for total phosphorus. For sectors with at least eight reported results, only Sector C1 (agricultural chemicals) exceeded the benchmark of 2 mg/L in ≥10 percent of the reported results. Sector U3 seemed to have a sample that was an anomaly at 187 mg/L. No other reported result in that sector exceeded 10 mg/L. However, because no information was available to indicate that this was an incorrect entry, the reported result was retained in the analysis. The complete data set is summarized in Table D-19.
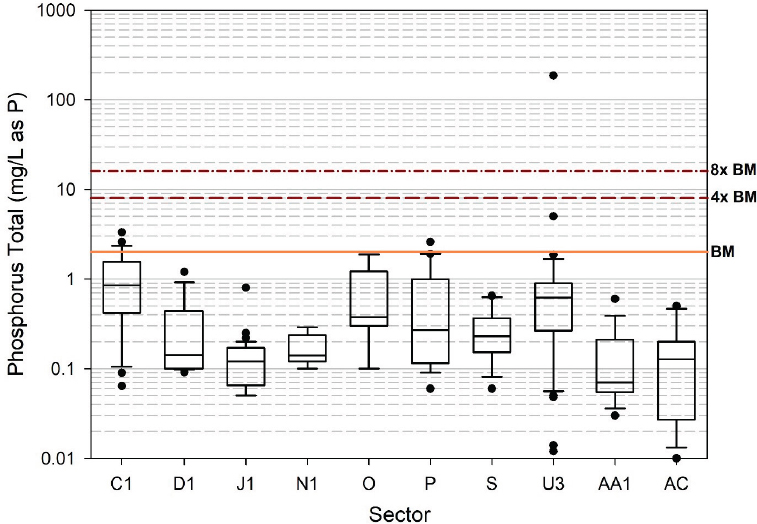
Total phosphorus results from NetDMR 2015 MSGP reported data through February 2018.
NOTES: Orange line denotes benchmark of 2 mg/L. Dashed purple lines represent four and eight times the benchmark.
TABLE D-19
Statistical Summary and Benchmark Comparison of 2015 MSGP Reported Results for Total Phosphorus
| No. Reported Results | No. Facilities | Min. (mg/L) | Max. (mg/L) | Median (mg/L) | 75th Percentile (mg/L) | Percent >BM | Percent >4× BM | Percent >8× BM | |
|---|---|---|---|---|---|---|---|---|---|
| A4 | 7 | 2 | 0.027 | 0.77 | 0.25 | 0.28 | 0 | 0 | 0 |
| C1 | 24 | 2 | 0.064 | 3.3 | 0.85 | 1.4 | 13 | 0 | 0 |
| C5 | 6 | 2 | 0.037 | 0.69 | 0.13 | 0.17 | 0 | 0 | 0 |
| D1 | 16 | 5 | 0.091 | 1.2 | 0.14 | 0.38 | 0 | 0 | 0 |
| E2 | 2 | 2 | <0.05 | 1.2 | 0.64 | 0.94 | 0 | 0 | 0 |
| J1 | 45 | 9 | <0.05 | 0.8 | 0.12 | 0.17 | 0 | 0 | 0 |
| J2 | 2 | 2 | <0.05 | 0.29 | 0.17 | 0.23 | 0 | 0 | 0 |
| N1 | 9 | 3 | <0.1 | 0.29 | 0.14 | 0.22 | 0 | 0 | 0 |
| O1 | 12 | 2 | <0.1 | 1.9 | 0.38 | 1.2 | 0 | 0 | 0 |
| P | 25 | 8 | 0.06 | 2.6 | 0.27 | 0.92 | 4 | 0 | 0 |
| S | 16 | 5 | 0.06 | 0.65 | 0.23 | 0.36 | 0 | 0 | 0 |
| T | 6 | 1 | 0.07 | 2.6 | 0.33 | 0.42 | 17 | 0 | 0 |
| U1 | 4 | 1 | 1.1 | 7.9 | 5.9 | 7.9 | 75 | 0 | 0 |
| U3 | 42 | 8 | 0.012 | 187 | 0.62 | 0.89 | 7 | 2 | 2 |
| AA1 | 15 | 2 | 0.03 | 0.6 | 0.07 | 0.19 | 0 | 0 | 0 |
| AC | 11 | 4 | <0.01 | 0.5 | 0.13 | 0.20 | 0 | 0 | 0 |
NOTE: Two reported results were not included because they did not have subsector/sector information.
Selenium
Figure D-16 shows the NetDMR 2015 MSGP data for selenium for sectors with at least eight reported results. Overall, high reported detection levels make the data more difficult to interpret. Only a few results (7 out of 87) across all sectors were reported that were above the benchmark (5 µg/L) that were not assigned a “less than” descriptor. All reported results for C5 were below the stated detection limit, although some of these detection limits were above the benchmark. The complete data set is summarized in Table D-20.
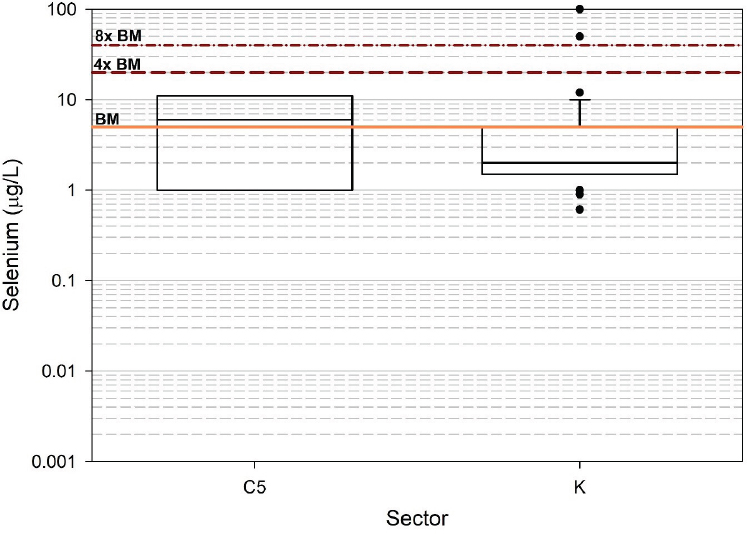
Selenium results from NetDMR 2015 MSGP reported data through February 2018.
NOTES: Orange line denotes benchmark of 5 μg/L. Dashed purple lines represent four and eight times the benchmark.
TABLE D-20
Statistical Summary and Benchmark Comparison of 2015 MSGP Reported Results for Selenium
| No. Reported Results | No. Facilities | Min. (µg/L) | Max. (µg/L) | Median (µg/L) | 75th Percentile (µg/L) | Percent >BM | Percent >4× BM | Percent >8× BM | |
|---|---|---|---|---|---|---|---|---|---|
| A2 | 3 | 1 | 10 | 10 | 10 | 10 | 100 | 0 | 0 |
| C5 | 8 | 2 | <1 | <11 | <6 | <11 | 50a | 0 | 0 |
| G2 | 4 | 2 | <0.003 | <5 | 4 | 5 | 0 | 0 | 0 |
| J3 | 8 | 2 | <0.5 | 6 | <1 | <2.2 | 25 | 0 | 0 |
| K | 60 | 6 | 0.61 | 100 | <2 | <5 | 18b | 3 | 3 |
| Q | 1 | 1 | <3 | <3 | <3 | <3 | 0 | 0 | 0 |
| T1 | 1 | 1 | <6.1 | <6.1 | <6.1 | <6.1 | 100a | 0 | 0 |
| U3 | 2 | 2 | 2 | <3 | 2.5 | 2.8 | 0 | 0 | 0 |
a All exceedances were for results that had reported detection limits above the benchmark of 5 μg/L.
b Includes nine results with reported detection limit exceeding the benchmark.
Silver
Figure D-17 highlights the NetDMR 2015 MSGP data for silver. The benchmark value for silver is determined by the hardness in the receiving water. For the graphs, two silver benchmark values are presented—one representing soft water (60 mg/L as CaCO3; 1.7 µg/L) and one representing hard water (200 mg/L as CaCO3; 13.8 µg/L). All reported results noted as exceeding the benchmark also were reported as “less than” a detection level that was above the benchmark (see Table D-21).
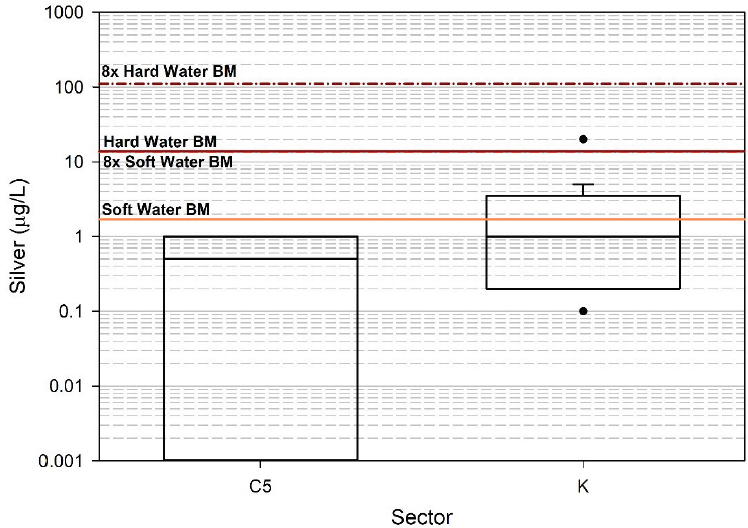
Silver results from NetDMR 2015 MSGP reported data through February 2018.
NOTES: Orange lines denote the soft-water benchmark of 1.7 μg/L or eight times the benchmark and the purple lines denote the hard-water benchmark of 13.8 μg/L or eight times the benchmark. Benchmark exceedance is assessed based on site-specific water quality data.
TABLE D-21
Statistical Summary and Benchmark Comparison of 2015 MSGP Reported Results for Silver
| No. Reported Results | No. Facilities | Min. (µg/L) | Max. (µg/L) | Median (µg/L) | 75th Percentile (µg/L) | Percent >BM | Percent >4× BM | Percent >8× BM | |
|---|---|---|---|---|---|---|---|---|---|
| C5 | 8 | 2 | <0.001 | 1 | 0.50 | 1 | 0 | 0 | 0 |
| G1 | 1 | 1 | <0.1 | <0.1 | <0.1 | <0.1 | 0 | 0 | 0 |
| G2 | 4 | 2 | 0.17 | <0.3 | 0.24 | <0.3 | 0 | 0 | 0 |
| K | 26 | 5 | 0.1 | <20 | <1 | 2.7 | 12a | 4b | 0 |
| P | 5 | 1 | 0.02 | 0.52 | 0.15 | 0.32 | 0 | 0 | 0 |
| T | 4 | 1 | <5 | <25 | <9 | <16 | 25b | 0 | 0 |
a Includes three results with reported detection limit exceeding the benchmark.
b Includes one result with reported detection limit exceeding the benchmark.
Total Suspended Solids (TSS)
Figure D-18 highlights the NetDMR 2015 MSGP data for total suspended solids compared to the benchmark of 100 mg/L. Considering sectors with at least eight reported results, at least 60 percent of reported results in Sectors A2 (wood preserving), E3 (glass and stone products), and H (coal mines) exceeded the benchmark, and more than 10 percent of the reported results in Sectors A2 and H exceeded eight times the benchmark. The complete data set is summarized in Table D-22.
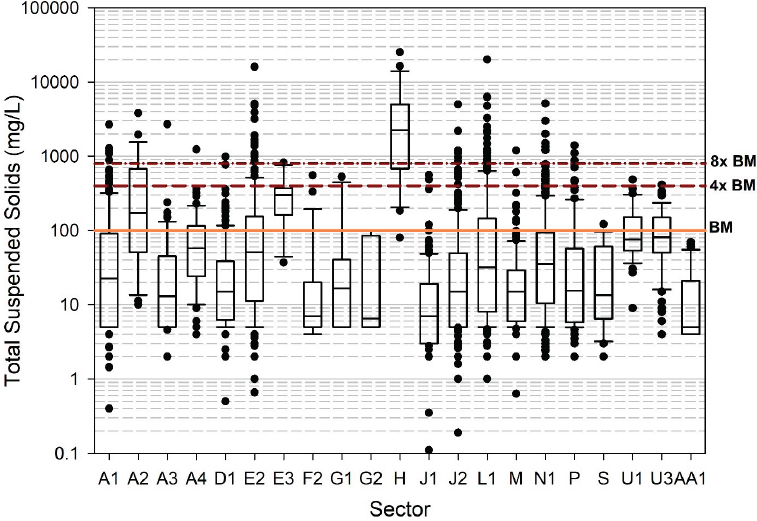
Total suspended solids results from NetDMR 2015 MSGP reported data through February 2018.
NOTES: Orange line denotes the benchmark of 100 mg/L. Dashed purple lines represent four and eight times the benchmark.
TABLE D-22
Statistical Summary and Benchmark Comparison of 2015 MSGP Reported Results for Total Suspended Solids
| No. Reported Results | No. Facilities | Min. (mg/L) | Max. (mg/L) | Median (mg/L) | 75th Percentile (mg/L) | Percent >BM | Percent >4× BM | Percent >8× BM | |
|---|---|---|---|---|---|---|---|---|---|
| A1 | 374 | 28 | 0.4 | 2,680 | 23 | 90 | 22 | 7 | 3 |
| A2 | 24 | 2 | 10 | 3,810 | 172 | 550 | 63 | 21 | 13 |
| A3 | 53 | 10 | <2 | 2,700 | 13 | 45 | 11 | 2 | 2 |
| A4 | 74 | 9 | <4 | 1,240 | 58 | 108 | 27 | 3 | 3 |
| B2 | 4 | 1 | 6.4 | 63 | 23 | 44 | 0 | 0 | 0 |
| D1 | 150 | 27 | 0.5 | 988 | 15 | 36 | 11 | 1 | 1 |
| E2 | 269 | 46 | 0.66 | 16,000 | 51 | 150 | 35 | 14 | 7 |
| E3 | 11 | 2 | 37 | 820 | 300 | 340 | 82 | 9 | 0 |
| F2 | 27 | 4 | 4 | 553 | 7 | 19 | 11 | 4 | 0 |
| G1 | 12 | 1 | <5 | 529 | 17 | 36 | 17 | 8 | 0 |
| G2 | 8 | 3 | <5 | 100 | 6.5 | 54 | 0 | 0 | 0 |
| H | 22 | 3 | 80 | 25,200 | 2,250 | 4,730 | 95 | 77 | 55 |
| J1 | 211 | 28 | 0.11 | 558 | 7 | 19 | 4 | 2 | 0 |
| J2 | 428 | 35 | 0.19 | 5,000 | 15 | 49 | 14 | 6 | 3 |
| L1 | 461 | 31 | 1 | 20,000 | 32 | 145 | 30 | 14 | 8 |
| L2 | 1 | 1 | 1,510 | 1,510 | 1,510 | 1,510 | 100 | 0 | 0 |
| M | 185 | 39 | 0.63 | 1,200 | 15 | 29 | 6 | 1 | 1 |
| N1 | 305 | 52 | <2 | 5,140 | 35 | 93 | 24 | 7 | 2 |
| O | 6 | 2 | <5 | 30 | 6 | 11 | 0 | 0 | 0 |
| P | 138 | 12 | <2 | 1,400 | 16 | 54 | 18 | 7 | 3 |
| Q | 4 | 2 | 1.5 | 28 | 5.6 | 13 | 0 | 0 | 0 |
| R | 5 | 1 | <1 | 4.8 | 2.6 | 2.9 | 0 | 0 | 0 |
| S | 20 | 5 | <2 | 122 | 1.5 | 42 | 5 | 0 | 0 |
| T | 3 | 2 | 20 | 57 | 55 | 56 | 0 | 0 | 0 |
| U1 | 37 | 7 | 9 | 486 | 76 | 149 | 38 | 3 | 0 |
| U3 | 123 | 7 | 4 | 415 | 81 | 150 | 43 | 1 | 0 |
| Y2 | 1 | 1 | 11 | 11 | 11 | 11 | 0 | 0 | 0 |
| AA1 | 64 | 1 | <4 | 70 | 5 | 19 | 0 | 0 | 0 |
| AB1 | 3 | 1 | 5 | 30 | 7 | 19 | 0 | 0 | 0 |
| AC1 | 6 | 2 | <5 | 20 | 5.5 | 15 | 0 | 0 | 0 |
NOTE: Twenty reported results were not included because they did not have units or the sector/subsector could not be identified (19 results without units; 1 result without sector/subsector information).
Turbidity
Figure D-19 highlights the NetDMR 2015 MSGP data for turbidity compared to the benchmark of 50 nephelometric turbidity units (NTU). Of the sectors with at least eight reported results, only D1 (asphalt paving) exceeded the benchmark in more than 25 percent of the reported results. The complete data set is summarized in Table D-23.
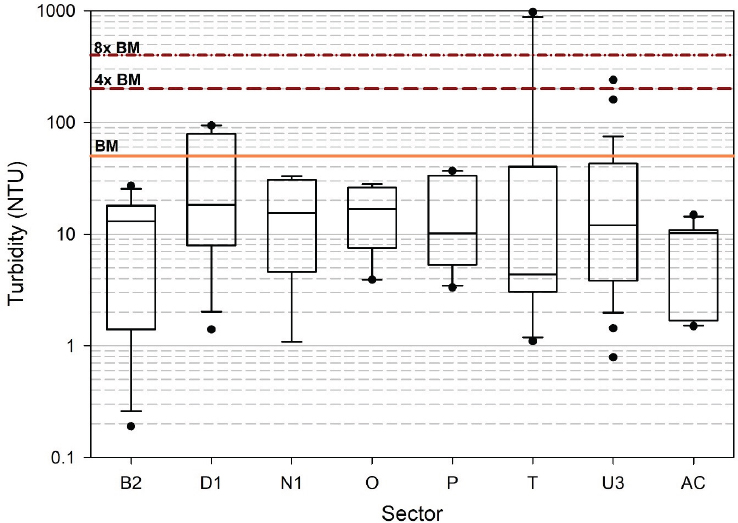
Turbidity results from NetDMR 2015 MSGP reported data through February 2018.
NOTES: Orange line denotes the benchmark of 50 NTU. Dashed purple lines represent four and eight times the benchmark.
TABLE D-23
Statistical Summary and Benchmark Comparison of 2015 MSGP Reported Results for Turbidity
| No. Reported Results | No. Facilities | Min. (NTU) | Max. (NTU) | Median (NTU) | 75th Percentile (NTU) | Percent >BM | Percent >4× BM | Percent >8× BM | |
|---|---|---|---|---|---|---|---|---|---|
| A2 | 3 | 1 | 9.4 | 27 | 11 | 19 | 0 | 0 | 0 |
| A3 | 2 | 1 | 7.1 | 28 | 18 | 23 | 0 | 0 | 0 |
| A4 | 4 | 1 | 0.39 | 77 | 13 | 32 | 25 | 0 | 0 |
| B2 | 11 | 4 | 0.19 | 27 | 13 | 17 | 0 | 0 | 0 |
| C5 | 5 | 2 | 4.3 | 17 | 4.9 | 11 | 0 | 0 | 0 |
| D1 | 10 | 2 | 1.4 | 94 | 18 | 70 | 40 | 0 | 0 |
| E2 | 4 | 3 | <4 | 236 | 27 | 96 | 25 | 25 | 0 |
| G1 | 1 | 1 | 12 | 12 | 12 | 12 | 0 | 0 | 0 |
| G2 | 3 | 2 | 30 | 50 | 50 | 50 | 0 | 0 | 0 |
| J2 | 2 | 1 | 2.2 | 2.3 | 2.3 | 2.3 | 0 | 0 | 0 |
| J3 | 1 | 1 | 11 | 11 | 11 | 11 | 0 | 0 | 0 |
| M | 1 | 1 | 0.71 | 0.71 | 0.71 | 0.71 | 0 | 0 | 0 |
| N1 | 8 | 3 | 1.1 | 33 | 16 | 28 | 0 | 0 | 0 |
| O | 12 | 2 | 3.9 | 28 | 17 | 26 | 0 | 0 | 0 |
| P | 10 | 5 | 3.3 | 37 | 10 | 32 | 0 | 0 | 0 |
| Q | 6 | 3 | 0.9 | 36 | 2 | 3.1 | 0 | 0 | 0 |
| S | 6 | 2 | 2.1 | 110 | 5.0 | 15 | 17 | 0 | 0 |
| T | 10 | 2 | 1.1 | 970 | 4.4 | 27 | 20 | 10 | 10 |
| U3 | 29 | 8 | 0.79 | 240 | 12 | 42 | 17 | 3 | 0 |
| AA1 | 4 | 2 | 0.83 | 12 | 7.1 | 11 | 0 | 0 | 0 |
| AC | 11 | 3 | 1.5 | 15 | 10 | 42 | 0 | 0 | 0 |
Zinc
Figure D-20 highlights the NetDMR 2015 MSGP data for zinc. Zinc’s benchmark value is determined by the hardness in the receiving water. For the graphs, two zinc benchmark values are presented—one representing soft water (60 mg/L as CaCO3; 80 µg/L) and one representing hard water (200 mg/L as CaCO3; 230 µg/L). Reviewing the data set, several reported results may be outliers because their reported values are below the detection limits of most common methods of analysis. This is likely a transcription error. However, because these values were within the limit of detection of research instruments, the reported results were retained in the analysis. There also were two results that were reported as ≥10,000 µg/L (10 mg/L). The result in Sector F3 does not appear to be outside the range reported for other data. However, for Sector Q, the reported result is more than 10 times greater than the other data. Again, there was insufficient information to remove these from the analysis, so they were retained. Of the sectors with at least eight reported results, in Sectors C1 (agrochemicals), C4 (plastics), F1 (steel works), F2 (iron and steel foundries), F3 (rolling, drawing, and extruding of nonferrous metals), N1 (scrap recycling), Q (water transportation), Y1 (rubber products), AA1 (fabricated metal), and AA2 (fabricated metal coating), the reported values exceeded the hardness-specific benchmark for at least 50 percent of the reported results, and at least 10 percent of the reported results in Sectors C1, C4, F3, F4 (nonferrous foundries), N1, and Y1 exceeded eight times the benchmark. The complete data set is summarized in Table D-24.
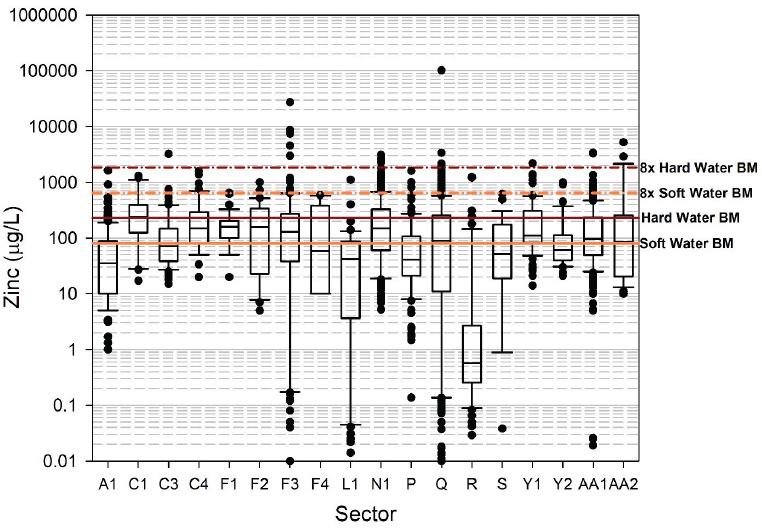
Zinc results from NetDMR 2015 MSGP reported data through February 2018.
NOTES: Orange lines denote the soft-water benchmark of 80 μg/L or eight times the benchmark and the purple lines denote the hard-water benchmark of 230 μg/L or eight times the benchmark. Benchmark compliance is assessed based on site-specific water quality data.
TABLE D-24
Statistical Summary and Benchmark Comparison of 2015 MSGP Reported Results for Zinc
| No. Reported Results | No. Facilities | Min. (µg/L) | Max. (µg/L) | Median (µg/L) | 75th Percentile (µg/L) | Percent >BM | Percent >4× BM | Percent >8× BM | |
|---|---|---|---|---|---|---|---|---|---|
| A1 | 210 | 28 | 1 | 1,630 | 36 | 87 | 35 | 7 | 1 |
| C1 | 24 | 2 | 17 | 1,300 | 243 | 365 | 83 | 29 | 25 |
| C3 | 60 | 4 | 15 | 3,210 | 72 | 132 | 48 | 17 | 7 |
| C4 | 44 | 5 | 20 | 1,580 | 150 | 284 | 89 | 41 | 16 |
| C5 | 1 | 1 | 675 | 675 | 675 | 675 | 100 | 100 | 100 |
| F1 | 34 | 2 | <20 | 650 | 159 | 200 | 91a | 21 | 3 |
| F2 | 36 | 4 | <5 | 1,000 | 158 | 337 | 61 | 28 | 6 |
| F3 | 111 | 9 | <0.01 | 27,200 | 129 | 268 | 52 | 27 | 12 |
| F4 | 10 | 2 | <10 | 587 | 59 | 301 | 50 | 30 | 30 |
| G1 | 2 | 1 | <10 | 10 | 10 | 10 | 0 | 0 | 0 |
| G2 | 5 | 2 | <30 | 76 | 76 | 76 | 0 | 0 | 0 |
| L1 | 80 | 14 | 0.00016 | 1,110 | 42 | 83 | 6 | 1 | 1 |
| L2 | 1 | 1 | 312 | 312 | 312 | 312 | 100 | 0 | 0 |
| M | 6 | 2 | 24 | 160 | 63 | 85 | 0 | 0 | 0 |
| N1 | 316 | 49 | 5.2 | 3,100 | 150 | 328 | 68 | 32 | 13 |
| O | 4 | 1 | 72 | 855 | 416 | 614 | NA | NA | NA |
| P | 132 | 11 | 0.14 | 1,600 | 41 | 107 | 11 | 3 | 0 |
| Q | 564 | 65 | 0.000033 | 102,000 | 89 | 253 | 48b | 19 | 8 |
| R | 59 | 4 | 0.029 | 1,240 | 0.56 | 2.4 | 12 | 3 | 3 |
| S | 27 | 2 | 0.0096 | 619 | 51 | 165 | 33 | 8 | 0 |
| Y1 | 64 | 5 | 14 | 2,200 | 110 | 290 | 91 | 38 | 23 |
| Y2 | 34 | 3 | 21 | 992 | 61 | 110 | 68 | 15 | 9 |
| AA1 | 374 | 35 | 0.019 | 3,380 | 97 | 235 | 57 | 19 | 7 |
| AA2 | 24 | 4 | 10 | 5,200 | 85 | 165 | 29 | 13 | 8 |
NOTES: NA, required monitoring for purpose other than MSGP benchmark compliance; no regulatory limit established for those sites. Fourteen reported results were not included because they did not have units. An additional four reported results from P1 were excluded from the hardness-based benchmark evaluation because no regulatory limit was established for those sites.
a Includes three results with reported detection limit exceeding the benchmark.
b Includes one result with reported detection limit exceeding the benchmark.
This page intentionally left blank.


