
Appendix E
Additional Data on Technical Achievability of Treatment Stormwater Control Measures
This appendix expands on the discussion of technical achievability in Chapter 2. The results of stormwater control measure pollutant removal performance for several additional pollutants—aluminum, copper, lead, zinc, and chemical oxygen demand (COD)—are presented here to supplement the data on total suspended solids and iron presented in Chapter 2. Some additional information on the Clark and Pitt (in press) study design is also provided.
ADDITIONAL STUDY DETAILS
The Clark and Pitt (in press) studies were collected from various locations in the United States and represent Environmental Protection Agency Rainfall Zones 1, 2, 3, 6, and 7. Seven studies were of devices whose primary treatment mechanism was sedimentation, while six studies primarily relied on filtration for water quality treatment, and two were treatment trains that relied on sedimentation pretreatment prior to filtration. For the sedimentation systems, the devices were categorized into three classifications: (1) hydrodynamic separator (HDS) devices, (2) ponds, and (3) wetlands. The HDS devices studied were proprietary sediment retention systems; HDS 4 is an inclined plate separator and the remainder are traditional HDS swirl concentrators. The two ponds were conventional dry ponds as described in most state stormwater manuals. The wetland also was designed similarly to the engineered wetlands described in most state manuals. For the filtration systems, the filtration media were proprietary combinations that had been optimized by the vendor for removing site-specific pollutants, especially metals, from the stormwater runoff through physical straining and potentially through adsorption and/or ion exchange. For consistency, label numbers for different pollutant data from the same site remain the same, even if not all sites monitored the same pollutants (e.g., Site HDS 3 is HDS 3 for all pollutants, regardless of whether data for HDS 2 are available for all pollutants). All samples were flow-weighted composites and were collected generally in accordance with the 2009 guidance for collecting data suitable for inclusion in the International Stormwater BMP Database (Geosyntec Consultants and Wright Water Engineers, 2009).
The analysis of whether the treatment system was able to remove the pollutant of interest and whether it was considered for inclusion in the graphical analysis was tested statistically using the nonparametric analyses available in SigmaPlot/SigmaStat (Systat Software, Inc.). The selected test was the Wilcoxon signed-rank test using a one-tailed analysis of whether effluent was less than the influent. Significance was assumed if the reported p value was ≤0.05. The signed-rank test examines the pairs of data for difference. If the Shapiro-Wilk test for normality was passed, then the program defaulted to a paired t-test. The assumption of nonparametric testing was used since stormwater data rarely are normally distributed (Burton and Pitt, 2002).
One committee member performed this analysis, which was then reviewed in detail by another committee member to check for errors. Any errors identified were corrected.
ADDITIONAL POLLUTANT RESULTS
Total Aluminum
At the industrial study sites, only one proprietary sedimentation system and one filtration system were able to meet the benchmark concentration for more than 50 percent of the monitored storm events. For the sedimentation system, this was also the site with the lowest influent concentrations, which may have influenced the treatability (see Figure E-1). The International Stormwater BMP Database contained limited data on aluminum and only for retention ponds, which were shown to meet the benchmark for between 25 and 50 percent of the monitored storm events (see Figure E-2).
Total Copper
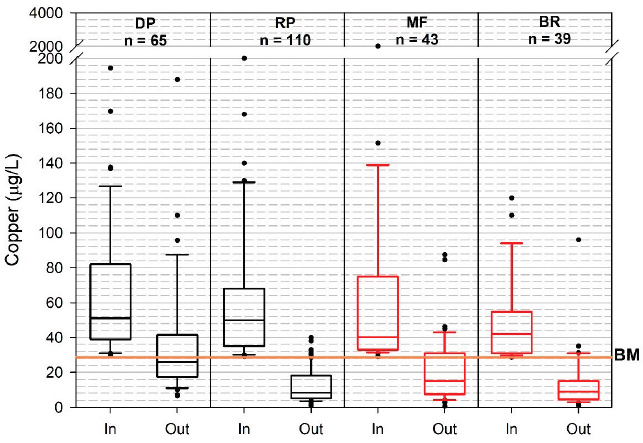
The copper benchmark is hardness dependent; therefore, two sample benchmarks are shown in Figures E-3 and E-4 for the evaluation of technology performance at individual industrial stormwater study sites. One benchmark (9 µg/L) is based on 60 mg/L total hardness, shown in Figure E-3, and the other (28.5 µg/L) is based on 200 mg/L total hardness, shown in Figure E-4. One of the three media filters and the treatment train were able to meet the lower soft-water benchmark for at least 50 percent of the storm events. The treatment train was able to meet the benchmark for >90 percent of the monitored events. For systems with eight storm events with influent concentrations above the hard-water benchmark, only the media filter was able to meet the hard-water benchmark for at least 50 percent of the events monitored.
For the International Stormwater BMP Database (see Figures E-5 and E-6), all the treatment systems except the dry detention pond were able to meet the soft-water benchmark of 9 µg/L for between 50 and 75 percent of the monitored storm events. For the hard-water benchmark, the dry detention pond and media filter could meet the hard-water benchmark for between 50 and 75 percent of the monitored storm events, while the wet retention pond and bioretention system met the hard-water benchmark for between 75 and 90 percent of the monitored storm events.
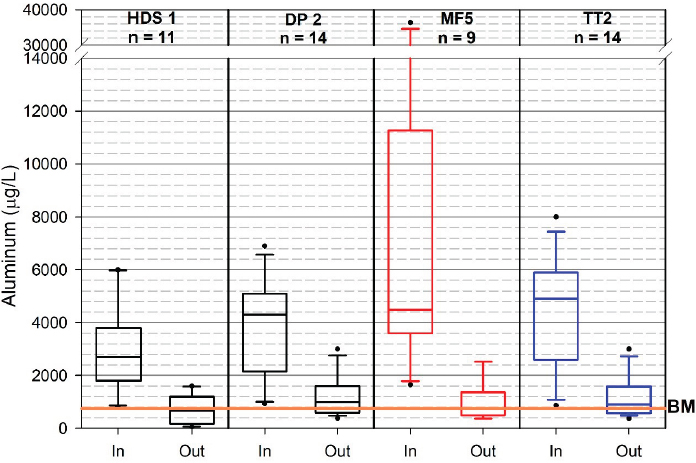
Total aluminum influent versus effluent concentrations.
NOTES: DP = dry detention pond; HDS = hydrodynamic separator; MF = media filter; TT = treatment train. The number of storm-event samples used in each analysis is shown on the graph below each treatment system.
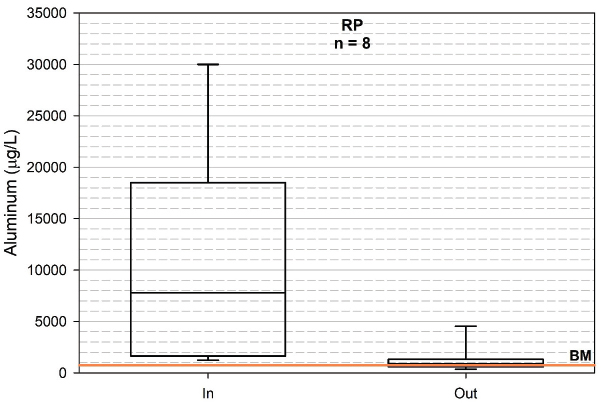
International Stormwater BMP Database comparison of influent and effluent concentrations for total aluminum.
NOTE: RP = wet retention ponds.
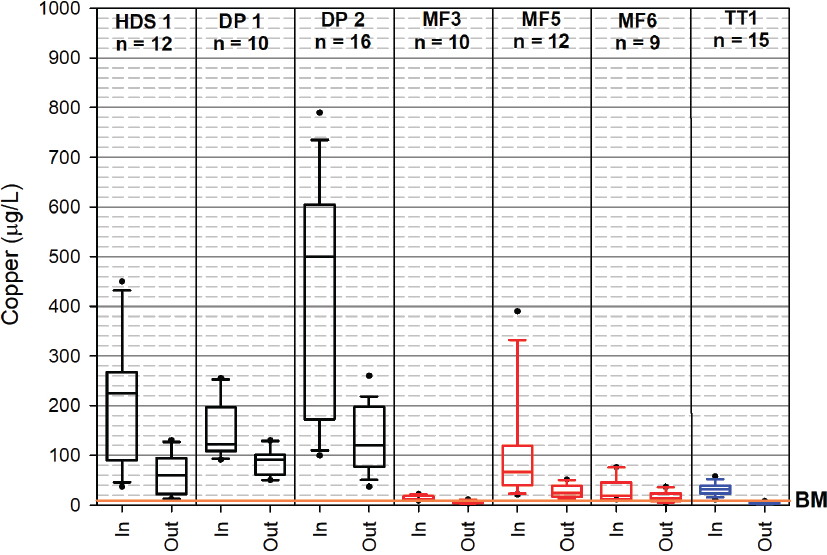
Total copper influent versus effluent concentrations compared to the soft-water benchmark concentration of 9 µ/L.
NOTES: DP = dry retention pond; HDS = hydrodynamic separator; MF = media filter; TT = treatment train. The number of storm-event samples used in each analysis is shown on the graph below each treatment system.
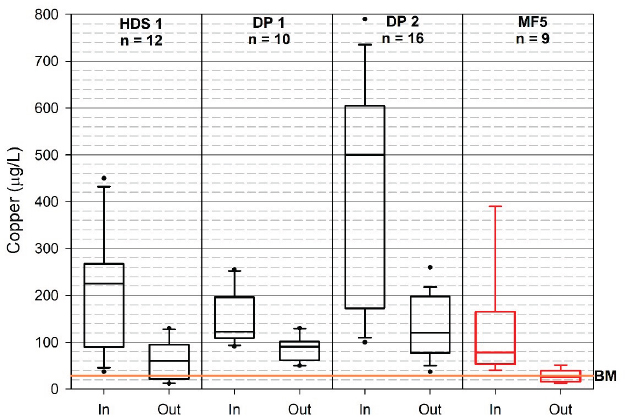
Total copper influent versus effluent concentrations compared to the hard-water benchmark concentration of 28.5 µg/L.
NOTES: DP = dry retention pond; HDS = hydrodynamic separator; MF = media filter. The number of storm-event samples used in each analysis is shown on the graph below each treatment system.
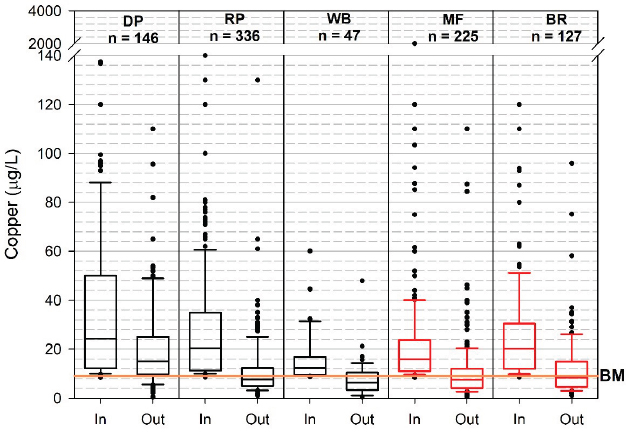
International Stormwater BMP Database comparison of influent and effluent concentrations for total copper against the soft-water benchmark of 9 µg/L.
NOTE: BR = bioretention; DP = dry detention ponds; MF = media filters; RP = wet retention ponds; WB = wetlands.
International Stormwater BMP Database comparison of influent and effluent concentrations for total copper against the hard-water benchmark of 28.5 µg/L.
NOTE: BR = bioretention; DP = dry detention ponds; MF = media filters; RP = wet retention ponds; WB = wetlands.
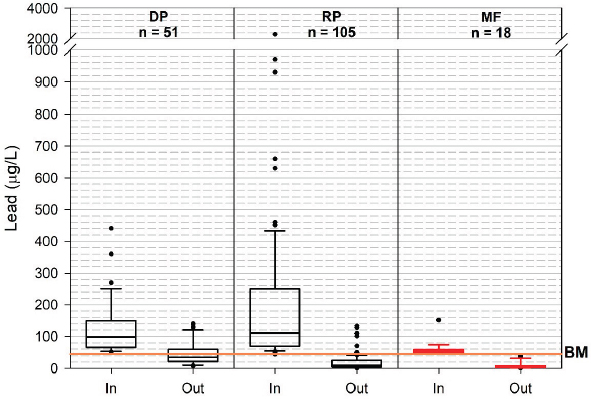
Total Lead
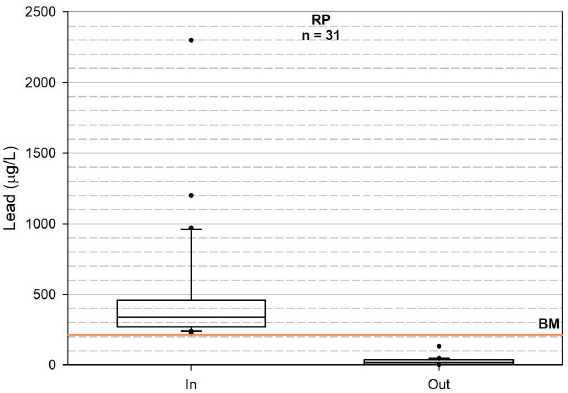
For lead, the benchmark is set based on the receiving water hardness. None of the treatment systems was able to meet the soft-water benchmark of 45 µg/L for more than 50 percent of the monitored storm events (see Figure E-7). For the two systems with sufficient data pairs where the influent concentration exceeded the hard-water benchmark of 213 µg/L (see Figure E-8), one dry detention pond and one treatment train were able to meet the effluent hard-water benchmark for between 75 and 90 percent of the monitored storm events. The improved performance when only analyzing data where the influent exceeds the hard-water benchmark likely is due to the strong association of high concentrations of lead with particulate matter that easily settled or was filtered. However, since particle size analysis was not included, this cannot be confirmed from the data set.
The International Stormwater BMP Database data (see Figure E-9) highlight the ability of other categories of stormwater treatment systems to remove total lead from the influent runoff. The dry pond was able to meet the soft-water benchmark for between 50 and 75 percent of the storm events monitored, while the wet retention pond and media filter were able to meet the benchmark for >90 percent of the monitored storm events. However, when comparing to the hard-water benchmark, only the wet retention pond had sufficient influent-effluent pairs where the influent concentration exceeded the hard-water benchmark of 213 µg/L (see Figure E-10). The wet retention pond was able to meet the hard-water benchmark for >90 percent of the reported storm events.
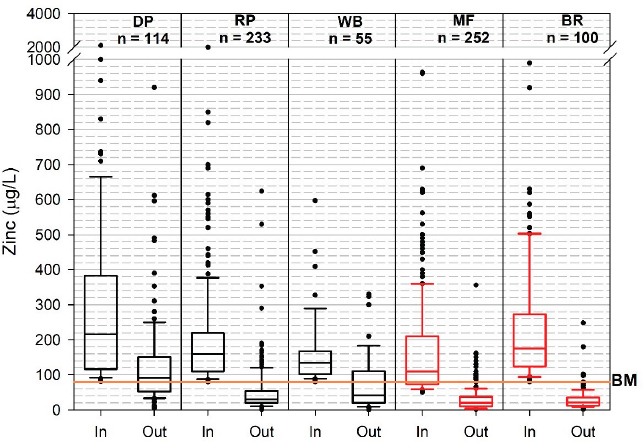
Total Zinc
Of the three sedimentation devices, four filtration systems, and two treatment trains examined at industrial stormwater sites, only one treatment train had effluent concentrations that consistently met the soft-water benchmark of 80 µg/L (>90 percent of the monitored storm events; see Figure E-11). One sedimentation device and three filtration devices were able to meet the soft-water benchmark for between 25 and 50 percent of the storm events. All other devices were unable to meet the benchmark for more than 10 percent of the storm events.
Three sedimentation systems, one media filter, and one treatment train had influent concentrations that exceeded the hard-water benchmark of 230 µg/L for eight or more storm events (see Figure E-12). For one of the three sedimentation systems and one treatment
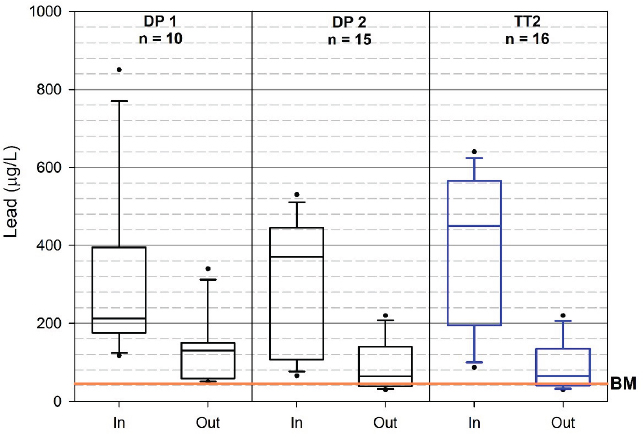
Total lead influent versus effluent concentrations comparison against the soft-water benchmark.
NOTES: DP = dry detention pond; TT = treatment train. The number of storm-event samples used in each analysis is shown on the graph below each treatment system.
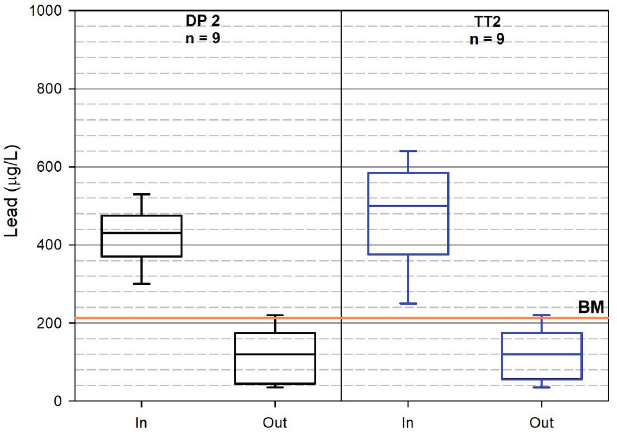
Total lead influent versus effluent concentrations comparison against the hard-water benchmark.
NOTES: DP = dry detention pond; TT = treatment train. The number of storm-event samples used in each analysis is shown on the graph below each treatment system.
International Stormwater BMP Database comparison of influent and effluent concentrations for total lead compared to the soft-water benchmark.
NOTE: DP = dry detention ponds; MF = media filters; RP = wet retention ponds.
International Stormwater BMP Database comparison of influent and effluent concentrations for total lead compared to the soft-water benchmark.
NOTE: RP = wet retention ponds.
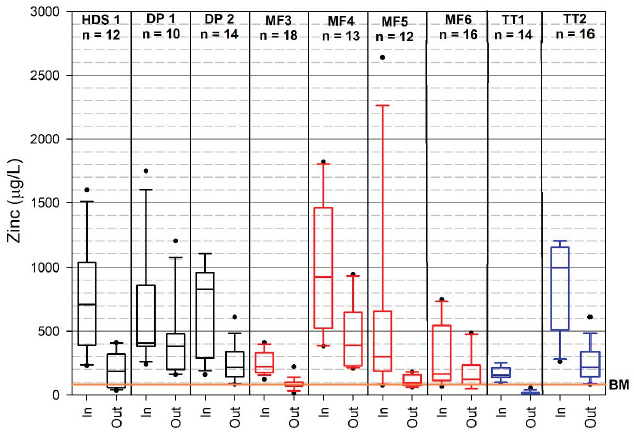
Total zinc influent versus effluent concentrations comparison to the soft-water benchmark.
NOTES: DP = dry detention pond; HDS = hydrodynamic separator; MF = media filter; TT = treatment train. The number of storm-event samples used in each analysis is shown on the graph below each treatment system.
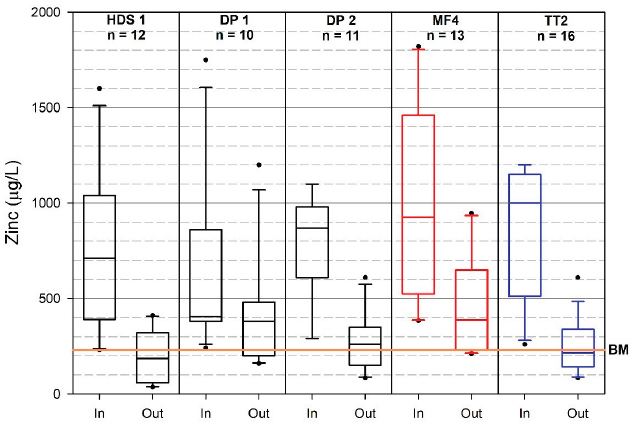
Total zinc influent versus effluent concentrations comparison to the hard-water benchmark.
NOTES: HDS = hydrodynamic separator; MF = media filter; TT = treatment train. The number of storm-event samples used in each analysis is shown on the graph below each treatment system.
train, the systems’ performance met the hard-water benchmark of 230 µg/L for between 50 and 75 percent of the storm events. The other three systems (two sedimentation and one filtration) met the hard-water benchmark for between 25 and 50 percent of the monitored storm events.
The International Stormwater BMP Database results (see Figure E-13) highlight the ability of the five types of systems to remove total zinc from the influent runoff in comparison to the soft-water benchmark. Four of the five systems examined (media filter, bioretention systems, wetland, and wet retention ponds) were able to meet the soft-water benchmark of 80 µg/L for >50 percent of the monitored storm events with the media filter and bioretention system able to meet the benchmark for >90 percent of the monitored storm events.
Figure E-14 highlights the ability of the treatment systems to meet the hard-water benchmark of 230 µg/L when their influent concentrations exceeded the hard-water benchmark. The wet retention pond, the media filters, and the bioretention system were able to meet the hard-water benchmark for >90 percent of the storm events monitored, while the detention pond and wetland were able to meet the hard-water benchmark for between 50 and 75 percent of the storm events.
Chemical Oxygen Demand (COD)
Chemical oxygen demand has been used in the MSGP as a surrogate for other organic contaminants such as hydraulic oils and organic chemicals. For the individual site analysis, only one hydrodynamic separator and one treatment train had sufficient sample pairs with influent concentrations that exceeded the benchmark of 120 mg/L (see Figure E-15). The analysis showed that the hydrodynamic separator was able to meet the effluent benchmark concentration for less than 25 percent of the monitored events while the treatment train could meet the effluent benchmark concentration for between 50 and 75 percent of the monitored storm events.
Data from the International Stormwater BMP Database show that wet retention pond and bioretention systems were able to reduce COD effluent concentrations to less than the benchmark for >90 percent of the storm events (see Figure E-16). The dry detention pond was able to reduce the influent COD concentrations to below the benchmark concentration for between 25 and 50 percent of the storm events monitored.
International Stormwater BMP Database comparison of influent and effluent concentrations for total zinc compared to the soft-water benchmark.
NOTE: BR = bioretention; DP = dry detention ponds; MF = media filters; RP = wet retention ponds; WB = wetlands.
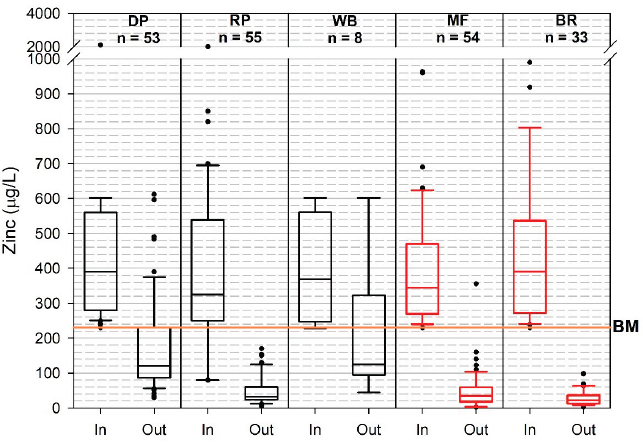
International Stormwater BMP Database comparison of influent and effluent concentrations for total zinc compared to the hard-water benchmark.
NOTE: BR = bioretention; DP = dry detention ponds; MF = media filters; RP = wet retention ponds; WB = wetlands.
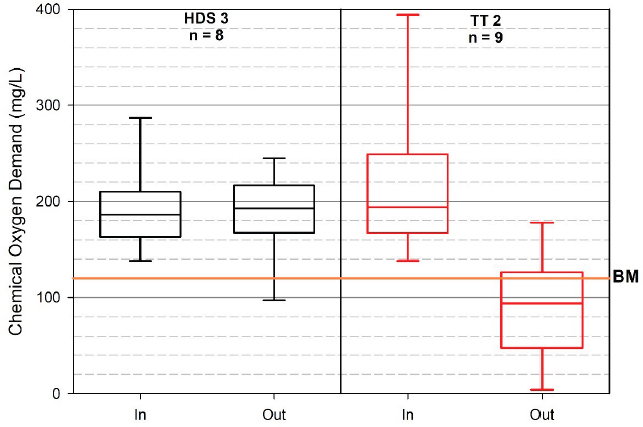
Chemical oxygen demand influent versus effluent concentrations.
NOTES: HDS = hydrodynamic separator; MF = media filter; TT = treatment train. The number of storm-event samples used in each analysis is shown on the graph below each treatment system.
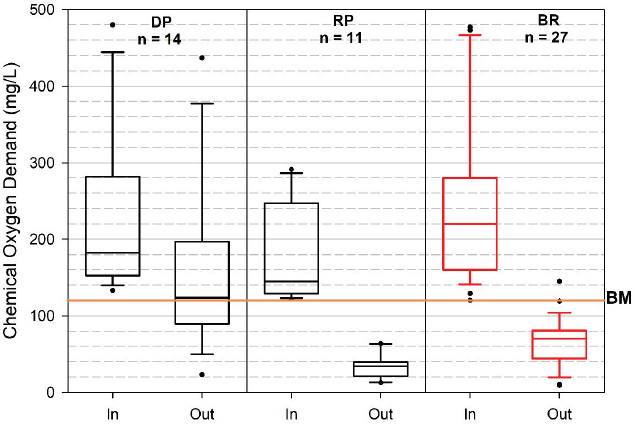
International Stormwater BMP Database comparison of influent and effluent concentrations for chemical oxygen demand.
NOTE: BR = bioretention; DP = dry detention ponds; MF = media filters; RP = wet retention ponds; WB = wetlands.
This page intentionally left blank.


