
3
Magnitude of Urban Flooding
The committee’s second task was to estimate the size or importance of urban flooding in the four metropolitan areas: Baltimore, Chicago, Houston, and Phoenix. Workshop participants felt that urban flooding is an important issue in their area (Chapter 2). However, it is difficult to obtain estimates of flood magnitude from community workshops. To address this gap, the committee drew on published estimates of flood losses in the case study areas and also analyzed federal flood loss data. This chapter presents results from two typical methods for estimating the magnitude of urban flooding in the case study areas: (1) a descriptive or statistical assessment of historical flood impact data (retrospective estimate) and (2) an urban flood risk assessment, which involves modeling and includes additional information (prospective estimate).
Quantifying the magnitude of urban flooding is challenging because flooding arises from many causes and it can result in a wide variety of economic, social, and ecological impacts, all of which vary geographically. Urban flood impacts can be divided into four main categories (Merz et al., 2010; Zurich Flood Resilience Alliance, 2014):
- Direct impacts—Immediate effect of the disaster (e.g., loss of life; damage to buildings, roads, agriculture, and infrastructure; monetary loss).
- Indirect impacts—Occur as a result of and in response to the direct impacts in the medium to long term (e.g., increased morbidity due to lack of sanitation facilities; unemployment and reduced income due to business interruption).
- Tangible impacts—Impacts that have a market value and can generally be measured in monetary terms (e.g., structural losses).
- Intangible impacts—Nonmarket impacts (e.g., health, natural resources, cohesion of a social group or community).
Although indirect and intangible impacts can be substantial, especially in poor communities, direct and tangible impacts are easier to measure and thus are typically those assessed to estimate the magnitude of urban flooding.
HISTORICAL DATA ASSESSMENTS
The simplest method for estimating urban flood magnitude is to analyze historical data collected for a large flood event or for flooding over the past several decades. These analyses typically focus on direct and tangible impacts, such as deaths, physical damage to buildings and roads, and monetary loss. However, historical data are often subject to problems with data quality (e.g., uncertainties, biases, gaps) and consistency (varying temporal and spatial scales) that complicate the interpretation of results.
The most complete and accessible data sets on historical flooding are collected by federal government agencies, and they cover several aspects of urban flooding, including economic losses and deaths from major flood events, as well as insurance payouts, grants, and loans to those affected by smaller floods. The discussion below presents federal data on the magnitude of historical flooding, as recorded by major flood events and by decadal or longer records of flood loss in urban areas.
Major Flood Events
Historical records indicate where, how often, and how damaging major floods have been. Major floods were responsible for most of the past flood losses in the United States. Data on major flood events are compiled by two federal government agencies: the National Oceanic and Atmospheric Administration’s (NOAA’s) National Weather Service and the Federal Emergency Management Agency’s (FEMA’s) National Flood Insurance Program (NFIP). NOAA provides loss estimates for significant flooding events (i.e., excluding minor or localized flooding) per water year (October 1 of the current year to September 30 of the following year; Table 3.1). The loss estimates cover fatalities and direct flood damage to private property, including structural damage and lost agricultural production, and damage to public infrastructure and facilities.1 The flood hazards included are freshwater flooding caused by rainfall (including rainfall from hurricanes and tropical storms), snowmelt, dam and levee failures, and ice jams. Losses associated with coastal storm surge are not considered.
The NOAA estimates cover both insured and uninsured exposure. In contrast, the FEMA significant flood events data cover direct flood damage to property from an insured exposure perspective exclusively. FEMA has cataloged significant flood events, defined as those with 1,500 or more paid losses, since 1978.2 For each significant flood event, FEMA reports the common name, the month and year it occurred, the number of paid losses, and the amount of claims paid out (Table 3.1). Significant flood events commonly have regional impacts and may incorporate multiple types of flooding. For example, Hurricane Harvey began as a hurricane in Texas, changed to a tropical storm in Louisiana, and delivered heavy rainfall to several Gulf Coast states. In the FEMA significant flood event database, these manifestations are wrapped into “Hurricane Harvey.”
Flood data from these sources are discussed below.
TABLE 3.1 Data Characteristics for Major Flood Events Considered in This Report
| Agency | Hazards | Years | Area | Data Reported |
|---|---|---|---|---|
| NOAA | Freshwater floods caused by rainfall, snowmelt, and ice jams. This can include hurricane-related freshwater flooding, but not storm surge or coastal flooding | 1903–2014 | Forecast area to region |
|
| FEMA | Flood events from all sources (e.g., hurricanes, torrential rain) with ≥1,500 paid losses | 1978–2016 | Region (up to several states) |
|
___________________
NOAA National Weather Service
NOAA’s damage and fatality estimates go back to 1903. The largest flood loss year was 2005, with more than $55 billion in direct damage from four hurricanes and a tropical storm, followed by 1993, with $30.8 billion in direct damage from Midwest floods and a March storm (Figure 3.1). Although freshwater flood damages have been increasing substantially over time (Figure 3.1, top), freshwater flood fatalities have been increasing at a lower rate on average (Figure 3.1, bottom). Across all 112 years of available data, the annual average freshwater flood loss was $5.4 billion with 96 fatalities. For the most recent decade of the data (2005–2014), the annual average freshwater flood loss was $9.1 billion with 71 fatalities.
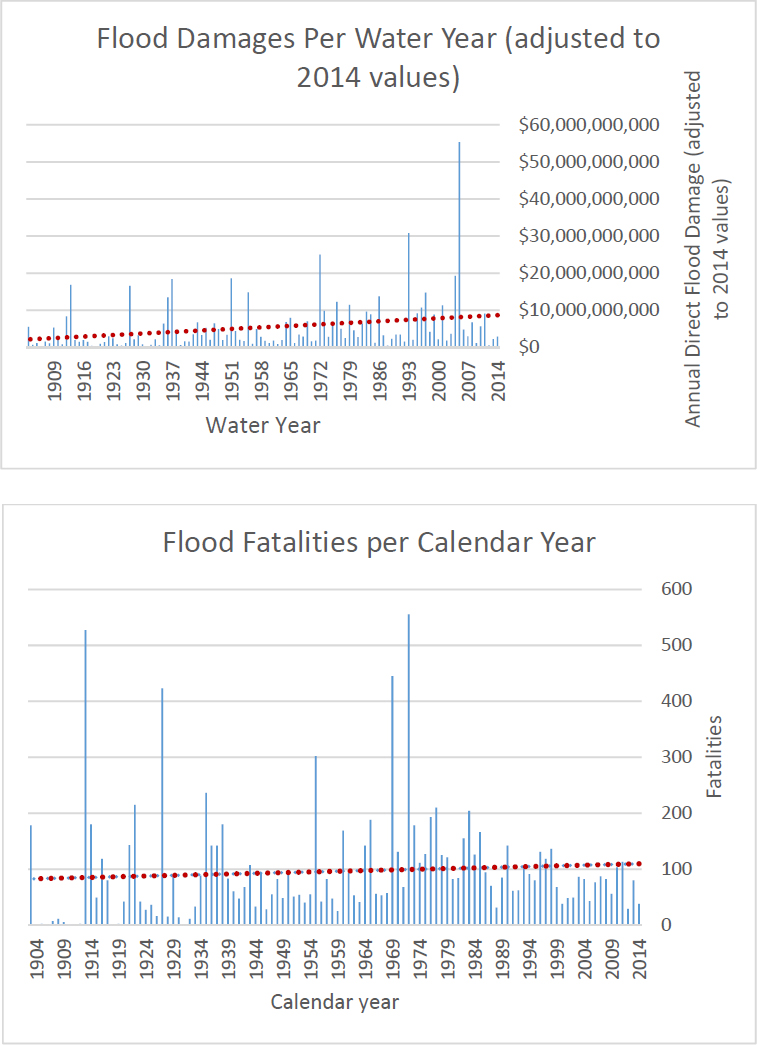
SOURCE: Data from http://www.nws.noaa.gov/hic/.
FEMA National Flood Insurance Program
Approximately 80 percent of the insured losses recorded in FEMA’s significant flood events data set (as of October 17, 2017) are associated with hurricanes and tropical storms. The largest hurricane-related payouts since the data set began in 1978 were caused by Hurricane Katrina in 2005 ($16.3 billion), Superstorm Sandy in 2012 ($8.7 billion), and Hurricane Ike in 2008 ($2.7 billion). However, events with a common name containing “flood(s)” or “torrential rain” can also cause substantial insured losses. On average, 1.9 significant flood or torrential rain events occur each year, and $362 million of losses to insured property are incurred each year from such events.3 The largest insured losses were in 1995 and 2016, which each had two significant flood events. In 2016, the total paid losses (approximately $2.9 billion) were dominated by severe storms and flooding in Louisiana, which caused more than $2.2 billion in insured losses.
Summary of Major Flood Events Data Sets
The FEMA and NOAA data sets discussed above suggest that losses from large flood events are substantial and are increasing over time. The NOAA estimates show that annual losses associated with direct damage from major flood events across the United States range from $7 billion to $9 billion on average, and that associated fatalities range from 70 to 96 fatalities on average. The NOAA loss estimates include damage from freshwater flooding and rainfall from hurricanes, but they omit damage from other types of coastal flooding (e.g., storm surge). The FEMA loss estimates (average annual losses of $415 million) include coastal flooding, but omit uninsured losses. Although the FEMA and NOAA data are not directly comparable, it is likely that a substantial portion of flood-related direct damage is to uninsured property. It is also likely that actual losses are substantially higher, primarily because neither estimate includes indirect and intangible damages, such as longer-term health impacts.
Historical Flood Loss Data in Urban Areas
The flood loss data discussed in the preceding section are for large regions. However, data at county-level or smaller scales are needed to study flood losses in urban areas. County-level data can be matched to urban designations, such as metropolitan and micropolitan statistical areas (Core-Based Statistical Areas [CBSA], referred to in this chapter as “metropolitan areas”). A metropolitan area generally covers one or more counties.
The two primary sources of data at the county scale are FEMA and the Spatial Hazard Events and Losses Database for the United States (SHELDUS). FEMA has data on NFIP insurance claims as well as grants and loans that become available after a federal disaster is declared (Table 3.2). These include Small Business Administration (SBA) loans, Individual Assistance (IA) grants, Public Assistance (PA) grants, and Hazard Mitigation Grants Program (HMGP) grants. FEMA data are collected at the building level and are available aggregated to the zip code and county level.
The SHELDUS database was developed at the University of South Carolina and is currently housed at Arizona State University (CEMHS, 2018). SHELDUS downscales NOAA regional or forecast area data4 to the county level and parses it by hazard (e.g., floods, hurricanes and tropical storms, coastal hazards, and severe thunderstorms) and by peril (e.g., riverine flooding and urban flooding). The data considered here are for flood hazard, which includes freshwater flooding associated with hurricane rainfall (Table 3.2). SHELDUS contains information on the date and location of an event, the direct losses caused by the event (property and crop losses, injuries, and fatalities), and insured crop losses (indemnity payments). Results from these two data sources are discussed on the following pages.
___________________
3 No events with flood or torrential rain in the common name occurred in 1985, 1987, 1990, 1999, 2001, 2003, 2004, 2005, 2007, and 2012.
TABLE 3.2 Characteristics of Urban Flood Loss Data Considered in This Report
| Source | Years | Scale | Data Reported |
|---|---|---|---|
| FEMA | 1972–2014 | County and zip code |
NFIP flood insurance claims
|
| 2004–2016 | County and zip code |
Individual Assistance (IA) grants
|
|
| 1992–2017 | County and zip code |
Public Assistance (PA) grants
|
|
| 2004–2015 | County and zip code |
Small Business Administration (SBA) loans
|
|
| 1998–2013 | County and zip code |
Hazard Mitigation Grant Program (HMGP) grants
|
| SHELDUS (derived from NOAA) | 1960–2016 | County |
Freshwater flood-related
|
FEMA
County-level data for 2004–2014 are available for the five FEMA data sets summarized in Table 3.2: NFIP claims, SBA loans, and IA, PA, and HMGP grants. The committee compiled the dollar amounts from the five data sets over the 10-year period, then adjusted the figures to 2014 prices using the Consumer Price Index. Figure 3.2 shows the payout and loan amount for every county in the contiguous United States. The total payouts, grants, and loans range from $0 to more than $10 billion for an individual county, and they sum to more than $127 billion for the nation over the 10 analyzed years.
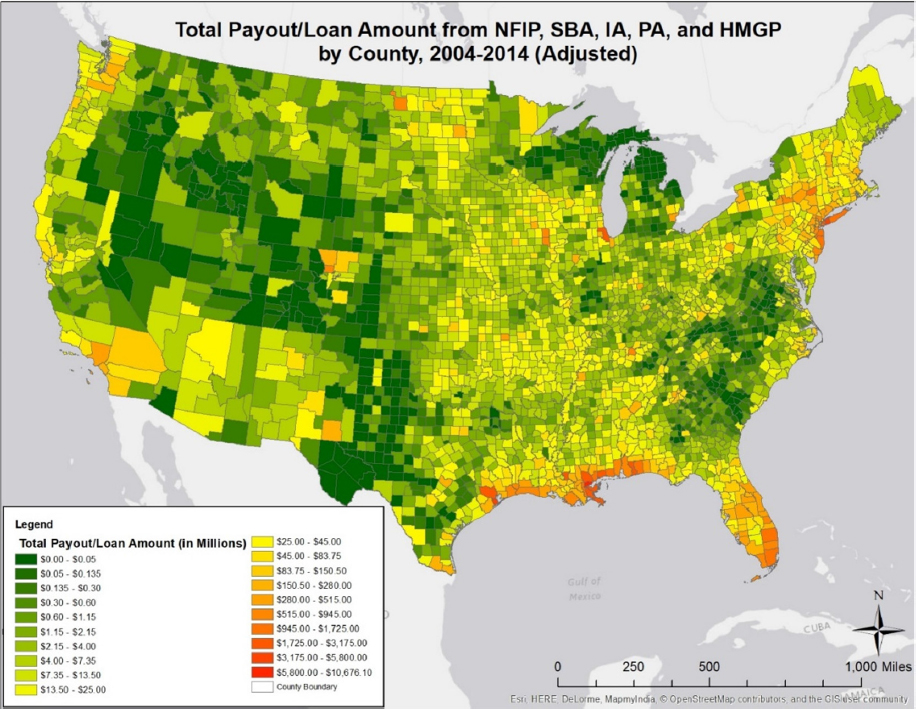
SOURCE: University of Maryland and Texas A&M University, Galveston (2018).
The figure shows that damage is concentrated in heavily populated coastal counties along the Gulf Coast, Florida, and New York area (reds and oranges). Damage in these areas is associated with hurricanes, storm surge, and/or heavy precipitation. Normalizing the payout/loan amounts by the number of homes, per capita, or average home lot size would help tease out what types of flooding drive monetary losses in counties across the United States.
The 10 counties with the highest payout and loan amounts are listed in Table 3.3. One of the case study counties (Harris) is included in the top 10 and the other three are listed at the end of the table. Note that differences in which years’ historical estimates are calculated can yield different results. For example, if the data range included 2017 (the year Hurricane Harvey hit), Harris County would be at the top of the list. Furthermore, losses for Cook County over a 10-year period (2004–2014) were $1.8 billion (Table 3.3). A similar study for Cook County (CNT, 2014) found losses of $774 million over a 5-year period
(2007–2011), a little less than half of the 10-year estimate, even though private insurance claims payouts were included.
TABLE 3.3 Counties with the Highest Payout, Grant, and Loan Amounts from NFIP, SBA, IA, PA, and HMGP, 2004–2014
| Rank | County/Parish | State | Total Federal Payout and Loan Amount ($ millions) 2004–2014 |
|---|---|---|---|
| 1 | Orleans | Louisiana | $10,676 |
| 2 | New York | New York | $9,803 |
| 3 | Nassau | New York | $5,017 |
| 4 | Galveston | Texas | $3,241 |
| 5 | Harrison | Mississippi | $3,004 |
| 6 | St. Bernard | Louisiana | $2,851 |
| 7 | St. Tammany | Louisiana | $2,675 |
| 8 | Harris (includes Houston) | Texas | $2,667 |
| 9 | Queens | New York | $2,514 |
| 10 | East Baton Rouge | Louisiana | $2,165 |
| 13 | Cook (includes Chicago) | Illinois | $1,827 |
| 368 | Baltimore | Maryland | $38 |
| 872 | Maricopa (includes Phoenix) | Arizona | $11 |
The decadal, county-level data in Table 3.3 can be converted into an annual per capita cost for the four case study areas, as shown in Table 3.4. The per capita data vary substantially across these areas, from $0.3/year in Maricopa County to $2.6/year in Baltimore County to $35.2/year in Cook County to $65.2/year in Harris County.
TABLE 3.4 Annual Per Capita Disbursement of Payouts, Grants, and Loans from NFIP, SBA, IA, PA, and HMGP
| Baltimore County | Cook County | Harris County | Maricopa County | |
|---|---|---|---|---|
| Federal disbursement, 2004–2014 | $38 million | $1,827 million | $2,667 million | $11 million |
| 2010 Populationa | 1,425,990 | 5,194,675 | 4,092,459 | 3,817,117 |
| $/Person/Year | $2.6 | $35.2 | $65.2 | $0.3 |
a U.S. Census Bureau American FactFinder.
Table 3.5 presents the zip codes with the five highest totals of SBA loans, NFIP payouts, IA grants, and HGMP buyouts for all available years of data. Only 12 urban areas are represented in the table, with many urban areas drawing heavily on multiple types of federal assistance. Two of the case study areas appear in this list, with Houston receiving substantial assistance in buyouts and NFIP insurance payouts, and Chicago receiving substantial IA awards.
TABLE 3.5 Metropolitan Zip Codes with the Highest FEMA Assistance ($ millions) for All Available Years of Data
| SBA | NFIP | IA | HGMP Buyout |
|---|---|---|---|
| 2004–2015 | 1972–2014 | 2004–2016 | 1998–2013 |
| New Orleans, LA | New Orleans, LA | New Orleans, LA | Houston, TX |
| $6,724 | $16,204 | $5,604 | $117 |
| New York, NY | New York, NY | New York, NY | Nashville-Davidson, TN |
| $2,478 | $9,557 | $1,651 | $23 |
| Gulfport, MS | Houston, TX | Gulfport, MS | Greenville, NC |
| $2,242 | $4,107 | $912 | $22 |
| Baton Rouge, LA | Gulfport, MS | Baton Rouge, LA | Waterloo, IA |
| $1,235 | $2,598 | $698 | $18 |
| Miami, FL | Slidell, LA | Chicago, IL | Rocky Mount, NC |
| $1,060 | $1,846 | $692 | $15 |
Figure 3.3 shows federal payouts for NFIP claims and IA for residential flood losses in the Houston metropolitan area at the zip code level from 2004 to 2014. The NFIP claims data provide a measure of insured homeowner flood losses in and near mapped floodplains. The number of IA awards provides a measure of immediate and unmet recovery needs for households. They may also be sensitive to impacts on vulnerable populations because IA focuses on uninsured, underinsured, and poorer households.
The figure shows that the intensity of both household impact indicators varies across the region, depending on storm characteristics, insurance penetration, and the time frame being considered. For example, the location of losses on both maps is heavily influenced by Hurricane Ike, which inundated coastal areas on Galveston Island (bottom right corner) and along Galveston Bay in 2008 with a large storm surge. If the time period were extended to 2017 to include Hurricane Harvey, the losses would be located further inland and to the west of the city. IA payouts per household are markedly less than NFIP payouts, but the geographic range of IA is greater because it includes uninsured households. The lower income and more socially vulnerable neighborhoods to the north and northwest of the city have relatively high payouts (yellow and orange colors).
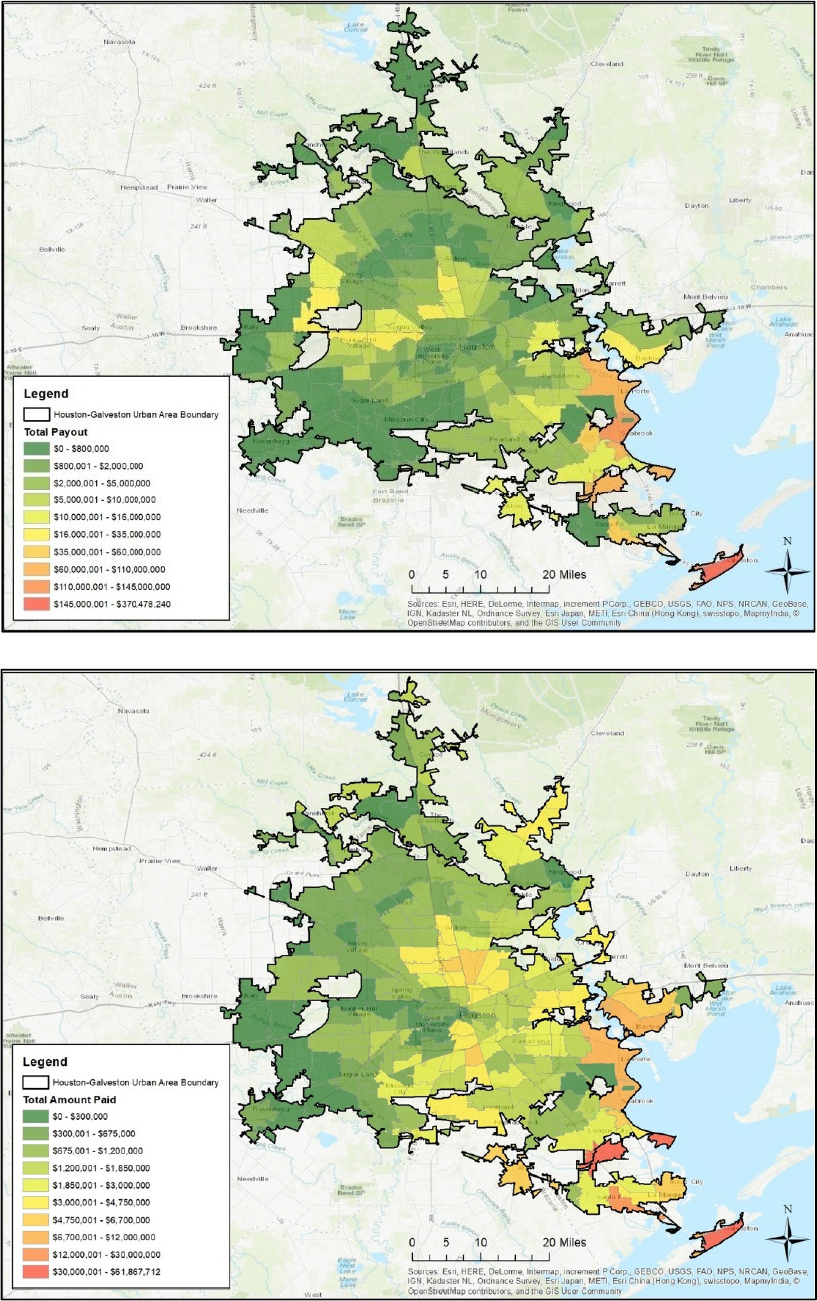
SOURCE: Center for Texas Beaches and Shores, Texas A&M University, Galveston Campus.
Across the United States, metropolitan areas along the Gulf and Atlantic coasts recorded the highest number of IA awards from 2004 to 2014 (Table 3.6). New Orleans, New York, and Gulfport had the highest total and average IA payouts, largely due to Hurricane Katrina and Superstorm Sandy. The Miami and Chicago metropolitan areas have remarkably high payout totals, despite the absence of a major flood disaster during the reporting period. It is important to note that IA figures may understate the effect of flooding in poor areas. In practice, presidential disasters are declared for events that exceed absolute or per capita loss thresholds (Reese, 2018). As a result, extreme floods that inflict damage primarily in places with low housing values may fall below disaster declaration thresholds. Furthermore, some Presidential Major Disaster Declarations do not include an IA designation (Lindsay and Reese, 2018).
TABLE 3.6 Metropolitan Areas (CBSAs) with the Most IA Awards, 2004–2014
| Rank | Metropolitan Area | Total Number of IA Awards 2004–2014 |
Total IA Payouts 2004–2014 |
Average Award Payout |
|---|---|---|---|---|
| 1 | New Orleans–Metairie, LA | 766,492 | $6,594,098,713 | $8,603 |
| 2 | Miami–Fort Lauderdale–West Palm Beach, FL | 291,734 | $586,585,379 | $2,011 |
| 3 | New York-Newark-Jersey City, NY-NJ-PA | 244,432 | $1,701,665,669 | $6,962 |
| 4 | Beaumont–Port Arthur, TX | 223,918 | $780,995,590 | $3,488 |
| 5 | Chicago, IL–Naperville, IN–Elgin, WI | 211,565 | $680,961,152 | $3,265 |
| 6 | Baton Rouge, LA | 170,308 | $293,658,207 | $1,724 |
| 7 | Gulfport–Biloxi–Pascagoula, MS | 164,383 | $1,280,668,461 | $7,791 |
| 8 | Houston–The Woodlands–Sugar Land, TX | 155,960 | $595,919,890 | $3,413 |
| 9 | Lake Charles, LA | 148,384 | $583,589,301 | $3,933 |
| 10 | Orlando–Kissimmee–Sanford, FL | 119,464 | $277,325,343 | $2,321 |
| 51 | Baltimore–Columbia–Towson, MD | 182 | $537,743 | $2,996 |
| NA | Phoenix–Mesa–Scottsdale, AZ | 0 | $0 | $0 |
SHELDUS
The SHELDUS results considered here are for freshwater flooding, including flooding from hurricane rainfall but not coastal flooding (see Table 3.2). According to the SHELDUS database, a total of $107.8 billion in direct property damage from flooding (73 percent of the national total) was incurred in urban areas, affecting 20,141 urban counties, from 1960 to 2016. Over that period, the average annual flood loss was $1.9 billion. However, losses have been increasing over time, especially over the past decade (Figure 3.4). The largest annual urban flood loss—$22.8 billion in direct property damage—occurred in 2012.
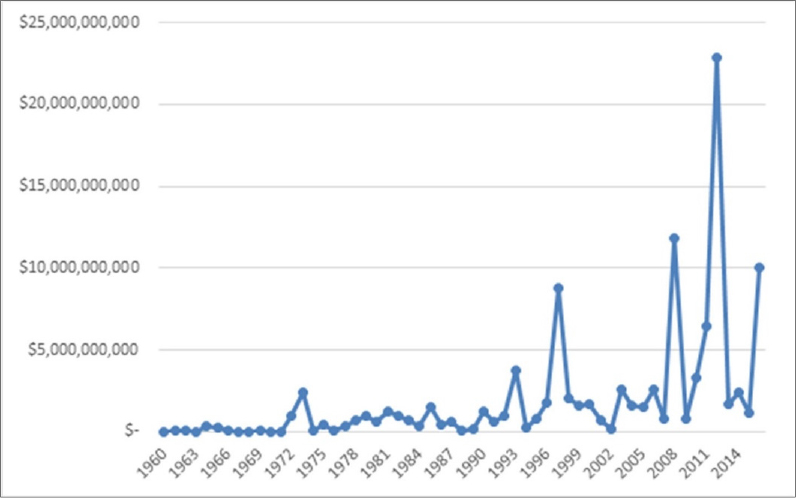
SOURCE: Data from https://cemhs.asu.edu/sheldus.
The 10 metropolitan areas (from a total of 379 metropolitan areas with flood damage) with the highest total direct property flood losses in the SHELDUS database from 1960 to 2016 are listed in Table 3.7. None of the case study areas appear in the top 10, but they are included at the end for comparison.
TABLE 3.7 Metropolitan Areas (CBSAs) with the Highest Direct Property Flood Losses in SHELDUS, 1960–2016
| Rank | Metropolitan Area | Total Flood Losses ($ millions), 1960–2016 |
|---|---|---|
| 1 | New York-Newark-Jersey City, NY-NJ-PA | $25,443 |
| 2 | Cedar Rapids, IA | $8,593 |
| 3 | Baton Rouge, LA | $6,223 |
| 4 | Grand Forks, ND–MN | $5,530 |
| 5 | Memphis, TN–MS–AR | $3,564 |
| 6 | Detroit–Warren–Dearborn, MI | $2,419 |
| 7 | Lafayette, LA | $2,212 |
| 8 | Nashville–Davidson–Murfreesboro–Franklin, TN | $2,052 |
| 9 | St. Louis, MO–IL | $1,854 |
| 10 | Madison, WI | $1,753 |
| 14 | Chicago, IL–Naperville, IN–Elgin, WI | $1,241 |
| 29 | Houston–The Woodlands–Sugar Land, TX | $549 |
| 94 | Phoenix–Mesa–Scottsdale, AZ | $160 |
| 147 | Baltimore–Columbia–Towson, MD | $82 |
Summary of Historical Flood Loss Data in Urban Areas
The FEMA data show that the significant flood events of Hurricane Katrina in 2005 and Superstorm Sandy in 2012 (as will Hurricane Harvey in 2017) drove the urban flood losses for New York and Orleans (Louisiana) counties, which received payouts, loans, and grants on the order of $10 billion from 2004 to 2014. These data illustrate the inherent flood risk concentrated in heavily populated coastal counties along the Gulf Coast and in Florida, which include cities such as Houston, Gulfport, and Miami. The SHELDUS data, which emphasize freshwater flooding, highlight a number of inland urban areas with substantial flood losses, including Cedar Rapids, Grand Forks, Memphis, Detroit, and Nashville, each of which had total flood losses exceeding $2 billion from 1960 to 2016. Metropolitan areas that are subject to frequent flooding but that are not necessarily thought of as flood prone include Atlanta, Dallas, and Columbus, Ohio.
Both data sets have limitations for estimating flood losses in urban areas. In particular, data at the county or zip code level miss important variations across a city. In addition, FEMA grants and loans (IA, PA, HMGP, and SBA) are tied to federal disaster declarations, and so smaller, chronic flood events may not be represented in the data. Moreover, only 5 million households carry NFIP flood insurance, a small fraction of the population in urban areas.
The NOAA data underlying SHELDUS do not fully capture flooding in coastal cities as we are reporting it. In addition, decisions on how the NOAA data are selected and handled bias the SHELDUS results. For example, when NOAA presents loss estimates as a logarithmic range (e.g., $5,000–$50,000), SHELDUS uses the lower end of the range (e.g., $5,000),5 likely understating the damage. Furthermore, downscaling results from the forecast area to the county level requires assumptions on the distribution of flood losses, which may differ from the actual distribution of flood losses.
___________________
5 See https://cemhs.asu.edu/sheldus/metadata#data-manipulation.
FLOOD RISK ASSESSMENTS
The second way to estimate the magnitude of urban flooding is through a flood risk assessment. Such assessments are more comprehensive than historical estimates, and comprise four main components: (a) flood hazard—the probability and magnitude of the urban flood hazard, (b) exposure—the population and economic assets at risk, (c) vulnerability—the damage relationship between hazard and exposure, and (d) performance—accounts for any flood mitigation measures such as levees (e.g., de Moel et al., 2015; NRC, 2015; Lorente, 2018). Risk assessments involve modeling and analysis of a wide range of hydrologic and socioeconomic data and thus yield a more comprehensive picture of risk than can be provided by relatively limited historical data. However, the results of different risk assessments often vary, sometimes substantially, depending on what methodological factors are included and how they are handled, as well as the quality and scale of the data used. Example results from published urban flood risk assessments are given below.
The World Resources Institute’s (WRI’s) aqueduct global flood analyzer is a publicly available tool that estimates riverine flood risk to property damage, affected GDP (gross domestic product), and affected population across different geographic scales.6Table 3.8 lists urban damage estimates for the nine U.S. cities that have been analyzed.
The WRI estimates are presented for 5-, 10-, 25-, 50-, 100-, 250-, 500-, and 1,000-year flood return periods as well as for the expected average annual loss (AAL) in any one year. The aqueduct tool assumption is that up to 5 years of flood protection is in place in each city.
TABLE 3.8 World Resources Institute Aqueduct Global Flood Analyzer Estimates of Annualized Direct Damage to Assets and Population Due to Riverine Flooding in Urban Areasa
| Direct Urban Damage ($ billions) with 5-Year Protection | |||||||||
|---|---|---|---|---|---|---|---|---|---|
| City | Flood Return Period, yr | ||||||||
| 5 | 10 | 25 | 50 | 100 | 250 | 500 | 1,000 | AALb | |
| Los Angeles, CA | 16.2 | 27.5 | 42.4 | 51.9 | 58.5 | 67.6 | 73.2 | 79.0 | 6.5 |
| Philadelphia, PA | 15.9 | 24.7 | 34.2 | 41.9 | 49.5 | 61.1 | 70.1 | 79.3 | 5.6 |
| Houston, TX | 8.8 | 13.9 | 20.6 | 25.6 | 31.8 | 41.0 | 47.2 | 54.0 | 3.3 |
| Chicago, IL | 8.3 | 14.6 | 21.0 | 26.0 | 30.8 | 35.3 | 38.8 | 40.5 | 3.3 |
| Cincinnati, OH | 9.4 | 15.1 | 19.7 | 22.8 | 27.3 | 33.5 | 38.6 | 45.1 | 3.3 |
| Minneapolis, MN | 7.2 | 11.6 | 14.8 | 17.3 | 20.3 | 23.9 | 27.7 | 31.1 | 2.5 |
___________________
6 See https://www.wri.org/resources/maps/aqueduct-global-flood-analyzer.
| Modesto, CA | 6.2 | 9.3 | 13.2 | 16.8 | 20.0 | 24.6 | 28.7 | 32.0 | 2.2 |
| Springfield, MA | 6.5 | 9.3 | 12.0 | 14.3 | 16.7 | 20.9 | 24.9 | 28.1 | 2.1 |
| Pittsburgh, PA | 3.3 | 8.9 | 12.5 | 15.5 | 19.3 | 24.3 | 28.0 | 29.4 | 2.0 |
| Tacoma, WA | 0.51 | 1.2 | 2.5 | 3.2 | 3.2 | 4.2 | 4.6 | 4.6 | 0.4 |
a Data as of September 2017.
b Average annual loss.
According to the aqueduct data, riverine flood damages across these nine cities range from $3.2 billion (Tacoma) to $58.5 billion (Los Angeles) for a 100-year flood event, the basis for designation of FEMA Special Flood Hazard Areas. In any one year, a mean average annual loss of $3.1 billion of direct damage to urban assets would be expected across these nine U.S. urban areas alone. For comparison, the NFIP collected $3.3 billion in annual premiums7 and paid $3.6 billion8 nationwide in 2016. The aqueduct data analyzer considers a broader set of exposures (insured and uninsured property, GDP and population exposure) than the NFIP (insured exposure), and so its loss estimates are expected to be higher than NFIP loss estimates.
An important factor in assessing urban flood risk is the localized nature of both the flood hazard and the exposure (de Moel et al., 2015). Because the aqueduct tool is derived on a global scale, its resolution is likely too coarse for a proper urban flood risk assessment. A handful of flood risk assessments have been generated using higher-resolution modeling to derive flood risk for U.S. cities and counties. These alternative assessments focus primarily on riverine flooding or storm surge. For example, Aerts et al. (2013) assessed the full distribution of hurricane flood risk in New York City and estimated an expected annual damage of $59 million to $129 million per year, and $7.5–billion to $15.4 billion per year for the 1 in 1,000-year storm-surge event. Hallegatte et al. (2013) used a port city flood risk assessment methodology to assess average annual flood losses in 136 coastal cities around the world. Average annual losses for Miami ($672 million), New York ($628 million), New Orleans ($507 million), Tampa-St. Petersburg ($244 million), Boston ($237 million), Philadelphia and Virginia Beach ($89 million), and Baltimore ($76 million) ranked in the top 20 cities for flood risk in 2005. Czajkowski et al. (2013) assessed flood risk for 300,000 single-family residences in Travis and Galveston counties in Texas and found an average annual loss of $16 million in Travis County (riverine flood risk only) and $47 million in Galveston County (riverine and storm-surge flood risk). Finally, Moftakhari et al. (2017) developed a hazard index to examine the cumulative impact of frequent, small floods compared with infrequent extreme events in 11 U.S. coastal cities and counties. They found that the cumulative socioeconomic impacts of frequent, small floods are similar to or higher than infrequent extreme events in New York, Washington, Miami, San Francisco, and Seattle.
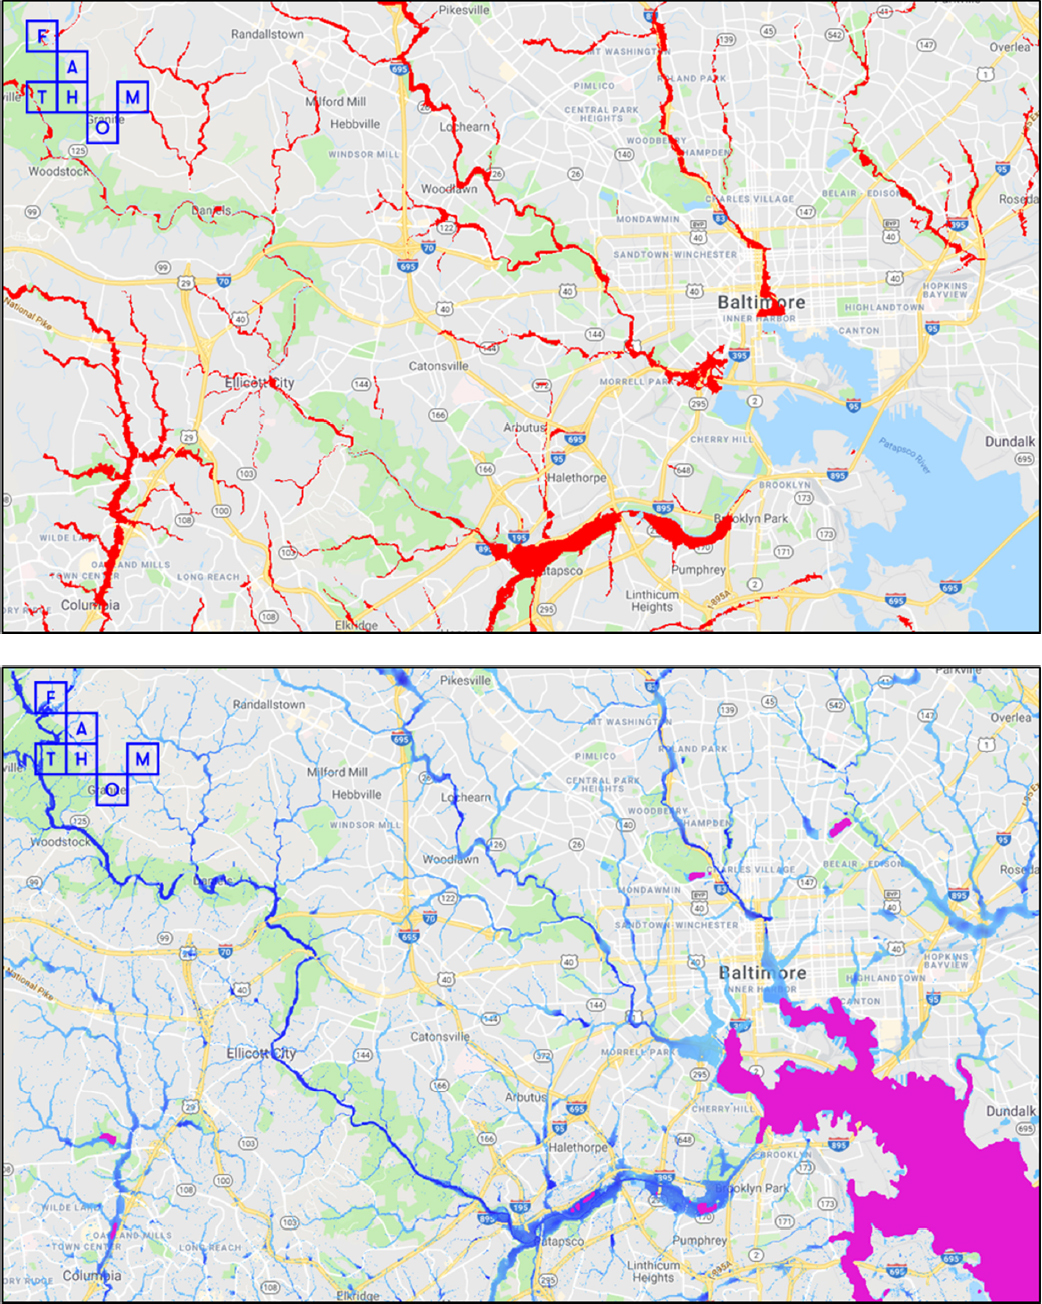
Recently, and critical for urban flooding, assessments that also explicitly consider pluvial flood risk are emerging. For example, Wing et al. (2018) characterized flood hazard using a flood inundation model that incorporates riverine and pluvial flooding in all sizes of river catchments. Their estimates of current and future flood risk for the United States also considered the effect of flood defenses and data on population, assets, and land development. The assessment found that nearly 41 million people in the conterminous United States are currently exposed to a 1 percent annual chance flood, more than triple the number in FEMA Special Flood Hazard Areas (Wing et al., 2018). The higher population figures translate to a GDP exposure of $2.9 trillion. Comparisons of flood hazard areas determined using FEMA riverine
___________________
7 See https://www.fema.gov/total-earned-premium-calendar-year.
flood studies and the Wing et al. (2018) riverine and pluvial hydrologic model are shown for Baltimore in Figure 3.5. In all four metropolitan areas, the Wing et al. (2018) model identifies more extensive floodplain than the FEMA riverine flood studies.
In addition, Wing et al.’s probabilistic assessment finds a much higher fraction of urban population exposed to flooding (4–17 percent) than the FEMA risk analysis (1–8 percent of the population; see Table 3.9).
The assessment estimates that 4 percent of the Baltimore metropolitan population, 10 percent of the Chicago metropolitan population, 14 percent of the Phoenix metropolitan population, and 17 percent of the Houston metropolitan population are exposed to flooding.
TABLE 3.9 Comparison of Population Exposed to Flooding in the Case Study Areas
| Metropolitan Area | Total Population | Estimated Population Exposure | |
|---|---|---|---|
| FEMA | Wing et al. (2018) | ||
| Baltimore | 2.8 million | 22,000 (1%) | 120,000 (4%) |
| Chicago | 9.5 million | 135,000 (1%)a | 945,000 (10%) |
| Houston | 6.9 million | 535,000 (8%) | 1,178,000 (17%) |
| Phoenix | 4.7 million | 93,000 (2%) | 648,000 (14%) |
SOURCE: Courtesy of Oliver Wing, University of Bristol, UK.
Some of the most sophisticated flood risk assessments use probabilistic modeling to represent every possible hazard scenario, including all sizes and numbers of storms, catastrophic events that occur too rarely to be captured in the historical record, and events arising from future conditions, such as climate change. Such catastrophe models are used to develop a detailed understanding of flood risk and to calculate potential losses. The development of U.S. inland flood catastrophe models is in its nascent stages. In November 2017, Lloyd’s of London and Argo Global organized a showcase to compare four U.S. inland flood catastrophe models—developed by AIR, KatRisk, Impact Forecasting (Aon), and CoreLogic9—using a hypothetical set of exposures to inland flooding across the United States. The models capture two main types of flood damages in urban areas: (1) on-floodplain losses associated with riverine flooding and pluvial flooding and (2) off-floodplain losses resulting from pluvial flooding, sediment and debris carried by excess runoff, and drainage backups.
These models are all relatively new and differ in some fundamental respects. For example, they use different types of hydrologic and hydraulic models, some use model antecedent conditions whereas others do not, they have different spatial resolutions, and the models use different vulnerability curves and modifiers. These differences lead to different modeled outcomes. For example, the modeled event losses from Hurricane Harvey ranged from $497 million (from 43,000 claims) to $986 million (from 11,000 claims), with standard deviations ranging from $46 million to $637 million (Wright, 2017). These models will be refined in the coming years and will be tested with each new flood event. In the meantime, FEMA is licensing AIR and RMS inland flood and storm surge models to analyze loss potential for the NFIP.10
Summary of Flood Risk Assessments in Urban Areas
Flood risk assessments offer a more comprehensive, but still incomplete, picture of urban flooding than historical estimates because they include a wider range of flood probabilities and additional socioeconomic factors (e.g., effect on GDP). As a result, their estimates of flood damage and population affected are higher, sometimes substantially, than estimates based on historical data. The relatively few urban flood risk assessments that have been published use different methods, model different flood hazards, make different assumptions, and produce different results. The results provide a better indication, but not yet a wholly reliable estimate, for how big the urban flood problem may be.
MAGNITUDE OF FLOODING IN THE CASE STUDY AREAS
The committee was charged with estimating the size or importance of urban flooding in each of the four case study areas (Task 2). Ideally, the estimate would be developed using a comprehensive quantitative risk assessment, including direct and indirect impacts, that has been calibrated to historical loss data. Making such estimates is not possible within the confines of this study. Consequently, the committee developed its estimates by comparing the results discussed above and summarized in Table 3.10.
___________________
9 The RMS flood catastrophe model was not included in this comparison.
10 See https://www.fema.gov/media-library/assets/documents/129784.
TABLE 3.10 Summary of Property Losses and Human Impacts from Flooding in the Case Study Areas
| Risk Assessment | Historical Property Damage | Historical Human Impacts | ||||
|---|---|---|---|---|---|---|
| Case Study Area | Average Annual Loss ($ millions) | Population Exposurec | SHELDUS Direct Property Flood Losses ($ millions) 1960–2016 |
Total Payouts, Grants, and Loans from NFIP, SBA, IA, PA, and HMGP ($ millions) 2004–2014 |
SHELDUS Fatalities/Injuries 1960–2016 |
Number of IA Awards 2004–2014 |
| Baltimore | ||||||
| Metropolitan Area | 76a | 120,000 | 82 | 11/26 | 182 | |
| Baltimore County | 12 | 38 | 5/2 | 0 | ||
| Chicago | ||||||
| Metropolitan Area | 3,300b | 945,000 | 1,241 | 26/6 | 211,565 | |
| Cook County | 659 | 1,827 | 15/0 | 182,388 | ||
| Houston | ||||||
| Metropolitan Area | 3,300b | 1,178,000 | 549 | 63/5 | 155,960 | |
| Harris County | 272 | 2,667 | 40/3 | 83,537 | ||
| Phoenix | ||||||
| Metropolitan Area | 648,000 | 160 | 26/13 | 0 | ||
| Maricopa County | 106 | 11 | 14/11 | 0 | ||
a From Hallegatte et al. (2013).
b From World Resources Institute (see Table 3.8).
c From Wing et al. (2018; see Table 3.9).
From a risk assessment perspective, the estimates in Table 3.10 suggest that average annual flood losses in both the Chicago and Houston metropolitan areas are $3.3 billion from riverine-based flooding alone, assuming 5-year flood protection is in place. In other words, in any one year across the range of probable flood events (5-year to 1,000-year riverine floods), an average of $3.3 billion in direct property damages can be expected in these metropolitan areas. If accurate, these assessments are a lower bound of urban flood losses, given that they omit losses from pluvial flooding. For example, pluvial flooding from Hurricane Harvey caused approximately $125 billion in damage, chiefly in Houston and southeast Texas (Blake and Zelinsky, 2018). Recent research has estimated the number of people exposed to both riverine and pluvial flood hazard in the case study areas (Tables 3.9 and 3.10). Wing et al.’s (2018) estimated population exposed to flooding in the four case study metropolitan areas is 120,000 people for Baltimore, 648,000 people for Phoenix, 945,000 people for Chicago, and 1,178,000 people for Houston, more than double FEMA’s estimates. All told, the available risk assessment information indicates a nontrivial economic risk in the four case study areas, with the potential to affect a relatively large portion of the country’s population.
A similar notion of substantial economic risk appears in the historical flood loss data for the four case study areas (Table 3.10). For example, for Cook and Harris counties, combined direct property damage since 1960 and total federal payouts, grants, and loans from 2004 to 2014 are approaching $3 billion in each area. The figures for Harris County would be even higher if the data range included Hurricane Harvey. The historical data also show that federal payouts, grants, and loans for Baltimore, Cook, and Harris counties are on the order of 3 to 10 times higher than direct property damage estimates (which include both insured and uninsured damages). This discrepancy suggests that a substantial portion of flood-related direct damages is to uninsured property and that this uninsured amount is not well identified by FEMA historical records. That approximately 200,000 IA grants were awarded to uninsured or underinsured households in the Chicago and Houston metropolitan areas also supports this notion.
The above interpretations come with a number of caveats. First, much of the historical data is derived from major flood events, which miss impacts from less extreme but more frequent flood events. Second, the limited number of flood risk assessments that consider a wide range of flood frequencies and intensities are likely missing a substantial portion of pluvial-based flood risk in their damage estimates, and their development requires calibration using a sufficient amount of historical data, which is currently lacking. Third, beyond the injuries and fatality data from SHELDUS, few nonproperty damages, especially indirect damages, have been included in either flood risk assessments or historical estimates. Finally, the data for different types of estimates are difficult to compare because they are collected for different purposes and have different assumptions, spatial and temporal scales, and data handling methods. For example, SHELDUS has specific assumptions of how the data are downscaled to the county level. Because metropolitan areas cover a larger area, they may have less scaling bias. Robust assessments will require more granular and integrated assessments of flood impacts.
Finding: Existing data are inadequate to provide an accurate monetary estimate of the magnitude of urban flooding. Historical loss estimates for the counties that include Chicago and Houston average $200 million per year (for 2004–2014) in each county. However, losses likely far exceed these estimates—possibly on the order of a few billion dollars per year—when pluvial flooding, uninsured property and indirect losses, declines in GDP, and the millions of urban residents exposed to flooding are considered in a flood risk assessment. Although historical flood losses are lower in the counties that include Baltimore and Phoenix (few million dollars per year), actual losses are likely much higher when the other contributing factors are considered.


