
4
A Way Forward on Urban Flooding
The committee’s third task was to relate, as appropriate, the causes and actions of urban flooding to existing federal resources or policies. Chapter 2 discusses the physical causes of urban flooding and state and local government actions being taken to manage the problem in the four case study areas and also identifies needs to better understand urban flooding and to lessen its impacts. Chapter 3 presents federal data used to estimate urban flood losses and also discusses the need for more comprehensive data. Addressing these needs requires contributions from government agencies at all levels, academic institutions, and private companies. However, in keeping with Task 3, this chapter focuses on the needs that are strongly connected to federal resources and policies. These needs are discussed in the context of the four dimensions of urban flooding: physical, social, information, and actions and decision making.
PHYSICAL DIMENSIONS OF URBAN FLOODING
A key need identified in the case study areas is a better understanding of urban flood hazard. The Federal Emergency Management Agency (FEMA) has established methods for analyzing several types of flood hazard, such as riverine or coastal flood hazard. However, methods have not yet been developed that incorporate components important to urban flooding, such as the capacity of storm water systems, or that capture the small topographic variations, local drainage patterns, and site-specific structural designs that drive the granular nature of urban flood impacts.
Finding: An established method for analyzing urban flood hazard is needed. FEMA is well positioned to take a leading role in guiding this development effort by virtue of its mission and expertise in analyzing various types of flood hazards. Important partners include local government agencies, which know their storm water systems and local land characteristics, and organizations developing state-of-the-art hydrologic or hydraulic models to evaluate urban flood hazard. Examples include academic models (e.g.,Ogden et al., 2011; Smith et al., 2015; Ward et al., 2017), and the hydrologic model developed by the city of Forth Worth (e.g., Figure 4.1). FEMA could also draw on urban flood hazard analysis methods developed in other countries (e.g., Switzerland’s Federal Office for the Environment1).
One useful approach for developing a methodology to analyze urban flood hazard is to begin with pilot projects that build and test methods in urban areas with a substantial local flood knowledge base. The lessons learned from the pilots (e.g., similarities and differences, usefulness and problems) would help inform future urban flooding studies that bring in additional aspects of flood hazard and ultimately yield a better understanding of urban flooding.
___________________
1 See https://www.swissinfo.ch/eng/water-damage_flood-map-highlights-areas-at-risk/44236596.
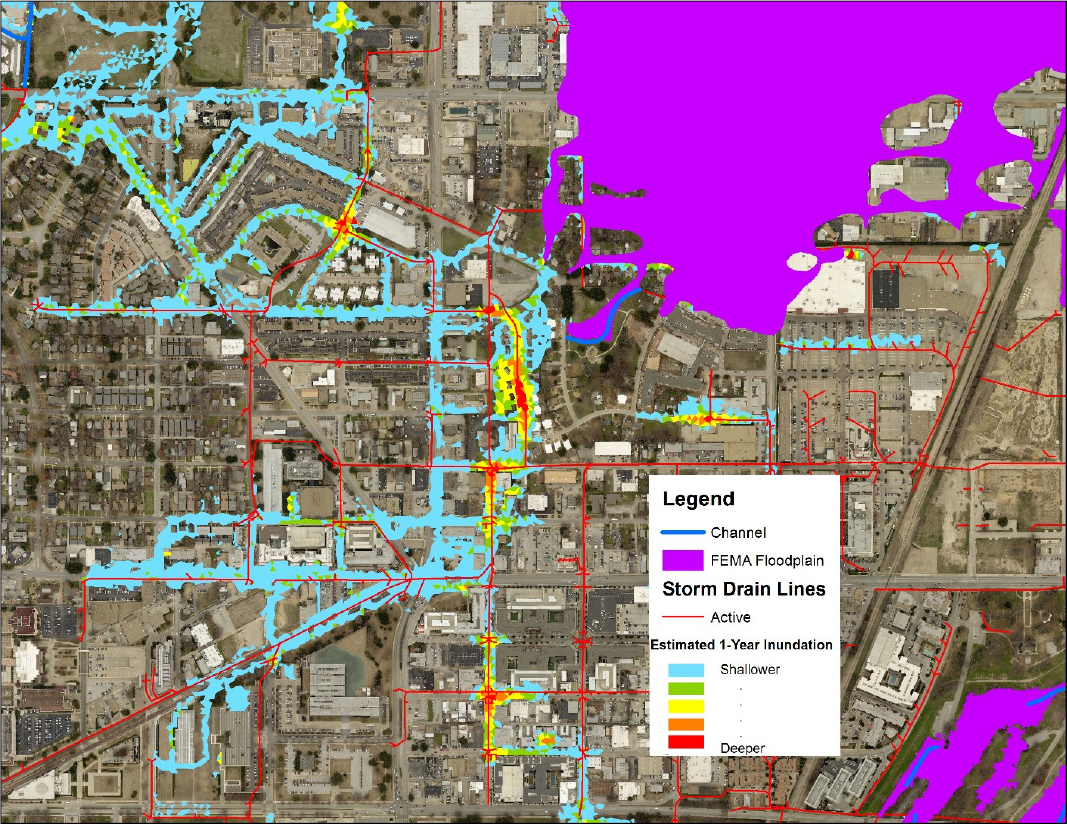
SOURCE: Stormwater Management Division, City of Fort Worth.
SOCIAL DIMENSIONS OF URBAN FLOODING
Participants in the case study workshops and interviews noted that adverse impacts of urban flooding tend to fall disproportionately on socially vulnerable populations (Chapter 2). This observation is supported by decades of research, which demonstrates that impacts from flooding tend to fall disproportionately on the most vulnerable and resource-constrained members of society, including children, the elderly, disabled, poor, and renters. Table 4.1 (and references therein) profiles populations with heightened vulnerability. Although less research specific to flood hazard impacts has been done, the findings are consistent (Table 4.1). For example, low educational attainment has been associated with a lower awareness of flood hazards. Poor, nonwhite, immigrants, and non-native English speakers disproportionally reside in flood-prone areas, but often have limited resources for flood mitigation and
recovery. Limited flood-related resources also afflict renters, the unemployed, and those with service-sector or climate-sensitive employment. Many of these groups, including the poor, disabled, homeless, and renters, often have limited access to post-flood housing. Finally, the elderly, children, chronically ill, pregnant women, and the uninsured all have heightened risk to waterborne diseases.
TABLE 4.1 Profile of Populations Socially Vulnerable to Floods
| Factor | Most Vulnerable | Vulnerability to Flood | Citation(s) | Potential Indicators |
|---|---|---|---|---|
| Age | Children, elderly |
|
Laska and Morrow, 2006; Jonkman et al., 2009; Collins et al., 2013; Muñoz and Tate, 2016 | % Children % Elderly |
| Race, ethnicity | Nonwhite, recent immigrants, undocumented immigrants, non-native English speakers |
|
Zahran et al., 2008; Adeola and Picou, 2012; Collins et al., 2013; Maldonado et al., 2016; Muñoz and Tate, 2016; | % Black % Hispanic % Asian |
| Hamel et al., 2017; Li et al., 2010 | % Native American % Nonwhite % English proficient |
|||
| Income | Poor |
|
Green et al., 2007; Masozera et al., 2007 | Per capita income % Poverty |
|
||||
| Functional needs | Disabled, homeless |
|
Hemingway and Priestly, 2014; Stough et al., 2016 | % Disabled % Social security recipients |
| Health | Chronically ill, uninsured |
|
Wade et al., 2004; Zahran et al., 2008; Lowe et al., 2013 | % Uninsured |
| Gender | Female, female-headed households |
|
Enarson and Fordham, 2000; Adeola and Picou, 2012 | % Female % Female-headed household |
| Housing tenure | Renters |
|
Laska and Morrow, 2006; Finch et al., 2010; Kamel, 2012 | % Renters Rental burden |
| Transportation | Household lacking vehicle access |
|
Colten, 2006; Bullard et al., 2008; Van Zandt et al., 2012 | % Households without car ownership |
| Education | Low educational attainment |
|
Fekete, 2009; Van Zandt et al., 2012; Rufat et al., 2015 | % High school degree |
Measuring Social Vulnerability
Modelers have developed geospatial indicators to quantify and map social vulnerability using census demographic data as proxies for characteristics such as those in Table 4.1. Aggregated indicators, or indices, are used to identify vulnerable populations, compare places, raise awareness, measure progress, and prioritize projects. The most well-known and applied index design is the Social Vulnerability Index (SoVI; Cutter et al., 2003). The algorithm takes ~20–30 demographic indicators, applies principal components analysis to reduce the indicator set to a smaller number of uncorrelated latent factors, and then aggregates the factors into an index. Both the aggregated index and the constituent demographic indicators for an area can be mapped. The index has been used for analysis and mitigation planning (Zhang and You, 2014; Frigerio and De Amicis, 2016; Roncancio and Nardocci, 2016; NOAA, 2017) and for identifying vulnerable populations and allocating resources for flood disaster recovery (SCDRO, 2017; WVDC, 2017).
An example of a SoVI map for the Houston metropolitan area, based on the populations identified in the case study workshop and interviews, is given in Figure 4.2. Maps such as these can be used in concert with maps of flood-prone areas to identify places where high flood risk and high social vulnerability coincide. These are locations where investments in flood risk reduction and capacity building may bear the most fruit.
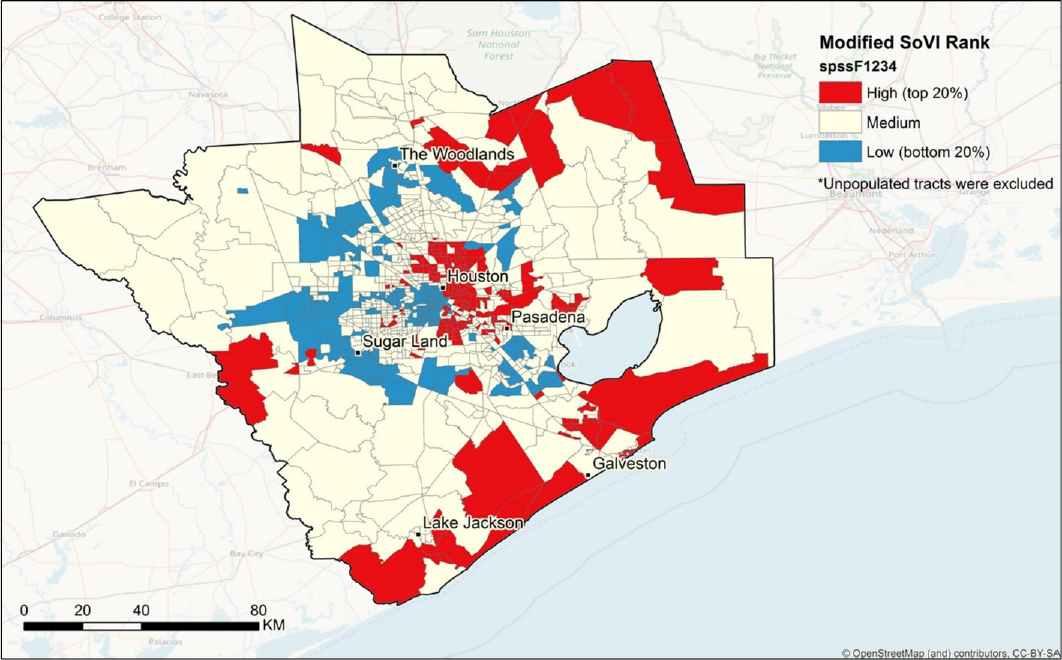
SOURCE: Based on 2011–2015 ACS data for populations identified in the workshop and interviews as being most susceptible to urban flood impacts.
The social dimensions of urban flooding are far less studied and understood than the physical dimensions. Academic studies focused on communities impacted by urban floods would yield valuable insights. Data on intangible impacts (e.g., health or community cohesion), indirect impacts (e.g., unemployment due to business interruption), and additional vulnerability drivers (e.g., risk perception and social capital) would help improve urban flood risk assessments (see Chapter 3). Data collection and analysis could also reveal ways to build effective social networks or to support civic organizations that help residents increase their social agency, capacity, and capability for adjusting to flood hazards (see Chapter 2).
Finding: Greater investments are needed to research, understand, and develop interventions to mitigate the social impacts of urban flooding and their disparate effects across populations. Such investments could be used to support both research and data collection. Although the National Science Foundation is the primary funder of social science research, other federal agencies could contribute. For example, FEMA (2013), the U.S. Army Corps of Engineers (Dunning and Durden, 2011; Durden and Wegner-Johnson, 2013), and the Centers for Disease Control and Prevention (CDC, 2015) have increasingly promoted accounting for and engaging socially vulnerable populations in the planning and response to hazard events.
INFORMATION DIMENSIONS OF URBAN FLOODING
The case study workshops showed that people want to know and understand their flood risk—the flood hazard as well as the consequences of it occurring, such as property damage and business, school, and transportation disruptions. Only then can they make decisions on preparing for and mitigating flood risk to protect their families’ safety and financial stability. The two previous sections highlight the need for information to assess urban flood hazard and social impacts and to support flood risk assessments. Another key information dimension is communicating urban flood hazard and flood risk.
Communicating Urban Flood Hazard and Flood Risk
Flood hazard and flood risk are commonly described in terms of probability, such as the 1 percent annual chance flood, also known as a 100-year flood. However, research (e.g., NRC, 2009) and the four case studies suggest that the concept of probability is often misunderstood, and that nomenclature such as “100-year flood” often leads residents to believe that a flood of that size will not occur again for another 99 years. Heat maps avoid the concept of probability by portraying flood risk in relative terms or as ranges. Such maps show some exposure in all areas, including areas where risks are generally small, and so they reflect the reality that everyone is at risk. Figure 4.3 is a heat map of the 4,917 flood-related 311 calls made in Houston from July 2017 to July 2018. Residents can call 311 to make non-emergency complaints or report problems related to city services, from potholes and graffiti to sewer backups and flooding. The map shows the highest concentration of calls in the southwest quadrant of the city along Brays Bayou, where chronic flood problems persist. Although 311 calls capture only a subset of flood incidents in an urban area, the call data are increasingly being used by city agencies to understand and mitigate urban flood-related problems. Similarly, calls to municipal 211 systems provide insights on immediate and unmet social needs, including shelter, lost income, and food.
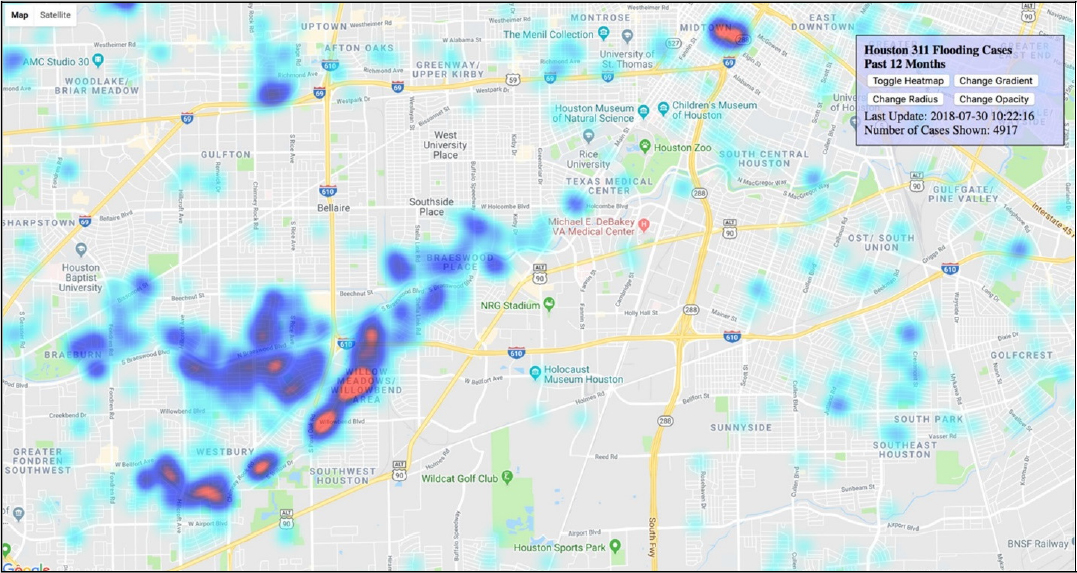
SOURCE: http://www.houstontx.gov/heatmaps/.
Maps with improved searchability or address lookup can also facilitate local understanding of flood hazard. One such example is the prototype Buyers-BeWhere,2 an online system aimed at helping prospective home buyers and sellers understand their flood hazard relative to other properties. Users can enter a street address and receive a graphic and statistical hazard assessment for that property. The flood hazard assessment is based on flood zone (from FEMA Flood Insurance Rate Maps) and neighborhood flooding (from flood claims made over the past 10 years). Figure 4.4 illustrates a property in Houston that has flooded repeatedly. A useful extension for these sorts of maps would be interactive what-if scenarios and actions for reducing urban flood risk by, for example, improving local drainage, flood proofing, and preparing for flood emergencies.
___________________
2 See www.buyers-bewhere.com.
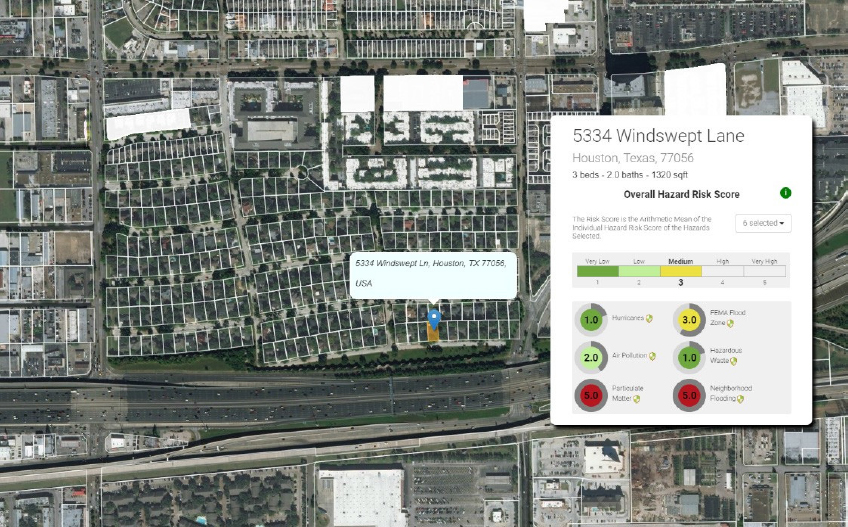
SOURCE: www.buyers-bewhere.com.
A comprehensive flood risk map would portray information on both the flood hazard (e.g., depth and extent of flooding expected under different scenarios; e.g., Figure 4.1) and the consequences of flooding (e.g., building damage and population exposure). Urban flood risk maps also need to portray other information, such as land cover, the distribution of populations, including socially vulnerable populations (e.g., Figure 4.2), the location of previous flood problems (e.g., Figures 4.3 and 4.4), and the age, design capacity, and condition of storm water networks, drainage systems, and roads. Geographic information systems offer one means for integrating these observations with predictions of flood inundation.
Finding: A new generation of flood maps and visualizations that integrate predictions and local observations of flood extent and impact is needed to communicate urban flood risk. Improved methods for updating the maps to keep pace with urbanization and climate change are also needed. Federal contributions for such an undertaking include flood hazard analysis (discussed above) and data on flood damage (FEMA), precipitation and climate change (National Oceanic and Atmospheric Administration), social vulnerability (National Science Foundation), population and demographics (U.S. Census Bureau), and information from community development grants (Department of Housing and Urban Development). Other contributors include public and private organizations developing visualization techniques, especially for flood risk.
ACTIONS AND DECISION-MAKING DIMENSIONS OF URBAN FLOODING
The four case studies highlighted both success and challenges for coordination among entities that manage urban flooding. Depending on the metropolitan area and the severity of flooding, more than a dozen organizations and agency departments may be involved in urban flood preparation, response, recovery, and mitigation. The roles of agencies and organizations in these functions are summarized in Table 4.2. As shown in the table, the roles of federal, state, and local organizations sometimes overlap, underscoring the importance of interjurisdictional coordination.
TABLE 4.2 Roles of Federal, State, and Local Government Agencies and Nongovernmental Organizations in Flooding
| Prepare | Respond | Recover | Mitigate | |
|---|---|---|---|---|
| Federal government |
|
|
|
|
| State/Local government |
|
|
|
|
| Nongovernmental organization |
|
|
|
|
The National Response Framework (FEMA, 2013) describes specific authorities, best practices, and coordinating structures for managing floods at all scales. It follows a tiered-response approach in which responses are handled at the lowest jurisdictional level capable of handling the problem. For major floods, FEMA is statutorily obligated to coordinate the mitigation, response, and short-term recovery operations summarized in Table 4.2. However, many urban floods are too small to trigger federal resources and are managed at the state or local level.
The coordinating structures described in the National Response Framework are intended to be adaptable to meet the unique needs, capabilities, and circumstances of affected communities. For example, several agencies are involved with floods in urban areas, and these agencies may include those responsible for storm water and sewer systems or for deploying tide gauges to monitor tidal flooding and sea level rise. These differences complicate federal, state, and local government agency coordination for urban flooding. Nevertheless, the high concentrations of people and assets at risk add urgency for these organizations to work together quickly and efficiently.
Finding: Stronger coordination is needed across agencies that have a role in managing small or large urban floods. Such coordination will be both vertical (e.g., federal, state, local) and horizontal (e.g., local agencies responsible for storm water systems, flood control, and removal of
damaged property; federal agencies responsible for severe storm warnings, evacuation, community redevelopment, and flood mitigation in urban areas).
CONCLUDING OBSERVATIONS
In this report, the committee found that urban flooding is a complex problem across multiple dimensions. Disparate and varying physical causes of urban flooding leave distinct impacts on different urban centers. Impacts vary across the social spectrum, with vulnerable populations at higher risk, yet less protected by insurance or the social safety net. Data and information on these causes and impacts of urban flooding are not evenly captured at various levels of government or different jurisdictions. Although it is clear that urban flooding is costly in some places (e.g., coastal cities), it is challenging to adequately quantify losses and other impacts or to focus resources for prevention and mitigation. Finally, responsibility for addressing urban flooding impacts is distributed across federal, state, and local government agencies and nongovernmental entities.
With all these complexities, it is clear that urban flooding is a distinct type of flooding and that it requires a different management approach. Multiagency and cross-jurisdictional efforts are needed to understand and manage urban flooding. Key needs identified in the case study workshops and interviews include developing a methodology for analyzing urban flood hazard and investing in research to understand social impacts and effective interventions. Both of these efforts would produce data needed to support urban flood risk assessments. Communicating that risk to the public will require new types of urban flood maps, tools, and visualizations. None of these efforts will be easy or cheap, but they are needed to address the national problem of urban flooding.


