
– 3 –
Increasing American Community Survey Participation Through Improved Respondent Communication
The two days of the Workshop on Improving the American Community Survey (ACS) differed greatly not only in content but also in the overall nature of the presentations. The Day 1 material on the nexus of administrative records and third-party data with survey data necessarily drew extensively on argument through analogy; to date, no example has surfaced of a major federal household survey whose complete operational workings have been revised to account for wider use of administrative data, so there is no way to really distill “lessons learned” from past tests and experiments. Day 2 of the workshop turned to the communication processes inherent in conducting the ACS—much firmer and more familiar ground, on which the Census Bureau and the ACS have trod for decades. But, as the workshop day would make clear, firmer and more familiar ground is not easy ground, and decisions on communication contacts and strategies can have major impacts on the quality of ACS data, the burden on its respondents, and its costs.
More succinctly, it is very much as Warren Brown (Cornell University and planning committee chair) put it, with mock exaggeration, in welcoming the audience to Day 2 of the workshop: If Day 1 is very colloquially about how “we don’t need the respondents” in light of the new alternative-data world, this
second day of the workshop is very much the flip-side. The respondent is always needed in the survey context, and so efforts to make the respondent experience as positive and effective as possible are critical to success.
3.1 OVERVIEW OF RESPONDENT CONTACT STRATEGIES
In developing the workshop, the planning committee asked to begin the session on respondent communication with a de novo description of what ACS respondents actually see and what messages they are actually given. For contrast, this overview of the ACS process was followed up with a review of Statistics Canada’s implementation of its “wave methodology” for respondent interaction and its refinement over the past several iterations of the quinquennial Canadian census.
3.1.1 Census Bureau’s Current ACS Mail and Contact Strategy
The Census Bureau staff distributed copies of the full ACS mail-material “kit” as it currently stands to the workshop audience, and Dorothy Barth (U.S. Census Bureau) commented that she was the duly appointed “tour guide” through the ACS’s current mail and contact strategy. She began with a reminder of the basic numbers and scope of the ACS sample: The ACS is sent to approximately 3.5 million randomly selected addresses (housing units) per year, with the sample divided into 12 monthly “panels” (and so contain roughly 295,000 addresses) that are each nationally representative in themselves. Each panel is then subdivided into 24 nationally representative “methods panel groups” of about 12,000 addresses each. This segmentation gives the Census Bureau and the ACS Program flexibility to allocate a small number of methods panel groups to experimental questionnaires or methods without jeopardizing the bulk of ACS production. Barth said that it also allows the Census Bureau to perform tests more quickly than if a new, separate sample had to be drawn.
As depicted in Figure 3.1, the ACS currently makes use of 5 separate mailing attempts over 43 days before a sample address is eligible for a field interview in nonresponse follow-up. All mailable addresses1 receive Mailings 1 and 2; household addresses that have responded are removed from the mail stream for Mailings 3 and 4; and, after the longest time gap in the cycle, only those households that still have not responded are sent Mailing 5. Data collection in
___________________
1 If an address is not deemed mailable, then it may still be put into processing for personal visit and completion of the interview by computer-assisted personal interviewing (CAPI). Subsequent to the workshop, the Census Bureau announced (in resubmitting the ACS for review under the Paperwork Reduction Act) that it will make the Internet response channel for the ACS applicable to all addresses, not just those in the mail stream, beginning in July 2019. Hence, a Census Bureau representative will still attempt personal visits, but they will give respondents the option to complete the ACS questionnaire online (Federal Register, October 16, 2018, p. 52190).
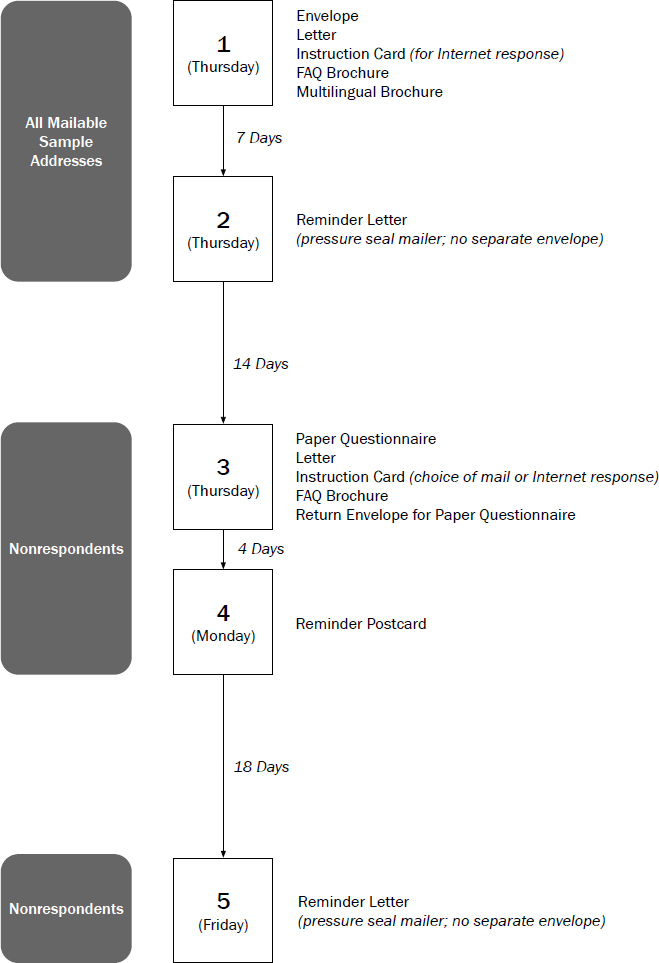
the ACS is continuous in the sense that the mailing cycle shown in Figure 3.1 is repeated with the next monthly panel of addresses with each new month, even though the final mailing and the field interviewing for the previous month continues while mailings go out to the current month’s sample.
As Barth demonstrated, Mailing 1 consists of:
- The outer envelope, austere and official-looking and prominently featuring “The American Community Survey” and “YOUR RESPONSE IS REQUIRED BY LAW” in a box to left of the address label window.
- An Internet Instruction Card, on which is sprayed the address label for the respondent household. The card is printed on 10.75"×5.6" card stock, with the front side (containing the address label) giving directions to the http://respond.census.gov/acs website in English; importantly, it is the address label that also contains the “user ID” necessary to complete the survey online. The reverse side of the card gives the same Internet instructions in Spanish, though it is spaced differently because of the absense of the address label on that side.
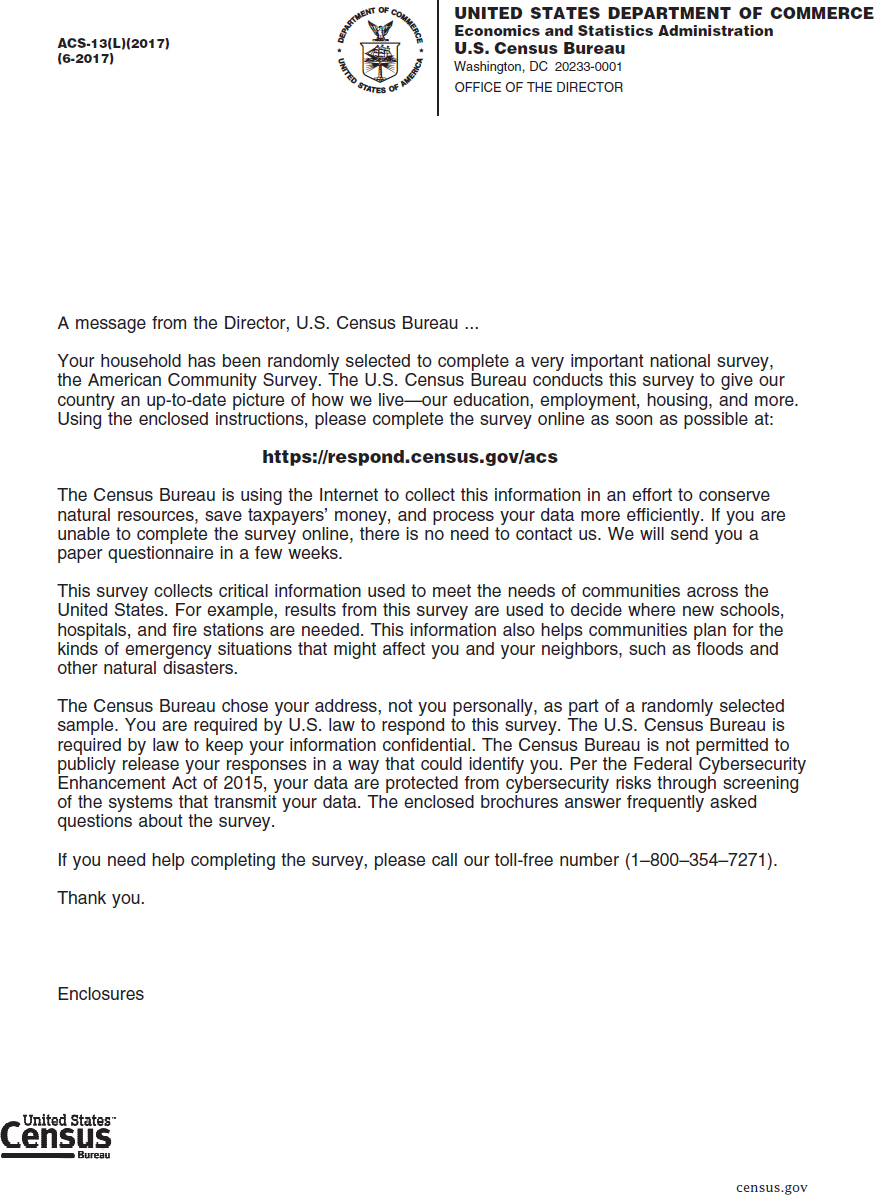
- The letter reproduced in Figure 3.2, informing the recipient that they have been selected for the ACS—or, more technically, that their address has been so selected. The initial letter includes some statements about the benefits of completing the ACS as well as some confidentiality messaging, Barth noted.
- An FAQ Brochure, in trifold format on 14"×8.5" glossy stock, with short one- or two-paragraph answers to 6 questions:
- “What is the American Community Survey?”
- “How do I benefit by answering the American Community Survey?”
- “Do I have to answer the questions on the American Community Survey?”
- “How will the Census Bureau use the information that I provide?”
- “Will the Census Bureau keep my information confidential?”
- “Where can I find more information about the American Community Survey or get assistance?”
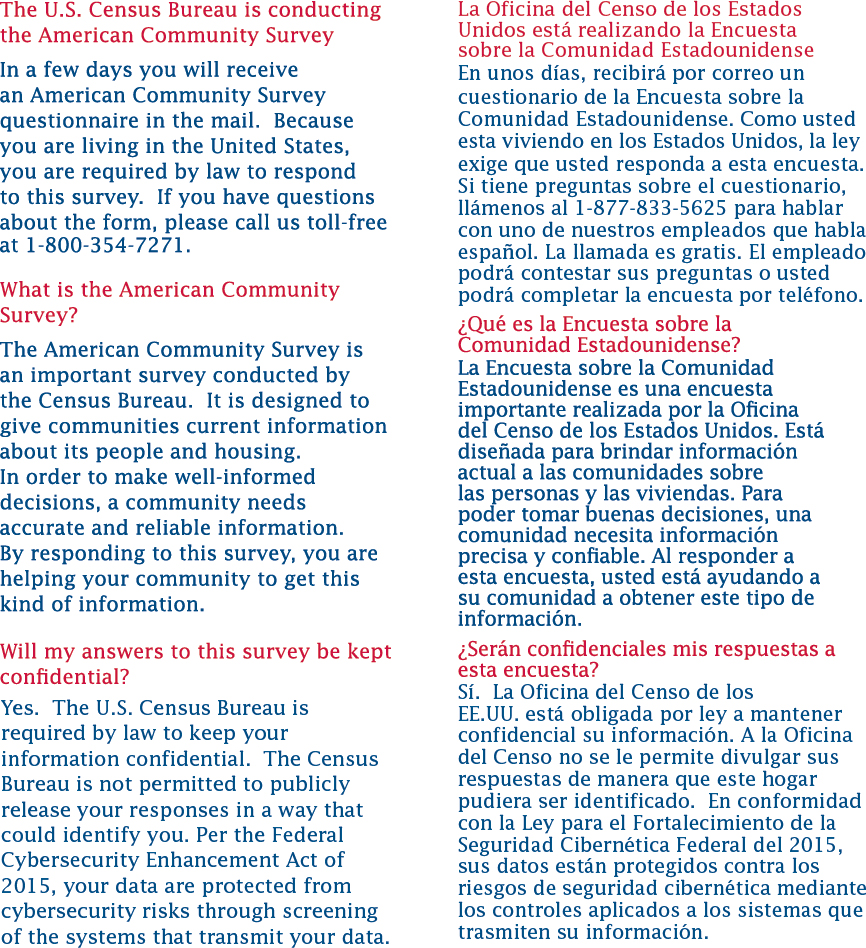
- A multilingual brochure, the English and Spanish panes of which are reproduced in Figure 3.3. It is printed on 14"×8.5" glossy stock, like the FAQ brochure, but it is folded in half twice to produce a thin brochure with 8 panes. The front “cover” pane signals that the brochure contains “Important Information from the U.S. Census Bureau”; the brochure’s panes show the text in Figure 3.3 rendered in Chinese, Vietnamese, Russian, and Korean (with the phone number given in the first paragraph of text varying by language, so that callers are routed appropriately).
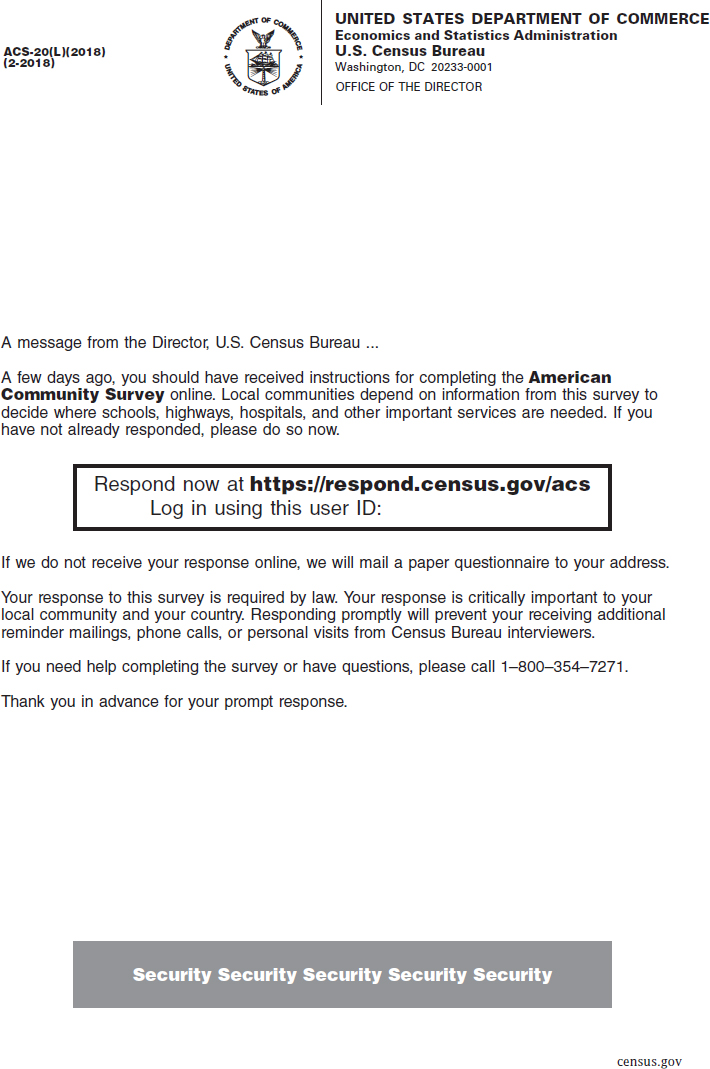
Mailing 2, sent to all mailable addresses in the sample, is a single mailing piece, bearing the text shown in Figure 3.4 but with the text aligned slightly differently. Barth said that, on the strength of 2017 testing described later in the workshop (see Section 3.2.1), the Census Bureau found it beneficial to convert Mailing 2 into a one-piece “pressure seal mailer” rather than a standard letter-in-envelope. “Pressure seal” means that the document is folded over and the three exterior sides sealed, so that the respondent removes the edges (tearing along perforations) to open the document. Figure 3.4, from the Paperwork Reduction Act approval package for the ACS, retains the formatting as a standard letter; in the new and current production version of Mailing 2, demonstrated at the workshop, the greyscale “Security” box is positioned so that it aligns with the user ID/Internet instruction box—which Barth described as a further safeguard against anyone being able to discern the user ID without opening the mailer. Barth said that the pressure seal method was economical as well as advantageous in terms of promoting response; as she noted, the 8.5"×5.5" parcel (opening to a 7.5"×10" letter) strikes respondents as “looking ‘official’ ” and feels more important with the requisite tearing off of the perforations.
Two weeks are allowed to pass for responses to come in via Internet; those responding, mailable addresses are then culled from the list and the remaining nonrespondents are sent the questionnaire mailing package, Mailing 3. This mailing consists of:
- The outer envelope, which is again austere and official looking, with a window revealing the interior address label.
- The ACS questionnaire, a 28-page booklet measuring 10.25" square, formed by folding 7 10.25"×20.5" sheets in half and stapling. The address label is sprayed on the top half of the front cover of the questionnaire booklet, folded over, for insertion into the envelope. Barth drew attention to a small box at the lower left of that front cover that contains another mention of the availability of Internet response, an icon and mention of the number to call for telephone assistance, and limited Spanish translations of the same information. The lower right pane of the cover of the questionnaire begins the interview, asking for the current date, the name of the respondent, and the basic household count.
- The follow-up letter, depicted in Figure 3.5. This letter, accompanying the paper questionnaire, is the first mention of both primary response modes to the ACS (Internet or paper), Barth said. She added that it attempts to play up the statement of benefits of completing the survey, contains some confidentiality and cybersecurity information, and “warns” the respondent that there may be follow-up by phone or personal visit.
- An Internet and Mail Response Instruction Card, very similar to the Internet Instruction Card of Mailing 1—10.25"×5.6" card stock, similar colors, English on one side and Spanish on the other—but formatted
- The same FAQ Brochure as included in Mailing 1.
- An empty, postage-paid return envelope for the paper questionnaire (measuring 10.6"×5.75" to fit the folded booklet).
differently to mention possibility of completing and returning the paper questionnaire (and because it does not have to bear the address label, as it does in Mailing 1).
Mailing 4, sent only 4 days after Mailing 3, is a basic single-piece postcard measuring 6"×4.25", shown in Figure 3.6. Barth said that the card “basically reiterates what has already been said at this point” in the process, but “we’re kind of ratcheting things up” by putting the mandatory response clause in boldface type.
Finally, after 18 days, respondent households are again removed from the mail stream and the final Mailing 5 is sent to remaining nonrespondents. As described in Mailing 2, Mailing 5 has recently been switched from a standard letter-in-envelope to a pressure seal mailer. As depicted in Figure 3.7, the Mailing 5 letter is identical in size and structure to the Mailing 2 piece; Barth noted that it retains the boldface mandatory response language from Mailing 4.
Barth closed by commenting very briefly on the rest of the ACS data collection process. Prior to October 2017, some sample households that had not
replied by mail were made eligible for computer-assisted telephone interviewing (CATI); however, as of that month (and as mentioned previously at the workshop), CATI was eliminated as a response option due to escalating cost-per-interview. Barth said that the Census Bureau approximates that the elimination of CATI will lead to 10 million fewer calls per year to ACS sample households, an appreciable reduction in burden. Barth also said that, in the further interest of burden reduction without affecting quality, personal interviewing for the ACS is also done using fewer visits. She explained that each address is assigned a “burden score” ahead of time, based on the estimated ease of contacting the household, and a maximum number of permissible visits is set based on that score.
3.1.2 Contrast: Statistics Canada’s Wave Methodology Approach for Census/Survey Respondent Contacts
Canada is the world’s second largest nation in land area, with the majority of its population (35,151,728 measured in the 2016 census) concentrated in the urban areas of the south and the majority of its land mass characterized by rural and remote communities. Accordingly, Patrice Mathieu (Statistics Canada) noted in opening his remarks, Canada is challenging terrain for censustaking, as the nation does every 5 years (in years ending in 1 and 6). Mathieu observed that the Canadian census has emerged into a multimode data collection anchored to the fixed reference point of Census Day in May (May 10, in the 2016 census). The Canadian census permits self-response by either electronic or paper questionnaire from May through July, although the objective of the census contact strategy is to promote completion of most self-response in May. Field interviewing for nonresponse follow-up occurs in June and July of the census year.
First introduced in the 2011 Census of Canada, Statistics Canada’s “wave methodology” is a plan for sequencing the delivery of messages and survey materials that Mathieu noted is based on the work of Donald Dillman (member of the workshop planning committee). As Mathieu described it, the goal of the wave collection methodology is to encourage response via the Internet while ensuring a high level of self-response overall. As prelude to describing the methodology, Mathieu discussed the methodology’s proven effects, as shown in two tables. Table 3.1 illustrates the response rates by the different possible channels in the 2011 and 2016 Canadian censuses, while Table 3.2 focuses on Internet response from its beginning on a small-test basis in 2001 through the 2016 census. Mathieu noted that all national statistics offices and survey organizations are dealing with the general current trend for decreasing response rates to surveys, but Statistics Canada is pleased to see the opposite trend. Mathieu said that he believed that Canada’s 68.3 percent Internet response rate was the highest online take-up rate achieved in a census until New Zealand’s
Table 3.1 Collection Response Rates in the 2011 and 2016 Censuses of Canada
| Collection Rate | 2011 | 2016 | |
|---|---|---|---|
| Actual | Planned | Actual | |
| Census Collection rate | 98.1% | 98.0% | 98.4% |
| Internet | 53.8% | 65.0% | 68.3% |
| Paper | 31.3% | 20.0% | 20.5% |
| Self-Response | 85.2% | 85.0% | 88.8% |
| Non-response follow-up (NRFU) | 12.9% | 13.0% | 9.7% |
| Workload at start of NRFU | 4.8M | 4.5M | 3.7M |
SOURCE: Workshop presentation by Patrice Mathieu.
| Census | Response Rates | ||
|---|---|---|---|
| Collection | Internet | Self-Response | |
| 2001 | 98.4 | — | 75.6 |
| 2006 | 96.5 | 18.3 | 78.5 |
| 2011 | 98.1 | 53.8 | 85.2 |
| 2016 | 98.4 | 68.3 | 88.8 |
NOTE: Internet collection was only done on a small-test basis in the 2011 census.
SOURCE: Workshop presentation by Patrice Mathieu.
most recent census, but it is still a mark of pride—but he conceded that the number that Statistics Canada is most proud of is the 88.8 percent overall self-response rate.
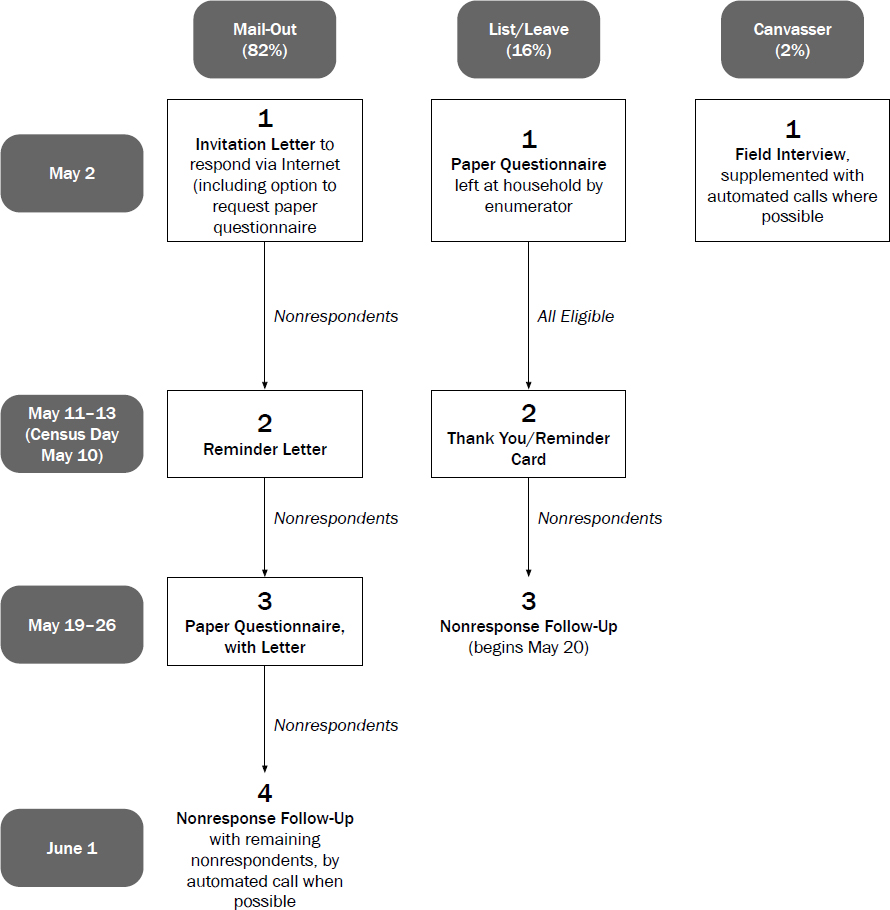
The wave methodology used by Statistics Canada in the 2016 census is illustrated in Figure 3.8; both it and Barth’s description of the cycle of ACS mailings (Figure 3.1) are redrawn slightly to be similar in style. Mathieu said that in 2016, the wave methodology “was applied more uniformly” than it had been in 2011; the earlier census had two different treatments that applied to mailout areas. In the 2016 census, there were three basic enumeration techniques used to collect the requisite information; the wave methodology focuses on the most frequently used technique, Mailout, which accounted for 82
percent of Canadian households in 2016 (and will ideally be closer to 88 percent in the 2021 census, Mathieu said). About 16 percent of households were in areas where mail delivery was deemed infeasible, typically because the mailing address could not be readily associated with a physical location (as for mail delivery to post office boxes rather than curbside). Households in these areas were enumerated through List/Leave techniques, in which a census enumerator would visit the household, add or update information about the address and its location, and leave a paper questionnaire package.2 However, under the wave methodology approach, List/Leave households are also prompted to complete the census online: List/Leave households receive an “adcard” as the second wave of contact, functioning dually as thanks to responding households and an invitation to reply electronically. The remaining 2 percent of households in the 2006 Canadian census are typically the most remote, hardest-to-contact areas, and mail delivery (or response) is wholly unviable as an option; these households are only contacted by enumerators and interviewed when contact is made, in what is dubbed Canvasser enumeration.3
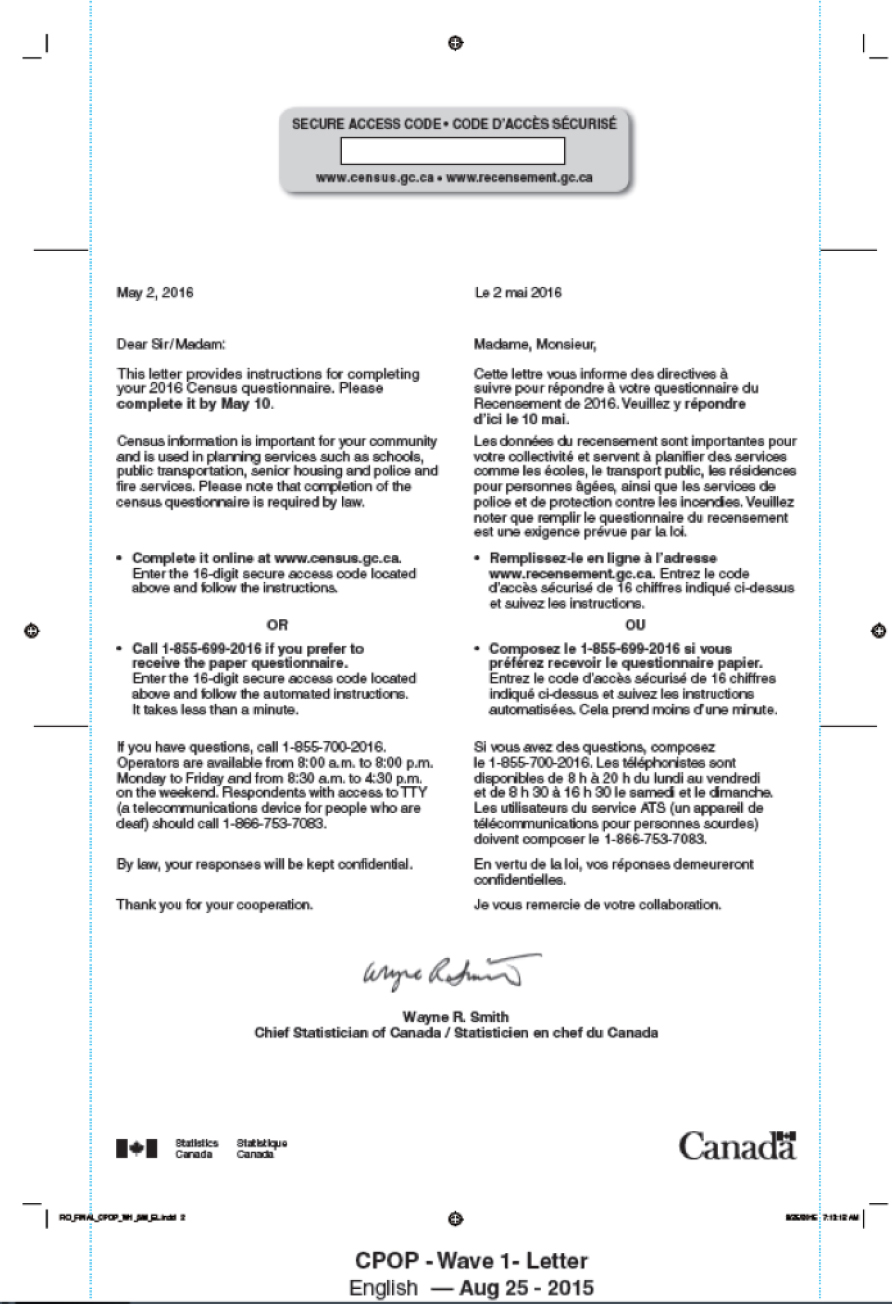
The interior and exterior of the Wave 1 mailing are shown separately in Figure 3.9 and Figure 3.10. Mathieu said that Statistics Canada needed a cost-effective way to process and send a planned 13.3 million Wave 1 letters and 8.4 million Wave 2 reminder letters—the latter “on demand,” in the sense of removing responding addresses from the mailflow—all with variable-imaged addresses and secure Internet access codes. To satisfy all those constraints, Mathieu noted that they chose a self-mailer approach, very similar to the pressure seal mailer now in use with the ACS. Just as Barth noted that U.S. research suggests that the pressure seal mailer looks more “official” to respondents, Mathieu observed that “respondents appear to pay more attention” to the self-mailer format than a traditional envelope.
Figures 3.9 and 3.10 also illustrate two subtle design points:
- Statistics Canada adheres to a rigid color palette in its printed materials and mailings and, in particular, Mathieu said that the yellow hue illustrated on the mailer’s exterior has become well known as the “census color” in Canada. He said that the color itself has become a recognized, accepted symbol of the agency and the census effort.
___________________
2 Canada’s List/Leave technique is analogous to the Update/Leave type of enumeration employed in recent U.S. censuses. In the subsequent discussion period, James Wagner (University of Michigan) elicited clarification from Mathieu about the designation of enumeration type in Canada. As in the U.S. census, the determination is based on area characteristics and is applied to whole, small areas like blocks or tracts; it is not assigned at the household/dwelling level. In the line of questioning, Mathieu clarified that the core enumeration types will continue in 2021 and that the hope is to effect a 6-percent swap: elevating from 82 to 88 percent Mailout and decreasing from 16 to 10 percent List/Leave.
3 Canadian Canvasser enumeration is analogous to the Update/Enumerate type of enumeration, and variants thereof such as Remote Alaska enumeration, used in recent U.S. censuses.

- Mathieu conceded that the Canadian census mailings look “busy”—necessarily so, because they must be bilingual, English and French. Laughingly, Mathieu noted that this is a challenge because expressions in French “always take longer” to render in French and so are frequently more difficult to fit in available space than their English counterparts, to the point that Canadian questionnaires and materials are commonly designed first in French to ensure that everything will fit. But that also serves as a strength of sorts—knowing that the material must be rendered in duplicate forces rigor and prioritization in presentation.
Mathieu presented the text of the letters used in the three wave mailings, as shown in Box 3.1.4 He said that two waves of qualitative studies (as well as the results of census pretesting) were conducted to hone and establish the content of each letter. This work established the principal goals of the letters:
- To promote the Internet response channel;
- To encourage respondents to respond quickly;
- To achieve the best transition of messages, from benefits to legal aspect; and
- To be the least cluttered as possible.
The text and tone of the letters, and the way in which they address the legal requirement to complete the census in particular, was the focus of considerable attention in the discussion period following the presentations (Section 3.1.3, below).
Mathieu also noted that the national public communication program for the 2016 census was closely aligned with the wave methodology approach, reinforcing the main messages at each wave and changing them over time. Mathieu said each wave was accompanied by dominant messaging cues:
- Wave 1, the big kick-off initiated on May 2, very deliberately does not play up the mandatory nature of the census, Mathieu said (though the “Complete the census—it’s the law” appeal does still appear on the mailing exterior, as shown in Figure 3.10). Instead, the messages that are chosen to dominate are the “quick, easy, and secure” nature of census response (in a media advisory). The program of television and radio advertising in Wave 1 emphasizes the reasons why the census is important, arguing that “what’s really arriving in the mail is a chance to shape where you live,” according to Mathieu. The Wave 1 letter proposes a deadline for census response (“Please complete it by May 10”).
- Wave 2, beginning May 11, begins to play up the required-by-law nature of the census. The proposed deadline for response having now passed, Mathieu said that they did not want respondents to think that “there’s no
___________________
4 The Census Questionnaire Response referenced in the letters is an automated phone line; an option is provided for respondents to key in their ID from the form to receive a paper questionnaire.
-
point to completing the census now”—so the message stressed in media advisories for Wave 2 is “it’s not too late.” The reminder letter does not mention the previous deadline but both it and the exterior “envelope” of the mailer urge: “Complete it today.” The exterior of the mailing adds the appeal that “Delays increase census costs for every Canadian,” while the advertising program repeats the “what you’re really doing is shaping where you live” pitch.
- For Wave 3, beginning May 19, the messaging becomes blunt; Mathieu noted that the exterior of the mailing attempts a deliberate jolt to action with the prominent tag “2016 Census: Final Notice.” As became a point of discussion, the accompanying letter takes a hard line with the “required by law” message and, significantly, alludes to legal consequences of not answering. The television and radio ads in Wave 3 urge: “Please take the time to complete your 2016 Census, using the package you received in the mail.”
Mathieu illustrated the performance of the approach with the graph of daily response rates shown in Figure 3.11 and the table summarizing response rates shown in Table 3.3. He said that the basic features of the figure are very clear: a very sharp initial spike in interest and response when the mailers first arrive, followed by a bit of a drop-off, and then a big spike around the well-publicized Census Day itself. The boxes along the bottom of the graph in Figure 3.11 show what Mathieu described as the impact of Waves 2 and 3, some bursts of additional response amidst the strong general decreasing response levels. He noted that the self-response channels remain open through the whole nonresponse follow-up (NRFU) period, which is why there are still mild upticks visible late in the time series. He added that the “notice of visit” cards that enumerators leave at the door of NRFU households include mention that they can still self-respond/reply online. In Table 3.3, Mathieu drew particular attention to the first two numbers in the Internet response column. The List/Leave areas are primarily rural, but they still returned a higher-than-expected 23.6 percent via the Internet. Mathieu said that this success has Statistics Canada considering ways to improve on Internet take-up in 2021, perhaps by dropping a letter with Internet response options in lieu of a full questionnaire package; the challenge is doing so while still providing a mechanism for getting questionnaires to households that truly need them to participate.
Various threads of the presentation, and strengths of the Canadian approach, came together in a humorous moment in Mathieu’s presentation—when discussion of differences between Internet response in 2011 and 2016 obliged him to mention the moment when the 2016 census experienced what could have been a serious stumbling block. The 2011 census materials deliberately used slightly looser deadline text in order to diffuse the processing load of Internet
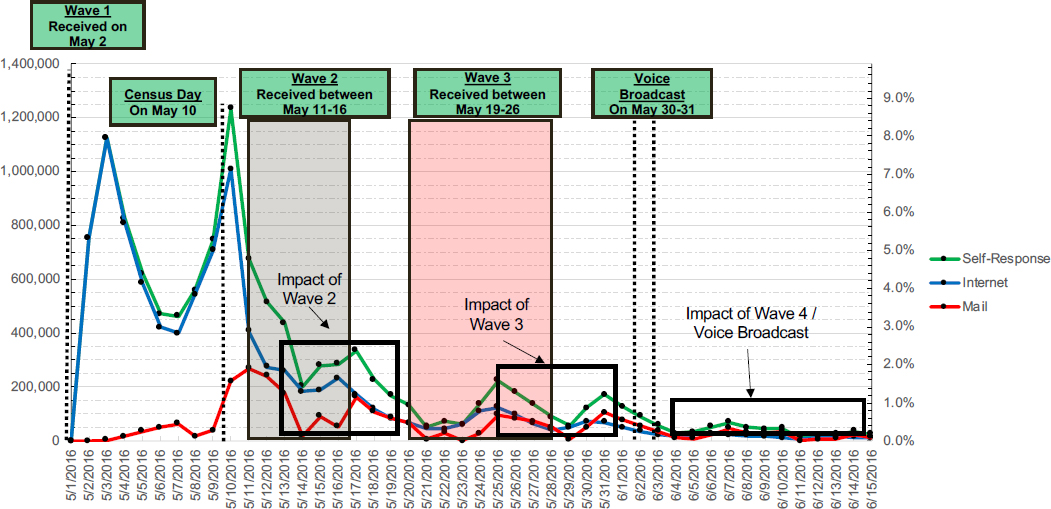
Table 3.3 Response Rates by Collection Methodologies, 2016 Census of Canada
| Method | Self-Response | Interview | Nonresponse | Total | |||||
|---|---|---|---|---|---|---|---|---|---|
| CHL | NRFU | Total | |||||||
| Internet | Total | Field | CSU | ||||||
| Mail-Out | 12.7 | 76.2 | 89.0 | 1.1 | 7.4 | 0.9 | 9.4 | 1.6 | 100.0 |
| List-leave | 64.1 | 23.6 | 87.7 | 0.5 | 9.3 | 1.3 | 11.1 | 1.2 | 100.0 |
| Subtotal | 20.5 | 68.3 | 88.8 | 1.0 | 7.7 | 1.0 | 9.7 | 1.5 | 100.0 |
| Canvasser | — | 0.2 | 0.2 | 0.0 | 92.1 | 0.0 | 92.1 | 7.7 | 100.0 |
| Total | 20.3 | 67.6 | 87.9 | 1.0 | 8.5 | 1.0 | 10.5 | 1.6 | 100.0 |
NOTES: CHL, Census Help Line (telephone); CSU, Collection Support Units (outbound telephone call operations from census local offices); NRFU, nonresponse follow-up.
SOURCE: Workshop presentation by Patrice Mathieu.
response over time, inasmuch as the 2011 census was going to be the first to take on Internet response at full scale. The materials asked households to reply “within 10 days” in 2011. Leading up to 2011, Mathieu said that “our system planners were more confident that the systems could handle the load” and manage a spike of responses on Census Day, hence the 2016 wave methodology’s emphasis of “by May 10” as a deadline. “So, of course,” Mathieu noted with a laugh—“the systems crashed on Census Day.” Indeed, the online response system had to be suspended briefly during peak demand. Statistics Canada publicly responded, quickly, with good humor—gently encouraging “Canadians being too responsive” to take a short break—while also reassuring that their data were secure and nothing had been lost. In this way, Statistics Canada was able to parlay a brief, major stumble into very positive messaging—and “that really helped us” get the higher self-response rates.
Mathieu attributed the increase in self-response in 2016, relative to the 2011 Census, to a variety of factors. Active support and promotion of online response (and electronic services, generally) following the Canadian federal election in 2015 undeniably created “favorable conditions” for census self-response, Mathieu said. Another success factor was applying the same treatment and sequence of mailings to Mailout areas. In 2011, roughly one-quarter of Mailout dwellings had received a paper questionnaire package at Wave 1, and—consistent with the Census Bureau’s experience in testing “Internet Push” versus “Internet Choice” methods—some respondents who might otherwise respond electronically will use paper if the paper questionnaire is in hand. Mathieu said that Statistics Canada’s research estimated that 25 percent of the improvement in self-response from 2011 to 2016 could be attributed to the simple change to Internet-only at Wave 1. Other success factors mentioned by Mathieu included the expansion of the Mailout group to include a bigger share of the population, the unified messaging of the census communication strategy, and the revised content of the data collection materials (including the Wave 1 letter).
Mathieu also briefly summarized two related lines of response-mode testing that Statistics Canada had engaged in prior to the 2016 census.
- Table 3.4 illustrates the basic results of a “live test” conducted as an experiment in line with the 2011 census. As mentioned earlier as a success factor in 2016, the 2011 Canadian census still sent a full paper questionnaire to a segment of the Mailout population rather than just a letter—these “Group 2” (G2) dwellings being thought to be of lower connectivity and hence lower propensity to respond by Internet. The 2011 census “live test” was a panel of addresses for which the letter and questionnaire treatments were administered against type to some households: A subsample of G2 respondents received the letter/Internet instructions only while a subsample of “Group 1” (G1) respondents (who would otherwise get the Internet instructions only) were mailed the paper
Table 3.4 Impact of Wave 1 Letter/Response Option Choice, Live Test in 2011 Census of Canada
| Method | Response Mode | |||||
|---|---|---|---|---|---|---|
| Internet | CHL | NRFU | Nonresponse | Total | ||
| General | ||||||
| G1—Letter at W1 | 16.3 | 71.6 | 0.7 | 9.1 | 2.3 | 100.0 |
| G2—Questionnaire at W1 | 50.1 | 25.8 | 0.8 | 20.0 | 3.4 | 100.0 |
| Live Test—Switch Methodology | ||||||
| G1—Letter at W1 | 16.3 | 71.6 | 0.7 | 9.1 | 2.3 | 100.0 |
| G1—Questionnaire at W1 | 53.3 | 32.3 | 0.5 | 11.6 | 2.4 | 100.0 |
| G2—Letter at W1 | 23.4 | 57.3 | 1.1 | 15.3 | 3.0 | 100.0 |
| G2—Questionnaire at W1 | 50.0 | 25.5 | 0.8 | 20.3 | 3.4 | 100.0 |
NOTES: CHL, Census Help Line (telephone); NRFU, nonresponse follow-up.
SOURCE: Workshop presentation by Patrice Mathieu, reformatted to single table.
-
questionnaire. In the experimental G1 group that got the questionnaire, receiving the paper form was apparently a strong impetus for returning the paper questionnaire rather than completing the questionnaire online. The results for the G2 experimental group that received the letter at Wave 1 were important to the shape of the 2016 wave methodology—achieving a close-to-60 percent Internet group amongst a segment that had been deemed to be unlikely to respond by Internet.
- Statistics Canada ran a study on preferred mode of response in its 2014 census test. Mathieu summarized that test by briefly recounting some of the observations Statistics Canada had drawn from it: that contact mode is a key factor in the choice of a response mode used by a household and that contact mode choices affect households with weaker preferences more than those with stronger preferences. They found that preferences for Internet response tend to be more fluid than for paper—and that strong preferences for paper questionnaires by some respondents are “really sticky” and hard to overcome. He said that in the context of a multimode collection strategy, the method of initial contact does not seem to reduce self-response in general, as long as the respondent’s preferred mode is offered. From this work, he said, Statistics Canada concluded support for a multimode collection strongly directing respondents to use online response, while still offering a paper alternative.
Heading towards the 2021 census, Mathieu commented that Statistics Canada is aiming to reduce the amount of paper that it uses even more—-
studying, in particular, the previously mentioned use of an invitation letter (in lieu of a paper questionnaire package) for some List/Leave areas and the utility of including a paper questionnaire by default in the Wave 3 mailing. The wording of the Wave 1 and Wave 2 letters is being revised to encourage a try at online response before requesting a paper questionnaire. And, building off of 2016 successes, Statistics Canada is seeking ways to make its communication and media strategy for the 2021 census “more targeted” in nature.
3.1.3 Discussion
Darby Steiger (Westat) asked what either the Census Bureau or Statistics Canada knows about how Internet response varies by platform (phone, tablet, computer). Debbie DiLeo (Census Bureau) responded, based on research she has been doing on the topic using January 2018 ACS data. In that month, 50 percent of returns were obtained by Internet and 25 percent each by mail and CAPI/field interview. Of the Internet responses, in unweighted data, 75 percent were computer, 10 percent tablet, and 15 percent phone. Mathieu recalled that Internet response in 2016 was about 80 percent computer, 14 percent tablet, and 6 percent phone. He added that, when respondents break off entry in electronic mode and resume later, it is usually to go with a “larger” format—from phone to tablet or from tablet to computer—and not the opposite. This leads them to surmise that the census form might still be too unwieldy for some users to handle by cellphone. Statistics Canada has also found that completion times for questionnaire tend to be shorter on mobile devices, an effect that they are still working to explain.
Don Dillman (Washington State University) asked whether either party knows much about the demographics of respondents who continue to choose paper versus those who respond online—and whether any sign that the major demographic gaps circa 2007–2008, when the big push to Web-based interviewing began, have closed. Mathieu replied that the gap has not closed in Canada: households that actively seek out the paper questionnaire tend to be older and larger. His organization’s sense is that making the paper option more scarce (requiring effort to obtain) will probably only serve to reinforce those differences.
Tack Richardson (MITRE Corporation) asked Mathieu whether Canada has studied the effects of its media/communication campaigns concerning the census. Mathieu indicated that they had but that media effects are always difficult to sort out with confidence; it is difficult to know what part of increased response would only have come about through communication messages, independent of the wave methodology and other improvements. Statistics Canada has tried to have a stronger social media presence and target key population groups with its media messages, generating interest in the census.
Brian Harris-Kojetin (Committee on National Statistics) asked Mathieu about continuum of wording across the three letters shown in Box 3.1. Knowing that the ACS Office has been doing work on softening the language about mandatory response or possible penalties (as discussed later in Section 3.2.1), he was interested in Canadian experience with piloting and testing (qualitatively or quantitatively) the apparent escalation of rhetoric in their letters—to the point that the Wave 3 letter comes close to threatening referral for prosecution. Mathieu answered that they had done extensive qualitative testing “before, during, and after” both the 2006 and 2011 censuses on those legal cues. Qualitative, focus-group-type work with late-responding census households found them to be more understanding of the Wave 3 letter language than threatened by it; they generally concede that they knew that response was required, and they understand why that language is there, so they do not find it rude or off-putting (even though little more than 2 weeks would have passed since Census Day, when they see that language). Mathieu said that they find that very few nonrespondents are acting out of animus toward the government or hostility to the census effort, but fail to respond for more innocuous reasons such as having busy schedules. Harris-Kojetin asked whether Canada has experienced anything like the ACS has in terms of complaints—letters to government ministers or members of Parliament. Mathieu noted that every Canadian census is accompanied by complaints from some members of Parliament that Statistics Canada has to work through. Later, Dave Waddington (Census Bureau) asked whether Canada has actually followed through on prosecution for census nonresponse. Mathieu said there have been hundreds of cases (though almost certainly less than 1,000)—but the process is slightly complicated by the inability to prosecute an address, but rather having to prosecute someone. Getting to that next step requires demonstration that Statistics Canada has made multiple contacts with a specific person, has explained the consequences for nonresponse, that the specific person is aware of those consequences, and that he or she still declined to respond. Past Canadian census law made it possible for persons to be jailed for nonresponse to the census, but that has since been removed, and Mathieu said that action never resulted in incarceration.
In later discussion, Barth returned to the side-by-side presentation of letter text (Box 3.1), commenting to Mathieu that the letters struck her as text-dense, with the eye tending to follow the clauses in boldface type. Contrasting with the ACS experience where just putting “your response is required by law” in bold type could increase response rates by 3–4 percentage points, she observed that the Canadian census letters never call out the mandatory-response language in bold type and asked if Statistics Canada had tested that variant?. Mathieu could not recall whether that specific variation was tested. He also noted that the side-by-side rendering of the text is not exactly how they appear in the printed product, and the different typestyle and arrangement on the final
letters could have an effect. Dillman added that a lot of testing surrounded the development of the U.S. census mailing package language of “your response is required by law” in the 1990s; it gave a bigger increment of response than any of the other design changes being considered. Itwas a two-pronged main message: the envelope conveyed the requirement, but the letter attempted some explanation of why response is required by law. Observing that such an explanation seems to be missing in both the ACS and the Canadian census materials, he asked why that is the case. Barth said that part of the new approach (discussed later in the workshop) on softening the mandatory-response language is intended to play up the “why,” which is the importance to the community. She said that it has always struck the ACS designers as difficult and “wordy” to attempt the explanation that “this used to be the long form,” and that they do not know whether the respondent would be attuned to or interested in that reasoning. The Bureau is considering the language for the FAQ brochure or back-of-the-letter parts of the ACS mailings. Mathieu noted that the broader communications strategy around the Canadian census has played up the benefits and the importance to the community. He is interested in testing that kind of message in the letters.
Jonathan Schreiner (Census Bureau) commented that he is usually a proponent of having one or more big differences in the various mailings a respondent sees—mainly common features in order to provide a unified appearance, to be sure, but some visual or wording differences to make each piece seem important as a new communication. He said he was struck that Canada seemed to use the same external appearance on the mailings in Wave 1 and Wave 2—and had success with it—and so asked about the testing that led to the decision to keep so much the same. Mathieu answered that part of it is operational—the same printer handles the Wave 1 and Wave 2 letters, so it is easiest on that score to keep the physical appearance consistent. He agreed that visual differences can stimulate interest, but that the opposite effect could also be argued as being strong—similarity in presentation and method can stir remembrance of something that had just slipped the mind on the first approach. Similar to the point he made in addressing Harris-Kojetin’s question, Mathieu suggested that Wave 2 nonrespondents were often “easy” cases to handle in that they tended to be people who forgot or did not have time to complete the questionnaire, and that they were not withholding response due to some hard-set concern. Mathieu also noted subtle differences in the exterior of the mailing packages, across the waves in the 2016 census and certainly between the 2011 and 2016 censuses. For instance, one of the later mailings in 2010 explicitly printed “Reminder” on the exterior, while 2016 changed the language on the exterior of the final mailing to read “Final Notice” in a way that had not been done in 2011.
Cynthia Clark (formerly, U.S. Census Bureau) asked both speakers about testing that led to the compact schedule/quick-burst mailing in the Canadian
approach and the comparatively more spread-out sequence of contacts in the ACS. Barth replied, on the ACS side, that the major difference is that the Canadian wave methodology is primarily focused on a one-shot census effort, while the ACS tries to spread effort out as a continuous measurement exercise. Mathieu agreed, adding that the Canadian census is very locked into a tight schedule—Census Day has to be in May for a number of reasons (weather, and accessibility earlier in the year, among them), but data collection has to be quick lest it conflict with summer vacations and travel. Clark followed up by asking to contrast the seeming escalation/building of messages across contacts in the Canadian approach, while the ACS approach seemed to be striking the same message themes in each of the contacts. On the ACS side, Barth noted that this would be a major focus of the afternoon’s presentations later in the workshop.
Jenny Genser (Food and Nutrition Service) commented that one reason for the high response rates in the Canadian census is that it was a census, making use of the increased publicity and awareness surrounding such a nationwide effort, while fewer people are aware of an ongoing survey like the ACS. Mathieu said that, even on the quinquennial cycle, not everyone is as aware of the census in Canada as one might expect. Statistics Canada has a good reputation, as a centralized agency for all the nation’s business, health, and population statistics, which helps; the communication strategy around the census certainly helps as well. But he said that Statistics Canada had managed to achieve response rates of 80 percent or higher even in testing in 2014, which argues for the methodology having a major effect.
Michael Schober (New School for Social Research) asked whether the Census Bureau or Statistics Canada has researched, whether in the field or “in the lab” in cognitive testing environments, what people actually read and remember in census and survey mailings. Barth said that she has conjectures but not evidence; the ACS materials are text-dense, and that kind of insight is front-and-center to her as the ACS works to redesign its messages. Mathieu said Statistics Canada does qualitative testing before, during, and after the censuses, trying to walk through the whole census process—akin to “pretend it’s May 2 and you receive this in your mailbox, what do you do?”—and talk through their thoughts in reviewing the mailing contents. The work runs the gamut of possible reactions, from people intently reading every word to people ignoring all instructions, to people responding to any direct call-to-action as a demand (if a phone number is given, they will try to call the number). But his sense is that most respondents are looking for instruction/direction or requirements (e.g., deadlines) rather than weighing the strength of any particular arguments or appeals. This point about collecting feedback about what respondents actually process in mailed messages would recur, in some detail, later in the workshop; see Section 3.4.5.
3.2 ACS TESTING ON RESPONDENT CONTACT STRATEGIES
3.2.1 Overview of ACS Tests to Boost Participation Through Improved Communication
Elizabeth Poehler (U.S. Census Bureau) summarized five major tests conducted on the ACS mailing materials since the 2016 workshop, noting the tests shared two overarching objectives: to improve self-response rates as much as possible by streamlining the materials where appropriate and to be responsive to both respondent and stakeholder concerns about the nature and tone of the mandatory-response language in the materials.
Of the Pressure Seal Mailer Test, Poehler would note that “you’ve already seen where we came down on that.”5 To explain how and why the format of two of the ACS mailings changed in late 2018, Poehler noted that the ACS has tested pressure seal mailings because they are less expensive to assemble than stuffing traditional letters into envelopes. But they were more drawn to the format because it has become recognized in the general public as an “official mailer” and one used for confidential material: the perforated, tear-off-strip format used for mailing personal identification or PIN numbers, confidential results, report cards, and other sensitive information. An added benefit of the pressure seal mailer format is that it is enclosed, making it viable to transmit Internet questionnaire access ID (considered personal information, as unique to the household) in a way that a simple postcard cannot.
Poehler summarized the experimental design and basic results of the Pressure Seal Mailer Test in three tables, shown as three panes in Table 3.5. All addresses in the test were sent the usual Mailing 1 and 3 materials as appropriate, with the variation being whether Mailings 2, 4, or 5 were sent in the then-standard letter or postcard format or whether they were sent in the new pressure seal mailer format. (A subtle but important point in the first pane of the table, given the later adoption of the format—most of the experimental materials in 2017 utilized a trifold pressure sealer mailer, while the Census Bureau ultimately decided to use the less-tested-in-2017 bifold format.) Turning to pane (b) of the table, Poehler noted that the pressure seal mailers did not have any impact on self-response overall before CAPI. However, restricting attention to self-response rates among those continuing nonresponse households who received Mailing 5, the pressure seal mailer format in Mailing 5 had a significantly higher response rate than the postcard format, with most of that coming through Internet response. Admittedly, Poehler said, the size of that subset was sufficiently small that the mailer format did not have a sizable effect overall, but the test offered hope that an added official-looking boost at the very end might still help.
___________________
5 For additional detail on the test and the detailed results, Poehler directed participants to https://www.census.gov/library/working-papers/2018/acs/2018_Risley_01.html.
Table 3.5 Experimental Design and Results, 2017 American Community Survey Pressure Seal Test
| (a) Experimental Design | |||
|---|---|---|---|
| Mailing 2 | Mailing 4 | Mailing 5 | |
| Production | Reminder Letter | Reminder Postcard | Additional Reminder Postcard |
| Treatment 1 (Control) (≈24,000 addresses) | No change | No change | No change |
| Treatment 2 (≈48,000 addresses) | Pressure seal (trifold) | No change | No change |
| Treatment 3 (≈48,000 addresses) | Pressure seal (trifold) | No change | Pressure seal (trifold) |
| Treatment 4 (≈24,000 addresses) | Pressure seal (trifold) | Pressure seal (bifold) | Pressure seal (trifold) |
| (b) Self-Response Return Rates (Before CAPI/Field Follow-up) | ||||||
|---|---|---|---|---|---|---|
| Treatment 1 (Control) | T2 | T1 vs. T2 P-value | T3 | T1 vs. T3 P-value | T4 | T1 vs. T4 P-Value |
| 53.0 (0.4) | 52.7 (0.3) | 0.57 | 53.4 (0.3) | 0.45 | 52.6 (0.4) | 0.46 |
| (c) Self-Response Return Rates (Before CAPI/Field Follow-up) for Those Mailed Mailing 5 | ||||
|---|---|---|---|---|
| Response Mode | Pressure Seal (T3) | Postcard (T2) | Difference | P-Value |
| Total Self-Response | 19.3 (0.4) | 17.9 (0.4) | 1.4 (0.6) | 0.02∗ |
| Internet | 11.2 (0.3) | 9.6 (0.3) | 1.7 (0.5) | < 0.01∗ |
| 8.0 (0.3) | 8.3 (0.3) | −0.3 (0.4) | 0.45 | |
NOTES: T1, Treatment 1 (and so forth). Standard errors are in parentheses. Significance tested based on two-tailed t-test at α = 0.1. In the test, Mailing 1 was the usual (production) initial mailing package and Mailing 3 the usual questionnaire package, as described in Section 3.1.1.
SOURCE: Workshop presentation by Elizabeth Poehler.
Accordingly, Poehler said, the Pressure Seal Mailer Test showed no impact on self-response of using the new format, overall. Cost analysis suggested that implementing the pressure seal mailer format in Mailing 2 would be cheaper than continuing to use traditional letters/envelopes, and that replacing the postcard in Mailing 5 would be “close to cost neutral.” Accordingly, she said, the Census Bureau opted to take the cost benefits without impeding response, implementing pressure seal mailers for Mailings 2 and 5 starting with the September 2018 sample panel.
The Mail Design Test field-tested three bundles of revisions to the ACS mailing materials, that had been developed and refined since preliminary versions were tested in 2015. The new treatments were meant to use a friendlier and more conversational tone in the ACS mailings, staying positive by emphasizing the benefits of participating in the survey, and reducing burden through the removal or combination of materials in the mailings.6 Specifically, the Mail Design Test focused on three experimental treatments:
- The Softened Revised Design used deliberately softer language: “Your Response is Important to Your Community” rather than “Your Response is Required by Law.” It also included some modification to envelope, letters, and postcards.
- The Partial Redesign implemented the same softening of the mandatory-response language, and it used a letter for Mailing 5 rather than a postcard. Importantly, it emphasized the benefits of ACS response through inclusion of a glossy, brightly colored, one-sheet brochure titled “How Your Responses Help America”—conveying a great deal of “Why We Ask” information in accessible format. It also removed and combined some materials, notably removing the FAQ brochure (but incorporating some of its content on the back of the letter). Finally, it used a modified front page on the ACS questionnaire itself, under the theory that the questionnaire might be the main thing or even the only thing that a respondent might pull from the envelope; the new front cover placed more information about the ACS on that front sheet.
- The Full Redesign did all the same things as the Partial Redesign, but also made changes to the envelopes, letters, and postcard.
The results of the Mail Design Test are shown in four panes in Table 3.6. From pane (a), Poehler observed that all three experimental treatments had significantly lower response rates than the control group, reinforcing the message that “softening the mandatory response language doesn’t do us any favors” in terms of response rates. This shifted the study’s main interest towards comparing the three new treatments against each other. Pane (b) of the table
___________________
6 Poehler noted that the results of the Mail Design Tests, and the Adaptive Strategy test described next, were to be made available shortly at https://www.census.gov/programs-surveys/acs/library/publications-and-working-papers.html.
Table 3.6 Results, American Community Survey Mail Design Test
| (a) Final Response Rates | |||
|---|---|---|---|
| Treatment | Rate (SE) | Experimental − Production | P-Value |
| Production (Control) | 94.3 (0.3) | — | — |
| Softened Revised Design | 93.3 (0.3) | −1.0 (0.4) | 0.02∗ |
| Partial Redesign | 93.0 (0.3) | −1.3 (0.4) | < 0.01∗ |
| Full Redesign | 92.6 (0.4) | −1.7 (0.5) | < 0.01∗ |
| (b) Partial Redesign vs Softened Revised Design | ||||
|---|---|---|---|---|
| Point in Data Collection Cycle | Partial Redesign | Softened Revised Design | Difference | P-Value |
| After the first two mailings | 19.0 (0.3) | 20.3 (0.3) | −1.3 (0.5) | 0.01∗ |
| After the third and fourth mailings | 39.2 (0.5) | 39.4 (0.4) | −0.1 (0.7) | 0.83 |
| After the fifth mailing | 52.9 (0.4) | 51.5 (0.5) | 1.4 (0.7) | 0.05∗ |
| (c) Full Redesign vs Softened Revised Design | ||||
|---|---|---|---|---|
| Point in Data Collection Cycle | Full Redesign | Softened Revised Design | Difference | P-Value |
| After the first two mailings | 16.5 (0.2) | 20.3 (0.3) | −3.9 (0.4) | < 0.01∗ |
| After the third and fourth mailings | 34.2 (0.3) | 39.4 (0.4) | −5.2 (0.5) | < 0.01∗ |
| After the fifth mailing | 48.3 (0.4) | 51.5 (0.5) | −3.1 (0.6) | < 0.01∗ |
| (d) Full Redesign vs Partial Redesign | ||||
|---|---|---|---|---|
| Point in Data Collection Cycle | Full Redesign | Partial Redesign | Difference | P-Value |
| After the first two mailings | 16.5 (0.2) | 19.0 (0.3) | −2.6 (0.4) | < 0.01∗ |
| After the third and fourth mailings | 34.2 (0.3) | 39.2 (0.5) | −5.1 (0.5) | < 0.01∗ |
| After the fifth mailing | 48.3 (0.4) | 52.9 (0.4) | −4.6 (0.6) | < 0.01∗ |
NOTES: Standard errors are in parentheses. Significance tested based on two-tailed t-test at α = 0.1.
SOURCE: Workshop presentation by Elizabeth Poehler.
suggests that the Softened Revised Design had significantly higher response than the Partial Redesign treatment in the beginning (after first two mailings). There was no significant difference between the two treatments after the fourth mailing (Mailings 3 and 4). But, by the end of CATI interviewing (which was still used), self-response for the Partial Redesign surpassed that of the Softened Revised Design (by 1.4 percentage points). “There was something in those sequences of contacts that was working and not working,” Poehler said, leading to conjectures but no solid conclusions. Turning to panes (c) and (d), the Softened Revised Design had significantly higher self-response than the Full Redesign at all three points in data collection, and the Full Redesign was also bested by the Partial Redesign throughout the production process. So, Poehler noted, “something in the Full Redesign clearly did not work as hoped.” From the test overall, Poehler said that the Census Bureau had concluded that all three experimental treatments had lower overall response—and higher costs—than the control group. She said that the inclusion of the “Why We Ask” brochure in Mailing 1 was singled out as a particular misstep and that it “should not be incorporated.”
The Adaptive Strategy Test further explored the somewhat paradoxical result experienced in 2013 when Internet response was first introduced in the ACS. At that time, the Census Bureau found that the “Internet Push” strategy generally increased the take-up rate but dampened response rates in some geographic areas. So, the notion of the test was to identify areas where sending a paper questionnaire in the first mailing might result in higher self-response rates. The test was premised upon a classification of all census tracts into one of three categories—Mail Preference, Mixed Preference, or Internet Preference—based on analysis of a set of variables and indicators:
- Ratio of mail to Internet returns;
- Self-response rates;
- Prevalence of high speed Internet connections;
- Percent of population aged 65 and older; and
- Areas that showed the aforementioned dampening in self-response after Internet implementation.
Poehler noted that the same set of variables and indicators is being analyzed in support of planning purposes in the 2020 census. With this partition of geographic areas in place, the Adaptive Strategy test randomly assigned Internet Push (control) or Internet Choice treatments to housing units in Mail Preference or Mixed Preference tracts, as shown in pane (a) of Table 3.7. The basic results are summarized in pane (b) of that table: Poehler commented that the Choice method produced lower self-response rates while increasing cost (through the larger number of paper questionnaire returns). Hence, she said, the Census Bureau decided not to move forward with the Choice method.
Table 3.7 Experimental Design and Results, 2017 American Community Survey Adaptive Strategy Test
| (a) Experimental Treatment | ||
|---|---|---|
| Date Mailed | Control (Internet Push) | Experiment (Choice) |
| 9/21/2017 | Initial Mailing Package—Internet Push | Pre-Notice Letter |
| 9/25/2017 | — | Initial Mailing Package—Web and Paper Option |
| 9/28/2017 | Reminder Letter | Reminder Postcard |
| 10/13/2017 | Paper Questionnaire Package | — |
| 10/17/2017 | Reminder Postcard | — |
| 10/19/2017 | Replacement Questionnaire Package | |
| 11/2/2017 | Final Reminder Postcard | Final Reminder Postcard |
| (b) Results | ||||
|---|---|---|---|---|
| Internet Push (Control) | Choice (Experiment) | Difference | P-Value | |
| Mail Preference | 39.1 | 37.3 | 1.7 (0.6) | < 0.01∗ |
| Mixed Preference | 48.4 | 45.7 | 2.8 (0.6) | < 0.01∗ |
NOTES: T1, Treatment 1 (and so forth). Standard errors are in parentheses. Significance tested based on two-tailed t-test at α = 0.1. In the test, Mailing 1 was the usual (production) initial mailing package and Mailing 3 the usual questionnaire package, as described in Section 3.1.1.
SOURCE: Workshop presentation by Elizabeth Poehler.
Poehler said that the Data Slide Test sought to make the ACS more “real” to potential respondents, and allay respondents’ concerns about the privacy of their data and the legitimacy of the ACS in general, by including a simple, accessible data tool in the ACS mailing. In 2017, the ACS developed a popular “data wheel” as an outreach item—cardboard wheels held together by a grommet that show key ACS information about different states through a window when the wheels are turned. The idea is convey that kind of “interactive infographic” tool directly in the mailings, but use of the existing data wheel is problematic on two fronts. It just barely fits in the current ACS mailing envelopes and the metal grommet holding the wheel together can cause problems with mail processing machines. Hence, the “data wheel” was redesigned into a rectangular, slide-rule format—the Data Slide—that easily fits the mailer. Hence, the experimental design of the Data Slide test was very simple: a control group went through the usual ACS sequence, a Treatment 1 group received the Data Slide in Mailing
1 (with everything else kept the same), and a Treatment 2 group received the Data Slide in Mailing 3 (keeping all else the same).
Poehler gave some very preliminary results of the Data Slide Test—preliminary, because it had only been fielded in May 2018. Poehler said that Treatment 1 (Data Slide in Mailing 1) had higher Internet returns and lower mail returns than the control group, though overall self-response was not significantly different. Treatment 2 (Data Slide in Mailing 3, which also contains the paper questionnaire) also registered insignificant change in that overall self-response was not different. But she said that analysts are still working to understand why Treatment 2 seemed to work particularly well (higher self-response, higher Internet returns, no difference in mail returns) for a subset of those who were mailed the paper questionnaire.
Poehler could only speak to the design, and not the results, of the Mail Materials Test because it was being fielded at the time of the workshop. The goal of the test is to field test the performance of five experimental treatments:
- Modified Control, which removes the FAQ brochure from Mailings 1 and 3 (shifting some “necessary” content to the back of the letter and removing the instruction card from Mailing 3);
- Emphasized Mandatory with Revised Questionnaire, which includes stronger mandatory-response messaging (through boldface type and altered placement), updated design of letters and questionnaire (the questionnaire redesign consisting of improvements to the “cover page” to emphasize the Census Bureau brand, among other things);
- De-emphasized Mandatory with Revised Questionnaire, which maintains the mandatory-response cue on the envelope (to try to get it opened) but softens the language in the mailing-package letters (Poehler conceded that there is some internal debate at the Census Bureau as to whether the “softer” language is really softer than the current language, but she said “it is definitely softer” than the Emphasized Mandatory treatment language), while using the updated design of the letters and questionnaire;
- De-emphasized Mandatory with Current Questionnaire, which is the same as the previous treatment except that it uses the current ACS questionnaire; and
- Softer/Eliminated Mandatory, which softens the mandatory-response language in the letters and removes it entirely in some cases, while using the updated design of the letters and questionnaire.
In closing, Poehler noted that future tests being considered for 2019 include variations on the use of due dates/deadlines in ACS mailings and the testing of a modified mailing schedule.
3.2.2 A View From the Private Sector
Asked to discuss the range of ACS testing described by Poehler from the perspective of a private-sector survey organization, Douglas Williams (Westat) began by commending its quality as well as the way in which the current ACS approach is based on previous research, although there might be disappointment in the test results because improvements in self-response tended to be both few and small. But Williams phrased it as a positive, that the research and testing “validates the current ACS design”—though he hastened to add “(?)” to that statement. He said that he phrased it that way, with the question mark, because the testing has not yielded that “next big thing” what will really move the needle in terms of boosting survey response. The small effects, and the failure (yet) to find a factor of major influence highlights the challenges facing the ACS and the general survey environment today.
Williams said that the testing had generated some useful knowledge about changes to the survey stimulus—the format of the mailings. In particular, he pointed out Treatment 3 of the Pressure Seal Mailer Test and the improvements achieved in Mailing 5 of the Mail Design Test.
Williams commented that the current ACS materials are, successfully, recognized as official and functional, but that the null gains in response evidenced by the Pressure Seal Mailer Test raised some questions. It remains unusual that the pressure seal mailer format—which came of interest expressly because of its official feel and its trusted nature—did not yield gains in response (though it still had compelling enough advantages in cost and production that the decision was still made to adopt the format). It is particularly unusual that the pressure seal mailer did not outperform the postcard in terms of response; the perceived difference in confidentiality or official-feel between a pressure seal mailer and a sealed envelope (letter) is arguable, but the pressure seal mailer should surely appear better on both fronts than a simple postcard. Williams noted it could be argued that Treatment 4 in the Pressure Seal Mailer Test might overuse the new concept—the last group of nonrespondents received the same stimulus, in the new format, three times. That similarity in feel and approach seems to have been very effective in the Canadian census context, but showed no apparent effect in the United States.
Turning to the Mail Design Test and the issue of mandatory-response wording in general, Williams said that the test was intended to show the “softer, gentler side of ACS” and that it produced lower response (but not much lower). The test results suggest that the mandatory-response language remains among the ACS’s most effective levers, he observed, but the question is why that language is so powerful. He suggested that people do not like being told what to do, but that casting things as consequences can be particularly compelling and may be better at motivating action than verbal appeals. The current ACS mailing materials do suggest some consequences—for instance, saying that a
questionnaire will be mailed if there is no response to an initial mailing or that an interviewer may make a personal visit—but that is a hook that could be investigated further.
In terms of informational content, Williams said that it is important to bear in mind that the decision to participate (or not) in a survey is not the long, careful, deliberative process that survey designers would like. Instead, he argued, the decision “seems largely based on heuristics, and it is a decision made quickly”—however disappointing it may be to the survey designer, respondents are exceedingly unlikely to read everything put in front of them. In that spirit, Williams cautioned to the Census Bureau not to be too hasty in abandoning the “Why We Ask” brochure; he characterized it as “right idea, too much content” and feeling a little bit like homework to read. The problem with the “Why We Ask” brochure and the Data Slide is that it is not necessarily the detail that respondents want, and that it is not readily clear to respondents why those inserts address any of their reasons for being unwilling to paticipate. Williams also suggested that the tests might have presented the innovative materials too early (in Mailing 1, which contains a lot of other information, which already could be argued to crowd out the initial request for action) or at the wrong contact (e.g., at Mailing 3, which is dominated by the paper questionnaire).
Williams suggested that, in terms of mail/paper preference, both sides of a major proposition seem to remain in play. The continued results of Internet Choice treatments, where sending the paper questionnaire along in the mailing tends to increase paper response but not Internet take-up, still seem to be performing suboptimally—as he noted was consistent with the Medway and Fulton (2012) meta-analysis—but the result was not terribly far off. If that’s true, and there does remain a segment for whom the paper questionnaire will remain the very “sticky” preference, then would a mail/paper-only treatment group work better? But, on the other hand, it could be legitimately asked: have we reached a point where a true mail/paper preference group no longer exists, with technology increasingly becoming a necessity. Williams argued that the Census Bureau is perhaps better positioned than anyone to do the analysis of web paradata, timing of responses within electronic questionnaires, the distribution of device types used to complete the survey, and so forth to inform effective prediction of response mode propensity.
On the topics suggested by the recent ACS testing, Williams recommended testing of a unique-format stimulus at the fifth and final mailing only. At the time of the Pressure Seal Mailer Test, reserving the “feels official” pressure seal mailer to the final meeting was not a good option because a third contact method (telephone interviewing) was still being used in the ACS. Williams said that the effectiveness of a unique, attention-grabbing format was supported by the Mail Design Test findings, and so it is worth considering whether leveraging the power of unique format and message in the final appeal would be helpful. Williams also urged the ACS Office not to give up—“yet”—on the
informational brochures (including the “Why We Ask” brochure used in the tests). There is good material in those documents, and trying to find some way to include informational or motivational messages at reminder contacts might serve to boost Internet returns. The challenge is to provide the information in the way that people consume it, “in small doses;” Williams further suggested providing concrete, less abstract examples of how ACS data have been used. Regarding the pending test of mandatory response language, Williams suggested a gradation in the sharpness of the language—akin to the Canadian model, using soft language at the early contacts and stepping up the urgency and necessity in later contacts. Finally, Williams urged the ACS researchers to consider “consequential wording,” citing work by Tourangeau and Ye (2009) based on prospect theory. The essential idea is that human nature seems to be to fear losses more than to anticipate gains; in the ACS context, appeals and arguments keyed to the notion of states or localities losing funding might be more effective than more abstract notions of services that could be gained.
As major directions for the next phase of ACS research and testing on messaging, Williams offered four suggestions:
- Having concluded “Internet push” methods to be most effective, Williams suggested finding ways to push to Internet response more aggressively. The roughly two-thirds self-response by the Internet in some of the experiments is very good, but something like pushing out the mailing of the paper questionnaire even further would be useful to test.
- Foreshadowing a theme discussed in the next session of the workshop, Williams suggested experimenting with “push to device” reminder contacts. He noted the Bureau of Labor Statistics’ experience with trying to improve data collection in the Consumer Expenditure Survey, promoting data entry and collection via mobile device—the vision being that respondents would enter their spending information while sitting at a restaurant or while checking out at stores. He said that respondents still resisted in-the-moment data collection on that particular survey instrument on their phones and mobile devices, but they very much liked reminders and prompts via mobile device.
- Williams urged the ACS researchers to “reconsider or reinvent” the notion of survey prenotification. Rather than just advise respondents that something will be coming, he suggested that the initial contacts could be reframed to familiarize those respondents with the ACS—in small doses of information, and perhaps using “did you know?” types of factoids to introduce the range of questions in the ACS. One possibility might be to directly but conversationally address concerns about ACS response being required by law, clarifying that this helps maintain high levels of data quality.
- Finally, Williams urged attention to thinking about communication and messaging beyond or after the mail sequence. Some nonresponse, and the resulting field interviewing in nonresponse follow-up, is inevitable. The most productive message of the fifth/final mail contact could be to notify people of the personal visit and to prepare them for it (rather than just warning them of the possibility), while still “giving them the out” of forestalling the visit by responding online.
3.2.3 A View From Academia
Asked to comment on the suite of ACS testing from an academic perspective, James Wagner (Survey Research Center, University of Michigan) began by noting that the ACS “is a standard against which we measure other surveys,” in both is size and methodology. The sample sizes available for experimentation in single ACS methods panels (subsets of the whole ACS annual sample) are “astounding” relative to the sample sizes of other entire surveys. He said that survey research generally faces a “crisis of reproducibility,” the results of many small experiments being run with a lack of statistical power and generating a lot of false positives.
Against that backdrop, he said the large ACS tests provide a solid foundation but also raise fundamental questions. Response rates to the ACS have been very high and remain so, which makes them even more difficult to “improve” upon; Wagner argued that W. Edwards Deming’s notion that a class of people will never respond to any survey question remains a valid concern, and the ACS may be approaching a ceiling beyond which no improvement may be made. But, more fundamentally, Wagner asked: What does “improving” mean in the ACS context, and is “improving response rates” really the relevant metric? Wagner suggested that one way to think about “improvement” is to reduce measurement error; in that case, the first day of the workshop and its discussion of survey data compared with administrative and third-party data suggests a very different set of metrics. Alternately, “improvement” could be conflated with reducing costs; some ACS tests seems to have been expressly designed as cost-saving, he said—noting that this is definitely an important consideration. Finally, “improvement” could mean the elusive concept of reducing burden: “burden” in a broad sense, not just time spent completing the survey. Wagner said that this seems to be part of the motive for softening the mandatory-response language, precisely because that language does create another kind of stress/burden that might be necessary to connect with some possible ACS respondents, but surely not all. Whichever definition or combination of definitions prevails, Wagner urged careful consideration of the full set of features that can be manipulated and how those features are likely to impact metrics of quality, metrics that must be chosen carefully.
Wagner outlined an idealized process for testing, starting from an assumption of population heterogeneity. The premise is to identify the relevant subgroups in the population—people who need paper questionnaires in order to respond at all, people who need a strongly worded mandatory-response message to be motivated, or the like. These subgroups should be identified in conjunction with choosing the quality metrics, and vice versa; experimental strategies should be assigned in a way that optimizes cost and works best with the chosen quality metrics. Wagner noted Mathieu’s comments from earlier in the day at the workshop about the difficulty of truly “adapting” protocols and customizing them to various population subgroups, in a big production process like a census or the ACS. It is not easy, and “that’s a problem I’ve wrangled with for the last 10 years” as technical systems have for surveys. He added that the conduct of multi-arm experiments, and assigning treatments purposively rather than purely randomly, could help in testing.
Of the Pressure Seal Mailer test, Wagner noted that the total response rates were not that different; the test was able to detect higher response rates for Treatment 3 (pressure seal mailer at both Mailing 2 and 5) relative to Treatment 2 (pressure seal mailer only at Mailing 2). But the “improve response rates” metric proved relatively uncompelling, Wagner suggested, and the improvement-as-cost-reduction instinct prevailed, the pressure seal mailer format being less expensive than the traditional letter-in-envelope assembly. Wagner said that the Mail Design Test found statistically significant differences across the treatments, but joined skepticism as to whether they were “important” or practically significant. He observed that each experimental arm of this test had lower response and higher cost, and was designed to reduce burden (the stress imposed by “mandatory” messaging). He suggested that what should be asked is whether the experimental treatments lead to increased nonresponse bias, and whether the trade-off of burden reduction through these treatments is really worthwhile.
Wagner commented that the assumption of population heterogeneity explicitly motivated the Mail Design Test and asked whether different strengths of “mandatory” messaging work differently across population subgroups. He noted work from within the economic programs directorate at the Census Bureau (Thompson and Kaputa, 2017) showing that smaller and larger firms respond differently to mandatory-response messaging in establishment surveys. The questions are whether population subgroups who react differently to different types of messages can be identified ahead of time and, if not, whether they can be identified (and approaches adapted) over the course of survey administration.
Regarding the Adaptive Strategy Test, Wagner acknowledged the finding that, “in some areas, self-response went down” with the move to Internet push methods. Again, he said that the hope is to identify those areas or households in advance, for tailoring survey strategies and approaches. Borrowing terminology
from machine learning, he likened this to a feature selection problem, the construction of some classification algorithm—and, so conceptualized, the question becomes one of whether the predictive accuracy of classification can be improved. He noted that some studies in the literature indicate that offering response-mode choice reduces response—Wagner joined other speakers in citing Medway and Fulton (2012). But he argued that other works in the literature find that this impact can be mitigated by other design features, such as incentivizing response by the Internet; he pointed to work by Biemer et al. (2018) on the Residential Energy Consumption Survey, while conceding that incentives are not really viable for the ACS.
Wagner closed by noting that the Data Slide and Mail Materials Tests both suggest the need for rethinking of objectives and quality metrics. The Data Slide offers interesting information, but it does not directly address concerns over privacy or other reasons why a respondent might knowingly decline to answer the survey. He asked about more direct response to these concerns. Noting that the overall response rate was not different but that there seemed to be some higher Internet take-up, he said that it might be worthwhile to ask whether that translates into meaningful cost reduction.
3.2.4 Floor Discussion
Cynthia Clark (formerly, U.S. Census Bureau) indicated that she was at an international meeting within the last week where the theme emerged that official statistics have to be relevant to an individual in order to build trust. Arguing that the ACS is uniquely positioned to build that kind of trust through its role in the allocation of federal funds, Clark asked: Is it possible to play up that message more in the messaging being provided to respondents? Poehler replied the federal fund argument is referenced in the informational material in the package, but there has not been too much consideration to putting it into the letter. Williams noted that a better approach might be to target the state level in referencing fund allocation, as the national level figure of $685 billion might sound like “wasteful government spending.”
Emily Allen (MITRE Corporation) suggested that ACS research and testing could benefit from more of an academic or scientific treatment, which would require the Census Bureau to look at cultural change in bigger structural factors. The idea is to avoid the appearance of a “maverick” or seat-of-the-pants approach to testing. Wagner replied that he did not know exactly how to solve that or how to better make the case for the value of surveys. He added that maybe it is the role of large organizations like the Census Bureau to demonstrate the value of surveys—but maybe it is also the province of professional organizations like the American Association for Public Opinion Research or the American Statistical Association. Beth Jarosz (Population Reference Bureau) noted that different messaging needs to be considered in the context of an era of competing
priorities; maybe spurring competition (akin to “your neighbors have already replied”) might be appropriate.
3.3 RETHINKING THE COMMUNICATION PROCESS WITH RESPONDENTS: TOWARD A STRATEGIC FRAMEWORK
3.3.1 Introduction to Census Bureau’s Strategic Framework
Broderick Oliver (U.S. Census Bureau) commented that the Census Bureau’s work to develop a strategic framework for messaging in the mail, self-response materials of the ACS grew directly from the take-away messages derived by the Bureau from the 2016 ACS workshop (National Academies of Sciences, Engineering, and Medicine, 2016). Oliver summarized these messages as:
- Focus on the purpose of each contact;
- Make the messaging between mailings more distinct, but mutually supportive;
- Discuss the benefits of the ACS to an individual’s community;
- Emphasize culturally relevant messages of empowerment; and
- Attach the ACS to the Census Bureau (and the Census “brand”).
In the exercise of constructing this strategic framework, a message is simply information that the Census Bureau wants to communicate to the recipient of the ACS mailing materials (a possible self-respondent). Messages are conveyed through elements including but not limited to words; other messaging elements include logos, symbols, graphic displays of information, document formatting, and graphic style.
Oliver described the objective of the project as developing a framework for messaging in the ACS mailing maerials based on researching three overlapping questions:
-
What do we know about the ACS audience?: For this question, Oliver said his group had turned to previous research completed by and for the decennial census and the ACS—work that, in many respects, was similar to the market segmentation research described by Sarah Burgoyne in her presentation (see Section 2.3.7). Specifically, he noted that they scrutinized the results of three major “mindset and motivation studies” conducted in support of studying the decennial census audience:
- The 2007 Segmentation and Mindset Study (Bates and Mulry, 2007);
- The 2008 Census Barriers, Attitudes, and Motivators Surveys I, better known as CBAMS I (ICF Macro, 2009; Bates et al., 2009); and
-
- The Census Barriers, Attitudes, and Motivators Surveys II, or CBAMS II (Conrey et al., 2012).7
The group also built off of audience studies conducted specific to the ACS, in particular collaborative research conducted in 2013–2014 with Reingold, Inc. and in 2014 with Gallup, as part of the Gallup Daily Tracking Survey (see, e.g., Fulton et al., 2016). Oliver noted some specific highlights, conclusions that they drew from this previous work:
- The ACS audience can be segmented into subgroups of people who generally trust the government, who generally distrust the government, and who are generally unaware of the role of government.
- There is a distinct lack of awareness of the ACS among the general public; Oliver repeated the finding that the previous survey work suggests that only 11 percent of the American public have heard of the ACS, much less understand it.
- Messages that convey the community-level benefits of responding to the ACS are generally viewed favorably by respondents, while messages about the confidentiality/privacy protection of ACS data “do not have high believability” among the government-distrustful segment of the population.
- What do the experts think of ACS messaging?: That is, what themes do other experts suggest would influence response to the ACS? In addition to the record of the 2016 workshop, Oliver said that the ACS strategic framework team had held discussions with the Social and Behavioral Sciences Team, an expert group created by executive order in 2015 under the auspices of the National Science and Technology Council, on the improvement of government communication generally.8 Oliver said that the main themes that they drew from the Social and Behavioral Sciences Team discussion were that social norms, procedural justice, and patriotism might be useful appeals to make; conveying the benefits of the survey would be very important; and personalization and simplification (preventing confusion) steps might have great benefit.
- What does the literature say about messaging?: Oliver noted that his group conducted an extensive literature review in communications (including
___________________
7 In the discussion block following this session, Linda Jacobsen (Population Reference Bureau) noted that the Census Bureau has conducted a third CBAMS study, in specific support of the 2020 census, and asked whether it would be incorporated into the strategic framework. Oliver replied that they would take a look, and Jonathan Schreiner (Census Bureau) added that the intent is for the strategic framework to be a “living document;” the 2020 Census CBAMS will be considered, but it could not be evaluated in this iteration because it was still ongoing as the strategic framework development project was doing its work. The report of that third CBAMS round was publicly released in January 2019.
8 The Social and Behavioral Sciences Team stopped work in January 2017.
“plain language” communication), behavioral sciences, marketing, sociology, psychology, and survey methodology. Again, Oliver noted some selected highlights and conclusions from this review:
- Continuity and change are both important factors: The multiple mail contacts in the ACS “should feel like a continuous conversation” between the Census Bureau and the potential respondent but, at the same time, each contact would be more effective if it communicated distinctly different reasons to participate.
- The number of messages per contact should be limited, to increase effectiveness of communication as well as to reduce burden.
- ACS mail materials should establish trust early with messages that are believable.
- Appeals that convey the benefits of ACS data—specific to the recipient’s community—are likely to be effective.
- “Believe it or not,” Oliver noted wryly, “some of our materials aren’t in plain language”—but they should be.
Based on these research findings, Oliver said that a Census Bureau team developed the strategic framework for ACS mail material messaging, to answer the questions: What segment of the ACS audience should the mail materials target? What best practices in messaging will resonate with this audience segment? And, how should the ACS program allocate these messages across the five mailings? The first version of the framework is described in detail as Oliver et al. (2017), but Oliver summarized the gist. From the outset, the strategic framework makes the decision that the mailing materials should most strongly target the segment of the ACS respondent audience that is cynical of participation and distrustful. He said that this is akin to the point that Mathieu had made earlier in discussing the Canadian approach, that the materials ought not “waste effort” by structuring an extensive conversation with “easy” case responses that are instances of simply not having had the time to respond rather than actively declining to respond. Accordingly, the set of messages that the strategic framework team concluded would resonate best with the cynical, distrustful audience segment are:
- Focusing on trust in Mailing 1, communicating that the ACS is a legitimate survey and working to connect the (largely unknown to the public) ACS to the (substantially better known) Census Bureau and Census “brand.”
- Focusing on benefits in Mailing 2, answering the implicit question “what’s in it for me to fill out this 28-page survey?” by playing up the tangible benefits to the respondent’s community.
- Focusing on reducing perceived burden in Mailing 3, emphasizing that the recipient has a choice in how they respond to the ACS, but that it
-
is the recipient’s civic duty to respond to the ACS (similar to serving on a jury or a parent-teacher association); the notion that the respondent is not alone, and that others in the community have already replied to the ACS, would also be invoked.
- Using Mailing 4 to restate the messages from Mailings 1–3 but, having learned about the importance of varying specific language, doing so in different manners; the framework also notes that it is important at this phase to thank recipients for their response and to ask them to respond if they have not.
The ideal content of Mailing 5 remains undetermined. Oliver said that further research is needed on the demographic profile and other characteristics of this toughest of response cases, who have declined to respond to four previous appeals.
3.3.2 Review of How Current ACS Mail Materials Mesh With the Strategic Framework, and Next Steps
Jonathan Schreiner (U.S. Census Bureau) complemented Oliver’s presentation on the Census Bureau’s strategic framework, using the same research base to assess how well the current mailing materials align with that framework. Schreiner referenced the set of ACS mailing materials already described (Figure 3.1), observing that it consists of 13 different mailed pieces across 5 mailings. This research project set out to inventory the actual messages conveyed in those mailed pieces, in what frequency, as well as some indication of messages that are not currently being sent in the mailings.
Schreiner said that the evaluation proceeded by examining the strategic framework and some of the literature amassed in constructing it, developing a codebook articulating a range of messages related to the ACS. The 74 messaging codes developed in this exercise fall under 4 top-level categories: Trust, Benefits, Reduce Burden, and Instructions/Information/Required Elements. An excerpt of the codebook (Box 3.2) shows part of the Confidentiality/Data Security branch underneath the top-level Trust code. With the codebook in place, Schreiner said two coders independently marked up and assigned codes to all the elements in the 13 mailed pieces. As an example, he walked through a sample coding of the top portion of the Mailing 1 letter (Box 3.3). Disagreements between the two coders’ findings were adjudicated by a third coder, yielding a final consensus coding. Importantly, each element in each mailing piece could have multiple codes attached to it, and the codes could appear multiple times in the same piece; the codebook was developed with respect to the relevant literature, and so some of the codes were not used (did not appear in the mailed pieces) at all.
Schreiner devoted the remainder of his presentation to describing eight “lessons learned” from the coding exercise, noting at the outset that the final report of the research may involve 3 or more “lessons.” The first lesson described by Schreiner is that the ACS mailings and mail pieces may communicate too many messages. Consistent with what Oliver had noted earlier, Schreiner noted that limiting the number of messages may tend to increase the chances that the messages will be read, understood, and remembered, and too many messages can overload (or unduly burden) the reader/recipient. Schreiner said that the literature suggested a rough heuristic “rule of three:” concepts or ideas presented in groups of threes may be more interesting, enjoyable, and memorable. Further echoing the “plain language” discussion from Oliver’s presentation of the strategic framework, Schreiner commented that the literature suggests that messages should be stated in short sentences and paragraphs, without distracting details, communicating only the information that the audience really needs to know. With those rough standards as context, Schreiner noted that the coding exercise identified 129 messages in the 5 mail pieces comprising Mailing 1 alone and, moreover, 39 of the 74 detail codes in the codebook were used in Mailing 1. Schreiner noted that “there’s no magic number,” no basis for identifying an optimal number of messages for a survey like the ACS or even an individual mailing—but, by any reasonable standard, 129 messages is a lot to expect a respondent to process.
The second lesson identified by Schreiner is that the messages are repeated verbatim or only lightly paraphrased across the current ACS mail materials. To illustrate the point, he presented a graphic showing thumbnail views of the three ACS letters from Mailings 1, 3, and 5 (see Figures 3.2, 3.5, and 3.7) but on which passages or elements repeated verbatim were shown in red, strikethrough highlighting; it looked like a sequence of documents that had been heavily redacted. He then illustrated the same letters where the red strikethroughs now covered text that was fairly lightly paraphrased in later mailings. As a sample of such paraphrasing, Schreiner noted two passages in the first two letters:
- First letter: “This survey collects critical information used to meet the needs of communities across the United States. For example, results from this survey decide where new schools, hospitals, and fire stations are needed.”
- Second letter: “Local communities depend on information from this survey to decide where schools, highways, hospitals, and other important services are needed.”
Schreiner observed that it is good that this language is not repeated purely verbatim but that, functionally, the only potential aim achieved by these two passages across these two mailing pieces is testing whether “fire stations” or “highways” have greater appeal. Adding this level of paraphrasing to the mark-ups, the documents became even more red, with the Mailing 5 letter
(and a thumbnail of the Mailing 4 postcard, marked the same way) showing up as completely red. Hearkening back to Oliver’s mention of wanting the communication to be a continuous conversation, Schreiner said that “you want there to be common elements to link the letters in the respondent’s mind,” to convey that they are from the same source and for the same purpose. But, as with the inclusion of 129 messages in mailing 1, the question is whether this level of repetition is too much. He said that an argument could be made that a person might only really start to pay attention at the late phases, which might give license to directly repeat some of the same messaging—but, Schreiner argued, something “novel” in the messaging in the late mailings might benefit these new readers/respondents as well as those who at least glanced at the previous mailings. Schreiner closed discussion on this point by noting that messaging concerning “Data Security and Legal Obligation” are the main culprits behind the wordiness of the ACS materials; word count analysis of the pieces in Mailing 1 alone shows that content related to these two topics accounts for 28 percent of the verbiage in the letter, 41 percent of the multilingual brochure, and 34 percent of the FAQ brochure.
Schreiner’s third lesson was that the later mailings are very limited in adding new message content. As noted, Mailing 1 contained messages using 39 of the 74 codes possible in the codebook. This is remarkable in itself, but even more remarkable is that the remaining four mailings, in their entirety, use only 5 new codes not communicated in Mailing 1. That is, he said, 4 subsequent mailings make only 5 new appeals to convince nonrespondents to participate. The picture becomes bleaker when examining what those 5 added messages actually are, Schreiner said:
- Providing multiple response modes (choice): Logically, this message has to occur in the later mailings, because an explicit choice in response mode is only given in Mailing 3.
- If you have already responded, thank you: A good note to hit, Schreiner said, but also one that necessarily could only occur in Mailing 2 or later, after the recipient has had some chance to actually respond.
- If you do not respond, Census will contact you by phone or personal visit.
- Census will pay for your return postage: As Schreiner noted, a message that only makes sense in a later mailing that actually provides a paper questionnaire (to be mailed).
- Ask the respondent for help: Schreiner said that he was initially “excited” to see this as a new, added message in the later mailings, as it is a very different and potentially useful appeal—but that excitement faded when he checked the language where the message is rendered. The Mailing 3 letter (Figure 3.5) includes the passage: “We asked you to help us with this very important survey by completing it online. But we have not received your response yet.” The problem, of course, is that this is the
first occurrence of that message: None of the preceding mailings explicitly asked the recipient for help, so the message is untrue.
Across all of the mailing pieces, Schreiner said that the analysis concluded that sponsorship of the ACS is the most frequently invoked messaging type in the mailing materials; some 16.5 percent of all the messages link the ACS to a “known and trusted sponsor” in the Census Bureau itself. The problem, and the fourth lesson cited by Schreiner, is that communication of sponsorship is inconsistent. The basic idea of Census Bureau sponsorship and responsibility for the ACS is conveyed through many different types of elements: the use of logos for the agency, the salutation in the materials from the Director of the Census Bureau, the frequent use of “The Census Bureau” as the subject of sentences in the letters, and the placement given to census.gov Internet addresses. However, this messaging is not done in any consistent manner—perhaps most pointedly in the paper ACS questionnaire itself, which only uses the word “Census” three times, with two of those being the specification of web addresses. The paper questionnaire includes no Census Bureau logo (just the Department of Commerce logo) and no explicit statement that the survey is being conducted by the Census Bureau. The mailing materials use both the Census Bureau’s wordmark-style logo and the formal seal of the Commerce Department, but does so in a somewhat haphazard way, with both logos appearing in some mailings but the paper questionnaire and the reminder postcard featuring only the Commerce seal. Schreiner noted that, in messaging, location and placement matter a great deal—which exacerbates the logo problem. On the letters and envelope/mailing exterior, the Census Bureau wordmark is fairly small and placed in the lower left corner where its visual impact is low. The more visible upper left corner of both pieces includes what could best be described, in Schreiner’s assessment, as mixed messaging: on the envelope, an overly long and confusing return address (Jeffersonville, Indiana, being unlikely to register with many ACS recipients9), and on the letter by the internal Census Bureau identification number associated with the document. Schreiner added that the letterhead used on the three letters in the ACS mailings may serve to connote four different potential sponsors, with its successive lines of text:
- “UNITED STATES DEPARTMENT OF COMMERCE,” and the logo, identifying the Cabinet-level department;
- “Economics and Statistics Administration” denoting the Census Bureau’s organizational superior within the department—but an entity likely as unknown to potential respondents as the ACS itself;
- “U.S. Census Bureau,” in smaller type; and
- “OFFICE OF THE DIRECTOR,” in still smaller type, but potentially connoting some subdivision of the Census Bureau as “sponsor.”
___________________
9 Jeffersonville is the long-time home of the Census Bureau’s National Processing Center.
Schreiner noted that this kind of confusion about “nested bureaucracy” might not be harmful and might not matter to the average respondent. He conceded that “there’s no solid evidence in either direction. But it certainly can’t be doing us any favors.”10 He closed discussion by very quickly hearkening back to Mathieu’s presentation and commending the “branding” achieved in the Canadian census and survey materials, including the consistent use of color, emphasis on the Canadian flag icon, and even the inclusion of a positive and motivational wordmark (“You are making a difference!”).
Fifth, Schreiner noted that “strategic messaging is limited” in the current ACS mailings. He said that “strategic messaging” is messaging that is “targeted, purposeful, and focused on the purpose of each mail piece, and in relation to all messages in a campaign.” This includes ensuring that messages are current and accurate, and that unique messages are purposefully placed in ideal locations. As illustration of how the current mailing materials fall short of that mark, he cited two examples. First, he noted that the multilingual brochure is the only piece in all of the materials that contains the appeal to informed decisionmaking embodied in the construct:
In order to make well-informed decisions, a community needs accurate and reliable information. By responding to this survey, you are helping your community to get this kind of information.
Schreiner said that this is “actually a good and potentially very powerful message”—making it unusual that the only place where it is made is in a document visually dominated by renderings in five other languages, without any clear reason of why that message would be useful (purposeful) for the audience likely to refer to the multilingual brochure. Likewise, Schreiner noted that the FAQ brochure provides the only example of a benefit-to-business message, by indicating “to show a large corporation that a town has the workforce the company needs” as one of the potential data uses. Arguably, being “buried” in the FAQ might not be the best use of that argument. Schreiner also cited examples where the mailing piece messages are out of date: notably, the multilingual brochure effectively promises the reader that “In a few days you
___________________
10 As evidence thereof, Schreiner briefly displayed a letter to the editor that had been printed in a “Money Matters” column in the Cleveland Plain Dealer in 2017, under the headline “American Community Survey from Census Bureau can creep you out.” The letter read (https://www.cleveland.com/business/index.ssf/2017/10/american_community_survey_from.html):
I received a letter today from the director (unnamed and unsigned) of The United States Department of Commerce, Economics and Statistics Administration, U.S. Census Bureau, stating that my household has been randomly selected to complete the American Community Survey. Further, it must be done online at https://respond.census.gov/acs (but a paper questionnaire will be mailed if needed) and my response is required by law with a penalty imposed for not responding. Is this legitimate?
The fact that the writer recited all the elements of the letterhead but clearly did not connect them may be a sign that it is falling short of the trust-engendering messaging the ACS is trying to achieve, Schreiner noted.
will receive an American Community Survey questionnaire in the mail.” That statement was accurate a few years ago, Schreiner noted, but not anymore—and even if the household does get a paper questionnaire (by not responding online), it arrives in about 2 weeks, which is more than “a few days.”
Schreiner’s sixth lesson learned is that the current messaging is missing some opportunities—there are potentially messages in the codebook, derived from the extant literature, that could have been used in the ACS materials but have not, to date. He said that the literature suggests the utility of patriotic appeals or appeals to civic duty—service to country and community, respectively—but neither are effectively used at present in the ACS materials. Relatedly, he observed that the current messaging does not make use of “the power of norms,” the notion that survey participation is a “normal” activity; conveying that kind of message, with its overtones of consistency and conformity, can be an effective strategy. Schreiner further noted that the current mailing materials do not use a common approach from the marketing psychology literature, which is to ask the respondent for their commitment. The examples of benefits that are described in the current materials tend to be vague, not specific, and oriented towards benefits for large businesses and state and local governments. These are important, but Schreiner suggested that they represent missed opportunities to describe how ACS data are used by small businesses in the respondent’s community (which might be more appealing than the notion of personal information being used by “big business”) or how they are used by nonprofit organizations to provide aid (invoking an appeal to helping others).
Schreiner said that the work suggested a seventh lesson: some of the current messaging lacks justification, in the sense that “the jury is out as to whether the messaging helps” address respondents’ actual concerns or needs. For instance, the materials contain messages related to the construction of the survey—akin to “you are part of a random sample,” “ACS is a continuous survey used to track changes over time,” and “ACS is better than other sources of data.” These are technical arguments and they are true, Schreiner noted, and the statisticians that conduct the survey undoubtedly feel an obligation to convey those messages—but it needs to be considered whether they strike some potential respondents as confusing detail. Schreiner added that some of the current messages lack justification in the sense that it is apparent that better options are available; he noted that the one business-themed message conveyed by the current materials speaks to corporate benefits, which might be less appealing to potential respondents than community-level or small-business benefits.
Closing with a final lesson and observation that visual design is not consistent in the mailings, with wide variation in color, logos, graphics, and other style elements, Schreiner said that the Census Bureau is in the process of developing a revised set of mailing materials based on these lessons learned and the strategic framework. The Bureau’s next steps will be cognitive testing of the revised
materials, followed by field testing, evaluation of the results, and making recommendations for a new set of materials.
3.3.3 Discussion
Asked to discuss the Census Bureau’s strategic framework communication strategy from a fresh perspective, Michael Schober (New School for Social Research) commended the presentations in this session as impressive, systematic work, adding that it is good that this work on comparing the effectiveness of alternatives has been carried out and is planned to continue in the next phases of developing new materials. Schober echoed the observation that the current ACS materials are quite complex, which he attributed to years of updates, testing, and iterative improvements to try to reduce perceived “barriers to accepting the invitation to participate in the survey,” among different (and evolving) subgroups in the ACS target population. Schober observed other reasons for the way the mail materials have developed including legal requirements, cost constraints, and the perceived need to include a “mix of carrots and sticks” to jog response. But the bottom line remains the same, he said: The mail materials present “a lot of text to read”—some of which is contradictory, redundant, or mixed messaging—and he added the basic fact that some recipients “don’t read everything they receive.”
In a broad sense, Schober said that the current mailing materials developed from “tried and true” procedures. The basic strategy of the ACS is to contact a sample of address-based households (rather than individual people) and to use postal mail as the principal contact strategy—approaches that build from decades of practice. But Schober argued that, in the past few years, people’s day-to-day methods of communicating have experienced an unprecedented degree of change. In turn, this has changed the environment in which potential respondents receive ACS solicitations, to the point that failing to change communication strategies is itself a choice that may harm the viability of the survey going forward.
Spelling out these major changes in more detail, Schober noted the ubiquity of mobile devices—for some people, a smartphone is their only computing device and their only onramp to the Internet. Choosing and switching between multiple modes of communication, many times per day, such as from texting to talking or from video to email, is the new norm for many. These mode choices and switches often take place on the same device and usually involve very little effort. An individual’s mode choice can be transitory (a momentary preference for a particular purpose) or more chronic or permanent preferences (to wit, Schober conceded that “I get annoyed when I get voicemail” messages, and he acknowledged a subset of people for whom text messaging has become the preferred mode above all others).
Schober said the ACS mail contact strategy has to be understood in the context of a new world of communications, in which “not everyone looks at ‘snail mail’ anymore.” Even if they do look at the physical mail, those ACS mail contacts are competing with communication attempts from family, friends, work colleagues, marketers, pollsters, Facebook friends, and many others. Schober noted that those other communications, including other survey participation requests, come in multiple modes (often online) and tend to be easier (require less effort) for the respondent to agree; participating in a Facebook survey or poll requires no additional effort, or text message links to URLs can lead immediately to a survey on the same device. By comparison, nearly all of the ACS invitations require switching from paper (written communication) to a different response mode, which can take some effort. Potential respondents are now asked to go to a computer and type in a URL and an ID code—a strong push to a self-administered Internet survey. If the recipient prefers paper-and-pencil or some other mode, that mode comes (or may come) in a subsequent mailing rather than immediately. Schober said this differs from the trend in other survey and communication forums, toward burden-reducing immediate access and short-attention-span communications.
Schober proposed the Census Bureau explore ways to make accepting the invitation to participate in the ACS easier and more “contemporary.” He said that the idea is to remove as many barriers as possible to the “impulse” to respond to the survey—to leverage technology in a respondent-centered approach, trying to facilitate use of their preferred mode(s) of communication to engage with the ACS from the start. In doing so, he added, respondents could opt in to receiving further communications to that mode and gain even easier access to the Internet questionnaire. Why not, Schober asked, allow or even encourage respondents to send a text message to a 5-digit number (an increasingly familiar mode of both official and unofficial interaction) to either receive a link to start the survey or to opt in to text messaging as their preferred mode of participation?
There are, to be sure, obvious constraints to this in the ACS context, Schober noted up-front—constraints that are both operational and legal. The operational constraint is that the ACS (like the decennial census) uses housing units and associated addresses as its sampling frame—thus, in the absence of reliable information linking mobile telephone numbers or email addresses to physical addresses, there is a definite logic behind the first contact being by physical mail. The principal legal constraint is the Telephone Consumer Protection Act (47 USC § 227) prohibitions on unsolicited text messaging, making it not viable for purely out-of-the-blue contacts with survey recipients. Still, Schober said, there is evidence that contacting respondents by text messaging can have major benefits in a predominantly smartphone world; no extant studies are exactly comparable to the ACS, but analogues suggest the idea is worth considering seriously.
- Schober cited the Holland et al. (2014) work on the Army Study to Assess Risk and Resilience in Servicemembers (Army STARRS) survey, which sent prenotification of the survey to approximately 2,500 sampled soldiers, varying one of four strategies in the experiment: no prenotification, letter only, text only, and text-and-letter. (The prenotification, by any of these challenges, was followed by an email invitation to participate.) He said that the study found that text message notification, whether alone or in combination with a letter, led to higher completion rates and, in many cases, faster completion of the survey (before issuance of a first email reminder).
- As an example of text invitation to participate in a mobile web survey, Schober cited studies by Mavletova and Couper (2014) and De Bruijne and Wijnant (2014). In the first study, the survey achieved a 21 percent participation rate within 1 hour of a text/SMS invitation (relative to 11 percent in the first hour when the invitation was issued by email). The second study experienced similar results: 19 percent response within 1 hour of a text invitation, versus 9 percent by email.
In particular, Schober drew strength from collaborative research in which he had participated: a “modern mode choice” study documented by Conrad et al. (2017) conducting surveys by Apple iPhones. The underlying survey offered four response modes: Human Voice (phone interview with a human interviewer), Human Text (text message exchanges with a human interviewer), Automated Voice (phone interview using an interactive voice response–type system), and Automated Text (text message exchanges with an automated server). (He acknowledged, again, that this is a markedly different situation than the direct ACS circumstances, but that it still yields some informative results.) Schober observed that the study found a much stronger preference for Automated Text than the researchers had expected, and he noted that this mode is becoming increasingly familiar and comfortable as chats with text-message “robots” become more prevalent. He noted that the asynchronous (text messaging) modes led to improved data quality as answers were more precise, and respondents were more inclined to divulge sensitive information. Moreover, the mode choice itself seemed to lead to improved data quality via all of the modes—in short, Schober said, “people were happier” completing the survey. In debriefings with the participants after completing the survey, respondents were asked why they chose the particular interviewing method that they did, and Schober said that the results were illuminating. Some people expressed firm insistence on speaking with a clear, human voice on the other end of the line (“and some people will always want that,” he added), while others appreciated the convenience of not having to speak out loud (for instance, if they were at their workplace or they did not want to disturb other family members) offered by the text message channels. The text options also
made it possible for respondents to take their time in responding, which some appreciated greatly. The Automated Voice channel was viewed less favorably—one respondent noted that they did not really want to speak their answers but that they were driving, which made the voice option important, while another hinted that the impersonal nature of the Automated Voice made divulging personal information slightly easier. Again, Schober emphasized, this survey’s circumstances do not comport directly with the ACS, but it is illustrative.
Saying that he was seconding comments by other discussants at the workshop, Schober agreed that he saw remarkable opportunity in the ACS and for the ACS in its testing program. The survey’s large samples and high response rates could facilitate some truly innovative experimentation on, for instance, identifying population subgroups with firm mode preferences and understanding motivations underlying survey participation. He noted that the real opportunity of tailoring the mode of communication to the potential survey respondent, rather than solely tailoring the mail materials, is the prospect of genuinely improving respondent satisfaction rather than simply “reducing burden.” More succinctly, he said, the goal might be to make respondents actually glad that they participated in the ACS, not to make them feel “less miserable” for having done so.
He reiterated that he was offering the suggestions to consider in research and testing, and not for immediate implementation. After all, he noted in closing, response rates for the ACS remain high “so it’s not that the current strategy is broken”—and, moreover, implementing new options always bring both anticipated and unanticipated logistical challenges. But, he argued, communication strategies in the broader population and their attitudes toward survey populations continue to change at an astonishingly rapid rate. Failure to adapt to those changes is actually a move backwards rather than standing still and, he commented, the eventual alternatives may well end up reducing overall survey costs.
3.3.4 Floor Discussion
Mark Mather (Population Reference Bureau) opened the floor discussion for this session by asking Oliver and Schreiner about the manner in which the estimated survey completion time is presented to respondents. He observed that, in looking at the current ACS questionnaire, the estimate that the survey will take 20–40 minutes for an average household to complete is relatively buried in a block on the last page of the questionnaire; he asked whether this was a deliberate choice and whether that was a choice being revisited in the revised mailing materials. Oliver replied that the time estimate is required to be presented on the questionnaire (by the Office of Management and Budget, for clearance of the survey under the Paperwork Reduction Act). But, from a communications standpoint, he noted that the Bureau has judged it best not to
highlight or overemphasize how long the survey may take. Schreiner added one of the most formidable barriers to survey completion is starting it in the first place, and the historical fear is that the respondent may feel overwhelmed from the beginning and decide not to do anything.
Darby Steiger (Westat), having asked earlier in the day about the rates of completion of the Internet ACS questionnaire by phone, tablet, or computer, followed up by asking Schober whether he knew of any research on the length of time or the number of questions that people are willing to “tolerate,” answering a survey via their cellphone. The 20–40 minute estimated completion time being fresh in mind, the natural concern is whether people are deterred from answering a “big” survey on a “small” device. Schober answered that he was glad to hear mention from the Census Bureau that the ACS instrument has become more mobile-optimized, so that is hopefully helping matters. He said that the general rule for cellphone data entry is that shorter is always better, “if there’s any way to do that.” He said his examples were not as complex as the ACS questionnaire, but they still involved 20–30 questions and “could take a rather long time for people to get through.” With a survey that large, Schober said that some respondents “took big breaks in between” when they could—something that the asynchronous mode makes possible, and a feature that some respondents reported enjoying. Yet even with those breaks, Schober said that the time in-field for conducting interviews by text message was “a lot shorter” than the time needed for in-person interviews, with much of that added time coming in multiple contact attempts. To Steiger’s question, he said that there is surely some upper limit but there is not a firm evidence base for citing such a limit now. And, with the continued rate of change in the world, he said that it is likely that “longer and longer” will become more plausible over time, with respondents developing an increased tolerance for interviewing via text on mobile devices.
Erin Hustings (National Association of Latino Elected and Appointed Officials) asked how the strategic framework’s deliberate emphasis on targeting the cynical or mistrustful segment of the respondent audience syncs with the Census Bureau’s other important outreach work: getting cooperation from hard-to-count populations, people of color/minority groups, low-income people, linguistically isolated people, and others. Oliver commented that part of the current research is to learn more about the characteristics of the people who get Mailing 5, who are still nonrespondents after several mail attempts. He added that the major challenge is similar between the census and ACS contexts: fine-grained tailoring of materials for segments of the mailout population is not feasible at such a large scale, and so the core mailout pieces have to be “things that are applicable to the entire respondent base.” A major objective of the ACS mailing piece redesign is to make the language plainer and simpler, providing the right cues to respondents who just need awareness of the response options and mild encouragement to respond while also directing messages to harder-
to-reach, target audiences to stimulate response. Schreiner agreed, adding that “it’s hard enough to rewrite the letter in one language” to achieve all these ends, much less to contemplate how those messages play out in multiple languages—but that that has been part of the discussion throughout the redesign process.
Constance Citro (Committee on National Statistics) said that she appreciated hearing about the strategic framework and the approach to the redesign; too often, in the past, such ideas have found their way into census tests and experiments that are sufficiently complex that meaningful effects of any individual treatment cannot be distinguished. She said that she wanted to pick up on the idea that Hustings had just raised; she argued that experimental dollars and priorities should be honed on effectively communicating with and trying to spark response among the poor-response demographic and socioeconomic groups through the broad-brush mailing materials and other contacts. The need to avoid having different, customized materials and questionnaires is understandable, but the messaging and appeals that may work best with the hardest-to-reach target populations seem unlikely to hurt response by the other parts of the population. For some nonresponse subgroups, she said, it is likely that there may be no easy solution, and that segment may always be a heavy part of the nonresponse follow-up/field interviewer workload. But, to the extent that the Census Bureau can “get beyond tests with a half-a-percent difference on small variations of treatments,” and focus on higher-impact revisions and experimental treatments, Citro argued that the ACS would be better off. The ACS is entirely about small-area data; accordingly, there are also bound to be small-area and small-population-subgroup differences in response. She suggested the Census Bureau use its research resources to better understand those differences. Schober agreed, adding that some of the massive changes in communication styles were experienced very differently by demographic subgroups; major community-level differences and mode differences are a big part of the story. He called for continued exploration: experiments on mode preference and strategies from 5 years ago are not really helpful because the communications world has shifted so much.
3.4 LISTENING TO ACS RESPONDENTS
The final session of the workshop examined the other side of the fundamental ACS communication dynamic: considering what information is learned about respondents’ experiences in completing the ACS questionnaire or in deciding whether to participate at all.
3.4.1 Assessing High-Burden ACS Questions
Reduction of respondent burden is an oft-stated, high priority goal for survey programs like the ACS, and so a natural starting point is to try
to determine the parts of the current survey that are most burdensome in completion time, in cognitive effort, or by other metrics. David Raglin (U.S. Census Bureau) began his description of the Census Bureau’s attempt to answer these questions with a reminder of the basic structure of the current ACS questionnaire. The questionnaire is divided into three basic sections:
- The Roster and Basic Demographics section is formatted in slightly different ways across the modes of administration. The paper questionnaire asks for the household population count (1 question) on the front cover of the questionnaire booklet, and then collects household roster and basic demographic information in a series of 6 questions. The electronic ACS instrument (Internet and computer-assisted personal interviewing in the field) asks 5 roster questions and 5 demographics questions.
- The Housing section contains up to 23 questions. Raglin added that no housing unit gets all of these questions—for instance, the survey follows different branching patterns or sequences of questions for homeowners rather than renters.
- The Detailed Person section has up to 47 questions but, again, the full set of questions is not asked about every person at a responding household—for instance, there are different branches that would be followed for persons who are employed rather than unemployed. A combination of survey policy and the logic of the questions also limits the ACS to asking only 11 detailed person questions about household members age 14 and under.
Raglin said that, as part of the 2014 ACS Content Review,11 relevant metadata were assembled regarding each question on the survey, including the median number of seconds needed to complete the questionnaire item (on the electronic modes), median response rates for each particular item by county, and limited data on the number of complaints received by the ACS Office about the question. This information was complemented with the Interviewer Survey, an interview with a sample of 1,053 field representatives or telephone interviewers (computer-assisted telephone interviewing being offered as a response mode at the time) stratified in such a way to get a range of geographic sites and interviewer experience levels. The survey asked the interviewers, who had administered to survey to respondents in the field, to answer questions regarding the burden (referred to in the study as “cost,” though Raglin reiterated not in the financial sense) and the benefits of each ACS question. In terms of cognitive burden, the interviewers were asked which ACS questions seemed to be most confusing or difficult to respondents—which required additional probing or discussion to elicit response, or seemed to
___________________
11 For additional detail on the content review, Raglin made reference to https://www.census.gov/programs-surveys/acs/operations-and-administration/2014-content-review/methods-andresults.html.
impose a burden on memory (respondents clearly having difficulty retrieving the requested information). On sensitivity, the interviewers were asked which ACS items had caused respondents to be reluctant to answer—as well as which items the interviewer may have felt uncomfortable asking directly of someone. Finally, the Interviewer Survey asked the ACS interviewers to score each ACS question on a 5-point Likert scale (i.e., not at all difficult to very difficult) and to list the three questions that the interviewers considered to be most “difficult” overall.
Raglin said that the Interviewer Survey revealed that four ACS questions showed up as the most confusing to respondents or required additional probing by interviewers:
- Type of Internet Access, which 79.4 percent of the interviewers deemed confusing and 79.3 percent said typically required additional probing. In this case, Raglin said, a main source of trouble seemed to be that people instinctively thought of the “brand” or name of their Internet service provider when asked the question and so would want to reply “Verizon,” “Comcast,” or the like.
- Ancestry, which 57.3 percent said was confusing and 63.0 percent said required additional probing.
- Race, which 48.9 percent said reported to be confusing and 59.9 percent said required further probing.
-
Number of Rooms, 43.4 percent confusing and 55.4 percent requiring additional probing. In his presentation, Raglin pointed out that this question is made difficult by a seemingly simple topic with a very complicated and nonintuitive description. To prove the point, he asked the workshop audience to read the question and try to answer it in their own minds:
How many separate rooms are in this house, apartment, or mobile home? Rooms must be separated by built-in archways or walls that extend out at least 6 inches and go from floor to ceiling.
- INCLUDE bedrooms, kitchens, etc.
- EXCLUDE bathrooms, porches, balconies, foyers, halls or unfinished basements.
While the number of bedrooms and the number of bathrooms are fairly well-known quantities—and typically and prominently defined and labeled in real estate listings—people tend not to know off-hand how many “rooms” they have by this general definition. Raglin added that the confusion is undoubtedly heightened by the increased popularity of open floor plans.
Raglin added that the financial questions, across the board scored highest among the items that seemed to cause recall problems or caused discomfort to either
| Question | Topic | Median Completion Time (seconds) |
|---|---|---|
| P47 | Income components | 155 |
| P30 | Place of work (whole question) | 78 |
| H14 | Cost of utilities (all) | 71 |
| P16 | Health insurance coverage | 53 |
| P15b | Residence 1 year ago | 48 |
| P4 | Age and date of birth | 36 |
| P13 | Ancestry | 34 |
| H22 | Mortgage | 31 |
| P41 | Class of worker | 30 |
| P42 | Name of employer | 30 |
SOURCE: Workshop presentation by David Raglin.
the respondent or the interviewer; other ACS items that were similar in those regards included Time Leaving for Work and Race.
Raglin displayed the questions that took longest to complete on the electronic questionnaires in Table 3.8. He explained that the Census Bureau had studied median completion times to not unduly overweight long responses, as well as because they used paradata—“and anyone who has worked with survey paradata knows that it can be a little messy at times.” The entries in the table are median completion times by household, adding together the time it took to complete person-level questions for all members of the household. “In fairness” to the income components being “by far” the most time-consuming item, Raglin said, it is an 8-part question—but it is still a stark divide in time consumption.
Raglin acknowledged that previous, informal discussions of potentially problematic questions routinely focused on the same ACS items—so, he said, the results of the interviewers’ own assessment of the most burdensome questions “weren’t terribly surprising.” In order of their appearance on the questionnaire, Raglin said that the ACS items most frequently described as high-burden by ACS interviewers are as shown in Box 3.4. He said that it is also not surprising that financial questions show up prominently in these listings, with all but the first three entries on the Housing side being finance related and the Income item on the person side being flagged as burdensome.
Raglin said that analyzing the results of the Interviewer Survey is one part of a broader, ongoing effort by the Census Bureau to improve the ACS questions. He said that their strategy has been to do cognitive research to
try to understand the problems with high-burden questions and then evaluate alternatives—including consideration of whether the Census Bureau really needs to get all of the information requested by the question and whether some or all of the information might be obtainable from another source. Question text is then reworded, after much iteration, and additional feedback is sought from respondents in cognitive testing. This work has already produced some changes in ACS question wording and several other changes are due to take effect in the ACS in 2019. He would close his presentation by summarizing that the work has already resulted in progress in improving some burdensome questions, but that the Census Bureau needs to continue the work of question burden reduction “while still getting the information we need to provide data to our Federal users.”
As examples, Raglin displayed the before-and-after text of several questions in Figure 3.12. Of the Internet subscription question, Raglin began by noting that “subscription” is not a term that is really used anymore in the Internet access context, so the rewording avoids that term. It also tries to use more current methodology, including reference to cellular data plans—because, as described earlier in the workshop day, smartphones are the only Internet access point that many people use. Of the Time Left for Work, Raglin said that the main reason why the question routinely registers as “high burden” is the awkwardness and fear generated by asking people when they are leaving their home—creating at least the momentary misconception that the interviewer is trying to determine when the home would be empty/unguarded when the real interest is in studying commuting patterns. The revised wording makes the tie to commuting explicit. With the Retirement Income question, Raglin said that there were concerns that the question was confusing and perhaps too terse, and that it may have been missing some types of retirement income; hence, the
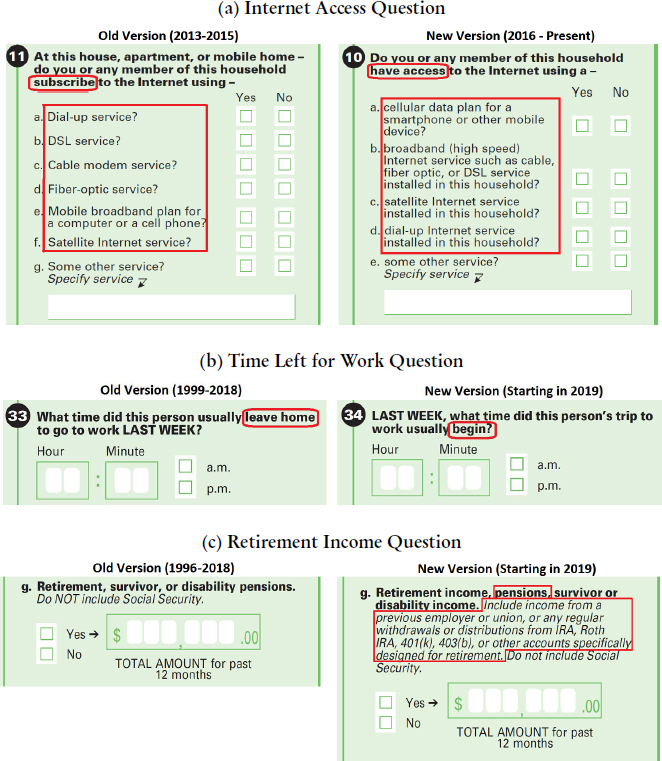
revision adds specific examples of what is meant by the category, including use of the more familiar term “pension.”
Raglin briefly hinted at some directions that are being considered for revising high-burden questions. Renters, in particular, have major difficulty with the Year Built question; they might have some rough ballpark knowledge of when their buildings were constructed, but not precise. Raglin said one option being considered is making the response categories wider or broader—within some constraints, such as “pre-1939” being a particularly meaningful designation for ACS data use in block grant allocations. With respect to the Place of Work question, the stumbling block that makes the question seem burdensome is that the question asks for location information but interjects “county” as one of the subquestions. This disrupts the flow of the way address information is usually collected from respondents and from the way in which respondents are accustomed to giving it, raising the question of whether county (and the notion of whether the workplace is within city limits) is really necessary. Similarly, the Residence One Year Ago item also asks the respondent for address information and, again, interjects with the query for county; the question is whether that subitem is really necessary.
3.4.2 Lessons Learned from ACS Focus Group Work
Jessica Holzberg (U.S. Census Bureau)12 presented additional recent qualitative research regarding the development of questions on the subjective burden of the ACS, work that flowed out of the 2016 ACS workshop (National Academies of Sciences, Engineering, and Medicine, 2016) and the resulting second version of the ACS Office’s Agility in Action (U.S. Census Bureau, 2017). The broader research project has three phases—a literature review, focus groups, and cognitive interviewing; because the cognitive interviewing is still ongoing, Holzberg said that her presentation would focus on the (completed) focus group findings.
Holzberg quoted Bradburn (1978:36)’s definition of burden: “the product of an interaction between the nature of the task and the way it is perceived by the respondent.” Conceptually, Holzberg said that the two clauses of the Bradburn definition resolve into what might be called objective burden (the nature of the task) and subjective burden (the way the task is perceived). She said that the Census Bureau’s research thus far has focused heavily on objective burden, while this new, recent effort is meant to study subjective burden. She added that, in this framework, respondent perceptions may be thought of as being driven by combinations of:
___________________
12 Jessica Holzberg also credited her Center for Survey Measurement (now the Center for Behavioral Science Methods) colleagues Jonathan Katz and Mary Davis in the presentation.
- Characteristics of the survey/task, including the questions, the overall length of the survey, the mandatory nature of ACS response, and the number, mode, and messaging of contact attempts; and
- Characteristics of the respondents, including household size (which would increase completion time), attitudes toward the ACS or government in general, interest/motivation in participation, and usual demographic attributes.
In turn, the perceptions that are shaped by these characteristics contribute to respondent burden.
The focus group research described by Holzberg was conducted in spring 2017, getting input from a total of 46 recent ACS respondents. The focus groups were structured to cover a range of geography (two sessions in Washington, DC, and four each in Chicago and Houston) as well as the response mode by which the person had answered the ACS (five groups of self-response [paper or Internet] and five of interviewer-administered [including phone, which was then still an option] respondents).13 Focus group participants were recruited by telephone, with recruitment targets driven by the person’s ACS response mode above all. In particular, participant demographics were not considered as part of the focus group selection, and that information was only collected at the focus group settings. As it turned out, Holzberg said, the groups were “fairly even” on most demographic variables (white versus nonwhite, less than bachelor’s degree versus higher eductional attainment, younger than 45 versus older, and so forth); however, the focus group participants tended to be from small households (1–2 persons) and tended to be non-Hispanic. All focus group participants received a cash incentive ($75) at the end of the sessions.
Each of the focus group sessions proceeded in two parts. First, moderators were asked to guide the participants in an open discussion of their experiences with the ACS—their general likes and dislikes, what they recalled about the contact attempts, how it was that they decided to respond, and their experiences completing ACS questionnaire items (e.g., what questions they found sensitive or for which they needed to look up information/ask for help). In the second part, group participants were administered a short, paper survey that had been adapted from a research study of the Consumer Expenditure Survey in 2012–2013. That survey included 12 questions about key topics related to burden (their sense of the difficulty or sensitivity of specific ACS questions, their degree of trust in the Census Bureau, their sense of the length of the survey and its importance, and so forth) as well as single-question assessments of the perceived general burden of completing the ACS. This short survey was followed by additional, closing discussion.
___________________
13 As part of separate methodological research, Holzberg noted that the group sessions were also equally divided between sessions with 3–4 respondents and larger sessions with 5–8 respondents.
Holzberg said that it was somewhat relieving that the focus group survey suggested that ACS participants do not find the survey to be a major imposition. To the question “How burdensome was the ACS to you?,” nearly half of the participants (22; 48 percent) answered “not at all burdensome” while 17 (37 percent) found it to be “a little burdensome.” None of the focus group participants responded that they found the ACS “very burdensome,” and the remaining 7 (15 percent) scored it “somewhat burdensome.” Holzberg that the discussion comments related to the question provided further reassurance, tending to be along the lines of “not a big deal,” “not very taxing,” and “not a very huge imposition on my life”; she noted that it had been particularly interesting that one focus group participant expressed genuine worry that something had “gone wrong” with the ACS to motivate the focus group discussion itself, and that the participant could not understand how ACS burden could be so big a problem. Holzberg said that one down side of the focus groups’ strong perception that the ACS is not unduly burdensome is that they, correspondingly, could not offer much feedback on ways to reduce ACS burden. Things that did get mentioned included better advertising and clearer explanations of why people should respond; there were also “generic suggestions to ask fewer or less sensitive questions” (without any suggestion of specifics). This feedback exercise, itself, posed some terminological difficulties: Holzberg said that asking people about the “burdensome” nature of the ACS caused some complications with participants who generally did not think the survey to be burdensome, suggesting the potential utility of other language (e.g., “bothersome,” “annoying,” etc.) in eliciting feedback. Holzberg said that the focus group respondents made substantially fewer comments than expected about the number, mode, and timing of ACS contacts when considering the overall burden of the ACS. She added that some respondents remembered that response to the ACS is mandatory, but that not everyone viewed this as a bad thing.
The focus group survey also sought to describe how different aspects of the ACS contributed to perceived burden. Holzberg summarized the four major directions as follows:
- Length of the survey: Asked “Do you feel that the length of the ACS was too long, about right, or too short?,” 62 percent of the focus group participants answered “about right.” (Only 1 participant answered “too short”; one participant did not answer the question.) The 16 (36 percent) participants who found the survey to be “too long” tended to be from larger households, Holzberg said. Several of the discussion comments suggested that some participants find that the length of the survey reinforces its importance.
- Question difficulty: Asked “How difficult or easy was it for you to answer the questions in the ACS?,” the overwhelming majority of the focus group
-
participants found it to be easy—22 (48 percent) answering “very easy” and 17 (37 percent) replying “somewhat easy.” None of the participants ruled the ACS “very difficult,” with the remainder 7 (15 percent) scoring it “somewhat difficult.” Holzberg said that one difficulty noted by the respondents was having to answer questions about or on behalf of other people in their households.
- Question sensitivity: Asked “How sensitive did you feel the questions on the ACS were?,” the focus group participants were evenly decided on both sides—23 (50 percent) replying either “very sensitive” or “somewhat sensitive,” the other half answering either “a little sensitive” or “not at all sensitive.” Here, too, Holzberg said that a concern expressed in the discussion was having to serve as a proxy for someone else in the household. She added that some respondents tended to view the information requested on the ACS as being “private” and that they were often surprised at the type and detail of the questions (but not greatly troubled).
- Number of contacts: To the question “Thinking about the contacts you received for the ACS, would you say it was too many, a reasonable number, or not enough?,” 38 (83 percent) replied “a reasonable number.” The other 8 focus group participants replied “too many,” with no participants selecting “not enough.” Holzberg said that the discussion comments suggested that some focus group participants actually saw value in the persistent reminders provided by the Census Bureau—that they knew that they should respond to the ACS and intended to, but just had not done so as yet.
Holzberg noted some key limitations of this focus group research, chief among them that, just by nature of the exercise, “the most burdened respondents” to the ACS are unlikely to have been recruited into the focus groups. Moreover, the time gap between ACS response time and focus group participation (which could have been “one month or more”) might have contributed to some forgetting of the experiences. Still, Holzberg suggested, the qualitative research suggests that the ACS may not be as “burdensome” as it is sometimes portrayed to be—and reinforced the importance of measuring subjective perceptions in addition to objective burden. Focus group participants did not generally consider the ACS to be burdensome, with some finding that word itself to be a strong one to describe the survey. She commented in closing that cognitive testing of some shortened, revised questions is nearing completion and that the report (including recommendations for field testing) would be available in short order. Holzberg also mentioned the Census Bureau is considering the possibility of implementing optional, follow-on questions in the ACS itself to generate some respondent feedback.
3.4.3 Trends in Respondent Concerns and Assessing Burden
The Census Bureau closed its series of workshop presentations with a joint discussion of the comments and feedback that the Bureau receives about the ACS through two formal mechanisms, the Bureau’s Office of the Respondent Advocate and the ACS Office’s own communications area.
Respondent Advocate
Ruth Chan (U.S. Census Bureau) commented that members of Congress began voicing concerns on behalf of their constituents about the sensitivity of ACS questions, with increasing frequency after the ACS began full-scale operations in 2005. After a Congressional hearing in 2012 on “The Pros and Cons of Making the Census Bureau’s American Community Survey Voluntary,”14 the Office of the Respondent Advocate for household surveys was created in the Census Bureau in 2013. Two years later, a Business Respondent Advocate was added to provide the same respondent-focused support to the business surveys.
Chan noted that the Census Bureau’s strategic plan includes the goal to “provide an exceptional end-to-end experience” for various groups, including the respondents to its major surveys and programs. The Respondent Advocate’s office is intended to work towards that goal of improving the respondent experience. The office works with survey managers on a case-by-case, short-term support basis, as well as collaborating with them on long-term programmatic improvements. The Respondent Advocate also provides an important intermediary or point of contact between Congressional staff and the Census Bureau regarding respondent concerns. Chan said that the Respondent Advocate’s office works with respondents who get in touch with them by various modes (phone, email, physical mail). Some respondent cases come to the office directly, including through the census.gov webpage, but many more are forwarded to the office by other areas of the Census Bureau. Chan described the basic process as listening to respondent concerns, documenting their feedback, and providing a resolution; in the process, they work to communicate back to respondents the mission of the Census Bureau and its role in producing accurate statistics.
The ACS continues to be a major portion of the Respondent Advocate’s work, with roughly 25 (65 percent) of the household survey Respondent Advocate cases received each month concerning the ACS, and the cases come from all over the nation. Chan said that two-thirds of those cases involve
___________________
14 The hearing mentioned was a March 6, 2012, hearing of the Subcommittee on Health Care, District of Columbia, Census and the National Archives of the U.S. House Committee on Oversight and Government Reform, and was primarily focused on then-pending legislation to make ACS response voluntary.
the self-response options to the ACS and one-third concern in-person ACS interviewing. She explained that the ACS-related complaints and feedback commonly involve four principal themes:
- Legitimacy, with the respondent wondering whether the ACS solicitation is legitimate or a scam;
- Privacy and confidentiality, with the respondent concerned about the Census Bureau maintaining the safety of provided information;
- Safety, typically concerns about whether the ACS field interviewer is truly a Census employee; and
- Burden, with the respondent seeking help with participating in the survey given unique personal situations.
As an example of the latter, Chan described recent contact that the office had made with a constituent (and potential ACS respondent) whose multiple disabilities made self-response by any means difficult. Chan noted that, in that case, the Census Bureau was able to put the respondent in contact with an interviewer trained to go through the questions in a very deliberate, understanding way.
Chan commented that the Office of the Respondent Advocate is continually working with the Bureau’s communications officials, to ensure that respondent concerns are included in developing methods and procedures. The office also makes ongoing efforts to evaluate webpages and materials to try to make sure they cater to respondents’ needs. They also work with subject matter experts throughout the Bureau to better understand and recognize challenges faced by respondents to the ACS and the Bureau’s other surveys. Chan noted her office’s program of visits to congressional offices to provide information on the ACS and Census programs.
ACS Communications Office
Nicole Scanniello (U.S. Census Bureau) spoke about the ACS Office’s Communications Area, which manages ACS-specific communication from respondents, stakeholders, and the general public. Structurally, one major piece of its efforts is providing technical assistance and educational materials to the ACS data user community, conducting data user training and webinars and maintaining the ACS website. Scanniello said that the ACS Communications Area plays a similar role to that Chan had described for the Respondent Advocate: striving to improve the respondent and data user experience and to understand and respond to stakeholder concerns.
In this work, Scanniello commented that the Communications Area has many partners within the Census Bureau, including the balance of the ACS Office (noting that the Communications Area had participated in the mail materials research discussed during this day at the workshop)and the Bureau’s
Office of the Respondent Advocate. Other partners in the broader ACS communication effort include: the Field Division (whose interviewers conduct the face-to-face contacts with survey respondents); the Office of Congressional and Intergovernmental Affairs (which serves as liaison not only to congressional offices but to state and local officials); the Public Information Office (which plays a major role in data dissemination); the Customer Liaison and Marketing Services Office (which manages the IT systems for customer relations and is the primary event scheduler); and the Census Bureau’s Telephone Centers (which, even though telephone response is no longer an ACS response mode, still receive a lot of inquiries from respondents).
Scanniello commented that “snail mail may be declining for a lot of people, but not for us.” Of the 1,264 inquries that the communications area received in 2017, just over half (633; 50.1 percent) were letters or mailed items. Just over one-quarter (344; 27.2 percent) of their cases were received by email and the balance (287; 22.7 percent) were phone calls.15 That said, Scanniello noted that 88 percent of those 2017 letters did not require any response: In many cases, there is no return address, and some of the letters sent to the Census Bureau concerning the ACS are actually on-paper requests to receive a paper questionnaire (in those cases, Scanniello said, no response was necessary if the respondent was already in processing to get one). On the other hand, many letters require two responses—forwards of concerns from congressional offices will yield a letter back to both the respondent and the congressional office. Letters and emails are tracked, and the responses are maintained in a database.
In terms of the major themes that the ACS Communications Area sees in its respondent cases, Scanniello broke down the 1,264 communications from 2017 as follows:
- The plurality of the easily classifiable communications, 333, questioned whether the ACS is legitimate or a scam;
- 241 were problems with the ACS Internet response channel, most often a lost user ID or PIN needed to continue ACS response;
- 151 were to convey refusal/declination to participate;
- 137 concerned confidentiality or privacy matters;
- 111 questioned the “intrusive” or “invasive” nature of ACS questions;
- 67 were questions about the mandatory nature of response to the ACS;
- 66 were questions about the constitutionality of the ACS;
- 42 were questions about why they were included in the ACS sample (the “Why Me?” concern);
- 19 were expressions of sentiment toward the government in general; and
___________________
15 Scanniello added that the phone call totals do not include calls to the survey’s Telephone Questionnaire Assistance line, such as to request a paper questionnaire or attempt actual data collection.
- 607 dealt with other matters, such as how to handle the death of a person at the ACS sample address and questions confusing the ACS with the decennial census.
Scanniello commented that the Communications Area conducted an analysis of complaints received following a suggestion raised at the 2016 workshop, and that it has since generated annual reports on respondent concerns and provided them to all managers in the ACS Program—-a practice that she said reflected the importance of respondents to the overall ACS process. She added that the initial analysis of complaints received had provided interesting counters to the popular perception that the field interviewing component of the ACS is particularly problematic or sensitive. Of 499 letters received and analyzed by the Communications Area in 2016, 70 percent of their associated households were still in the mail data collection phase—suggesting to Scanniello that “when people get our materials, they are immediately replying to us” if they are concerned. Moreover, Scanniello noted that two-thirds of those respondents who had sent letters concerning the ACS in 2016 did eventually complete the survey.
Scanniello closed by briefly mentioning a number of future ACS communication efforts. The Communications Area is developing at least two videos, one targeting reluctant respondents and the other an instructional piece on using the Internet data collection channel. Further, they are developing flyers or fact sheets targeted at key response groups: one explaining the ACS and its role relative to American Indian and Alaska Native tribal lands, one to allay concerns specifically raised by senior citizens, and a third for distribution to local law enforcement agencies to try to head off some of the common questions about the legitimacy of the ACS. Finally, she noted that they continue to try to improve the ACS website, and are investigating other lines of respondent characteristics research.
Later, in the floor discussion portion of this session, Erin Hustings (National Association of Latino Elected and Appointed Officials Educational Fund) praised the Census Bureau’s Office of the Respondent Advocate and said she tries to build awareness of ACS communications as much as possible. She asked Chan and Scanniello whether their outreach to congressional offices is planned in any systematic way (or what the triggering event to seek a meeting might be), and also whether they or the Census Bureau know of any attempts to deliberately impersonate a census employee (in person or online) to try to perpetrate fraud. Chan answered that they work with the Bureau’s Office of Congressional and Intergovernmental Affairs to set up visits; the visits are not triggered by anything in particular, just to try to get conversations started. On the second question, the contacts that they see do not generally rise to that level of activity. Some potential respondents have reported contact attempts that they perceive as harassing, but upon looking into them, they often turn
out to be misunderstandings. The Respondent Advocate’s work has not turned up evidence of wider scams. Darby Steiger (Westat) asked whether the Census Bureau does any work with the Federal Trade Commission or other relevant agencies that might be more directly attuned to possible fraud. Chan replied that she is unaware of such work, certainly relative to the ACS.
3.4.4 Discussion: Assessing Burden and Resolving Respondent Concerns
Scott Keeter (Pew Research Center) opened his remarks with the quip that he had been asked to comment on burden reduction even though, as a public opinion researcher, he is probably someone who has spent a career “inflicting maximum burden” on respondents rather than thinking of reducing it—“but I cared!” In seriousness, though, Keeter noted that survey researchers and data users like himself have a major stake in the continued viability of the ACS, and so that it is encouraging that the Census Bureau is taking steps like this workshop and the research presented at it. He said that is commendable that the Census Bureau takes criticism and advice seriously and that it assess what it hears, in a transparent fashion, testing what suggestions they can and generally explaining the reasons for not taking other suggestions.
Keeter acknowledged the Bradburn concept of burden as the product of the interaction between the nature of the task and the way it is perceived by the person as well as the model described by Scott Fricker16 in which burden depends on both respondent characteristics and the survey and task characteristics—both of which had been cited by Holzberg (Section 3.4.2). But Keeter argued that burden can also be about individuals’ reactions to sharing what they may regard as sensitive information, the problem being that it can be difficult to fully anticipate which questions are going to be viewed as invasive or sensitive to which specific people. He noted a comment by Kenneth Darga, then the Michigan state demographer, at a 2012 workshop on ACS benefits and burdens (National Research Council, 2013): Most of the time when the government gathers information about people, it is to make some kind of decision about them, whether how much tax they owe, what benefits they are eligible for, or the like. That is not what the Census Bureau does in the ACS, but respondents do not know that; Keeter suggested that it could be useful to study what respondents think the government is going to do with particular information collected. He noted that burden is very important to consider because burdensome questions might lead people to “satisfice” in their answers or decline to answer altogether, potentially decreasing the quality of the resulting data. And, as a political scientist by training, Keeter agreed that burden and perceptions of burden can inflict serious political costs, and he agreed with
___________________
16 The reference here is to Fricker’s presentation at the 2016 workshop; see National Academies of Sciences, Engineering, and Medicine (2016:8–12).
Citro’s comment on the workshop’s first day that “the Census Bureau needs some wins with respect to respondent burden.”
Burden is a central concept to both days of the workshop content, so Keeter indicated that he wanted to broaden his remarks to comment on the first day’s discussion of the potential of administrative records and third-party data. He said those presentations had made clear how formidable the obstacles will be for making wider use of third-party data as a direct substitute for survey responses. Accordingly, he said that he strongly agreed with Amy O’Hara’s suggestion to radically reimagine the ACS with more modeled measures based on administrative and other data—but, importantly, leaning more on external researchers to develop and implement those new data products. Other countries, particularly Canada, have made much progress in incorporating diverse data resources; even if this move is not technically or politically feasible in the U.S. and ACS contexts at the moment, there are pointers to useful models to consider.
Keeter noted the importance to keep discussion away from the oversimple suggestion that survey data are better than administrative data, or vice versa. One source is never going to be universally better than another, and progress will depend on finding the degrees to which we can “live with” using the different data sources as a supplement or complement in major applications. Coverage and completeness from administrative sources are unlikely to be perfect, and so the ACS and other programs will need to account for biases (for instance, urban/rural differences in quality of real estate tax data). Because of the heterogeneity in data sources and quality, Keeter said that is important not to expect across-the-board benefits in burden reductions for every respondent through the use of alternative data. Keeter noted the thorny, ongoing conceptual problem of resistance to giving the Census Bureau access to more public and private administrative data—when that goal “seems exactly in opposition” to reducing respondent burden. Finally, echoing his usual field of work, Keeter noted that the Help America Vote Act (P.L. 107-252), adopted after the turmoil of the 2000 presidential election, both mandated and funded states to create computerized voter registration systems. As a more speculative possibility, Keeter wondered whether the same kind of changes in state data practices might be “engineered” in order to boost the chances that state and local level data can fold up to use in the ACS or in national statistics generally, or if similar changes could be accomplished with private sources of data.
Of the day’s presentations, Keeter continued that it is important to consider the burden reduction implications of messaging and survey mode. He added that he liked the notion of making people happier with the survey-taking experience as a way of reducing burden, helping them understand the importance of the survey. Keeter also supported Michael Schober’s suggestions about better leveraging text messaging and mobile device access in the ACS context; the ACS has been optimized for mobile but respondents are not
encouraged to take the ACS on mobile platforms. Keeter commented that the Pew Research Center now has half of its American Trends Panel survey members completing their questionnaires by smartphone, with another 10 percent using tablets; that 50 percent has been growing and they expect it to keep growing. The opportunities for using a QR code on the survey invitation to directly launch into completing the survey are promising, he said.
Keeter said that he would defer to Darby Steiger on providing concrete advice regarding this session’s presentations, but he noted that they all illustrate the point that the ACS has been very responsive to feedback from respondents and stakeholders, and they make clear that the ACS is committed to reducing respondent burden.
3.4.5 Discussion: Structuring Respondent Communication Based on Feedback
Darby Steiger (Westat) offered her discussion remarks in two capacities. In the first, she noted that she has been working directly with the ACS Office and other Westat project staff on the cognitive testing portion of the subjective burden assessment that Holzberg had described. The team continued to examine ways to recast particular questions to reduce confusion and subjective burden. For instance, can the race question be asked in such a way as to eliminate the need for a standalone ancestry question? Can the year of naturalization/year of entry questions be restructured to make cognitive recall easier? Could different headers and formatting make it easier to answer the question on worker type? Would it reduce burden without sacrificing accuracy to collect a mark-all-that-apply item on income types and request a dollar figure only for total income, rather than ask for an amount for each type of income? Of this line of research, Steiger said that she likes the cognitive testing approach but would suggest implementing a type of “customer satisfaction survey” insert or supplement to the ACS interview—some “tell us what you think” questions to generate more in-the-moment reactions.
The second capacity in which Steiger said that she was discussing these presentations is that of a researcher with a personal passion for improving communication in federal surveys generally. She noted that, earlier in 2018, she participated with Don Dillman and others in a similar, thorough review of survey materials and contact strategies used by the National Center for Education Statistics in its surveys, with the objective of curbing declining response rates. She said that many of the materials in that review had not changed in many years; the ACS has had the comparative advantage of continuous refinement and testing, as evidenced by the day’s presentations. Steiger said that she strongly supported the direction being taken with the strategic framework for ACS respondent communication, nothing that the messages conveyed have to be compelling to respondents (if not necessarily to
policymakers or researchers). The full set of materials should be thought of as a comprehensive communications system, she said, with pieces fitting together and engaging the Census Bureau and respondents in a broader conversation. She noted that one particularly tough challenge is that the documents have to “look official” and look legitimate, so as not to be suspected as being thought of as marketing materials or fraudulent requests—yet they will never adequately engage respondents’ interests if they purely “read like government documents.”
To that end, Steiger motivated discussion premised around a different finding from Norman Bradburn than had been invoked earlier. Commenting on surveys as social interactions and focusing in particular on face-to-face interviewing, Bradburn (2015) decomposed the basic survey communication process into a sequence of interactions that have direct analogues to the push-to-web, starting-with-mail survey context.
- Steiger said that Bradburn’s focus on the first 5 seconds of the interview pitch has a direct analogue in the envelope used in ACS mailing materials; it is the envelope that must quickly and immediately convey the survey’s importance and legitimacy. Despite its importance, Steiger noted that the envelope (or exterior of the mailing package) has been the focus of very little research—though the list of relevant design factors identified by Lavrakas et al. (2018) (displayed in Box 3.5) makes clear that the envelope comprises many relevant design factors.
- Bradburn’s focus on the introduction to the interview is analogous to the look and feel of the entire contents of the mailing—whether they feel official or like a marketing ploy.
- Finally, Steiger noted that Bradburn’s notion of “the ‘ask’ ” or the call to action, is analogous to the content of the mailed materials, whether they clearly explain what is expected of the respondents. Here, too, she offered a list of factors identified by Lavrakas et al. (2018) about design factors that influence retention of information from letters sent with survey materials.
Put more simply, Steiger argued that the ultimate goal of the ACS process can be characterized as inducing the respondent to open the envelope, be motivated to respond, know how to respond, and then actually respond. She noted that there should be varying appeals and messages over the course of the contacts with respondents, not just repeating the same things over and over. But, Steiger said “not much and not enough” is known about important topics: what the respondent public thinks of the ACS mailings, what they actually see and read from them and what they discard, and whether they perceive changes or variations from mailing to mailing.
Steiger said that she has been asked to comment on “best practices” for structuring respondent communication based on respondent feedback. Such “best practices” as now exist have arisen in the context of randomized
controlled experiments—not based nearly enough in solid qualitative measures and assessments of the respondent experience. Some qualitative research includes the 2014 work conducted by the ACS Office and Reingold (as had been mentioned earlier), which Steiger said produced some informal rules:
- Use designs that conform to expectations of legitimate, government-issued mail—nothing fancy or graphically intense;
- Less is more—try to consolidate key information into streamlined mailing packets;
- Eliminate prenotice mailings that do not include some call to action;
- Do not offer a choice of mode of response;
- Avoid redundant information across mailings;
- Include humanizing/personalizing touches when possible, such as a signature on the cover letters, and avoid confusing references (e.g., consider
-
changing the return address on the return envelope to Washington, DC, rather than Jeffersonville, IN); and
- Continue to emphasize the mandatory nature of response, given its documented effect on respondent perceptions.
Steiger also mentioned other general insights from recent survey research that suggests how difficult the current federal survey climate is. For example, the American National Election Studies suggest that distrust in the government in general “is at an all-time high”; survey work by Pew Research Center indicates a pervasive “climate of fear is reducing immigrant participation in government benefits”; and Gallup’s tracking poll research suggest that 51 percent of the American public “do not trust government statistics.” With that backdrop, Steiger said that she strongly agreed with the principal focus of the strategic framework outlined by Broderick Oliver, to target the cynical and distrustful audience with ACS messaging.
Steiger suggested three lines of research to use respondent feedback in supporting the new ACS communications strategic framework. First, as noted earlier, research on envelope design may seem unglamorous but is critical as the opening point of the survey communication. The ACS and the Census Bureau has the opportunity to do groundbreaking, innovative research, and Steiger said that it would be great (and possibly more useful) for this research to start before conducting many more randomized controlled experiments. Steiger said that this detailed research should include ethnographic work in people’s homes—saying that she “would love to see research on people processing their mail,” interacting with and responding to pressure seal mailers relative to standard envelopes, and talking through what things resonate with the potential respondents. She suggested more eye-tracking research—of which the Census Bureau has already done some, but it should be done in a way to have a better sense of where the eye is actually lingering on the outer envelope. In the floor discussion that followed Steiger’s presentation, Michael Schober commented that this kind of ethnographic work on nonrespondents “is what social science researchers dream of,” but he wondered whether anyone has done it in practice. Steiger replied that there has not been much of that work but that it ought not to be hard to do; “we could recruit for it in the same way we do for focus groups and cognitive interviews now.” Constance Citro called attention to a “fairly classic” ethnographic study that was conducted in conjunction with the 1990 census—not in “real time,” but that still yielded insights about questionnaires thrown in the trash, about whether the envelopes entered the house or were opened, whether the questionnaires had been partially filled out, and so forth. The work basically followed the chain of events that can go awry, and it had a big impact at the time. Cynthia Clark added that Naomi “Donny” Rothwell had done similar work in the 1970 and 1980 censuses, as one of the early cognitive researchers working at the Census Bureau.
Second, Steiger suggested the complement to her earlier suggestion of including customer satisfaction survey-type questions on the ACS questionnaire—doing the same in the nonresponse follow-up field interviewing instrument. Clearly, Steiger said, the priority should be collecting the actual survey information. But the point remains that the ACS field interviewing is necessarily putting Census field representatives in the presence of someone who, for whatever reasons, has failed to respond to five different mailings in different formats. That should be a critical opportunity to try to learn “why” and generate in-the-moment, “doorstep feedback” from the respondents. In particular, some indication from that population as to whether they recall any content from the mailings could be extremely valuable. Steiger added that a little of this qualitative research had been done for the American Time Use Survey, which the Census Bureau conducts under the sponsorship of the Bureau of Labor Statistics.
Finally, Steiger commented that an explicit qualitative research phase should be added to the Census Bureau’s plan for implementing the strategic framework. In particular, as Schober noted, communications conditions change rapidly—so new rounds of focus groups and cognitive testing are always worth pursuing. She concluded by stating the importance of gathering feedback on communication materials, from potential respondents, from known nonrespondents, from those who are distrustful of government, and from diverse segments of the population—all as a precursor to conducting more randomized controlled experiments.
3.4.6 General Concluding Remarks
Victoria Velkoff (U.S. Census Bureau) began the closing commentary session of the workshop by commending the speakers, saying that the workshop had touched on many projects and themes already under development in the ACS research program but had also suggested things “that we hadn’t previously thought about”—including Michael Schober’s suggestions about better leveraging text messaging in the survey communication process. She noted that messaging and the technology of survey administration are important, adding that the Census Bureau needs to “think outside the box more,” and that it is sessions like this that help the Bureau do that. She added that she hoped that one of the expert group meetings following the workshop would focus on technology issues, the different ways in which the Census Bureau can get the word about the survey out before the respondent public. Velkoff noted that Census Bureau field representatives interact with a wide variety of people, and the Bureau needs to think more about making that interaction as smooth and informative as possible. She added that the Internet ACS instrument is one that has progressed naturally into production, but it is also an opportunity for effectiveness research with a lot of potential. She reiterated
that the Bureau is testing ways to collect richer “feedback in the moment” about respondent experiences with the ACS, through questions at the end of the main questionnaire. At the moment, she said that “it’s just an open-ended question” but that more could be done. She reiterated her opening comments, that the Census Bureau listened intently at the 2016 workshop and came away with a solid research agenda in the second version of Agility in Action; she said that she was excited about the program of research that will come out of this workshop.
Don Dillman (Washington State University) commented on his frustration when discussion of communication tends to get compartmentalized, dealing with one specific wording of a question, one specific aspect of an envelope, and so forth. What is lost is the connectivity of communications, which is a serious shortcoming. There is exciting, great potential for better strategy in survey communications; he noted that the general demise of telephone interviewing and random digit dialing might put the survey world beyond Bradburn’s “5-second” paradigm. He said that this is a ripe time for the Census Bureau and other researchers to examine connectivity issues across the whole survey collection process. Velkoff agreed, saying that text messaging and other new modes of communication give the ACS ways to convey messages that have not been exploited in the federal survey context before.
The question was raised about “incomplete starts” in the ACS—whether the Census Bureau has any metrics on people starting the ACS questionnaire, breaking off for whatever reason, and never returning to it. Sandra Clark (U.S. Census Bureau) said that her work with paradata on the Internet questionnaire suggested that about 12 percent of web responders break off before finishing the survey, but that the Bureau does not really know about people going back after a first break-off. David Raglin added that the 12 percent rate is unweighted, but that the percentage is about the same weighted; he also noted that if the respondent gets far enough into the questionnaire, the response can be deemed “complete” and not turned over for field follow-up. There is also typically a time window of several days17 that the Bureau will wait to actually “submit” the collected data for further processing, to account for possible resumptions.
Darby Steiger (Westat) followed up on Elizabeth Poehler’s presentation (Section 3.2.1) and the finding that the “Why We Ask” brochure did not perform up to expectations. Steiger said that she hoped that the testing is not taken as license to “lose” the brochure because a lot of its content is very good. There is a need to hone messages for consumption by survey respondents, but she said that she lamented the lack of connection between surveys and the reasons why questions are asked on those surveys, something that is problematic for end data users as well as respondents. While “it used to be that you got this big, thick manual” along with survey data, “now you just get a teeny tiny little slip of paper that tells you where to go online to get all the information that
___________________
17 It was suggested that this could be as long as 21 days.
you got before.” She asked whether the ACS materials make that connection strongly enough. Poehler replied that putting more of the “Why We Ask” information into the Internet instrument is something that always comes up in planning conversations, that there is always a temptation to “tag” the questions on commuting with information about why the Census Bureau asks them. But she said those discussions inevitably come back to not wanting to distract the respondent from responding, or leading someone off path. Jonathan Schreiner concurred, adding that “we really want people to go that online response site, and not someplace else.” One option is an improved “splash” page on entry to the Internet response site that gives both information and the link to complete the questionnaire. It is now functionally two Internet addresses and “we don’t want the competition” with the direct questionnaire link, he said. Ruth Chan said that the Respondent Advocate includes “Why We Ask” information in its materials as well—but “by the time you process a paper letter, and it’s gone through snail mail twice, the respondent has typically decided to move on.” Work to find a happy middle ground between informing respondents and enabling their quick and easy response is ongoing, she said.


