
4
Inequity and Adolescence
Like every other society, the United States has a profound interest in promoting the well-being and successful development of all adolescents in our country. In so doing, our leaders, as well as teachers, families, and other caregivers, are naturally interested in how well our adolescents are developing as compared with adolescents in other countries or, perhaps as compared with previous generations of young people in our own country. However, this committee’s charge is much more urgent and direct: its central focus is inequity among our nation’s adolescents. Why are so many adolescents in the United States being left behind in relation to their own U.S. peers? What can we do about it, and what should we do to assure equal opportunity to flourish and succeed? This chapter documents disparities in adolescent well-being and performance, explores the sources of inequity, and lays the foundation for decisive social action.
For many youth in our country, the promise of adolescence is severely curtailed by economic, social, and structural disadvantage and, in all too many cases, by racism, bias, and discrimination. These potent societal determinants shape adolescents’ life trajectories in multiple ways. They not only reduce access to the opportunities, services, and supports enjoyed by more privileged youth, but they also expose less privileged youth to risks, stresses, and demands that “get under the skin,” adversely affecting the body and the brain during critical developmental periods. The unfortunate truth is that these striking differences in opportunity are associated with striking differences in outcomes—in health, safety, well-being, and educational and occupational attainment—and in trajectories over the life course. To the extent that these disadvantageous conditions have already impeded healthy
development during childhood, failure to address the resulting deficiencies during adolescence represents a missed opportunity for remediation.
This chapter discusses the critical influences that either promote or hinder opportunity for adolescents at the individual, community, and population levels. These factors include differences in family income and wealth, differences in neighborhood resources, and racism, bias, and discrimination. The aim of this chapter is to identify disparities among adolescents in achievement, well-being, and other pertinent outcomes that stem from unwarranted and remediable differences in opportunity to succeed or in the ways particular groups of adolescents are treated by adults with authority over them, and to identify possible remediable responses. This analysis requires two tasks: We first summarize adolescent outcomes for which adequate data are available and identify disparities in these outcomes by race, ethnicity, gender, income, and, where possible, nativity, and sexual orientation.1 These disparities are neither inevitable nor irremediable. The next section therefore identifies the major sources of these disparities, because a full understanding of the sources of the disparities is necessary to formulate effective strategies for reducing them.
Many factors might contribute to disparities in adolescent outcomes and they can be characterized in many different ways. Based on extensive bodies of well-accepted research as well as the framework set forth in Communities in Action (National Academies of Sciences, Engineering, and Medicine, 2017), we categorize the possible sources of outcome disparities as follows: (1) differences in family wealth and income, combined with living in neighborhoods segregated by income and race; (2) differences in institutional responses to adolescents by schools, the health system, the justice system, or the welfare system; and (3) prejudicial or discriminatory attitudes or behavior on the part of adults or peers who interact with adolescents on a regular basis. Of course, other possible sources of outcome disparities exist, such as immeasurable factors related to historical legacies of systemic discrimination and inequality as well as a range of other understudied factors. Here, we point to some specific, quantifiable sources that have been captured empirically by a large body of research.
Disparities among groups of adolescents in these domains not only affect developmental trajectories during adolescence but also are predictive of significant disparities in adult economic and social outcomes. Thus, to fail to address the sources of these disparities during adolescence is to con-
___________________
1 Of course, as discussed in Chapter 10, there are a number of limitations to these data, including a paucity of markers of positive growth and an inability to characterize the outcomes of populations that are small in size or difficult to characterize (e.g., Native Americans and LGBTQ youth). These limitations also curtail our ability to fully capture “intersectional” inequalities, that is, those inequalities that arise from membership in multiple disadvantaged groups.
tinue to allow less than optimal development of our nation’s human capital and the economic and social costs that entails, which include reduced worker productivity, lost wages and employment, worse health and mental health, and increased criminal justice involvement. These outcomes reduce overall economic growth and exacerbate rising inequality. To allow avoidable disparities to persist without making reasonable efforts to remediate them is also unjust.
We conclude the chapter by discussing some promising policies, programs, and practices that combat some of the sources of these disparities, promoting equity for all adolescents. While the challenge is large, progress can be made. Indeed, a review of trends in the extent of these disparities, underscores the point that the disparities are not immutable but are responsive to changes in underlying conditions and institutional processes. An important question, of course, is whether our society is willing to make the necessary long-term commitment to change the conditions that underpin these stark disparities.
DISPARITIES IN ADOLESCENT OUTCOMES
Recently, increasing attention has been paid to understanding adolescent outcomes and, more specifically, addressing disparities in adolescent outcomes. The recent interest in reducing adolescent disparities has resulted from a combination of deepening societal concern over inequality in the United States and recognition that the antecedents of adult inequality can be traced to disparities in adolescent development.
When considering how best to support and promote successful adolescent development, it is useful to have an eye toward three different questions. The first question is whether and to what extent adolescents as a group, or at a specific age (or grade), can achieve specific levels of performance or well-being at their given levels of physical, social, cognitive, and behavioral development at that age or grade level. (We have been referring to this question simply as measuring outcomes.) The second question is the extent to which members of different social groups achieve those levels of performance or well-being, thereby focusing attention on differences (disparities) in outcomes among groups that are not expected to differ in levels of development or capacity. The third question relates to the distribution of opportunity, that is, the extent to which members of differing social groups have the same chances of achieving desirable developmental outcomes. This section addresses the first two questions and the next section, which explores the underlying causes of disparities in outcomes, addresses equality of opportunity.
The first question of interest concerns the achievement of given levels of proficiency or development, as well as the rate of growth in proficiency
and development. For example, in the early years of adolescence, it may be desirable for individuals to have achieved a certain level of competence in mathematics and reading, but we would also hope to see substantial continued growth in those skills over the course of the adolescent years. Indeed, the entire path to adulthood could be mapped by identifying desirable levels of development that we would hope for individuals to have achieved by given points in the life course, regardless of socioeconomic or racial/ethnic or other background factors.
The second important question relates to the distribution of developmental outcomes across different groups of adolescents. There are indeed significant differences in adolescent outcomes when measured by income, socioeconomic status, race, ethnicity, gender, nativity, and sexual identity, especially when taking account of the intersections among disadvantaged groups. The extent to which adolescents from these different social groups and backgrounds experience disparate outcomes is commonly treated as a presumptive measure of equality (or inequality) of outcome, or equality for short, based on the underlying supposition that disparities in outcomes based on group characteristics are prima facie unacceptable.
After this section describes inequalities in adolescent outcomes, the next section will describe their sources or origins. These sources derive largely from the socioeconomic status of the parents and the ways in which existing systems, institutions, and individuals interact with disadvantaged families, and thus they are not necessarily related to the underlying ability or human capital potential of the youth themselves. Consequently, for disadvantaged youth they reflect a daunting inequality of opportunity.
Current Disparities in Specific Outcomes
Table 4-1 presents measures of disparities in adolescent outcomes in the areas of education, justice, health, and child welfare across race and gender as well as ethnicity, income, nativity, gender identity, and sexual orientation where available. The table presents average shares (e.g., 0.11 or 11% of adolescents) or rates (number per 1,000 or 100,000) for the various outcome measures broken down by adolescent characteristic (race, gender, etc.) whenever available. In the following, we discuss the disparities in outcomes within each domain in turn.
Of course, our ability to characterize disparities is limited by the data available, concerning not only which outcomes have been measured but also the subgroups for which the outcomes have been separately measured. (A fuller discussion of data limitations is included in Chapter 10.) Moreover, it is more challenging to collect information on adolescent outcomes broken down by family income or sexuality, because information on the latter two categories are often not known or not solicited from
TABLE 4-1 Measures of Equality of Adolescent Outcomes in the Areas of Education, Justice, Health, and Child Welfare, by Race, Ethnicity, Income, Nativity, Gender Identity, and Sexual Orientation
| Indicator | All | Black | White | Latinx | Male | Female | Poor | Non-Poor | NonNative | LGBTQ youth |
|---|---|---|---|---|---|---|---|---|---|---|
| Math and Reading Test Scores | ||||||||||
| Grade 4 math, share proficienta | 0.40 | 0.19 | 0.51 | 0.26 | 0.42 | 0.38 | 0.25 | 0.57 | 0.14 | - |
| Grade 8 math, share proficienta | 0.34 | 0.13 | 0.44 | 0.2 | 0.35 | 0.33 | 0.18 | 0.48 | 0.06 | - |
| Grade 12 math, share proficientb | 0.25 | 0.07 | 0.32 | 0.12 | 0.26 | 0.23 | 0.11 | 0.32 | 0.06 | - |
| Grade 4 reading, share proficienta | 0.37 | 0.2 | 0.47 | 0.23 | 0.34 | 0.39 | 0.22 | 0.52 | 0.09 | - |
| Grade 8 reading, share proficienta | 0.36 | 0.18 | 0.45 | 0.23 | 0.31 | 0.41 | 0.21 | 0.48 | 0.05 | - |
| Grade 12 reading, share proficienta | 0.37 | 0.17 | 0.46 | 0.25 | 0.33 | 0.42 | 0.23 | 0.45 | 0.04 | - |
| HS dropout (16–24-year-olds without a HS credential and not enrolled in school)c | 0.061 | 0.062 | 0.052 | 0.086 | 0.071 | 0.051 | 0.097 | 0.051 | - | - |
| HS completion (graduation within 4 years of starting 9th grade)c | 0.84 | 0.76 | 0.88 | 0.79 | ||||||
| College completion (share of 25–34-year-olds with a B.A. or higher) | 0.34 | 0.21 | 0.40 | 0.16 | 0.30 | 0.38 | - | - | 0.11* | - |
| School discipline (out-of-school suspensions)d | 0.05 | 0.15 | 0.04 | 0.06 | - | - | - | - | - | - |
| Juvenile Justice | ||||||||||
| Arrest rate per 100e | 2.5 | 5.4 | 2.4 | 3.5 | 1.5 | - | - | - | - | |
| Detention rate per 100,000f | - | 153 | 25 | 50 | - | - | - | - | - | - |
| Indicator | All | Black | White | Latinx | Male | Female | Poor | Non-Poor | NonNative | LGBTQ youth |
|---|---|---|---|---|---|---|---|---|---|---|
| Health | ||||||||||
| Mortality (ages 10–24, per 100,000) | ||||||||||
| Mortality overallg | 60.3 | 84.7 | 56 | 57.9 | 85.9 | 33.3 | ||||
| Mortality from unintentional injuryg | 27.1 | 20.9 | 29.7 | 25.7 | 39.2 | 14.4 | ||||
| Mortality from homicideg | 9 | 32.8 | 2.5 | 12.2 | 15.2 | 2.6 | ||||
| Mortality from suicideg | 7.1 | 4.9 | 8.1 | 5.3 | 11.4 | 2.6 | ||||
| Obesityh | 0.148 | 0.182 | 0.125 | 0.182 | 0.175 | 0.121 | 0.189 | 0.1604 | - | 0.205 |
| Behavioral Health | ||||||||||
| Alcohol useh | 0.604 | 0.513 | 0.617 | 0.647 | 0.581 | 0.626 | - | - | - | 0.722 |
| Marijuana useh | 0.356 | 0.428 | 0.32 | 0.424 | 0.352 | 0.359 | - | - | - | 0.504 |
| Prescription pain medicine with a prescription useh | 0.14 | 0.123 | 0.135 | 0.151 | 0.134 | 0.144 | - | - | - | 0.243 |
| Depressiong | 0.128 | 0.091 | 0.138 | 0.127 | 0.064 | 0.194 | - | - | - | - |
| Tobacco useh | ||||||||||
| Cigarette useh | 0.289 | 0.211 | 0.31 | 0.297 | 0.307 | 0.273 | - | - | - | 0.418 |
| Frequent cigarette useh | 0.026 | 0.011 | 0.036 | 0.017 | 0.027 | 0.026 | - | - | - | 0.054 |
| Vape useh | 0.422 | 0.362 | 0.418 | 0.487 | 0.449 | 0.397 | - | - | - | 0.505 |
| Reproductive/Sexual Health | ||||||||||
| Adolescent pregnancyi | 0.0223 | 0.0318 | 0.016 | 0.0349 | - | - | - | - | - | |
| HIVh | 0.093 | 0.152 | 0.089 | 0.081 | 0.079 | 0.105 | - | - | - | 0.14 |
| Child Protective Services (CPS) ages 10+ | ||||||||||
| In foster care (per 1000)j | 9.4 | 19.8 | 9.3 | 7.9 | 9.5 | 9.2 | 18.5 | 3.6 | - | - |
| In group homej | 0.4 | 1 | 0.4 | 0.4 | 0.5 | 0.4 | 0.9 | 0.2 | - | - |
| Aging out of foster carej | 0.2 | 0.6 | 0.2 | 0.2 | 0.2 | 0.2 | 0.5 | 0.08 | - | - |
| Child abuse and neglectk | 0.0091 | 0.0139 | 0.0081 | 0.008 | 0.0087 | 0.0095 | - | - | - | - |
NOTES: *Refers to non-native Latinx youth (related to 0.20 for native-born Latinx youth). For non-native Asian youth, this number is 0.66. See https://nces.ed.gov/programs/digest/d16/tables/dt16_104.60.asp.
SOURCES:
aNational Center for Education Statistics (2017).
bNational Center for Education Statistics (2015).
cInstitute of Education Sciences, National Center for Education Statistics (2016).
dInstitute of Education Sciences, National Center for Education Statistics (2015).
eU.S. Department of Justice, Office of Juvenile Justice and Delinquency Prevention (2016).
fU.S. Department of Justice, Office of Juvenile Justice and Delinquency Prevention (2015).
gU.S. Department of Health and Human Services, Centers for Disease Control and Prevention, National Center for Health Statistics (2016).
hU.S. Department of Health and Human Services, Centers for Disease Control and Prevention, National Center for Health Statistics (2017).
iU.S. Department of Health and Human Services, Centers for Disease Control and Prevention, Division of Reproductive Health (2015).
jU.S. Department of Health and Human Services, Administration for Children and Families, The Adoption and Foster Care Analysis and Reporting System; and U.S. Census Bureau, American FactFinder (2016).
kU.S. Department of Health and Human Services, Administration for Children and Families, Children’s Bureau (2016).
adolescents, in contrast to gender, race, and ethnicity, which are more readily observed.
Disparities in Educational Achievement and School Discipline
Reading and math test scores as measured in the National Assessment of Educational Progress (NAEP), also known as The Nation’s Report Card, are presented in Table 4-1a. Administered by the National Center for Education Statistics within the U.S. Department of Education, NAEP is the largest continuing assessment of the academic performance of U.S. students. It is administered to a nationally representative sample of students in both public and private schools, and it measures performance in math, reading, science, and several other subjects (National Center for Education Statistics, 2018). Overall, as of 2017, the NAEP results show that 40 percent of fourth graders are proficient in math and 37 percent are proficient in reading. If we break this down by race and ethnicity, 19 percent (and 20%) of Black students are proficient in math (and in reading), compared with 51 percent (47%) of White students and 26 percent (23%) of Latinx students. While fourth-grade boys are more likely than girls to be proficient in math (42% vs. 38%), for reading the reverse is true (34% vs. 39%).
Some of the greatest disparities are between poor and nonpoor students, as identified by free-lunch status.2 These disparities emerge early: among fourth-grade students qualified for free lunch, 25 percent are proficient in math, compared with 57 percent of paid-lunch students. The disparities are similar for reading. As children age, gaps in proficiency in reading remain about the same between poor and non-poor students. Likewise, disparities by race and ethnicity largely stay the same, with reading proficiency among Black students remaining 25 percent lower than White students from Grades 4–12. For math, by contrast, over time the proficiency scores fall for all groups and, in addition, disparities by race and ethnicity appear to widen. Only in one area do disparities appear to narrow as adolescents age: females tend to improve their performance relative to males in both math and reading.
The disparities in NAEP test scores correspond to disparities seen in high school graduation rates, with graduation defined as completing school within 4 years of starting ninth grade. The highest rates of graduation (91%) are observed among Asian/Pacific Islander adolescents, followed by
___________________
2 The percentage of students receiving free or reduced price lunch is often used as a proxy measure for the percentage of students living in poverty. While the percentage of students receiving free or reduced price lunch can provide some information about relative poverty, it should not be confused with the actual percentage of students in poverty enrolled in school (Snyder and Musu-Gillette, 2015).
TABLE 4-1A Measures of Equality of Adolescent Outcomes in the Area of Education, by Race, Ethnicity, Income, Nativity, Gender Identity, and Sexual Orientation
| Indicator | All | Black | White | Latinx | Male | Female | Poor | Non-Poor | NonNative | LGBTQ youth |
|---|---|---|---|---|---|---|---|---|---|---|
| Grade 4 math, share proficienta | 0.40 | 0.19 | 0.51 | 0.26 | 0.42 | 0.38 | 0.25 | 0.57 | 0.14 | - |
| Grade 8 math, share proficienta | 0.34 | 0.13 | 0.44 | 0.2 | 0.35 | 0.33 | 0.18 | 0.48 | 0.06 | - |
| Grade 12 math, share proficientb | 0.25 | 0.07 | 0.32 | 0.12 | 0.26 | 0.23 | 0.11 | 0.32 | 0.06 | - |
| Grade 4 reading, share proficienta | 0.37 | 0.2 | 0.47 | 0.23 | 0.34 | 0.39 | 0.22 | 0.52 | 0.09 | - |
| Grade 8 reading, share proficienta | 0.36 | 0.18 | 0.45 | 0.23 | 0.31 | 0.41 | 0.21 | 0.48 | 0.05 | - |
| Grade 12 reading, share proficienta | 0.37 | 0.17 | 0.46 | 0.25 | 0.33 | 0.42 | 0.23 | 0.45 | 0.04 | - |
| HS dropout (16–24-year-olds without a HS credential and not enrolled in school)c | 0.061 | 0.062 | 0.052 | 0.086 | 0.071 | 0.051 | 0.097 | 0.051 | - | - |
| HS completion (graduation within 4 years of starting 9th grade)c | 0.84 | 0.76 | 0.88 | 0.79 | ||||||
| College completion (share of 25–34-year-olds with a B.A. or higher) | 0.34 | 0.21 | 0.40 | 0.16 | 0.30 | 0.38 | - | - | 0.11* | - |
| School discipline (out of school suspensions)d | 0.05 | 0.15 | 0.04 | 0.06 | - | - | - | - | - | - |
SOURCES:
aNational Center for Education Statistics (2017).
bNational Center for Education Statistics (2015).
cInstitute of Education Sciences, National Center for Education Statistics (2016).
dInstitute of Education Sciences, National Center for Education Statistics (2015).
88 percent for Whites, 79 percent for Latinx, and 76 percent for Blacks (National Center for Education Statistics, 2017). However, when we examine a different measure, namely the high school drop-out rate (defined as the share of 16–24-year-olds lacking a high school credential and not enrolled in school), the disparities are much smaller: only 6.2 percent of Black youth are considered drop-outs, compared with 5.2 percent of White youth, and 8.6 percent of Latinx youth. This is consistent with Black and Latinx youth taking longer to obtain their high school credential, either through delayed graduation from high school or by obtaining a GED. Importantly, female achievement outpaces male achievement by this measure as well: females (5.1%) have lower rates of high school drop-out than males (7.1%).
Racial and ethnic disparities in college completion (defined as the share of 25–34-year-olds with a B.A. degree or higher) are greater than the disparities in high school completion or rates of drop-out. Among 25–34-year-olds, 40 percent of Whites have a B.A. or higher, compared with 21 percent of Blacks and 16 percent of Latinx. The gender disparity in college completion is also greater than the gender disparity in high school drop-out rates: 38 percent of females have a B.A. or higher, compared with 30 percent for males.
As of the first quarter of 2018, the median earnings for college graduates is $1,310 per week, compared with $726 per week for high school graduates.3 Among college graduates, median earnings are $1,550 for White male workers and $1,139 for Black males. For high school graduates, White males earn $861 relative to $604 for Black males. Thus, the growth in disparities as youth age, culminating in large differences by race, ethnicity, and gender in college completion, will likely result in continuing large disparities in adult earnings as well.
Measures of school discipline reveal significant disparities by race. For example, in 2013, 15 percent of Black students received an out-of-school suspension, compared with 4 percent of White students and 6 percent of Latinx students. Moreover, a disproportionate number of Native American, LGBTQ, and disabled youth are suspended or expelled from school as a result of discretionary disciplinary practices (Poteat et al., 2016; American Bar Association, 2018). Much of the existing research on the “school-to-prison pipeline” suggests that the disparities in school discipline by race and ethnicity are responsible in part for the disparities seen in juvenile justice involvement, including the fact that Black youth are more than twice as likely as Whites to be arrested as juveniles (5.4% compared to 2.1%). (See
___________________
3 Median earnings calculated over all full-time workers ages 25 or older. This represents a significant premium in income, but because of the rising cost of college and the increasing debt of college graduates, there is more variability in terms of the college premium in wealth. (See https://fredblog.stlouisfed.org/2018/07/is-college-still-worth-it/.)
also Chapter 9, Box 9-2, “Relationship between School Disciplinary Policies and the Juvenile Justice System.”)
Researchers have outlined multiple ways in which school suspension or expulsion can lead to an increase in juvenile arrest and detention. First, with the presence of school resource officers, any disciplinary infraction increases the probability of interacting with the police force (Owens, 2017). Second, suspension reduces time spent in school and increases the probability of arrest during the days of suspension (Mowen and Brent, 2016). Third, suspension and expulsion reduce attachment to school, and this in turn reduces the probability of high school graduation, which increases the probability of future criminal activity (Lochner and Moretti, 2004).
Disparities in Juvenile Justice
Table 4-1b shows measures of equality of adolescent outcomes in the area of justice. At every successive stage of the criminal/juvenile justice process, racial and (to a lesser extent) ethnic disparities increase (Rovner, 2016). There are multiple points at which decisions made by adult actors in the justice system can affect the outcomes for youth: during the decision to prosecute, during the bail-setting decision, during plea-bargaining decisions, and at sentencing. This is readily apparent in detention rates: Black youth are detained at a rate six times higher than White youth and three times higher than Latinx youth. Evidence suggests that such disparities in juvenile detention will cause significant disparities in adult outcomes including educational attainment and future incarceration (Aizer and Doyle, 2015).
In a system that is formally committed to equal and fair treatment, these comparisons suggest a serious need to study and scrutinize the sources of these growing disparities in the juvenile justice system by race and ethnicity.
Disparities in Health Outcomes and Health Behaviors
Table 4-1c shows measures of equality of adolescent outcomes in the area of health. Research examining the income gradient in child health shows that there is a positive relationship between family income and children’s self-reported health and that this becomes more pronounced as children age (Case et al., 2002).4 This age effect is not explained by insurance, health at birth, or genetics. Rather, poor children develop more chronic conditions as they age, relative to their better-off counterparts. Moreover, poor health in adolescence harms educational attainment, because sicker children miss more days of school and ultimately attain fewer years of schooling. As such, youth in low-income families enter adulthood
___________________
4 The authors use self- or parent-reported health as their measure.
TABLE 4-1B Measures of Equality of Adolescent Outcomes in the Area of Justice, by Race, Ethnicity, Income, Nativity, Gender Identity, and Sexual Orientation
| Indicator | All | Black | White | Latinx | Male | Female | Poor | Non-Poor | NonNative | LGBTQ youth |
|---|---|---|---|---|---|---|---|---|---|---|
| Arrest Rate per 100e | 2.5 | 5.4 | 2.4 | 3.5 | 1.5 | - | - | - | - | |
| Detention Rate per 100,000f | - | 153 | 25 | 50 | - | - | - | - | - | - |
SOURCES:
eU.S. Department of Justice, Office of Juvenile Justice and Delinquency Prevention (2016).
fU.S. Department of Justice, Office of Juvenile Justice and Delinquency Prevention (2015).
TABLE 4-1C Measures of Equality of Adolescent Outcomes in the Area of Health, by Race, Ethnicity, Income, Nativity, Gender Identity, and Sexual Orientation
| Indicator | All | Black | White | Latinx | Male | Female | Poor | Non-Poor | NonNative | LGBTQ youth |
|---|---|---|---|---|---|---|---|---|---|---|
| Mortality (ages 10–24, per 100,000) | ||||||||||
| Mortality Overallg | 60.3 | 84.7 | 56 | 57.9 | 85.9 | 33.3 | ||||
| Mortality from Unintentional Injuryg | 27.1 | 20.9 | 29.7 | 25.7 | 39.2 | 14.4 | ||||
| Mortality from Homicideg | 9 | 32.8 | 2.5 | 12.2 | 15.2 | 2.6 | ||||
| Mortality from Suicideg | 7.1 | 4.9 | 8.1 | 5.3 | 11.4 | 2.6 | ||||
| Obesityh | 0.148 | 0.182 | 0.125 | 0.182 | 0.175 | 0.121 | 0.189 | 0.1604 | - | 0.205 |
| Alcohol Useh | 0.604 | 0.513 | 0.617 | 0.647 | 0.581 | 0.626 | - | - | - | 0.722 |
| Marijuana Useh | 0.356 | 0.428 | 0.32 | 0.424 | 0.352 | 0.359 | - | - | - | 0.504 |
| Prescription Pain Medicine with a Prescription Useh | 0.14 | 0.123 | 0.135 | 0.151 | 0.134 | 0.144 | - | - | - | 0.243 |
| Depressiong | 0.128 | 0.091 | 0.138 | 0.127 | 0.064 | 0.194 | - | - | - | - |
| Tobacco Useh | ||||||||||
| Cigarette Useh | 0.289 | 0.211 | 0.31 | 0.297 | 0.307 | 0.273 | - | - | - | 0.418 |
| Frequent Cigarette Useh | 0.026 | 0.011 | 0.036 | 0.017 | 0.027 | 0.026 | - | - | - | 0.054 |
| Vape Useh | 0.422 | 0.362 | 0.418 | 0.487 | 0.449 | 0.397 | - | - | - | 0.505 |
| Adolescent Pregnancyi | 0.0223 | 0.0318 | 0.016 | 0.0349 | - | - | - | - | - | |
| HIVh | 0.093 | 0.152 | 0.089 | 0.081 | 0.079 | 0.105 | - | - | - | 0.14 |
SOURCES:
gU.S. Department of Health and Human Services, Centers for Disease Control and Prevention, National Center for Health Statistics (2016).
hU.S. Department of Health and Human Services, Centers for Disease Control and Prevention, National Center for Health Statistics (2017).
iU.S. Department of Health and Human Services, Centers for Disease Control and Prevention, Division of Reproductive Health (2015).
not only poorer but also with fewer years of schooling and in worse health, and all three of these conditions predict worse outcomes in adulthood.
In addition to enduring disparities in the incidence and impact of chronic conditions, disadvantaged youth (particularly as defined by race and ethnicity) had higher rates of mortality, largely due to greater rates of violence, in 2016 (Cunningham et al., 2018). While Whites and Latinx youth ages 10 to 24 have similar rates of mortality (roughly 57 per 100,000), their Black peers have mortality rates roughly 50 percent higher (85 per 100,000) (Table 4-1c). These disparities in mortality rates by race are mainly driven by disparities in homicide rates, which are 33 per 100,000 for Blacks compared with 2.5 for Whites and 12.2 for Latinx. The only category for which White adolescents have higher rates of mortality than Black or Latinx adolescents is suicide: 8.1 per 100,000 for Whites, compared with 4.9 for Blacks and 5.3 for Latinx (Mulye et al., 2009).
There are also significant disparities in adolescent mortality by gender, with a rate of 86.6 deaths (per 100,000) for males and 33.3 for females. These disparities by gender are observable across all causes: unintentional injuries, motor vehicle accidents, homicide, and suicide. Interestingly, although rates of suicide are much higher for males, major depressive episodes are more prevalent among females (19% for females versus 6% for males in 2016).
It should be noted that while studies have documented recent increases in adult mortality in the United States among the poor, resulting in increasing disparities in mortality by income (Case and Deaton, 2015), the same is not true for child and adolescent mortality. For children and adolescents, mortality has not only continued to decline, on average, but also disparities by income have narrowed (Currie and Schwandt, 2016).
Use of alcohol and tobacco do not differ considerably by gender, but they do differ by race and ethnicity. Black adolescents generally have the lowest rates of alcohol consumption and cigarette smoking as compared to White and Latinx youth, though Black and Latinx youth have slightly higher rates of marijuana use than do White youth. LGBTQ youth have much higher rates of alcohol, marijuana, and tobacco use than the general population of adolescents (Dai, 2017; Fish and Baams, 2018; Centers for Disease Control and Prevention, 2016).
With respect to reproductive or sexual health, Black and Latinx adolescents have higher rates of teen pregnancy (roughly 3 per 100, compared with 1.5 per 100 for White non-Latinx teens). These rates, however, are currently lower than at any point in recent history, a point to which we will return later. Rates of HIV infection show similar patterns and appear to be highest for LGBTQ teens. Box 4-1 further details the health of sexual and gender minorities, proposed reasons for disparities in outcomes, and issues in measuring outcomes for this population.
Disparities in Child Protective Involvement and Outcomes
Among adolescents (age 10+), youth experiencing poverty are dramatically overrepresented in foster care (18.5 per 1,000 vs. 3.6 per 1,000 among the non-poor). They are also much more likely to be in a group home setting and more likely to age out of foster care (see Table 4-1d). Black adolescents also have higher rates of foster care and group-home placement than other youth and are more likely to age out of foster care. Similarly, American Indian and Alaska Native children are disproportionately represented in the child welfare system: while they comprise only 0.9 percent of the total child population, they comprise 1.3 percent of the children identified by Child Protective Services (CPS) as victims and 2.4 percent of the children in foster care (Children’s Bureau, 2016).
Moreover, a recent analysis of nationally representative data finds that LGBT youth are overrepresented in the child welfare system generally and in foster care and other out-of-home placements specifically (Fish et al., 2019). Children in foster care do worse along a host of outcomes: they are more likely to become teen mothers and to become involved in the juvenile justice system, and as adults they are less likely to be employed. This is particularly true for adolescents, and there is evidence that this relationship is indeed causal and does not simply reflect underlying differences in the characteristics of children in and out of foster care (Doyle, 2007).
TABLE 4-1D Measures of Equality of Adolescent Outcomes in the Area of Child Welfare, by Race, Ethnicity, Income, Nativity, Gender Identity, and Sexual Orientation
| Indicator | All | Black | White | Latinx | Male | Female | Poor | Non-Poor | NonNative | LGBTQ youth |
|---|---|---|---|---|---|---|---|---|---|---|
| In Foster Care (per 1000)j | 9.4 | 19.8 | 9.3 | 7.9 | 9.5 | 9.2 | 18.5 | 3.6 | - | - |
| In Group Homej | 0.4 | 1 | 0.4 | 0.4 | 0.5 | 0.4 | 0.9 | 0.2 | - | - |
| Aging Out of Foster Carej | 0.2 | 0.6 | 0.2 | 0.2 | 0.2 | 0.2 | 0.5 | 0.08 | - | - |
| Child Abuse and Neglectk | 0.0091 | 0.0139 | 0.0081 | 0.008 | 0.0087 | 0.0095 | - | - | - | - |
NOTE: Child Protective Services ages 10+.
SOURCES:
jU.S. Department of Health and Human Services, Administration for Children and Families, The Adoption and Foster Care Analysis and Reporting System; and U.S. Census Bureau, American FactFinder (2016).
kU.S. Department of Health and Human Services, Administration for Children and Families, Children’s Bureau (2016).
Trends in Disparities in Adolescent Outcomes
Both Table 4-1 and the preceding discussion present a static picture of adolescent health and well-being, masking important trends over time in these measures. In fact, most measures of adolescent well-being have improved over time, and along with these general overall improvements disparities have also narrowed.
Teen childbearing is one important example. This has continued to decline steadily since 1990, accompanied by significant declines in disparities by race and ethnicity as childbearing fell disproportionately faster among Black and Latinx teens than among White teens (see Figure 4-1). Among females ages 15 to 19, the birth rate for Black teens fell by more than two-thirds from 1990 to 2016, declining from 116 to 32 per 1,000. A large but slightly smaller decline occurred among Latinx teens over the same period. The smallest decline was observed among White teenagers, whose birth rates fell from 43 to 14 per 1,000, which still represents a significant decrease (Martin et al., 2018). There is no consensus regarding the reasons for the decline, but there is some evidence that increasing use of contraception has played an important role (Boonstra, 2014).
For educational outcomes, such as test scores, high school drop-out, and college completion, the overall trend has also been one of improvement, but important differences show up in the way disparities have evolved over time across these measures. Reardon (2011) has compiled data on test scores for reading comprehension for cohorts born in the years 1943 through 2001. He calculates the average difference in standardized test scores, both by race and by income, and shows how those differences have
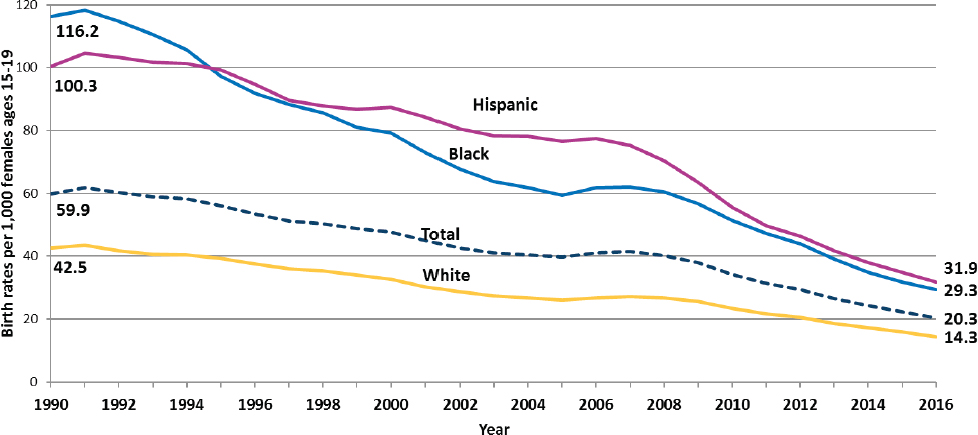
SOURCE: Martin et al. (2018).
evolved over time (Figure 4-2).5 The Black-White gap in NAEP test scores has narrowed slowly but steadily over time, declining from a difference of 1.5 standard deviations for the 1940 birth cohort to roughly 0.50 of a standard deviation by the 2001 birth cohort. The dashed line in Figure 4-2 illustrates this decline. Possible explanations include desegregation of U.S. schools and increased resource allocation to schools that predominantly serve Black students. In contrast, the “90/10 income gap” shown in the figure (defined as the difference in standardized test scores between students at the 90th percentile of family income and students at the 10th percentile) has actually increased over the decades, rising from 0.60 of a standard deviation for the 1940 birth cohort to 1.1 standard deviations by the 2001 birth cohort. This is illustrated by the solid line in Figure 4-2.
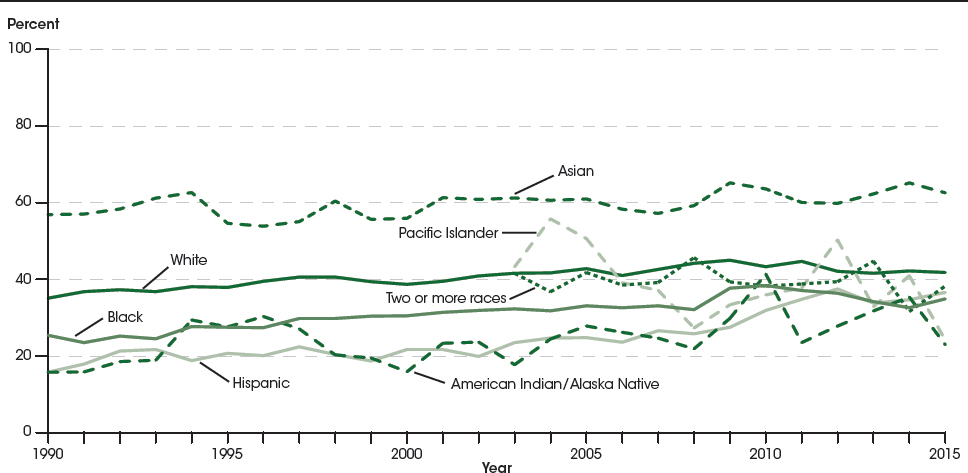
The gap in high school drop-out rates among 16–24-year-olds also narrowed from 1967 to 2016 across all racial/ethnic groups, and more so for Black and Latinx youth, significantly reducing disparities in high school dropout rates (Figure 4-3). College enrollment rates, defined as the share of 18–24-year-olds enrolled in college, increased from 32 percent to 40 percent from 1990 to 2005, but since 2005 it has remained relatively flat both overall and for most groups (Figure 4-4). The one group that has continued to enroll in college at ever higher rates over the period 2005 to 2015 is Latinx youth, whose enrollment rates increased from 25 to 37 percent during this most recent period (Musu-Gillette et al., 2017).
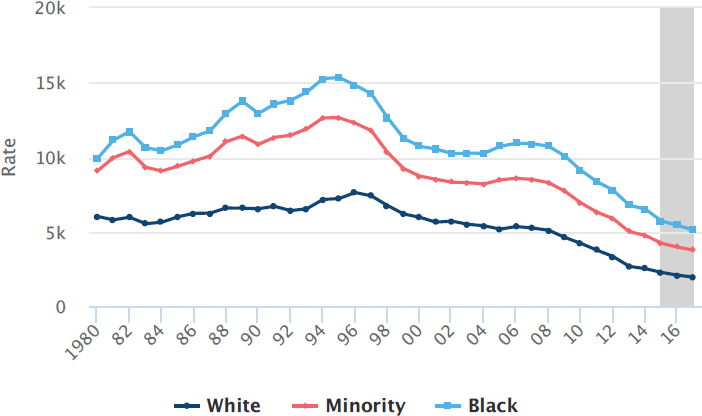
Perhaps some of the most dramatic improvements over time have been those seen in the juvenile justice sector. Since their peak in 1994, juvenile arrest rates have fallen dramatically overall and for all subgroups defined by race and ethnicity (Figure 4-5). Juvenile detention, while also declining over time, has done so at a slower pace and with less of a decline in disparities. For Black youth, arrest rates from 1997 to 2015 fell 64 percent, and for Whites they fell 55 percent. However, over this same period, residential placement6 fell 55 percent for Blacks and 62 percent for White youth (Figure 4-5). Similar trends have been observed for adults.
Adolescent well-being has worsened in one important domain: suicide rates. After declining from 1995 to 2007, adolescent suicide rates have since increased steadily, particularly for males (Centers for Disease Control and Prevention, 2017). Disparities in suicide rates have largely remained
___________________
5 To obtain standardized average differences, the researcher will take a test score, subtract the average score from it, and then divide this difference by the standard deviation of the test score distribution. This is also referred to as a Z-score. The mean of all standardized test scores will always be zero and the standard deviation will always be one. Standardization in this way allows for comparison across different distributions.
6 Residential facilities include detention centers, shelters, reception/diagnostic centers, group homes, boot camps, ranch/wilderness camps, residential treatment centers, and long-term secure facilities.
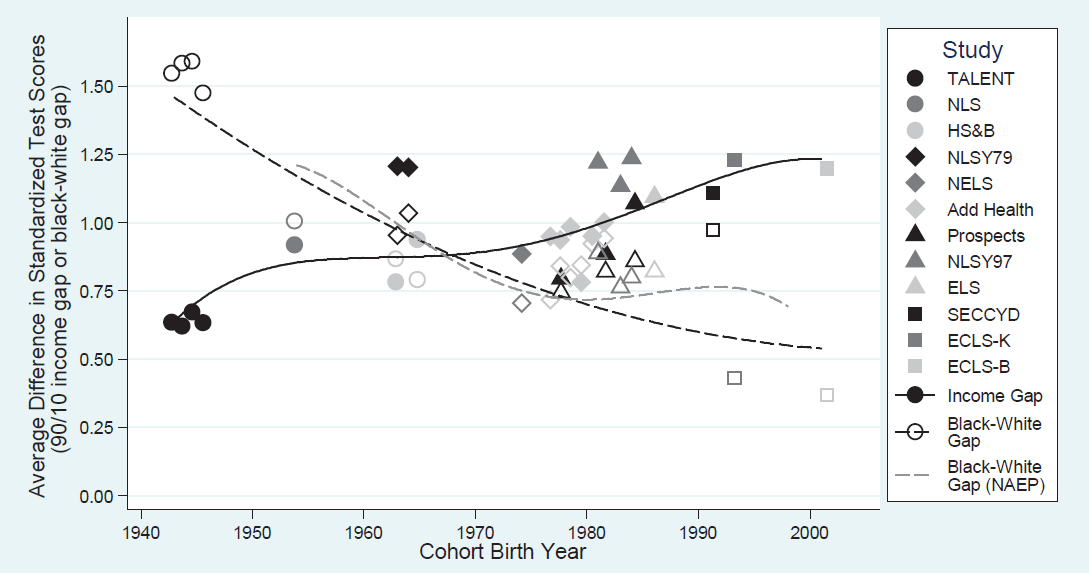
NOTES: Talent = Project Talent National Longitudinal Study; NLS = National Longitudinal Surveys; HS&B = High School and Beyond Longitudinal Study; NLSY79 = National Longitudinal Survey of Youth 1979; NELS = National Educational Longitudinal Study; Add Health = National Longitudinal Study of Adolescent to Adult Health; NLSY97 = National Longitudinal Survey of Youth 1997; ELS = Education Longitudinal Study; SECCYD = Study of Early Child Care and Youth Development; ECLS-K = Kindergarten Class of 1998–1999; ECLS-B = Early Childhood Longitudinal Study Birth Cohort; NAEP = National Assessment of Educational Progress.
SOURCE: Reardon (2011). Republished with permission of Russell Sage Foundation. Permission conveyed through Copyright Clearance Center, Inc.
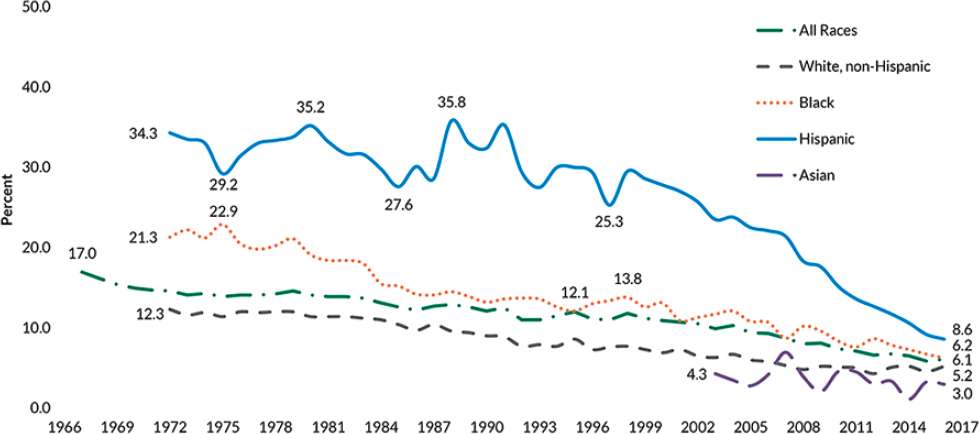
NOTES: The status drop-out rate measures the percentage of young adults ages 16 to 24 who were not enrolled in school and had not received a high school diploma or obtained a GED. This measure excludes people who are in the military or incarcerated but includes immigrants who never attended U.S. schools. Due to changes in race categories, estimates from 2003 are not strictly comparable to estimates from 2002 and before. After 2001, the Black race category includes some Latinx.
SOURCE: Child Trends Databank (2018).
SOURCE: Musu-Gillette et al. (2017).
NOTES: Rates are arrests of persons per 100,000 persons ages 10-17 in the resident population. Persons of Latinx ethnicity may be of any race, i.e., White, Black, American Indian, or Asian. Arrests of Latinx youth are not reported separately. The Office of Juvenile Justice and Delinquency Prevention defines minority populations as American Indian and Alaska Native, Asian, Black or African American, Hispanic or Latino, and Native Hawaiian or other Pacific Islanders.
SOURCE: Office of Juvenile Justice and Delinquency Prevention (2018).
unchanged, with the highest rates seen among males and Whites. Research to understand this recent rise in suicide is currently under way. Thus, the evidence clearly shows that observed levels and disparities in adolescent outcomes are not immutable, but are responsive to changes in underlying conditions.
SOURCES OF DISPARITIES: INEQUALITY OF OPPORTUNITY
While what we are calling “outcome” measures refer to the extent to which members of different groups differ with respect to a particular developmentally significant status, equality of opportunity assesses to what extent members of those groups had equal chances to achieve that status or outcome. As Arneson (2015, p. 1) writes, “when equality of opportunity prevails, the assignment of individuals to places in the social hierarchy is
determined by some form of competitive process, and all members of society are eligible to compete on equal terms.”7
In this section, we review the main sources of differential opportunity and treatment that affect adolescent health, well-being, and performance: (1) those related to the resources of families and communities where many adolescents live; (2) institutional or systematic sources of inequities in the systems with which adolescents interact; and (3) personal biases of the adults responsible for making decisions about individual adolescents.
Differences in Family Income, Wealth, and Neighborhood Resources
Although child poverty rates have decreased since the 1960s, more than 9 million children and youth in the United States live in households with incomes below the poverty level (NASEM, 2019).8 Rates of child poverty are highest for Black, Latinx, and American Indian and Alaska Native youth (NASEM, 2019). For adolescents, growing up in poverty is associated with worse physical and mental health, as well as increased risky behaviors, delinquency, and criminal behavior (NASEM, 2019). Together, these effects of poverty can set youth on less positive developmental trajectories, and youth of color experience the greatest gap in opportunity.
Indeed, one of the most significant features of the U.S. economy over the past 50 years has been the increasing inequality of income and wealth. Parental income and wealth are both highly predictive of child outcomes, because a key input in adolescent development consists of family resources, defined generally as financial inputs, time spent, and the quality of family interactions (Cunha and Heckman, 2007). And because of strong sorting based on income and race in the United States—often driven by systemic and institutional policies—family resources also determine the neighborhood resources available for youth.
There is a strong neurobiological link between family resources and youth outcomes. Recent advances in neuroscience show that family resources during early childhood affect the development of specific neural systems, and when those resources are limited the regions of the brain responsible for language processing and executive function are negatively affected, ultimately manifesting in worse adolescent mental health and
___________________
7 Political philosophers further distinguish between formal equality of opportunity and substantive equality of opportunity. The former is assured when the formal rules regulating access to goods or outcomes are the same for members of all groups, while the latter is assured only when, in fact, individuals of equal “native talent” have equal chances of access to those goods or outcomes. Substantive equality of opportunity is often referred to as equity or “fair equality of opportunity” (see Arneson, 2015, for a detailed discussion).
8 Although poverty rates are not typically reported specifically for the 10–25-year-old population, child (18 and under) poverty rates are routinely reported.
lower IQ (see Hackman et al. (2010) for a review of the evidence). Moreover, growing evidence suggests that these patterns of neurobiological development are not entirely or even largely genetic, but rather are a function of prenatal and postnatal environments and investment which, again, are directly affected by family income (Hackman et al., 2010).
This last conclusion is based on a growing body of natural experiments as well as animal-based lab experiments. As an example of the former, a 2003 study in which families’ incomes were (arguably) randomly affected by the opening of a casino on an American Indian reservation documented the following pattern: Even though an increase in family income was not a function of underlying family characteristics, it still resulted in a significant improvement in the mental health of children in affected families, resulting in fewer conduct and oppositional defiant disorders (Costella et al., 2003). Animal experiments serve to support the biological mechanism and plausibility of a causal relationship between family income and offspring neurobiological outcomes.
Moreover, we know that exposure to high levels of stress negatively affects a child’s developing brain, and poor families and minority families experience considerably more stress than others (Blair and Raver, 2016). A growing body of research on the impact of family stress on brain development and child health and well-being has indicated that parenting behavior serves as an important mechanism behind this effect (Blair and Raver, 2012; Feldman, 2015; McLoyd, 1998; Repetti et al., 2002). Parents who are stressed are less sensitive to children’s needs and are less warm, and this exacerbates the negative effects of stress on a child’s developing brain. A likely source of these differences in parenting behavior by socioeconomic status is the fact that (often single) mothers of poor families, as well as parents of families living in high-poverty neighborhoods, have less social support and less well-developed coping mechanisms than other parents have, and this can negatively affect the quality of their interactions with their children (Klebanov et al., 1994). As a result, not only are poor families less able to invest financially in their children, but also their nonfinancial investments, such as the amount and quality of their caregiving, are harmed by family disadvantage (Guryan et al., 2008).
Intersectional inequality is also of concern, and below we discuss existing disparities by race and ethnicity in family income and wealth.
Family Income
From the end of World War II to the mid-1970s, the U.S. economy grew significantly, and incomes for those at the top and bottom of the income distribution grew at roughly the same rates, consistent with a growing prosperity that was broadly shared. However, beginning in the mid-1970s,
growth slowed and income gaps grew wider. Households in the middle and bottom of the income distribution saw reduced growth and stagnation, respectively. In contrast, those in the top of the income distribution continued to see their incomes rise at a fast rate.
Scholars have attributed these changes to multiple factors: technological advances and globalization, with production and labor moving more freely across borders, a decline in union membership and rise in temporary and contingent labor, a shift from manufacturing jobs to those in the service and knowledge sectors, and higher returns to cognitive, technical, and managerial skills (Corcoran and Matsudaira, 2009; Danzinger and Ratner, 2010; Golden and Katz, 2008). Taxation policy and the eroding real value of the minimum wage have also contributed to the rising inequality witnessed since the mid-1970s (Danzinger and Ratner, 2010; Fontenot et al., 2018; Morris and Western, 1999).
These changes in the income distribution have significant implications for adolescent development and especially for disparities in their development. Rising income inequality combined with the stagnation of wages for those in the bottom half of the income distribution reduces the relative resources available to lower-income families for investment in their children. Data from the American Community Survey for 2016 show that Black and Latinx adolescents live in households characterized by significantly lower average incomes than their White counterparts: Whites ($85,000), Blacks ($38,000), Latinx ($43,000), and multiple-race households ($57,000).9 Not only do the last three categories of families have fewer resources than White families for investment in their children, but also they suffer greater relative disadvantage.10
Family Wealth
Inequality in wealth accumulation has also increased steadily since 1979, and it exceeds inequality in income (Charles and Hurst, 2003; Saez and Zucman, 2014). For example, racial differences in wealth are three times greater than racial differences or gaps in income, with Whites in 2010 having on average nearly six times the wealth of Blacks (McKernan et al., 2013). One factor contributing to inequality in wealth accumulation is his-
___________________
9 See https://datacenter.kidscount.org/data/tables/8782-median-family-income-amonghouseholds-with-children-by-race-and-ethnicity#detailed/1/any/false/870,573,869,36,133,35,16/4038,4040,4039,2638,2597,4758,1353/17618.
10 The extent to which relative income matters is an area of active debate, with some research findings suggesting that proximity to more affluent peers negatively affects child outcomes (via competitive disadvantage or “negative self-evaluations” among the less well-off), while other research finds that proximity to youth of higher socioeconomic status improves outcomes for disadvantaged youth (Chetty et al., 2016; Odgers, 2015).
torical discrimination in housing and banking policies, which has reduced opportunities for wealth accumulation among Black and Latinx families in particular. More recently, the Great Recession reduced the wealth of many Americans, but disproportionately affected the wealth of Black and Latinx families, whose wealth fell by 31 and 40 percent, respectively, compared with an 11 percent loss for White families (McKernan et al., 2013). Like income, wealth accumulation affects the resources families have available for investing in the next generation, especially for investing in their higher education.
In addition, because of the relatively high rates of residential segregation in the United States, adolescents from poor or minority families are much more likely to live in poor and minority neighborhoods. The degree of residential segregation is measured by researchers using a “dissimilarity index,” a measure of the evenness with which two groups are distributed across multiple geographic areas that make up a larger area. Neighborhoods with large levels of segregation will have numbers that are high on the index, which ranges from 0.0 (lowest level of segregation) to 1.0 (highest level of segregation). Current measures of dissimilarity for Black and Latinx households are 0.67 and 0.52, respectively. These dissimilarity index scores are both higher (indicating greater segregation) than those calculated for the foreign-born (0.44) and for the poor (0.37) (Boustan, 2013).
Between 1960 and 2000, Black-White residential segregation fell by a third. But importantly, that decline reflected falling segregation between neighborhoods within a jurisdiction. Over the same period, segregation actually rose between cities and suburbs and across different suburban areas. Segregation also rose for Latinx families (Frey, 2010). This high degree of segregation has meant that in 2010, Blacks were four times more likely to live in a high-poverty neighborhood (defined as greater than 40% poor) than other Americans. High levels of racial/ethnic residential segregation even affect the neighborhood characteristics of higher-income Black and Latinx families: On average, Black families with earnings of $75,000 live in higher-poverty neighborhoods than White families with earnings of just $40,000 (Logan, 2011).
Neighborhood Resources
Why does neighborhood matter so much? Neighborhoods matter because of their physical and social characteristics and the normative environment they produce. Recent work shows that neighborhoods are highly predictive of whether the offspring of poor parents escape poverty as adults (Chetty et al., 2018). Moving to a neighborhood with a higher likelihood of upward mobility is associated with improved outcomes for children when
those moves occur before adolescence.11 In this section, we describe the literature as it relates to multiple characteristics of a neighborhood including housing quality, exposure to violence, environmental supports, expectations, and social capital.
Housing Quality. First and foremost, the quality of housing in low-income neighborhoods is significantly lower, characterized by high levels of mold and lead, moisture, dust mites, and rodents. Such conditions have been linked with poor physical and mental health among the children and adolescents residing there (Coley et al., 2013; NASEM, 2019). Asthma, in particular, is likely to be exacerbated by poor housing conditions and is the chronic disease that causes the greatest number of school absences, which in turn are a contributing factor to diminished achievement, school drop-out, lower college completion, and greater welfare use and criminal justice involvement (Kreger et al., 2011).12 Furthermore, absences can also lead directly to the loss of school revenues, since funding is tied to student attendance (Kreger et al., 2010).
Exposure to Violence. High-poverty neighborhoods are also characterized by high levels of violence and low levels of safety (Peterson and Krivo, 2010; Sampson, 2012; U.S. Department of Housing and Urban Development, 2016). Nationally, the past 20 years have witnessed significant declines in crime, including violent crime. While those declines have been greatest in the most violent and most disadvantaged neighborhoods, crime still remains concentrated in those cities characterized by the highest levels of disadvantage (Friedson and Sharkey, 2015).
Exposure to community violence—either witnessing violence or being a victim—during childhood or adolescence can trigger an adverse stress response, which has in turn been shown to be highly negatively correlated with future adult health, including increased risk of cardiovascular disease, hypertension, asthma, and diabetes (Anda et al., 2006; Fowler et al., 2009; Herringa, 2017; Lee et al., 2017; Wathen and MacMillan, 2013). Exposure to violence and trauma is associated with several mental health challenges for adolescence, including depression and anxiety. Studies of middle- and high-school aged youth in the United States and Canada have documented relationships between exposure to community violence and higher rates of
___________________
11 The adult lifetime income for a child from a low-income family (defined as below the 25th percentile of the income distribution) who lives in a census tract at the 25th percentile of upward mobility is about $200,000 lower than that of a child from a similar family living in a tract at the 75th percentile of upward mobility.
12 For most students, asthma is a controllable disease if proper diagnosis and care are administered. The schooling of Black and Latinx students appears to be disproportionally affected by asthma (Kopel et al., 2014).
depressive and anxiety symptoms (Dube et al., 2018; Heinze et al., 2018; Heleniak et al., 2017). For example, a study of urban U.S. high school students found a strong positive association between exposure to violence during adolescence and subsequent self-reported depressive and anxiety symptoms (Heinze et al., 2018). Plainly, researchers found that exposure to violence was a significant predictor of depression levels (Heinze et al., 2018). Moreover, the effects of community violence exposure can follow adolescents into adulthood: using data from the National Longitudinal Study of Adolescent to Adult Health, researchers found that exposure to violence in adolescence was predictive of depressive symptoms in adulthood (Chen et al., 2017).
Emerging research indicates that exposure to violence in early adolescence is related to changes in brain structure and function in mid-adolescence, independent of age and gender (Saxbe et al., 2018). Much of this research focuses on the relationship between community violence and sleep, which (as discussed in Chapter 3) is critical for brain development in adolescence. Heissel and colleagues (2018), for example, found that the experience of local, prior-day violence disrupted sleep and increased next-day cortisol awakening response. In addition, Heleniak and colleagues (2018) found that exposure to community violence was associated with internalizing symptoms, negative affect during peer evaluation, emotional reactivity, and infrequent problem solving. The authors found that indirect effects of community violence on internalizing problems implicate emotion dysregulation as one mechanism linking community violence exposure to adolescents’ internalizing symptoms.
Importantly, low-income adolescents, as well as Black and Latinx adolescents generally, are more likely to witness violence in their neighborhoods due to residential segregation and concentrated disadvantage, resulting in “compounded community trauma” and negatively affecting behavioral health (Alegria et al., 2010). Emerging literature also explores the role of historical trauma in shaping outcomes; see Box 4-2. Such adverse childhood experiences are important factors to consider when addressing the mental health of adolescents who come from communities dealing with violence.
Environmental Supports. Low-income neighborhoods are also more likely to be lacking in access to health care, youth-oriented organizations, and learning centers, and are more likely to be located near polluting factors (Boardman and Saint Onge, 2005). Together, these environmental factors harm adolescent development through reduced access to many of the services and opportunities that provide young people with supportive, healthy environments to learn, grow, and thrive (see Box 4-3 for adolescents’ perspectives on neighborhood resources). Moreover, high-poverty neighborhoods often lack employment opportunities, including job training
and apprenticeship pathways, which can negatively influence adolescent expectations about their own adulthood. Research has shown that this lack of job opportunities also contributes to the behavioral health disparities observed in minority adolescents, driven by feelings of hopelessness and depression (White and Borrell, 2011).
Expectations. In addition to this unequal and reduced access to family and community or neighborhood resources, inequality contributes to how young people perceive themselves, their place in the world, and the possibilities for their future. That is, evidence from multiple disciplines indicates that inequality can signal to young people that they are unlikely to be able to climb up the socioeconomic ladder (Browman et al., 2017, 2019). As a result, both correlational and experimental studies have demonstrated that greater inequality is linked to a reduced likelihood that adolescents will be able to pursue long-term goals and an increased likelihood of teen pregnancy and failure to complete high school (Kearney and Levine, 2016).
Social Capital. It should be noted that a context of increasing inequality not only shapes the opportunities available to adolescents from backgrounds of lower socioeconomic status but also influences the lives of those from families with middle and higher socioeconomic status. As shown in several studies, individuals in societies with greater inequality feel a weaker sense of trust, connection, community, and purpose (Elgar, 2010; Vergolini, 2011). Conversely, young people in more equal societies are more likely to express prosocial behaviors, like offering help to neighbors or strangers in need, and more likely to feel and express gratitude about various aspects of their lives (DeCelles and Norton, 2016; Piff and Robinson, 2017).
Altogether, the ways that inequality can lead to the disintegration of social connections and weaken the social integration of communities can inevitably have a negative influence on the individual well-being of people. It is not surprising, therefore, that the level of inequality that people experience is a consistent predictor of happiness in life, which matters regardless of where a person falls on the income or wealth distribution (Oishi and Kesebir, 2015; Oishi et al., 2011).
Institutional and Systemic Sources of Inequities
Differences in family income, wealth, and neighborhood resources are often compounded by the institutions and systems in which youth interact. Although adolescent interactions with formal institutions present opportunities to decrease disparities through either the direct provision of services, or effective screening, diagnosis, and referral to appropriate services, in practice institutions and systems often reinforce disparate outcomes through unequal funding and segregation based on income, race, and ethnicity. This section discusses how various educational, health, welfare, and justice institutions and policies serve to increase disparities in adolescent outcomes, beginning with the school, an institution that almost all adolescents will interact with over a prolonged period. The next section addresses additional disparities that can arise in the design and operation of social systems as they interact with groups of adolescents.
Schools: Segregation and Financing
Historically, schools in the United States were segregated by race and funded largely through local property taxes. As a result, there were huge disparities in both the family resources of the students attending school as well as the public resources devoted to the administration of each school. The courts have been responsible for substantial changes to both. As a result of the landmark 1954 Brown v. Board of Education Supreme Court decision, U.S. schools desegregated (racially) between 1968 (the first year of adequate data) and 1980, with the greatest changes occurring in the South (Boozer et al., 1992). However, while within-school-district segregation fell, between-district segregation rose because of greater residential segregation by race and income across districts as a result of White flight, gentrification, and housing patterns and practices.
Since 1980, with the end of much court-ordered desegregation, there has been no further reduction in race-based school segregation. Segregation in practice (though not by law) stemming from economic or family-income differences has been rising since 1970, and Black and Latinx students are disproportionately served by high-minority, high-poverty schools (Owens
et al., 2016). While most of the existing work on school segregation has focused on race and income, a 2016 Government Accountability Office report documented that Latinx youth comprise the largest group attending high-poverty schools, defined as 75 percent free lunch eligible (U.S. Government Accountability Office, 2016).13
However, while schools have become increasingly disparate in terms of the share of students from low-income families and racial/ethnic minorities, school financing has converged considerably over time (Lafortune et al., 2017). In 1990, low-income districts (defined as those in the bottom quantile of mean household income in the district) collected 20 percent less in school funding, but by 2001 these districts received funding equal to those in the top quantile. This parity was achieved by overall increases in funding for all schools, with disproportionately greater increases in low-income districts, stemming from reforms to state education funding formulas implemented in response to court orders. The increase in parity with respect to school financing corresponds to increasing parity with respect to teacher training and wages, which no longer vary significantly based on the racial or ethnic composition of the student body (U.S. Department of Education, Office of Civil Rights, 2015). This is not to imply that there are no differences in school resources for students based on income, race, and ethnicity. Black and Latinx students, for example, still have less access to advanced coursework such as calculus and physics as well as advanced placement courses in high school. The effects of such disparities on student achievement often carry on long after secondary school as this lack of early access fails to help prepare students for college and the workforce (U.S. Department of Education, Office of Civil Rights, 2015).
The increase in parity with respect to school financing has resulted in significant gains in test scores for students in low-income districts across the United States (they rose by 0.1 standard deviation, or one-fifth of the baseline gap between high- and low-income districts, over a 10-year period) (Lafortune et al., 2017). The fact that parity in funding did not result in an even greater parity in test scores suggests that increasing disparities in the family resources of students attending schools has continued to exert significant influence. Children from disadvantaged families enter kindergarten with lower rates of preliteracy and school readiness. One reason is that they are less likely to attend preschool, and if they have attended preschool it is likely one of lower quality (Magnuson and Waldfogel, 2005; Magnuson et al., 2004). In order to compensate for this starting-from-behind position,
___________________
13U.S. Government Accountability Office (2016) documented that the number of schools in which more than 75 percent of children were free lunch-eligible and more than 75 percent were Black or Latinx grew from 9 percent in 2001 to 16 percent in 2014.
children from disadvantaged households likely need more resources, and not simply equal resources, if society is to help reduce disparities in educational outcomes.
Moreover, in addition to fewer family resources being a source of disadvantage for some families when it comes to school readiness, there is also evidence that the collective resources of the families whose children attend a given school also matters. Segregation of schools by family income is the single most predictive factor of academic achievement gaps by race and income (Reardon, 2015). The increasing income segregation of American schools, along with rising income inequality, has most likely prevented society from achieving the full benefit of the significant gains in financial parity across schools in terms of improved outcomes and decreased disparities in test scores.
Housing: Segregation and Financing
School segregation is driven largely by neighborhood segregation and, as such, the policy or institutional response to the increasing segregation of American schools largely lies in housing policy. The Fair Housing Act of 1968 requires that all municipalities follow policies to “affirmatively further fair housing,” but to date this has not been pursued with vigor. There is a severe shortage of affordable homes generally in the United States today. The federal housing voucher program, which subsidizes the rent of low- and middle-income families, in theory, allows families to move to more integrated neighborhoods, but it currently funds only 5.3 million individuals in 2.2 million households. Moreover, tightness in the housing market and housing discrimination serve to reduce the likelihood that low-income families can move to low-poverty neighborhoods, even with a housing voucher (Chetty et al., 2016; Katz et al., 2001).
The federal government has dramatically reduced its direct role in the construction of low-income housing, in part because public housing projects served to exacerbate the segregation of low-income families in high-poverty areas. Instead, the government has increasingly relied on making low-income housing tax credits available to developers to increase their construction of housing for low-income populations. However, evidence suggests that these construction projects have not resulted in meaningful integration. Rather, this program is more likely to provide higher-quality housing in poor neighborhoods than to build affordable housing in low-poverty neighborhoods (Cummings and DiPasquale, 1999).
Health Care: Access and Quality
Unlike education, health care is not freely available to all adolescents, and some of the disparities in their health arise from disparate access to health care for certain groups. Recent policy efforts, including the Affordable Care Act (ACA), have reduced one important source of disparities in medical care: access to health insurance. In assessing the impact of the ACA on health care access, a recent analysis of the national Medical Expenditure Panel Survey found significant increases in full-year public insurance coverage among adolescents, namely that their coverage rate of 23 percent before the ACA rose to 30 percent afterwards. There were also significant decreases among adolescents in partial coverage (dropping from 14 to 11%) and full-year uninsured status (from 9 to 5%) (Adams et al., 2017). This increase in insurance coverage was accompanied by an increase in the proportion of adolescents receiving a preventive care visit, which rose from 41 to 48 percent, with minority and low-income groups experiencing the greatest increases.14
Although the ACA brought about significant improvements in overall health insurance coverage and declines in disparities in coverage, severe inequities in access to and quality of care remain. Roughly 15 to 20 million children—the majority of whom are Black, Latinx, and low-income adolescents15—reside in medically underserved areas, thereby limiting their access to comprehensive and coordinated health care. “Medical homes” is defined as “an approach to providing comprehensive primary care that facilitates partnerships between patients, clinicians, medical staff, and fami-
___________________
14 Measuring the change between pre- and post-ACA, non-White Latinx adolescents saw an increase from 33 to 43 percent. There was also a significant increase among Black adolescents from 37 to 46 percent in the proportion who had received a preventive visit. The largest increase in preventive care visits was seen among the lowest-income group (<100% of the federal poverty level or FPL), which rose from 33 to 43 percent, followed by adolescents with household incomes between 100 and 200 percent of FPL, which rose from 34 to 43 percent. The highest-income group only saw a 3 percent increase pre-to-post-ACA (51 to 54%, respectively) in the proportion reporting accessing preventive health visits.
15 Based upon the National Survey of Children’s Health, 2016 data, 48 percent of adolescents (ages 12 to 17) without special health care needs have a medical home; this includes 36 percent of Latinx adolescents, 40 percent of Black adolescents, and 60 percent of White adolescents. Income level also impacts whether any child (ages 0 to 17) without special health care needs will have a medical home. For these children, among those below poverty (using the FPL), 36 percent have a medical home; among those between 100 and 199 percent of FPL, 41 percent do; among those between 200 and 399 percent of FPL, 53 percent do; and among those above 400 percent of FPL, 63 percent do (National Adolescent and Young Health Information Center, University of San Francisco, 2016).
lies” by the American Academy of Pediatrics.16 Related to this, young people in rural areas have less access to primary health care and mental health care than their urban peers (Sanders et al., 2017).
“Crossover Youth”: Dual Involvement in Child Welfare and Justice System
The experiences of youth in the child welfare system are closely related to their experiences in the juvenile justice system, as the same adolescents are disproportionately represented in both systems (Smith et al., 2005).17 Adolescents in the child welfare system often face (or have faced) challenges within the home that may increase the likelihood that they will engage in behaviors such as truancy or running away from home. Although non-criminal, these behaviors, known as “status offenses,”18 are often the primary mechanism by which youth in the child welfare system “crossover” into the juvenile justice system. Adolescents that engage in status offenses often have higher rates of mental health and substance abuse disorders, and abuse and neglect during childhood have also been found to be highly predictive of committing status offenses (Herz and Ryan, 2008a).19 Moreover, when youth in the child welfare system become involved in the juvenile justice system, they are more likely to be treated harshly, such as being sentenced to detention instead of probation.20 Some have argued that the disproportionate share of minority adolescents in CPS is one of the main drivers of the disproportionate share of minority adolescents in juvenile detention. Child welfare involvement is an especially important avenue or pathway to the juvenile justice system for female adolescents (Ryan et al., 2007). (For further discussion of the status offense system, see Chapter 8.)
___________________
16 The goal of the medical home approach to providing care is to “produce higher quality care and improved cost efficiency.” See Engaging Patients and Families: What Is Medical Home? from the American Academy of Pediatrics, available at https://www.aap.org/en-us/professionalresources/practice-transformation/managing-patients/Pages/what-is-medical-home.aspx.
17 Based on statistics collected from individual studies of local areas, it is estimated that 30 percent of children in the child welfare system have future involvement in juvenile justice system as well.
18 Status offenses are defined as offenses considered crimes if committed by persons under the age of 18.
19Herz and Ryan (2008a) found that 80 percent and 61 percent of dual system-involved youth had substance abuse and mental health disorders in a study of Arizona youth. LGBTQ youth, who are more likely to face bullying and harassment in school, are also more likely to run away from home and be truant (Gay, Lesbian, and Straight Education Network, 2017).
20 Again, there are no national statistics, only local studies. In Los Angeles County, for example, the probability of probation rather than placement or corrections was only 58 percent for CPS involved youth as compared to 73 percent for non-CPS involved youth (Herz and Ryan, 2008b; Ryan et al., 2007).
“Crossover youth”—youth involved in both CPS and juvenile justice—have the most significant needs and, therefore, require greater services, but they often experience service disruptions when they transition to the juvenile justice system (Pumariega et al., 1999). For female crossover youth in particular, who are at greater risk of pregnancy, there are few gender-specific programs to address their needs. The degree of service disruption is a function of the type of arrangements made between the two systems, which is determined by state statute. States that give the agencies concurrent jurisdictions afford the greatest amount of coordination for crossover youth, who thereby remain eligible for services provided by both systems. In contrast, in states with separate jurisdictions there is much less coordination, and adolescents lose eligibility for services when they become involved in the juvenile justice system.
Because of their greater underlying risk, their disparate treatment in the juvenile justice systems, and the disruptions in service provision they experience, crossover youth (who are disproportionately Black), have worse outcomes than other youth in both the short and the long term. They are more likely to be arrested as adults, less likely to be employed, and more likely to receive public assistance in adulthood (Culhane et al., 2011). Chapter 8, which addresses adolescents in the child welfare system, explores how the system’s processes affect adolescent outcomes in greater detail.
Racism, Bias, and Discrimination
A third source of disparities in adolescent outcomes derives from the explicit and implicit (or unconscious) biases that individuals hold against groups defined by race, ethnicity, gender, LGBTQ identity, ability status, and other categories. These biases can be expressed in both singular significant interactions as well as in a series of less obvious but frequent events, referred to as micro-aggressions.21 When aggregated in an institutional context, these biases can result in disparate outcomes for the affected groups.
Adolescents are especially sensitive to the attitudes and behaviors of adult members of the community, on whom they rely for information and encouragement with respect to care-seeking behavior, effort exerted in school, and so on. Community attitudes and behaviors can influence both the probability of mental health disorders as well as the probability of treatment. With regard to the former, the experience of bias and discrimination can harm the behavioral health of adolescents, with affected adolescents demonstrating greater depressive and anxiety symptoms (Chithambo et
___________________
21 A microaggression is defined as “brief and commonplace daily verbal, behavioral, or environmental indignities, whether intentional or unintentional, that communicate hostile, derogatory, or negative . . . slights and insults” (Sue et al., 2007, p. 1).
al., 2014; Davis et al., 2016; Park et al., 2017) and outward expressions of anger (Umaña-Taylor, 2016). These effects can be long-lasting. Assari and colleagues (2017) found that Black adolescent males who perceived discrimination during adolescence suffered greater negative effects on anxiety and depression in adulthood than Black females, which may suggest one potential source for the relatively worse outcomes of adolescent Black males relative to females in terms of their educational, health, and justice-system outcomes. Bias among peers and families might also affect adolescent outcomes and explain disparities; Box 4-4 discusses the impact of family or peer acceptance and support of LGBTQ adolescents.
Researchers have also hypothesized that exposure to discrimination results in worse physical health, moderated by higher levels of stress as measured by elevated cortisol.22 Consistent with this, Russell and colleagues (2012) found that adolescents experiencing bias-based harassment are at greater risk for compromised health outcomes in adulthood than those experiencing non-bias-based harassment (Russell et al., 2012).
In the following, we discuss the evidence regarding the bias behaviors of adults who regularly interact with adolescents and how they may help explain disparities in adolescent outcomes. By “those who regularly interact with adolescents” we mean teachers, health professionals, case workers, police officers, and other official participants in the juvenile justice system (including lawyers, judges, and corrections officers).
Educators
In the domain of education, teachers often have different expectations and standards for their students based on students’ race, ethnicity, gender, and sexuality, which show up when it comes to evaluating student achievement and behavior. When a teacher has lower expectations of an adolescent’s achievement based on the adolescent’s group identity, this has a harmful influence on actual achievement (Jussim and Harber, 2005).
Recent research finds that Black teachers have expectations of their Black students that are 30 to 40 percent higher than the expectations that White teachers have of the same students (Gershenson et al., 2016). The same research shows evidence of intersectional inequality: these differences are larger for Black male students than for Black female students (Gershenson et al., 2016). These findings are consistent with research, finding that, for elementary-school-age Black children, having a Black teacher in third through fifth grades increased the probability of graduation from high school (Gershenson et al., 2017). These findings underscore the consid-
___________________
22 See Richman and Jonassaint (2008) for evidence linking experimental exposure to discrimination and cortisol.
erable cost associated with the continuing shortage of Black teachers in U.S. schools (Madkins, 2011). (For further discussion, see “Creating Culturally Sensitive Learning Environments” in Chapter 7).23
Disparate treatment of students when it comes to disciplinary actions, such as suspension or expulsion, is well documented (see, e.g., Gordon, 2018). Most of the previous work has focused on racial/ethnic differences, finding that Black and Latinx high school students, for example, are only slightly more likely than White or Asian students to be “sent to the principal’s office” for disciplinary infractions but are two to four times more likely to be suspended or expelled (Wallace et al., 2008). They find that the differences by race and ethnicity cannot be explained by differences in income. More recently, researchers have examined the disparate treatment of LGBTQ students as well as students with disabilities (see, e.g., Skiba et al., 2016).
Interestingly, the reasons why White and minority students are reported for discipline differs significantly, with minority students being referred more often for more subjective reasons, such as “disrespect” and “perceived
___________________
23 Eighty-two percent of teachers are White, compared with 8 percent who are Black. Among students, only 47 percent are White and 17 percent are Black. See https://nces.ed.gov/surveys/sass/tables/sass1112_2013314_t1s_001.asp.
threat,” and White students referred more often for more objectively identifiable reasons, such smoking or vandalism (Skiba et al., 2002). The higher rates of suspension for Black and Latinx students for subjective infractions is consistent with differences in teacher and school personnel treatment of students based on race and ethnicity. Experimental evidence confirms racial bias in disciplinary decisions. Okonofua and Eberhardt (2015) found that when presented with identical descriptions of student behavior, teachers viewed two minimal infractions as more troubling and deserving of harsher punishment when committed by a Black student than by a White student. Mendez (2003) found that unequal treatment based on race, ethnicity, gender, sexuality, or disability status results in disparate outcomes for children, as out-of-school suspensions are highly predictive of future involvement with the criminal justice system and reduced educational achievement.24 Recent initiatives have sought to reduce the suspensions and expulsions of youth of color from schools, but to date these initiatives have been small in scope.25 (See also Chapter 9, Box 9-2, “Relationship Between School Disciplinary Policies and the Juvenile Justice System.”)
Health Care Professionals
Health care professionals have also been found to treat adolescents from different social and racial/ethnic groups differently (Valenzuela and Smith, 2015). Provider attitudes have been identified as an important determinant of the quality of care provided to adolescents (Alegria et al., 2011).26 In a clinical setting, even the most well-intentioned providers can contribute to racial/ethnic disparities in adolescent health care because of unconscious stereotyping (Burgess et al., 2004). One study that examined the way alcohol and other drug use was screened for in the primary care setting revealed that adolescents from minority groups were less likely to be screened than their non-Latinx White counterparts (Meredith et al., 2018). Since many of these adolescents are not being asked about alcohol and other drug use by their doctors, their harmful behaviors could be going unnoticed, perpetuating the consequences associated with substance abuse.
___________________
24 Moreover, there is little evidence that school disciplinary actions result in reductions in the “misbehavior” they are intended to modify (Mendez, 2003).
25 For example, the California Endowment has supported special projects in Oakland Schools geared to the retention of Black males in particular—rather than losing them. See https://philanthropynewsdigest.org/news/california-endowment-commits-50-million-to-keep-boys-andyoung-men-of-color-in-school.
26 Nevertheless, matching adolescents with providers of the same ethnicity or race has not been consistently shown to reduce disparities in the quality of care received.
Child Welfare System Actors
There are multiple reasons why Black and Latinx children are much more likely to be referred to CPS. Disproportionate need (typically stemming from poverty) and differential treatment by both community members and the child welfare system play important roles in explaining the disparities. Research on the sources of these disparities has been summarized elsewhere (Alliance for Racial Equity in Child Welfare, 2011). In general, both observational and experimental research has found that community reporters (e.g., teachers and doctors) are more likely to report children of color to CPS than other children. The experimental results suggest a role for personal bias, but the observational results are consistent with a more systematic source, such as increased maltreatment surveillance in communities of color (Chaffin and Bard, 2006).
Not only are children of color more likely to be referred to CPS, but also, conditional on observable characteristics, they are more likely to be removed for reasons not related to underlying risk. Two Texas-based studies documented that although Black families tended to be assessed as lower risk than White families, they were more likely to have substantiated cases and their children removed (Dettlaff et al., 2011; Rivaux et al., 2008). Additional research has found that Black caseworkers on average assessed all families (regardless of race) as higher risk than did White caseworkers. The fact that Black families are more likely to be assigned to Black caseworkers may explain some of the higher rates of substantiated maltreatment observed for Black families (Font et al., 2012).
A second important source of systemic disparity in treatment is the offering of fewer in-home services to families of color that might prevent the placement of a child or adolescent in foster care (Fluke et al., 2011). A Michigan-based study found that contracted agencies were not providing services in Black communities although they were required to do so (Center for the Study of Social Policy, 2009). As a result, children of color were both more likely to be removed from a home and more likely to remain in their foster placement longer without permanent resolution.
Justice System Actors
The area in which disparate treatment of adolescents has received the most public attention is the criminal and juvenile justice systems. As of 2013, Black adolescents were four times more likely to be committed to residential placements as White adolescents, Native Americans were three times as likely, and Latinx adolescents were 61 percent more likely (Rovner, 2016) (Figure 4-6). Although the available data are difficult to assess because of the nature of self-reports, they suggest that White and Black
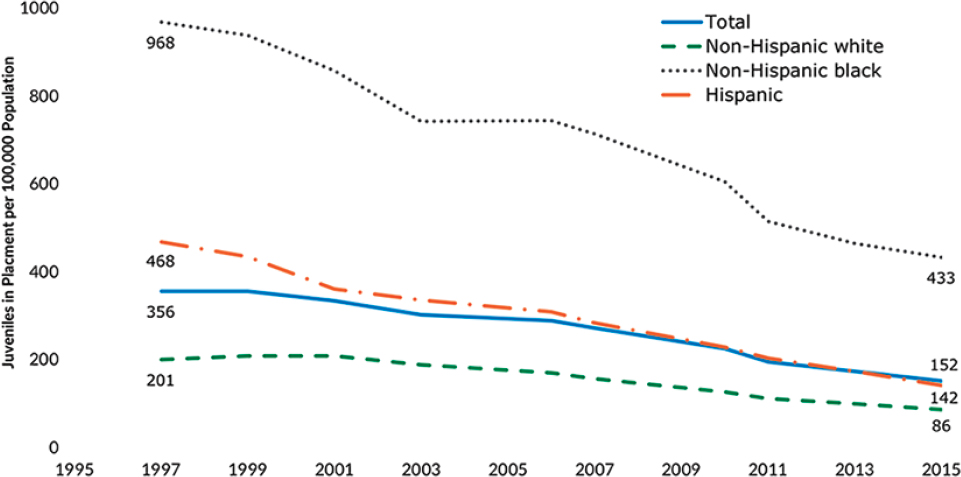
NOTES: The Census of Juveniles in Residential Placement collects data on all juvenile residential custody facilities in the United States, asking for information on each youth assigned a bed in each facility on the last Wednesday in October. Residential facilities include detention centers, shelters, reception/diagnostic centers, group homes, boot camps, ranch/wilderness camps, residential treatment centers, and long-term secure facilities. Rates are calculated per 100,000 juveniles ages 10 through the upper age of each state’s juvenile court jurisdiction.
SOURCE: Child Trends (2018).
high school students do not differ in the probability of either committing property crime or engaging in violent behavior (Bureau of Justice Statistics, 2000). The disparate treatment they nevertheless receive is particularly troubling given the system’s stated emphasis on fairness, suggesting that much of the disparate treatment stems from interpersonal sources of bias.
The fact that there have been significant declines in juvenile arrest and detention in the United States since 1995 has not translated into declines in disparities by race and ethnicity; in fact, disparities appear to have increased over this period. These disparities seem to widen at every stage of the process, from arrest, to the decision to prosecute and remove to adult court, to sentencing and type of confinement (DeLone and DeLone, 2017; Fader et al., 2014; Sickmund et al., 2014). A possible explanation for the increase in disparate treatment over the past two decades is the decline in the rate of serious offenses for which there is less discretion in the decision making (e.g., in deciding to prosecute or how to sentence). As the number of less-serious offenses has risen as a proportion of all offenses, there may have been more discretion exercised by practitioners at every stage of the process, potentially resulting in a greater proportion of biased decisions. For further discussion of disparities in the justice system, see Chapter 9.
ACHIEVING EQUITY FOR ADOLESCENTS
While inequalities in opportunity are deeply rooted in U.S. society, progress can be achieved. Recent improvements in adolescent health and well-being, education, and justice-system involvement inspire some confidence that change is possible. In this section, we discuss promising policies and programs that attempt to tackle some of the disparities in opportunity outlined above, including (1) policies and programs aiming to reduce disparities in income, wealth, and neighborhood resources to rectify disparities in financing and policy implementation in youth-serving systems; (2) trauma-informed approaches preparing adults serving youth in youth-serving systems to address differential exposure to violence and trauma among youth; and (3) emerging tools to erase or counteract bias in decision making by system-level actors. Specific policies to combat disparities in institutions and systems are discussed in Chapters 6 through 9.
It is also important to note that existing research demonstrates the great resilience and strength of youth traditionally considered disadvantaged or at risk (Task Force Report on Resilience and Strength in African-American Children and Adolescents, n.d.). Box 4-5 summarizes the extant literature on resilience in adolescence; see also Chapter 3. Defining resilience as “a dynamic process encompassing positive adaptation within the context of significant adversity” (Luthar et al., 2000, p. 543), resilient youth have exhibited positive outcomes in a host of domains: education, health, and psychological well-being. Indeed, researchers have documented many instances of adolescents in adverse circumstances becoming very high achievers (Hoxby and Avery, 2012). It is important to keep this in mind when interpreting existing research on disparities. Identifying and promoting resilience and strength among disadvantaged and at-risk youth, while encouraging the development of further protective factors, holds promise for enhancing opportunity for all adolescents.
Reducing Disparities in Income, Wealth, and Neighborhood Resources
As described above, one of the key sources of inequality in opportunity and treatment that affects adolescents is disparities in the resources of families and communities where adolescents live. However, such disparities are not intractable; solutions to child poverty are achievable.
Existing programs, such as the Supplemental Nutrition Assistance Program (SNAP) and the Earned Income Tax Credit (EITC), have been found to reduce child poverty and improve child and adult outcomes (NASEM, 2019). SNAP, and its predecessor, the Food Stamp Program, have been shown to improve child health in both the short- and the long-term. For example, Hoynes and colleagues (2016) found that participation in SNAP
in childhood is related to reduced incidence of metabolic syndrome in adulthood. For adolescents, who need adequate energy and nutrient intake to support their physical growth, SNAP benefits can play a particularly important role in their healthy development.
Yet families with teenagers face higher rates of food insecurity than families with younger children (Nord, 2009). This may be partly due to the fact that SNAP benefit allocations are based on the assumption that all children in a household are 12 years old or younger (Ziliak, 2016), thereby failing to take into account the increased dietary needs of adolescents. However, a recent National Academies report, A Roadmap to Reducing Child Poverty (“Reducing Child Poverty report”) found that expanding SNAP benefits, accounting for the needs of adolescents, and increasing benefits during the summer months could decrease child poverty rates by as much as 2.3 percent, depending on how large the expansion is (NASEM, 2019).27
Similarly, the EITC—a refundable tax credit for low- and moderate-income workers—has been shown to improve the longer-term health and human capital of children and youth in families who receive it. Several studies have found a consistent positive impact of larger EITC payments on children’s and adolescents’ education outcomes (NASEM, 2019). For example, Maxfield (2013) found that larger EITC payments increase the odds of youth in low-income families graduating from high school and completing 1 or more years of college by age 19. Similarly, Manoli and Turner (2014) found that more generous EITC payments lead to a greater number of youth in low-income families attending college. Further expanding the EITC could decrease child poverty rates by up to 2.1 percent, lifting 1.5 million children and youth out of poverty, according to the Reducing Child Poverty report (NASEM, 2019).
In addition to expanding existing programs, implementing innovative new programs could cut child poverty rates further and improve the material circumstances of adolescents living in poverty (NASEM, 2019). For example, implementing a child allowance program—which would provide a monthly cash payment to families for each child under 18 in the household—has the potential to reduce child poverty in the United States by as much as 40 percent (NASEM, 2019). Child allowance programs are already in effect in 17 other nations, including Australia, Canada, Ireland, and the United Kingdom (NASEM, 2019). In addition to benefiting adolescents under 18 and their families, a child allowance program would also support adolescents who are parents.
___________________
27 The report presents data from a microsimulation model called TRIM3. For more on this proposal and the study methodology, visit nap.edu/reducingchildpoverty.
In summary, the child poverty rate in the United States can be reduced substantially through the expansion of existing programs and the implementation of new ones. Living in poverty significantly curtails economic opportunity for adolescents and youth of color who are disproportionately disadvantaged by growing up in poverty. By reducing child poverty, society can make a timely long-term investment to overcome the inequities faced by adolescents from low-income families and unleash new opportunities.
Addressing Differential Exposure to Violence and Trauma
Research from across disciplines has highlighted the potential impact of trauma on all aspects of an adolescent’s development and functioning and recognized that in many different settings it is essential that those who encounter adolescents routinely understand how trauma may be manifested in the particular context of the encounters. This viewpoint is becoming increasingly developed under the umbrella of trauma-informed youth services. To be trauma-informed means to know the history of past and current abuse in the life of the person one is serving, no matter what the service setting. Because trauma’s impact is manifested during adolescence in ways that cut across all aspects of their development and behavior, the major initial challenge in becoming trauma-informed is how to recognize and identify trauma victims across the many varied settings that serve young people and places they congregate. The second challenge is how to engage these young people in services that can help them.
In calling for a trauma-informed service system, Harris and Fallot (2001) write:
Systems serve survivors of childhood trauma without treating them for the consequences of that trauma; more significant, systems serve individuals without even being aware of the trauma that occurred. This lack of awareness can result in failures to make appropriate referrals for trauma services. It can also result in inadvertent re-traumatization when a service system’s usual operating procedures trigger a reemergence or an exacerbation of trauma symptoms (p. 3).
Further, Harris and Fallot (2001) identify the following requirements for services to be truly trauma-informed:
- administrative commitment to change, including allocating resources to ensure this;
- universal screening;
- trauma-specific training and education;
- ensuring that hiring practices are designed to recruit expertise in trauma; and
- ensuring that policies and procedures are sensitive to the issues faced by trauma victims.
So, for example, in schools teachers and school support staff need to be informed about how, in the school setting, adolescent victims are frequently misidentified as presenting with attention deficit disorder, oppositional-defiant disorder, or conduct disorder. Such a diagnosis may prevent consideration of effective interventions for curtailing or remediating the effects of trauma (Perry, 2006).
McInerney and McKlindon (2014) note that some states, such as Massachusetts and Washington, are implementing trauma-informed approaches in schools. These states have adopted models, such as the Sanctuary Model,28 which engage educational leaders and staff to develop a culture where educators model and students develop safety, emotional management, self-control, and conflict resolution skills. They note that for schools, being trauma-informed requires being informed about and responsive to trauma, and providing a safe and stable environment for both students and staff, acknowledging trauma and its triggers, and avoiding stigmatizing and punishing students. One of the goals is to prevent re-traumatization (McInerney and McKlindon, 2014). Another example of trauma-specific interventions designed for use in schools is the Cognitive Behavioral Intervention for Trauma in Schools, an evidence-based intervention that can be delivered in group settings or individually and that includes psychoeducation for parents and training for teachers.
In systems that work with adolescent populations that are disproportionately affected by trauma—child welfare and juvenile justice—there is an emerging literature on the implementation of trauma-informed approaches. For example, Ford and Blaustein (2013) describe trauma-informed approaches developed for juvenile justice systems and present guidelines for one model: Trauma Affect Regulation: Guide for Education and Therapy (TARGET). TARGET is an educational and therapeutic intervention for adolescents and adults that can be implemented as individual or group therapy and focuses on trauma-related dysregulation, reframing symptoms as adaptive responses.
Hodgdon and colleagues (2013) describe the application of an evidenced-based, trauma-informed treatment framework known as Attachment, Regulation and Competency (ARC), used with youth involved in the justice system (Hodgdon et al., 2013). Initial data demonstrated a significant reduction in post-traumatic stress disorder symptoms and externalizing
___________________
and internalizing behaviors, outcomes that are supportive of its clinical utility as a practice in residential contexts.
In addition, Riebschleger and colleagues (2015) have called for bringing a trauma-informed lens to the child welfare system. Noting that foster care youth commonly experience complex trauma as a result of family-of-origin maltreatment and separations from their families, youth involved in the study identified strategies for supporting children in foster care and reducing trauma before, during, and after foster care placement. They noted that foster parents need more training and support for dealing with traumatized youth, and asked for greater efforts to help them remain connected with their families, especially siblings.
Using Predictive Analytics to Reduce Bias in Decision Making
As discussed above, racism, bias, and discrimination contribute to differences in opportunity for youth, particularly when system-level actors exhibit such behaviors in their decision making. Although it is possible for data to have biases—as much data derive from systems and individuals that internalize societal biases and discrimination—predictive analytics (the use of historical data to predict the likelihood of future events) have the potential to greatly improve outcomes for youth. So long as algorithms are thoughtfully designed to avoid duplicating common human preferences and biases, such as those favoring a particular race, ethnicity, gender, or other group, and are deployed with datasets that are equally clean of bias, then algorithms, unlike human beings, do not have any intrinsic preferences to favor any particular race, ethnicity, gender, or other groups and are better able to make accurate predictions at the group level, which can lead to gains in societal outcomes that benefit disadvantaged groups. Thus, the committee views predictive analytics as promising for two reasons: (1) Algorithms use the same data that individuals use to make predictions and decisions. While individuals in the course of their decision making may add their own biases on top of those biases inherent in the data, algorithms can be structured so as to not add additional bias in their decision-making process. (2) Because algorithms can be more transparent in their operations, it is easier to detect whether any bias in the data are leading to biased decisions, and then make corrections. When individuals use data to predict and decide, given the opacity of the human condition, it is difficult to determine how data is influencing decision making, and therefore, similar course corrections to reverse bias are much more difficult to implement.
Although predictive analytics were first used as early as the late 1990s, the predictive models they built were not very accurate, mostly because of the paucity of data available to model risk. Since then, state and local governments have embarked on efforts to consolidate and integrate their data
systems, and this has generated a much richer source of data upon which to build predictive tools.
Adolescent-serving systems across the United States have begun developing and refining predictive analytic techniques. The child welfare system, for example, uses predictive analytic techniques in an effort to improve decision making regarding initial investigations and placement decisions for youth in its care. Predictive analytic techniques, such as algorithms, may also be used to prioritize which adolescents will receive an educational or social science intervention when the need for the program outweighs the resources available to supply the program, to predict which social workers or teachers are likely to be the most productive and effective in their jobs, or to inform justice system-placement decisions based on risk of reoffending.
To specifically illustrate the use of predictive analytics, we detail perhaps the most prominent use of predictive analytics in child welfare and consider potential future uses in that system. Alleghany County, Pennsylvania, adopted a sophisticated screening tool based on data integrated from multiple agencies to predict risk of future maltreatment at the time of initial referral. The tool uses 100 risk factors related to the child, family, and incident to predict future risk of maltreatment. Importantly, the tool is not used in isolation, but rather, it is used in conjunction with clinical judgment to augment standardized screening decisions. When a case is referred, the tool is applied, generating a risk score from 1 to 20. Then, following a clinical assessment, only the cases deemed highest risk are investigated further (Vaithianathan et al., 2017). Studies have shown that predictive analytic tools such as those used in Alleghany County can help protect children who otherwise would not have been identified as being at high risk, and can also reduce the number of “false positives,” thereby protecting families wrongly targeted and reducing the over-representation of ethnic and racial minority children in the system.
Although to date, predictive analytic tools have primarily been used to help inform initial investigations and subsequent placement decisions during childhood, there is potential for historical data and predictive analytic tools to be incorporated as one source of data in determining optimal services and treatments for adolescents in the child welfare system as well as in other systems. For example, in tandem with caseworker and adolescent judgement, machine-learning techniques could be refined to identify clusters of risk and protective factors that would increase the likelihood that a specific service or intervention might benefit a particular adolescent. Similar tools could be used to help guide decisions related to the timing of when an adolescent may be ready to successfully exit the child welfare system. There may also be a role for the use of predictive analytics in identifying youth in need of mental health services. Machine-learning analytic approaches, for example, might be applied to youth’s social media activity to provide
effective and timely services to high-risk youth to prevent events such as adolescent suicide and related self-harm behavior.
Use of predictive analytic techniques by adolescent-serving systems has the potential to lead to positive outcomes for youth, reduce discrimination as compared to human decision making, and remediate some of the disparate impacts produced by past reliance on biased data (Kleinberg et al., forthcoming). Kleinberg and colleagues (2018), for example, studied decisions made by New York judges in determining which defendants would be detained and then compared those decisions to decisions made by computational prediction to determine whether the judges might have made better decisions using an algorithm. They discovered when they reduced the number of Blacks and Latinx jailed by 40.8 percent and 44.6 percent, respectively, they were able to achieve the same crime rate, which suggests that it is possible for an algorithm to reduce racial/ethnic inequalities (Kleinberg et al., 2018).
However, machine-learning approaches are only as effective as the data and the human designers they draw upon, and algorithms must be transparent and auditable, use fair and nondiscriminatory choice of data, and undertake reasonable algorithmic objectives in order to realize these potential benefits (Kleinberg et al., forthcoming). These new tools have great potential for improving the lives of adolescents and their families and reducing disparities in U.S. society, but, like all technologies, they can be used well or poorly. To ensure that they realize their potential for positive social impact, regulatory systems and oversight are needed.
CONCLUSION
Certain categories of youth, often defined by race, ethnicity, income, gender, or sexuality, enter adolescence already at a disadvantage in terms of their school achievement, health, and family stability. Although the neurobiological evidence suggests that adolescence presents an opportunity for significant remediation, the data suggest that, if anything, developmental disparities increase as youth age.
Disparities in adolescent outcomes by income, race and ethnicity, and gender will continue to translate into inequality in future adult outcomes, including, but not limited to, employment, criminal justice involvement, and health, unless significant steps are taken to reduce them. Addressing disparities in adolescent outcomes will require multipronged and multilevel interventions, as the differences in opportunity are both complex and interwoven. An effective strategy, or set of strategies, must address the main sources of these disparities: rising inequality in family income and wealth accumulation; neighborhood segregation by income and race that has direct and indirect effects on youth and their families; and personal biases that
subvert the very systems that are supposed to ensure the equal treatment of all youth.
Moreover, greater coordination is needed across the multiple systems responsible for adolescents: the school system, health care system, and juvenile justice and child protection systems have traditionally operated independently. We now know, however, that many of the obstacles to healthy youth development cut across multiple systems and that systemic deficiencies in one arena negatively impact outcomes in other arenas. Examples include the way poor health reduces educational attainment and the way involvement in CPS negatively affects juvenile justice outcomes.
Parity in public system funding is a first step, but will not be sufficient to significantly reduce disparities. While increasing parity in funding in the educational sector did reduce disparities, it did not eliminate them. Rather, the research suggests that the lack of parity in family and neighborhood resources remains an important predictor of the continued disparities in adolescent educational outcomes, despite improvements in system funding. To significantly reduce or eliminate disparities, disadvantaged youth will likely require disproportionate funding. Moreover, any solutions are likely to require a significant amount of time to be effective. It will likely take years, for example, to counter patterns of neighborhood segregation that were produced over many years of policies and practices aimed at reducing Blacks’ access to certain neighborhoods.
Although progress may not be immediate, there is substantial reason for optimism—progress has already been made in reducing disparities in adolescent outcomes, especially in the areas of education, health, and teen pregnancy. With one notable exception in the juvenile justice system, the evidence suggests that as overall adolescent health and well-being improve, disparities fall. These trends underscore the hope that with additional effort and a comprehensive approach, further reductions in outcome disparities among adolescents are indeed attainable. Finally, while the focus of this chapter has been to provide a context for understanding various disparities in adolescent outcomes, existing research also highlights the importance of identifying and promoting resilience and strength among those traditionally considered disadvantaged or at-risk (Task Force Report on Resilience and Strength in African-American Children and Adolescents, n.d.). Appreciating existing levels of resilience among at-risk youth, while encouraging the development of further protective factors, holds considerable promise as the nation works toward enhancing positive outcomes for all adolescents. However, promoting resilience and strength should not be considered a sufficient response alone; ending the disparities in adolescent development will also require sustained and effective system change.
This page intentionally left blank.


