
4
Indicators of Disparities in Student Outcomes
As described in Chapter 2, we propose indicators that fall into two categories: indicators of disparities in students’ educational outcomes and indicators of disparities in students’ access to educational resources and opportunities. This chapter addresses the first category.
We have chosen this set of indicators because they are measures of outcomes that we judged to be critically important milestones for success as students proceed from kindergarten through the postsecondary transition (see Figure 2-2 in Chapter 2). The proposed indicators are appropriate for different developmental stages (i.e., grade level): that is, they can measure the contours of (in)equity at different stages from pre-K through grade 12 and the transition to postsecondary activities. They also offer diagnostic capability: understanding when key inequities arise, narrow, or widen is useful for identifying targeted interventions.
Many of our proposed indicators have long formed the bedrock for measuring educational achievement and attainment. In addition, we propose indicators that offer opportunities to move beyond traditional measures of achievement and focus on different dimensions of key educational outcomes. Sound measures exist for many of the outcome indicators we propose, and several of them have been demonstrated to predict longer-term outcomes. Some of our indicators, however, are considered important in theory, but measurement is less well developed, and the research is not yet conclusive. In some cases, measures are available at the local or state level but not nationally so they cannot be compared across the country. Nevertheless, we propose these indicators envisioning that they will eventually
be developed for use nationally. In the meantime, we encourage their use at the state, district, or school level.
This chapter has four sections: one for each of the three domains and a fourth one on the availability of data and reports for those domains. In Appendix C the committee provides illustrations of the data sources and methods that could be used to develop appropriate measures for our proposed indicators. For each domain, we briefly summarize the research base, identify the indicators we judge to be important, and discuss constructs to measure for these indicators.
Table 4-1 shows the committee’s indicators for the three domains discussed in this chapter. For each domain (column 1), the table shows the indicators (column 2) and the constructs to measure them (column 3). This table provides a general framework for designing a system of equity indicators; we do not suggest the actual metrics or statistics for reporting on the indicators (e.g., percentages, averages). Rather, we discuss below the constructs to measure and ways to measure them. Some are ready for reporting on a national and subnational scale, disaggregated by population groups. Some are not. We discuss their status in the text.
DOMAIN A: KINDERGARTEN READINESS1
The first 5 years of life are a time of rapid learning and development that has profound and lasting effects. During this sensitive period, the developing brain is especially primed to create neural networks that support learning and development for years to come (National Research Council and Institute of Medicine, 2000). As discussed in Chapter 3, factors that interfere with the early building of the brain’s architecture can cause developmental delays and associated challenges that can persist or are irreversible. Early childhood experiences set the stage for later academic success. From an equity perspective, monitoring kindergarten readiness is important because large between-group disparities become apparent well before children enter kindergarten (Halle et al., 2009; Howard and Sommers, 2015; Lee and Burkham, 2003) and can have lasting effects (Duncan and Magnuson, 2011; Huttenlocher et al., 2010).
Broadly speaking, kindergarten readiness is the set of foundational skills, behaviors, and knowledge that enable children to successfully transition into kindergarten and achieve academic success throughout the primary grades (Sabol and Pianta, 2017). The importance of early achievement in literacy and mathematics in forecasting later achievement in these areas has been well documented (Duncan et al., 2007; Duncan and Magnuson, 2011). Attention skills and cognitive self-regulation are also thought to be
___________________
1 This section is drawn from Magnuson (2018).
TABLE 4-1 Proposed Indicators of Disparities in Student Outcomes
| DOMAIN | INDICATORS | CONSTRUCTS TO MEASURE |
|---|---|---|
| A Kindergarten Readiness |
1 Disparities in Academic Readiness |
Reading/literacy skills Numeracy/math skills |
| 2 Disparities in Self-Regulation and Attention Skills |
Self-regulation skills Attention skills |
|
| B K–12 Learning and Engagement |
3 Disparities in Engagement in Schooling |
Attendance/absenteeism Academic engagement |
| 4 Disparities in Performance in Coursework |
Success in classes Accumulating credits (being on track to graduate) Grades, GPA |
|
| 5 Disparities in Performance on Tests |
Achievement in reading, math, and science Learning growth in reading, math, and science achievement |
|
| C Educational Attainment |
6 Disparities in On-Time Graduation |
On-time graduation |
| 7 Disparities in Postsecondary Readiness |
Enrollment in college, entry into the workforce, enlistment in the military |
|
consequential to children’s learning because they indicate the extent to which children are able to sit still, concentrate on tasks, persist at a task despite minor setbacks or frustrations, listen and follow directions, and work independently or, conversely, whether they are easily distracted, overactive, or forgetful. Studies have consistently found positive associations between measures of children’s ability to control and sustain attention with academic gains in the preschool and early elementary school years (Brock et al., 2009; McClelland, Morrison, and Holmes, 2000; Raver et al., 2005).
Family income and education are strong correlates of kindergarten readiness. One explanation for this relationship is that parental education and income structure much of children’s early lives in terms of their experiences both inside and outside of their homes. For example, a primary driver of early school readiness is how much time and cognitive stimulation children receive from their parents, other family members, and caregivers. The amount of time parents spend with their children (or have available to spend with their children) is related to family socioeconomic status (Guryan, Hurst, and Kearney, 2008; Kalil, Ryan, and Corey, 2012; Sayer, Bianchi, and Robinson, 2004). Children’s participation in enrichment activities outside the home, such as arts and crafts, music, and physical activities (e.g., Gymboree, swimming lessons) is also predictive of early school readiness skills (Pre-Kindergarten Task Force, 2017; Pritzker, Bradach, and Kaufmann, 2015; Yoshikawa et al., 2013). Attending out-of-home day care or preschool increases the likelihood of exposure to these activities. These are investments that vary by family income level, and they seem to matter.
Based on our review of the research, we think that two aspects of school readiness should be included in an equity indicator system: (1) children’s academic readiness in literacy and mathematics and (2) children’s self-regulation and attention skills.
Indicator 1: Disparities in Academic Readiness
Achievement in the preschool and early-childhood years refers mainly to a set of reading- and math-related skills. Children who enter school with a basic knowledge of math and reading are more likely than their peers to experience later academic success (The Annie E. Casey Foundation, 2010; U.S. Department of Education, 2014). But children who are “behind at the starting gate” have a hard time catching up (Isaacs, 2012).
For early learners, reading-related skills encompass identification of upper- and lowercase letters as well as decoding skills such as beginning to associate sounds with letters at the beginning and end of words. Most early reading problems reflect poor decoding skills and low levels of phonological and phonemic awareness, such as a poor ability to break down words into component sounds. As children progress through childhood, reading skills include recognizing words by sight, understanding words in context, and making literal inferences from passages.
Concrete math skills begin with the ability to recognize numbers and shapes and to compare relative sizes. Counting and sequencing skills are followed by the ability to perform addition and subtraction tasks, as well as multiplication and division tasks. Understanding numerical properties such as proportions, fractions, integers, and decimals also develops, as do measurement skills and an understanding of geometry. These pre-academic
and academic skills develop as a result of learning opportunities embedded in everyday activities and specific instruction, which is especially important for code-related reading skills and computational mathematical skills.
Between-group differences in measures of academic readiness (recognize all letters, count to 20, write name, read words in a book) vary according to two key parental characteristics, education attainment and home language:
- Parental education attainment: Among 3- to 6-year-old children (not yet enrolled in kindergarten) whose parents had not completed high school, 15 percent could recognize all letters of the alphabet, 38 percent could count to 20 or more, 37 percent could write their name, and 13 percent could read words in a book. These figures are between 46 and 142 percent lower than those for children whose parents had completed some college or a vocational program and between 66 and 224 percent lower than those for children whose parents obtained a bachelor’s degree.2
- Home language: Children with at least one parent who spoke English were more likely to demonstrate school readiness than those with two parents who did not speak English. In terms of letter recognition, 24 percent of children whose parents did not speak English could recognize all 26 letters, compared with 29 percent of children with one parent that spoke English and 41 percent of children with two English-speaking parents. For counting, 48 percent of children whose parents did not speak English could count to 20 or higher, compared with 52 percent of children with one English-speaking parent and 71 percent with two English-speaking parents.3
Indicator 2: Disparities in Self-Regulation and Attention Skills
Cognitive self-regulation is the “processes by which the human psyche exercises control over its functions, states, and inner processes” (Baumeister and Vohs, 2004, p. 1). It involves the ability to evaluate the steps and actions required to meet a desired goal and to control behavior deliberately in order to reach that goal. It is conceived of as a broad construct that includes multiple overlapping subcomponents, such as executive function, planning, sustaining attention, task persistence, and the inhibition of impulsive responses. Among experts in child development, there is no consensus on an exact definition, but nearly all agree that being able to sit in a classroom and pay attention is essential to school learning.
___________________
Cognitive self-regulation is often measured by checklists and observation protocols, completed by parents and teachers. Assessments may indicate the extent to which children are able to sit still, concentrate on tasks, persist at a task despite minor setbacks or frustrations, listen and follow directions, and work independently or, conversely, whether they are easily distracted, overactive, or forgetful.
Studies have consistently found positive associations between measures of children’s ability to control and sustain attention and academic gains in the preschool and early elementary school years (Brock et al., 2009; McClelland, Morrison, and Holmes, 2000; Raver et al., 2005). However, there are considerable unresolved questions about whether a particular dimension of cognitive self-regulation (or behavioral manifestation of these skills) matters more than other dimensions or even if the associations can be interpreted as causal (Fuhs et al., 2014; Willoughby, Kupersmidt, and Voegler-Lee, 2012).
Differences in self-regulation and attention skills have been reported for students grouped by the socioeconomic status (SES) of their households. For example, research conducted as part of the Early Childhood Longitudinal Study, Kindergarten Class of 2010–11 (ECLS-K:2011)4 documented readiness in terms of seven approaches-to-learning behaviors: paying attention in class, persisting in completing tasks, showing eagerness to learn new things, working independently, adapting easily to changes in routine, keeping belongings organized, and following classroom rules. Analyses revealed that students from lower-SES households tended to have lower approaches-to-learning scores than students from middle-SES and high-SES households.5
Proposed Measures for Indicators 1 and 2
Assessing readiness skills of incoming kindergartners is now a common practice in this country. Many states and districts have adopted assessments of the early literacy, numeracy, and socioemotional skills they deem import-
___________________
4 See https://nces.ed.gov/ecls/index.asp. To date, the study includes three cohorts. As described on the website of the National Center for Education Statistics: “The birth cohort of the ECLS-B is a sample of children born in 2001 and followed from birth through kindergarten entry. The kindergarten class of 1998-99 cohort is a sample of children followed from kindergarten through the eighth grade. The kindergarten class of 2010-11 cohort is following a sample of children from kindergarten through the fifth grade. The ECLS program provides national data on children’s status at birth and at various points thereafter; children’s transitions to nonparental care, early education programs, and school; and children’s experiences and growth through the eighth grade. The ECLS program also provides data to analyze the relationships among a wide range of family, school, community, and individual variables with children’s development, early learning, and performance in school” (https://nces.ed.gov/ecls/kindergarten2011.asp).
ant and that are aligned with their educational programs. There is wide variation in the assessments used and the measures that are reported, however, making it unlikely that results could be aggregated in a way that would support valid comparisons at a national or state level. Starting school ready to learn is essential for future success, but as documented above, something that varies widely as a consequence of family circumstances. Nevertheless, we argue that it is critical to monitor disparities in school readiness, even if only at a local level.
Over the years, there have been discussions about expanding NAEP’s grade coverage to kindergarten (see, e.g., National Research Council, 2012). We see value in developing a version of NAEP that would be appropriate to measure kindergarten readiness. Having a set of standardized and uniform assessments of children’s early skills, administered and reported on a regular basis, may be the only way that disparities in kindergarten readiness will receive the attention they deserve. This work could be informed by the assessments developed for the ECLS-K (1998 and 2010). We encourage efforts to develop such assessments, although such a program should be conscious of the toll testing can take on young children. We also note ongoing work to develop a national-level kindergarten readiness indicator that draws upon the National Survey of Children’s Health and that can be disaggregated by race/ethnicity, income, parental education, and other relevant groups.6
DOMAIN B: K–12 LEARNING AND ENGAGEMENT
What students learn and how they perform in school positions them for future success. Course taking, course grades, and scores on tests are ways to measure students’ achievement and progress in school, and many kinds of measures are available. The extent to which a student is interested in school and participates in his or her learning, often referred to as “engagement,” also can have strong effects on academic performance and school completion. Learning and succeeding in school requires active engagement. Its opposite—disengagement—is associated with school failure and dropping out. Engagement (or disengagement) is important to monitor because most students do not just suddenly drop out: rather, they tend to go through a gradual process, sometimes called “stopping out,” during which absences and tardiness increase, grades decline, and interest in school wanes. Dropping out is the final stage of disengagement.
Although engagement in learning is important for all students, the consequences of disengagement tend to be more serious for students from disadvantaged backgrounds. When students from advantaged backgrounds experience disengagement, their grades and school attendance may decline
___________________
6 See https://www.childtrends.org/project/kindergarten-readiness-national-outcome-measure.
and they may learn less than they might have, but most eventually graduate and move on to other opportunities (National Research Council and Institute of Medicine, 2004). In effect, they often get a second chance. In contrast, the consequences of disengagement for middle and high school youth from disadvantaged backgrounds are severe; they are less likely to graduate from high school than their peers and face limited employment prospects, increasing their risk for poverty, poor health, and involvement in the criminal justice system (National Research Council and Institute of Medicine, 2004).
Indicator 3: Disparities in Engagement in Schooling
Recent work on engagement in learning consistently describes it as a multidimensional construct reflecting behavioral, emotional, and cognitive components (Appleton, Christenson, and Furlong, 2008; Fredricks, Blumenfeld, and Paris, 2004). Engagement is sometimes used interchangeably with motivation, but the two constructs have important differences. Broadly speaking, motivation is what drives a given behavior, and engagement is the outward manifestation of motivation (Fredericks and McColskey, 2012, p. 764).
Engagement in schoolwork involves both behaviors (e.g., persistence, effort, attention) and emotions (e.g., enthusiasm, interest, pride in success; Connell and Wellborn, 1991; Newmann, Wehlage, and Lamborn, 1992; Skinner and Belmont, 1993; Smerdon, 1999; Turner, Thorpe, and Meyer, 1998). Behavioral engagement refers to participation in the schooling process and includes involvement in academic, social, and extracurricular activities. It is sometimes defined in terms of positive conduct, such as attending school, completing assigned work, and adhering to classroom norms, as well as the absence of negative conduct, such as skipping school and disruptive behaviors (Connell and Wellborn, 1991; Finn, 1989; Finn, Pannozzo, and Voelkl, 1995; Finn and Rock, 1997; Fredericks and McColskey, 2012; Wang and Eccles, 2013). Behavioral engagement is often measured directly through self-reports of participation in extracurricular activities or teacher ratings of students’ behavior in class, but it is also measured indirectly with administratively captured data, such as attendance, homework completion, tardiness, and suspensions (Fredericks and McColskey, 2012). Behavioral engagement is observable by others, making it a useful signal of how students are experiencing their academic environment.
Emotional engagement denotes positive affective school relationships with teachers, classmates, academic subjects, and the school as well as a sense of belonging (Dawes and Larson, 2011; Immordino-Yang, 2016). Emotional engagement is hard to observe directly, and many studies of emotional engagement use proxy measures, often based on behavioral
engagement. However, there are instruments that capture students’ self-reports of emotional engagement and mindsets about their work, as well as measures for teachers and parents that indicate their perceptions of students’ emotional engagement (National Research Council and Institute of Medicine, 2004).
Cognitive engagement refers to student’s level of investment in learning and the degree to which they are putting in effort to process material. Fredericks and McColskey (2012) characterize it as “being thoughtful, strategic, and willing to exert the necessary effort for comprehension of complex ideas or mastery of difficult skills (Corno and Mandinach, 1983; Fredricks, Blumenfeld, and Paris, 2004; Meece, Blumenfeld, and Hoyle, 1988). As with emotional engagement, cognitive engagement is not directly observable. A number of self-report survey measures capture different aspects of cognitive engagement. The University of Chicago Consortium on School Research has a measure of cognitive engagement that is reliable as either a student-level or school-level measure (Levenstein, 2014) and that is correlated with students’ rates of passing courses and grade point averages (GPAs), separate from their test scores and background characteristics (Allensworth and Easton, 2007).
While engagement is experienced by students, it is a reflection of the interaction of students with the classrooms and school contexts in which they are functioning. For example, the same student will show different levels of engagement in different classes, with different teachers, peers, and subjects. This contextual dependence makes engagement difficult to measure and track over time and thus challenging to include in an indicator system.
Academic Engagement
Students’ level of engagement can be evaluated through student self-report surveys, checklists completed by teachers, observations, and interviews. Instruments that measure engagement typically ask students to report on their attention, attendance, time on homework, preparation for class, class participation, concentration, participation in school-based activities, effort, adherence to classroom rules, and risk behaviors. A variety of surveys and rating scales are available, but none is in wide enough use to support its inclusion in a national indicator system. It can be included in local equity systems, however.
Attendance
To benefit from instruction, students must be at school. As discussed below, the positive relationship between instruction time and learning is well documented. When students fail to go to school, when absenteeism
becomes chronic (e.g., missing 10% or more of enrolled school days; missing more than 15 school days), it can severely interfere with learning. Chronic absence is a powerful predictor of achievement because it means students have missed a substantial portion of instructional time over the course of the school year.
Chronic absenteeism affects students at all grades. Much of the early research on attendance focused on children in elementary, middle, or high school. However, more recent studies document that chronic absenteeism is a significant problem even among younger students, with 11 percent of kindergarteners nationwide chronically absent (Romero and Lee, 2007, cited in Allensworth and Easton, 2007).
Chronic absenteeism negatively affects student outcomes, and the impact is often greater for students in disadvantaged circumstances than for other students (Ehrlich, Gwynne, and Allensworth, 2018; Gottfried, 2014). This is true at all grade levels, from Head Start pre-K programs to high school (Allensworth et al., 2014; Ansari and Purtell, 2017; Aucejo and Romano, 2016; Gershenson, Holt, and Papageorge, 2016; Gottfried, 2009, 2010, 2014; Neild and Balfanz, 2006; Ready, 2017; Smerillo et al., 2018; Wang and Benner, 2014).
The Civil Rights Data Collection reported chronic absenteeism rates by population group for the 2015-2016 school year:
- Black students were 40 percent more likely to be chronically absent (missing at least 15 days during the school year) than white students: the rates were 20.5 percent for blacks and 14.5 percent for whites.7
- The same was true for Latino students, with a chronic absenteeism rate of 20 percent.8
- English-language learners (13.7%) were less likely to be chronically absent than their English-proficient counterparts (16.2%),9 although this varied by race and ethnicity. For example, Latino English-learners were more likely to be chronically absent than English-learner non-Latinos.
- Students with disabilities were more likely to be chronically absent (22.5%) than their nondisabled counterparts (14.9%).
___________________
7 Also see https://www2.ed.gov/datastory/chronicabsenteeism.html and https://datacenter.kidscount.org/data/tables/10125-chronic-absenteeism-by-race-and-other-category.
8 Data from Chang, Bauer, and Byrnes (2018).
9 A study by the UChicago Consortium on School Research found that much of the difference in 9th-grade grades and pass rates between students with disabilities and other students was explained by differences in attendance rates. The study also shows large differences based on disability type (Gwynne et al., 2009).
The rate of chronic absenteeism is higher in schools with high concentrations of students whose families are financially disadvantaged than in schools with lower concentrations of financially disadvantaged students. The U.S. Government Accountability Office (2018, p. 87) reported the following:
- For low-poverty schools (rate of 25% students in poverty or lower), the average rate of chronic absenteeism was 9.4 percent.
- For schools with a poverty rate between 50 and 75 percent, the average rate of chronic absenteeism was 13.1 percent.
- For high-poverty schools (rate of 75% or higher), the average rate of chronic absenteeism was 15.5 percent.
Proposed Measures for Indicator 3
Measures of chronic absenteeism can be included in a national indicator system; measures of academic engagement are likely available at the local level.
Indicator 4: Disparities in Performance in Coursework
While coming to school and behaving appropriately are necessary for learning, they are not sufficient. Students must learn what is being taught and demonstrate their learning by doing well in their courses. Course performance is important because it reflects the persistence, conscientiousness, and motivation needed to go to school each day, do the work, complete assignments, and turn them in on time. Research has shown that students’ day-to-day performance in the classes they take, as represented by their course grades, is a strong predictor of on-time high school graduation, and, likewise, poor performance—especially course failure—is a warning sign of dropping out.10
High school course grades are also highly predictive of college grades and college graduation, as discussed below. There are considerable differences by race, gender, income, and disability status in students’ grades and rates of passing classes (Jacob, 2002). There is also an intersection between the courses students take and their performance in those courses, so that
___________________
10 Studies that found that grades or course passing in grades prior to 10th grade are predictive of high school graduation, or that found milestones strongly associated with graduation, such as passing an exit exam or being on track to graduate in 11th grade, include Allensworth and Easton (2005, 2007); Allensworth et al. (2014); Balfanz and Byrnes (2006); Balfanz, Byrnes, and Fox (2015); Balfanz, Herzog, and MacIver (2007); Baltimore Education Research Consortium (2011); Bowers (2010); Bowers et al. (2013); Hartman et al. (2011); Kieffer and Marinell (2012); Kurlaender, Reardon, and Jackson (2008); Neild and Balfanz (2006); Norbury et al. (2012); Stuit et al. (2016); Zau and Betts (2008).
some students obtain credits in a more varied curriculum than others or have differential likelihood of taking and passing courses in particular areas, particularly high-level science and math.
Societal inequities influence students’ course selection and their ability to engage fully and successfully in their coursework and earn high grades. At the same time, school structures and classroom practices moderate the influence of societal factors on students’ engagement and the likelihood that they will pass their classes. For example, students’ attitudes toward science have been shown to be more positive in classrooms with strong teacher support, order and organization, and teacher innovation (Fouts and Myers, 1992). Student learning is stronger in classes with strong classroom control and challenging instruction (Bill and Melinda Gates Foundation, 2010; National Council of Teachers of Mathematics, 2014; Stein and Lane, 1996), while students’ engagement, work effort, and course grades are stronger in classes where teachers support students through clear instruction, monitoring, and assistance (Allensworth et al., 2014). Students’ exposure to high-quality instruction varies in relation to their backgrounds, with students from low-income backgrounds and minority students more likely to experience poorer-quality instructional environments (Ferguson, Stegge, and Damhuis, 1991; Hanushek, Kain, and Rivkin, 2004; King, Shumow, and Lietz, 2001; Oakes, 1990). Similarly, pass rates, credit accumulation, and GPAs show considerable between-group differences that reflect students’ gender, race, ethnicity, and disability status.
Some states and districts have adopted single or composite indicators of being “on-track-to-graduate” or “at risk of school failure” that incorporate information about passing and failing courses for their accountability systems, or early warning indicators in their dropout prevention systems. For example, 11 states included a 9th grade on-track indicator in their Every Student Succeeds Act (ESSA) accountability system in 2018 (see Achieve, Inc., 2018). The indicator was defined on the basis of credit accumulation, sometimes in combination with the types of courses students were taking (e.g., accumulating credits in courses needed for graduation), and course performance.
Success in Classes
Students need to pass courses and accumulate credits in order to graduate high school. Beyond having a direct influence on credit accumulation, course failures can affect students’ mindsets about whether they can succeed and belong in an academic environment; this influences their subsequent motivation and effort in school (Farrington et al., 2012). Grades and pass rates are less well documented across schools and districts than test scores, making it difficult to see the existing disparities.
Accumulating Credits across the Curriculum
Students need to pass their classes to make progress toward graduating high school, but there are also differences in the types of credits they are accumulating. Because of these differences, some states have chosen to incorporate the types of credits students accumulate into their metric for being “on track.” There are a number of ways in which there are disparities in the types of courses students take, including whether students are taking college preparatory courses or a more basic curriculum; advanced placement courses that can count for college credit; courses in science, technology, engineering, and math (STEM); world language; and courses in the arts. These courses have implications for students’ development of broad competencies and career options.
For example, several studies document a correlation between taking math and science classes during high school, particularly advanced classes in these subjects, and choosing a major in STEM and persisting with this major until graduation (Elliott et al., 1996; Maple and Stage, 1991; Riegle-Crumb and Humphries, 2012; Trusty, 2002; Wang, 2013; Ware and Lee, 1988). Yet there are large differences in the participation of students in STEM based on race, ethnicity, and income (Carnevale, Smith, and Melton, 2011; National Research Council, 2010; Runningen, 2014).
The kinds of classes that schools offer and the ways in which students are assigned to courses affect whether or not students take a broad curriculum and higher-level courses. For example, low-income students are often assigned to low-level math and science courses as early as the 9th grade and take the minimum STEM courses required for graduation, never developing higher-level math and science skills (Gamoran et al., 1997; Riegle-Crumb, 2006). Districts in areas that have a lower tax base to support schools often reduce offerings in the arts when they fall short on revenue or require families to cover the costs of arts programs, which limits the ability of students in low-income families to participate.
Grades and GPAs
Students’ grades and GPAs are the strongest predictors of whether students will graduate from high school, showing more predictive power than test scores, attendance, pass rates, demographic factors, or students’ families’ income. High school GPAs also have the strongest evidence base as an indicator of readiness for college enrollment, college grades, persistence, and college completion (Allensworth and Clark, 2018; Bowen, Chingos, and McPherson, 2009; Camara and Echternacht, 2000; Geiser and Santelices, 2007; Geiser and Studley, 2002; Roderick, Nagaoka, and Allensworth, 2006). High school GPA not only is highly predictive of
college outcomes, but also shows a generally consistent relationship with college outcomes across different high schools and colleges and is a strong predictor when comparing students with similar backgrounds and in the same high schools and colleges (Allensworth and Clark, 2018; Bowen, Chingos, and McPherson, 2009).
Several studies suggest that the threshold of a 3.0 high school GPA is the point at which students’ probability of graduating college becomes greater than 50 percent, among those students who enroll in a 4-year college (Bowen, Chingos, and McPherson, 2009; Roderick, Nagaoka, and Allensworth, 2006). Differences in grades by gender, race, and disability status in middle school and high school are echoed in differences in high school and college completion many years later. Diprete and Buchmann (2013, p. 93), for example, show that 8th grade GPAs are highly predictive of college completion and explain the wide disparities in college completion by gender.
Proposed Measures for Indicator 4
Measures for Indicator 4 should include success in classes, accumulation of credits toward graduation, and GPAs or grades. These measures are not yet available at a national level, but they may be available for some districts and states. In particular, they may be available in the form of the on-track indicators many states and districts are developing.
Indicator 5: Disparities in Performance on Tests
Standardized student achievement tests have been the central feature of state accountability and reporting systems for decades; National Assessment of Educational Progress (NAEP) has been the primary way that the public tracks educational progress on a national level. Standardized test scores have several features that make them useful for monitoring students’ educational attainment: they can provide a common metric across jurisdictions, they measure achievement in subjects that are core to most schools’ missions, and they summarize information about student performance in a concise way. In addition, performing well on tests can open up opportunities for students, including admission to postsecondary institutions and access to scholarships. Thus, between-group differences in test scores are of concern not only because they may represent underlying inequities in attainment, but also because they could illuminate opportunity gaps. However, standardized test scores have limitations; as noted above, research shows that GPAs are a stronger predictor of later outcomes than test scores. Moreover, some tests may promote inappropriate inferences because of such factors as bias or lack of alignment with the full range of valued
schooling outcomes. The committee acknowledges that test scores provide valuable information about students’ skills and about gaps, but they should be supplemented with other information.
Between-group differences in performance on achievement tests are reported by NAEP. They can be measured at the national, state, and district level for some large urban districts. In 2017, when NAEP was last administered, substantial gaps in mathematics and reading achievement were evident across racial, ethnic, and SES subgroups, as well as for English learners and students with disabilities. For instance:
- White and Asian students’ average scale scores in 4th grade reading (232 and 239, respectively)11 were higher than the average scores of black (206) and Hispanic (209) students. Gaps in mathematics, and in both subjects at other grade levels, followed a similar pattern.
- Using eligibility for free or reduced-price meals as an indicator of socioeconomic status,12 NAEP scores indicate that economically advantaged students consistently outperform disadvantaged students. On the 8th-grade mathematics assessment, for example, students who were eligible for free or reduced-price meals received an average score of 267, compared with 296 for students who were not eligible. The corresponding percentages of students scoring at the proficient or advanced levels were 18 percent and 48 percent for these groups.
- Performance gaps between students with and without disabilities are particularly large. On the 8th-grade reading assessment, average scale scores for these groups were 232 and 271, respectively.13 NAEP allows students with disabilities to test with accommodations that are intended to enable them to access the test and to prevent their disability from threatening the validity of scores.
- Students who are classified as English learners typically receive lower test scores than native speakers of English.14 These two groups received average scale scores of 246 and 285, respectively, on the 8th-grade math assessment, and scores of 226 and 269 on the 8th-grade reading assessment.
Although documenting disparities in performance on tests at a single point in time provides valuable information about between-group differences, these status-based measures do not provide any information about
___________________
11 See https://www.nationsreportcard.gov/ndecore/xplore/NDE.
12 See https://www.nationsreportcard.gov/ndecore/xplore/NDE.
13 See https://www.nationsreportcard.gov/ndecore/xplore/NDE.
14 See https://www.nationsreportcard.gov/ndecore/xplore/NDE.
the degree of progress students make as they move through the education system. Measures of achievement growth can support inferences about disparities in student progress: consequently, they can help users of the indicator system understand whether performance gaps that are observed when students start school increase or diminish as students are exposed to the programs and services that schools offer. This information can also shed light on the developmental phases during which students in different groups experience growth, stagnation, or regression in their skills.
It is important to point out that “growth” in this context does not simply refer to a change in scores, but instead encompasses a range of models that shed light on how performance of a student or group of students at one time compares to performance at a previous time (Castellano and Ho, 2013; Data Quality Campaign, 2019).15 Growth models can be calculated on the basis of changes in individual students’ performance or on changes in performance of an aggregate, such as a school.16
Most states have incorporated growth measures as part of their accountability indicators for ESSA (Data Quality Campaign, 2019). Published data on group differences in growth are less widely available than data on differences in average test scores. An example of such data is provided in a 2012 study by ACT that examined value-added achievement scores as well as simple change scores between 8th and 12th grades for students taking the ACT and EXPLORE assessments. Both approaches to measuring growth indicated that black and Hispanic students experienced less growth than white and Asian students.
___________________
15 See https://scholar.harvard.edu/files/andrewho/files/a_pracitioners_guide_to_growth_models.pdf.
16 The decision about what type of growth model to use needs to be informed by the features of the test and the inferences that users intend to make. For example, some tests use a vertical scale that allows for the calculation of simple change scores that can be loosely interpreted as indicators of the magnitude of student achievement growth, but tests that do not have a vertical scale cannot support this type of metric. Many growth models that are used for large-scale reporting, such as in-state accountability systems, rely on complex multivariate models (e.g., value-added models) or on conditional status models (e.g., student growth percentiles). Both models attempt to provide an indicator of how students or schools are performing relative to where they started out, but they do not measure “growth” directly.
Proposed Measures for Indicator 5
After considering the relative benefits of the different types of achievement metrics discussed above, the committee concluded that indicators of equity in test performance should include two metrics: (1) average scale scores on measures of achievement in grades 4, 8, and one high school grade for math, English language arts, and the sciences; and (2) measures of achievement growth, using student-level data if possible, in math and English language arts for students in grades 4 through 8. Together, these two types of measures would provide valuable information about students at a given time, and how their performance changes as they move through the education system. Both are important from an equity perspective. The proposed metrics do not cover every subject and grade level that might be of interest, but they are likely to be the most feasible given the state and national testing regimes that are in place, and they provide evidence of student performance at several key milestones.
DOMAIN C: EDUCATIONAL ATTAINMENT
Education is a critically important way for individuals to pursue their goals in life. With a high-quality education, individuals are better prepared to choose a path toward productive and purposeful adulthood, whether that path is 2- or 4-year college, the labor force, or the armed forces. Collectively, a high-quality education for all means better informed and more productive citizens, which has consequences for the overall economic, physical, and civic health and well-being of the country. Research consistently shows between-group differences in educational attainment related to people’s race, ethnicity, and gender (see Table 4-2).
Decades of research and data unequivocally show that the more education people have, the better off they are financially, emotionally, and physically. Higher levels of educational attainment are associated with higher salaries, job satisfaction, job security, and job benefits, all of which provide individuals with more economic freedom of choice. Educational attainment also is associated with a range of positive health behaviors and outcomes. At lower levels of educational attainment, these benefits decrease. For individuals who do not earn a high school diploma, the economic, social, and health consequences are especially severe (Currie, 2009; Cutler and Lleras-Muney, 2006; Day and Newburger, 2002; Harlow, 2003; Heckman and LaFontaine, 2010; Sum et al., 2009; U.S. Department of Labor, 2013a; Wong et al., 2002).
If educational attainment opens the door to a better life, then opportunities for educational attainment must be equally available to all students. Given the lifelong benefits that accrue with increasing levels of education,
| High School Graduation or More | Some College or More | Associate’s Degree or More | Bachelor’s Degree or More | Advanced Degree or More | |
|---|---|---|---|---|---|
| Population 25 and Older | 88.4 | 58.9 | 42.3 | 32.5 | 12.0 |
| Race and Ethnicity | |||||
| White Alone | 88.8 | 59.2 | 42.8 | 32.8 | 12.1 |
| Non-Hispanic White Alone | 93.3 | 63.8 | 46.9 | 36.2 | 13.5 |
| Black Alone | 87.0 | 52.9 | 32.4 | 22.5 | 8.2 |
| Asian Alone | 89.1 | 70.0 | 60.4 | 53.9 | 21.4 |
| Hispanic (of Any Race) | 66.7 | 36.8 | 22.7 | 15.5 | 4.7 |
| Nativity Status | |||||
| Native Born | 91.8 | 61.3 | 43.3 | 32.7 | 11.9 |
| Foreign Born | 72.0 | 47.6 | 37.6 | 31.4 | 12.5 |
SOURCE: Ryan and Bauman (2016, p. 2); data from the 2015 Current Population Survey.
this committee’s aspiration is for all students to have the opportunity to earn a 2- or 4-year college degree. This goal includes high-school graduation, readiness for postsecondary education, and postsecondary matriculation and completion. Because postsecondary persistence and completion are beyond the scope of this report, our indicators are focused on readiness for the transition to 2- or 4-year postsecondary education. However, our intent is not to diminish the importance of completing college, nor to ignore the sizable between-group differences in college enrollment, persistence, and completion rates (The Pell Institute for the Study of Equal Opportunity in Higher Education, 2017). Instead, our focus is on what the K–12 education system can monitor and act on to increase equity in postsecondary readiness and matriculation, which may help to improve equity in educational attainment.
Indicator 6: Disparities in On-Time Graduation
Graduating from high school on time and with a diploma remains one of the most critical educational objectives. It also paves the way to a multitude of better life outcomes, including the likelihood of attending college (Belfield and Levin, 2007; Oreopoulos and Salvanes, 2011; Rumberger, 2011).
The economic costs of dropping out of high school are steep and have become worse over the past 30 years, with dropouts earning dramatically less income and being more likely to experience unemployment than high school graduates (Day and Newburger, 2002; Heckman and LaFontaine, 2007; Sum et al., 2009). Dropouts also have a much higher risk than high school graduates of incarceration (Harlow, 2003; Sum et al., 2009), and they are more likely to engage in a range of behaviors that endanger their health (Centers for Disease Control and Prevention, 2008; Cutler and Lleras-Muney, 2006; Manlove, 1998; McLanahan, 2009; Pleis and Lucas, 2009). As a result, dropouts typically live shorter, less healthy lives than high school graduates (Currie, 2009; Cutler and Lleras-Muney, 2006; Wong et al., 2002).
The standard for measuring graduation rates is the adjusted cohort graduation rate (ACGR). The ACGR represents the percentage of entering 9th-grade students who earn a regular diploma within 4 years. The ACGR is based on individual-level, longitudinal student records that produce an authentic measure of the percentage of students who graduate. Because the records are based on individual-level data, ACGRs can be disaggregated to enable comparisons among different groups of students across schools, districts, and states and across time. As a result, they are very useful for research, policy, and accountability decisions (National Research Council, 2011, p. 112).
Though smaller than in the past, disparities in high school graduation rates by racial, ethnic, and other demographic factors remain substantial. For 2015–2016, McFarland et al. (2018, p. 130, Fig. 2) report the following:
- For race and ethnicity, the rate was highest for Asian/Pacific Islander students (91%) and white students (88%) and lowest for Hispanic students (79%), black students (76%), and American Indian/Alaska Native students (72%).
- The rate was 67 percent for students with limited English proficiency.
- The rate was 66 percent for students with disabilities.
- The rate was 78 percent for economically disadvantaged students.
Proposed Measures for Indicator 6
The adjusted cohort graduation rate can be used to measure on-time graduation.
Indicator 7: Disparities in Postsecondary Readiness
Of students who completed high school in 2016, 70 percent enrolled in college immediately following graduation, with 24 percent enrolling in 2-year colleges and 46 percent enrolling in 4-year colleges (McFarland et al., 2018, pp. 150-153). Looking at group differences, these data show:
- Asians have the highest college enrollment rate, at 87 percent.
- For other racial and ethnic groups, 71 percent of white and Latino high school graduates and 56 percent of black graduates enrolled immediately in college.
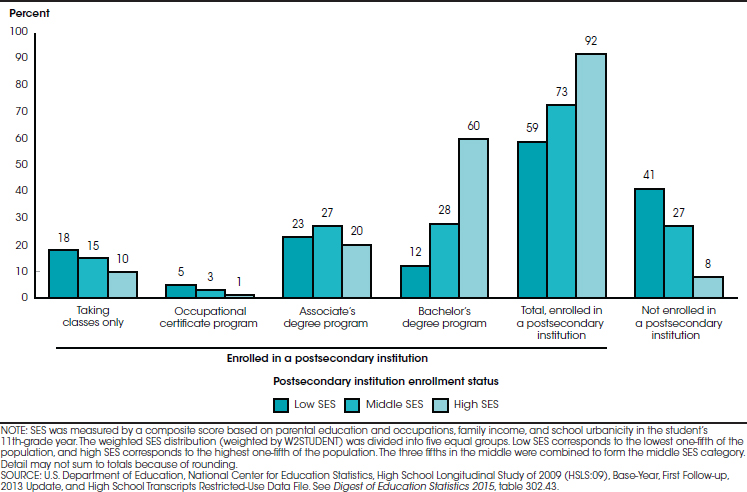
- Students from high-income families (those in the the top 20%) were much more likely to enroll in college than low-income students (those in the bottom 20%), 83 percent and 67 percent, respectively, while middle-income students were even slightly less likely to enroll than low-income students, 64 percent.
Despite widespread agreement about the need for the K–12 education system to focus on college readiness, there is no consensus on an evidence-based definition of college readiness, especially one that takes into account group differences in college completion. Broadly speaking, similar to the definition used by Conley (2007), this committee considers college readiness to be a student’s preparedness to enroll in the degree-granting institution of their choice (2- or 4-year) without the need for remedial courses, to persist, and, ultimately, to earn a degree. Consistent with this definition, indicators of college readiness ideally should correspond to three stages of college: enrollment, persistence and first-year GPAs, and completion.
One set of college readiness metrics focuses on academic preparation, including students’ test scores, GPAs, and advanced coursework (Adelman and Taylor, 1997; Glancy et al., 2014). Between-group differences along these dimensions are relatively straightforward to measure and have been well documented: they are discussed under Domain 2 (above) and Domain 6 (in Chapter 5). Among these indicators of academic readiness, unweighted high school GPA has the strongest evidence base as an indicator of readiness for college enrollment, college grades, persistence, and completion (Allensworth and Clark, 2018; Bowen, Chingos, and McPherson, 2009; Camara and Echternacht, 2000; Geiser and Santelices, 2007; Geiser and Studley, 2002; Roderick, Nagaoka, and Allensworth, 2006).
Focusing solely on academics, however, “masks the complexity of what it means to be ready to enroll and succeed in college and how [that readiness might differ] by student background and institutional characteristics” (Nagaoka, 2018, p. 2). Increasingly, research on what causes students to
struggle or succeed in college has shown that readiness encompasses more than academic achievement (Braxton, 2000; Conley et al., 2014; Conley and French, 2014; Duckworth et al., 2007). Knowledge about college is another factor that influences college readiness, persistence, and completion. This knowledge includes an understanding of the logistics and processes (e.g., managing the application process, choosing the right college, and securing financial aid) and capabilities that facilitate social and academic success in college, such as having a growth mindset, self-regulation, social awareness, and a sense of belonging (Nagaoka, 2018). This suite of capabilities is especially important for students who come from families without college backgrounds.
In U.S. society, college knowledge as defined in these ways is unevenly distributed and varies by students’ backgrounds and school environment (Conley, 2008). Without intervention, a lack of college knowledge “can discourage . . . and suppress the college aspirations of students, particularly first-generation college students, and students from racial/ethnic backgrounds who often find the college environment very different from their home communities” (Nagaoka, 2018, pp. 6-7).
One aspect of college knowledge, engagement in the college application process, is a strong predictor of college enrollment, particularly for low-income, minority students (Manski and Wise, 1983; Pallais and Turner, 2006; Plank, Deluca, and Estacion, 2008). It also shapes how students seek financial aid and pay for college. Applying for financial aid, particularly for low-income students, has been shown to predict enrollment in college (Lauff and Ingels, 2013; Roderick et al., 2008).
As a part of supporting the college choice and enrollment processes, it is possible to develop data systems that track students’ progress on critical milestones that draw on college knowledge. These milestones include data on whether and where students submitted college applications and whether they successfully completed the Free Application for Federal Student Aid (FAFSA). Currently, some districts and states collect these types of information, and state-level FASFA completion data are available.17 Schools should be cultivating and tracking other aspects of college knowledge, but those dimensions are not yet recommended for inclusion in a system of educational equity indicators because their measures are not well developed.
The committee also concludes it is important to track the paths that graduates pursue after they leave high school, including 2-year and 4-year programs, the military, employment, and unemployment. Even among high school graduates, there are large disparities in the subsequent paths chosen by students from various groups. These paths reflect different aspects of
___________________
17 Information about FAFSA tracking can be found at https://www.collegeboard.org/membership/all-access/financial-aid/fafsa-tracking-pathway-college-affordability-and-student-access.
readiness and can lead to vastly different labor market and other long-term postsecondary outcomes. Gaps in pursuit of these outcomes can contribute to gaps in economic well-being of these groups as they become adults. The most fundamental construct to track is whether students are enrolled in any type of college at all (as opposed to entering the workforce or the military).
Figures 4-1 and 4-2 show the differences in postsecondary enrollment for students grouped by race and ethnicity and by SES, respectively.
Proposed Measures for Indicator 7
Postsecondary readiness can be measured by enrollment in higher education.
REVIEW OF EXISTING DATA SOURCES AND PUBLICATIONS
A key part of the committee’s work was to investigate the potential usefulness of existing data systems and indicator reports for our proposed indicator set. Box 4-1 shows the criteria we used. Overall, although there is a wealth of information on pre-K to grade 12 education, the existing data and reports are not sufficient for the set of educational equity indicators as we have conceptualized them. Relevant information is scattered across multiple databases, which define some indicators and measure some constructs in different ways, do not provide any measures for some constructs, vary in data collection procedures, frequency, geographic detail, and coverage of student groups of interest, and are accessible through different agencies and organizations.
Tables 4-3, 4-4, and 4-5 summarize the potential data sources for each of the seven indicators and specific constructs for each indicator that we propose for Domains A, B, and C, respectively. The tables also summarize the extent to which data are ready to develop specific measures of each construct, and if not ready, what is needed. These tables draw on the information on existing data systems in Appendix A, on existing publications that include indicators of education equity in Appendix B, and on our assessment of data and methodological challenges and opportunities for educational equity indicators in Appendix C.
For these domains and indicators, the constructs and measures used generally pertain to students, categorized by groups of interest at the specific level of aggregation (e.g., school, school district, or state)—for example, the percentage of students who are chronically absent, separately for girls and boys. Note that immigration status of students is generally not available and that the measure of poverty status for students, if available, is usually in terms of whether the student is eligible for free or reduced-price school
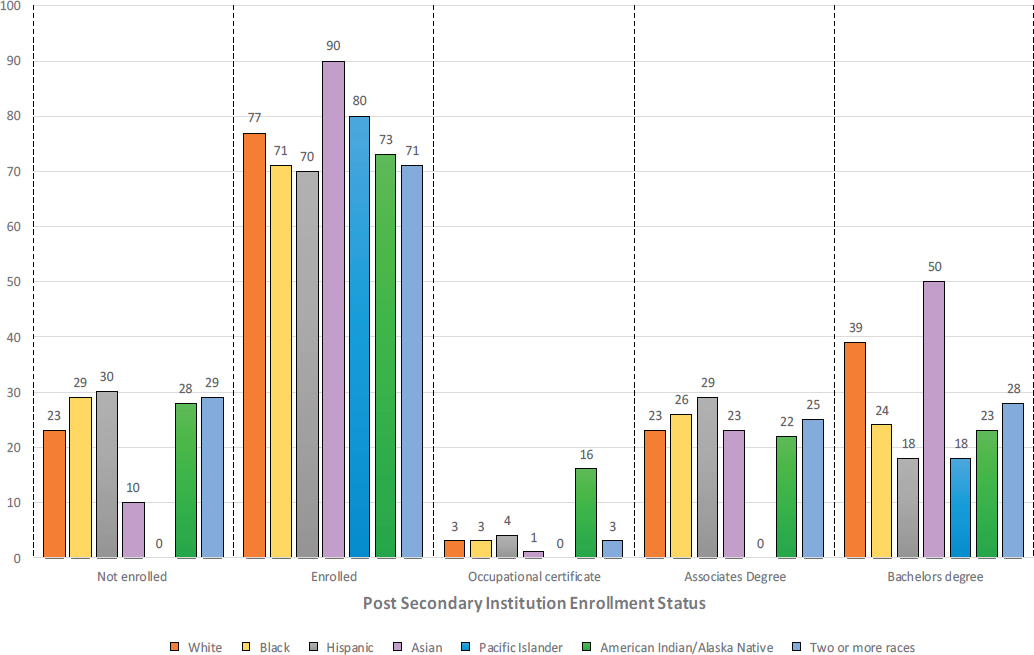
SOURCE: Kena et al. (2016, p. 18).
lunch. As discussed in Appendix C, this measure is less and less appropriate as a measure of poverty status, so work will be needed to develop an appropriate measure from data that are feasible to collect.
TABLE 4-3 Potential Data Sources and Measures for Domain A, Kindergarten Readiness
| Constructs | Source (Characteristics) |
|---|---|
| Indicator 1: Disparities in Academic Readiness | |
| Reading/Literacy Skills Numeracy/Math Skills |
Source: NCES ECLS-K:2011 Frequency: One time Geographic detail: Nation (sample is too small for finer detail) Student group detail: Race/ethnicity (based on parents), gender, whether English spoken at home, whether family received public assistance Possible measures: Average scale score or percentage of students within specified range of average on reading and math assessments conducted at beginning of kindergarten school year Future potential: Use tested assessments in ECLS-K:2011 to develop assessments that are age appropriate and feasible for schools to administer at scale, nationwide and annually |
| Indicator 2: Disparities in Self-Regulation and Attention Skills | |
| Self-Regulation Skills Attention Skills |
Source: NCES ECLS-K:2011 Frequency: One time Geographic detail: Nation (see Indicator 1, above) Student group detail: Same as Indicator 1, above Possible measures: Average scale scores on direct assessments of social skills and learning behaviors, or on teachers’ assessments of same, conducted after first month of kindergarten Future potential: See Indicator 1, above, but the road to feasible, streamlined assessments for nationwide, annual use is likely even more challenging, given the need for observational data |
NOTES: ECLS-K, Early Childhood Longitudinal Survey-Kindergarten; NCES, National Center for Education Statistics.
TABLE 4-4 Potential Data Sources and Measures for Domain B, K–12 Learning and Engagement
| Constructs | Source (Characteristics) |
|---|---|
| Indicator 3: Disparities in Engagement in Schooling | |
| Attendance/Absenteeism (a proxy construct for engagement or lack of engagement) | Source: EDFacts (as part of ESSA reporting requirements) Frequency: Annual Geographic detail: Nation, states, districts, schools Student group detail: Race/ethnicity, gender, English-language status, disability status Grade/level detail: Elementary, middle, secondary, other; schools can be classified by percent students eligible for free or reduced-price lunch Possible measures: Percent students chronically absent above a specified threshold (10 percent or more school days in EDFacts) |
| Indicator 4: Disparities in Performance on Coursework | |
| Success in Classes (record of passing courses) Accumulating Credits (being on track to graduate) Grades, GPAs |
Source: Transcript studies conducted in NAEP and NCES longitudinal surveys Frequency: Periodic Geographic detail: Nation (samples too small for finer detail) Student group detail: Race/ethnicity, gender, English-language status, disability status, eligible/not eligible for free or reduced-price lunch Grade/level detail: Transcripts collected at end of high school Possible measures: Percent high school seniors above a specified threshold passing all courses; percent seniors above a specified threshold having enough credits to graduate; average GPA for seniors Future potential: Construct from SLDS as more states develop them in a comparable manner and provide access for statistical purposes Comment: The CRDC has students passing algebra I in grades 8 and 9-10 for nation, states, districts, and schools for student groups defined by race/ethnicity, gender, English-language status, and disability status, collected biannually |
| Constructs | Source (Characteristics) |
|---|---|
| Indicator 5: Disparities in Performance on Tests | |
| Achievement in Reading, Math, and Science Learning Growth in Reading, Math, and Science Achievement |
Source (1): Main NAEP Frequency: Biannual for reading and math (every 4 years for 12th graders); periodically for science Geographic detail: Nation, states, some large city districts Student group detail: Race/ethnicity, gender, eligible/not eligible for free and reduced-price lunch Grade/level detail: 4th, 8th, 12th grades (4th, 8th grades for science) Possible measures: Percent students achieving at or above proficient level, or average scale scores; average of per student change in scale scores over time Source (2): EDFacts (as part of ESSA reporting requirements) Frequency: Annual Geographic detail: Nation, states, districts, schools Student group detail: Race/ethnicity, gender, English-language status, disability status, economically disadvantaged (typically eligible/not eligible for free or reduced- price lunch) Grade/level detail: Each grade from 3 to 8 and once in high school (reading and math); one grade in grades 3-5, 6-9, and 10-12 (science) Possible measures: Percent students achieving at or above a specified achievement level (e.g., the middle value of the levels, which may be from 3 to 6 in various states); percent increase in students achieving at or above a specified level Comment: States do not use the same assessments or the same number or definitions of achievement levels, so a method is needed to make results comparable—SEDA has developed correction factors based on NAEP (see Appendix C) |
NOTES: CRDC, Civil Rights Data Collection; ESSA, Every Student Succeeds Act of 2015; GPA, grade point average; NAEP, National Assessment of Educational Progress; NCES, National Center for Education Statistics; SEDA, Stanford Education Data Archive; SLDS, Statewide Longitudinal Data System.
TABLE 4-5 Potential Data Sources and Measures for Domain C, Educational Attainment
| Constructs | Source (Characteristics) |
|---|---|
| Indicator 6: Disparities in On-Time Graduation | |
| On-Time Graduation | Source: EDFacts (as part of ESSA reporting requirements) Frequency: Annual Geographic detail: Nation, states, districts, high schools High school student group detail: Race/ethnicity, gender, English-language status, disability status, economically disadvantaged (typically eligible/not eligible for free or reduced-price lunch) Possible measure: Adjusted Cohort Graduation Rate (ACGR) Comment: The ACGR is widely accepted for measuring on-time high-school graduation (see Appendix C) |
| Indicator 7: Disparities in Postsecondary Readiness | |
| Enrollment in College, Entry into the Workforce, or Enlistment in the military (after completion of high school) | Source: American Community Survey (ACS) Frequency: Annual Geographic detail: Nation, states, districts (5-year averages) High school graduate group detail: Race/ethnicity, gender, English-language status (based on language spoken in the home), disability status (limited number of conditions), poverty status Possible measures: Percent high school graduates ages, say, 18-21, in college, the workforce, or the military; percent all young adults ages, say, 18-21, in college, the workforce, or the military (this measure includes high school dropouts in the denominator) Future potential: Construct from SLDS as more states develop them in a comparable manner, follow graduates beyond high school, and provide access for statistical purposes Comment: ACS data cannot readily be linked to the graduate or young adult’s school district (some linkage could be possible with a question on whether one lived in the same house a year ago); the SLDS would obviate this problem to the extent that graduates can be followed up |
NOTES: ESSA, Every Student Succeeds Act of 2015; SLDS, Statewide Longitudinal Data System.


