
2
Metrics for Understanding Food Loss and Waste
The first session of the workshop focused on what ultimately emerged as a theme of the workshop and of efforts to reduce food loss and waste more broadly, namely, as stated by moderator Prabhu Pingali, “what you measure is what you can manage.” Three methods of measurement were highlighted, including the Global Food Loss Index; recent efforts by the U.S. Department of Agriculture; and a new tool, the Food Loss + Waste Protocol, a multi-stakeholder effort lead by the World Resources Institute. Dr. Pingali, professor in the Charles H. Dyson School of Applied Economics and Management and founding director of the Tata-Cornell Agriculture and Nutrition Initiative at Cornell University, pointed out that the measures also show how the food loss and waste situation differs when looking at developed or developing countries.
FOOD LOSS MEASURES: STATE OF KNOWLEDGE AND KNOWN CHALLENGES
Carola Fabi, statistician at the Food and Agriculture Organization of the United Nations (FAO), discussed the current data situation, including gaps in the data, the challenges and limitations in improving data metrics, and possible improvements on a global level. She described efforts to improve understanding of what lies behind the FAO’s often-cited 2011 estimate that one-third of food produced globally is lost or wasted.
Global Monitoring
For global or even regional monitoring, data are needed by country, by commodity, by stage along the supply chain, and over time, Ms. Fabi explained. Most available information is based on expert opinion and old technical factors. Even if percentages of food lost and wasted remain fixed, the quantity increases when more food is produced to feed a growing population. Collecting more granular data, however necessary, is costly and complex. Data on economic and quality losses related to food safety and nutrition are also needed.
The Food and Agriculture Organization Statistical Databases (FAOSTAT) are the only global databases to date that collect loss data for every country and every possible commodity at different stages of the value chain; however, only 4.4 percent of loss data are reported. The FAO is tackling data scarcity by building an interactive query database that uses countries’ official reporting, the scientific literature, and other sources. It is difficult to develop a consistent methodology when looking at different countries’ dominant methods of storage, transportation, and other factors. Value chains are also complex and interact with each other. To improve the evidence base and data underneath estimates, the FAO has produced a set of guidelines on the measurement of harvest and post-harvest losses for all the economy groups along the value chain.1 Ms. Fabi stressed that no one size fits all due to different circumstances across countries and that a range of statistical tools and methods are needed to gather data on losses and waste. Solutions include partnerships with the private sector, especially food processing industries, and a newly developed loss imputation model.
Food Loss and Waste and SDG 12.3
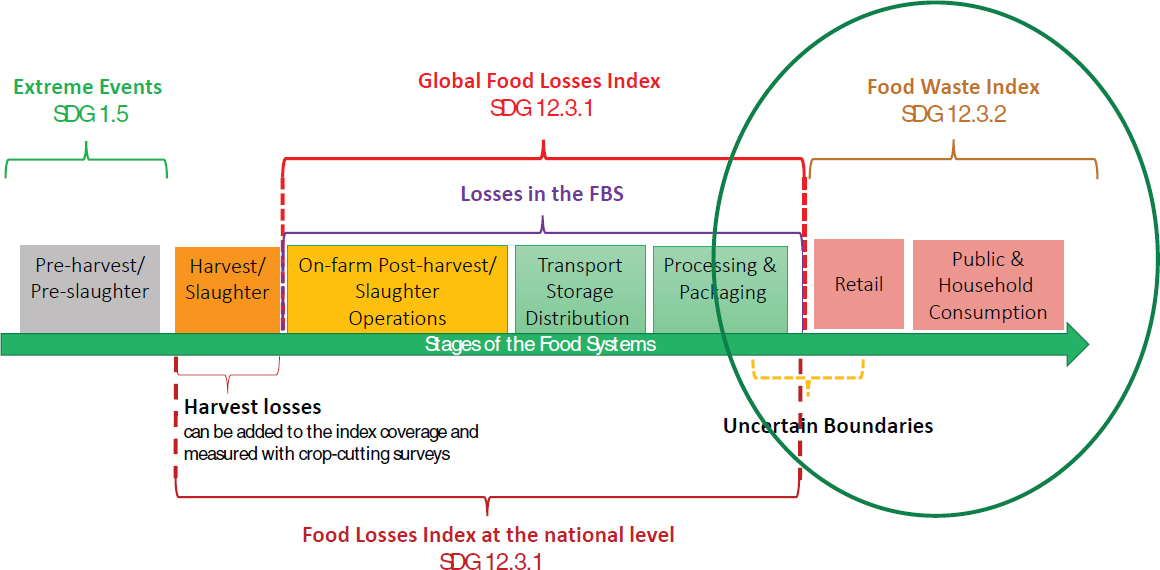
All these data feed into Sustainable Development Goal (SDG) 12.3 on the reduction of food losses and waste. The SDG target has two elements: 12.3.1 covers food and post-harvest losses along the supply chain (measured
___________________
1 Global Strategy to Improve Agricultural and Rural Statistics. 2018. Guidelines on the measurement of harvest and post-harvest losses: Recommendations on the design of a harvest and post-harvest loss statistics system for food grains (cereals and pulses). Rome, Italy: Food and Agriculture Organization of the United Nations Statistics Division. Available at http://gsars.org/wp-content/uploads/2018/06/GS-PHL-GUIDELINES-completo-09.pdf. The guidelines present cost-effective approaches to measure food grain losses that could be used by developing countries to generate timely and quality data.
by the Food Loss Index, with the FAO as the lead),2 and 12.3.2 covers food waste at the retailer and consumer level (measured by the Food Waste Index, with the United Nations Environment Programme as the lead) (Figure 2-3). These two elements relate to different policy concerns. They focus on different aspects of the value chain and require different indicators and metrics, Ms. Fabi stated, although reality is more complex than a linear supply chain.
Ms. Fabi noted that it is not feasible to ask countries to measure losses along the supply chain for all commodities. It is also not feasible to use a common set of goods for global monitoring because the same commodities are not consumed universally. There is a trade-off between relevance at the country level and comparability across countries. Therefore, the Food Loss Index narrows the focus by building a “basket” under five food groups: (1) cereals and pulses; (2) fruits and vegetables; (3) root, tuber, and oil-bearing crops; (4) animal products, including fish and fish products; and (5) other products, such as stimulants, spices, and sugars. Countries select two well-used commodities within each group to monitor along the various stages of the value chain and to understand the interactions between the various stages.
Developing definitions for the SDG indicators that are both measurable and measured has been a long process. Ms. Fabi stated that the FAO definition for food loss is as follows:3
Crop and livestock product losses cover all quantity losses along the supply chain for all utilizations (food, feed, seed, industrial, other), up to but not including the retail/consumer level. Losses of the commodity as a whole (including edible and non-edible parts) and losses, direct or indirect, that occur during storage, transportation, and processing, also of relevant imported quantities, are therefore all included.
She pointed to several salient parts of the definition, including the focus on quantities that leave the chain for any reason and cover edible and
___________________
2 Additional information about the Global Food Loss Index, including its formula and compilation as well as the loss imputation model, can be found in Fabi, C., and A. English. 2018. Methodological proposal for monitoring SDG Target 12.3. The Global Food Loss Index design, data collection methods and challenges. FAO: Rome, Italy. Available at http://www.fao.org/3/CA2640EN/ca2640en.pdf.
3 Fabi, C., and A. English. 2018. SDG indicators under FAO custodianship: SDG 12.3.1 – Global Food Loss Index. Available at http://www.fao.org/3/CA2725EN/ca2725en.pdf.
non-edible parts. Non-food utilizations (e.g., for animal feed or biofuel) are not considered losses under this definition.4 Waste occurring on the supply side is measured under losses, and all losses are tracked by commodity starting at the production site. Losses are counted irrespective of whether the cause was intentional (e.g., attributed to inefficiencies in the value chain) or not intentional. These elements of the definition will be examined further in the future.
Improvements and Challenges
The overall improvement on a global level, Ms. Fabi said, is to build on country practice and experience. The FAO is focusing for now on fewer commodities and on measurements at critical loss points and will expand from there. FAO is working with industries, producers’ associations, and others to gather data and choosing the most effective collection methods depending on specific situations to make measurement less costly. FAO is also working with countries to fine-tune their loss imputation models. Ms. Fabi concluded by stating that it is critical to share information on losses and estimates to improve the evidence base and fill in data gaps.
USDA/ERS MEASUREMENT OF FOOD LOSS IN THE UNITED STATES
Jean Buzby, chief of the Diet, Safety, and Health Economics Branch at the USDA’s Economic Research Service (ERS), described how the ERS estimates food loss in the United States, how the estimates are used, and plans for developing better indicators of food loss by ERS and of food waste by the U.S. Environmental Protection Agency (EPA) (described more fully in Chapter 5). The definition of food loss used by ERS is “the edible amount of food, postharvest, that is available for human consumption but is not consumed for any reason.” She noted that it is broader than many other definitions and includes cooking losses and natural shrinkage; loss from mold, pests, or inadequate climate control; and food waste (such as food left on people’s plates).
___________________
4 Ms. Fabi stated that this is important because some definitional frameworks consider these as food loss or waste.
Data Series: Food Loss-Adjusted Food Availability
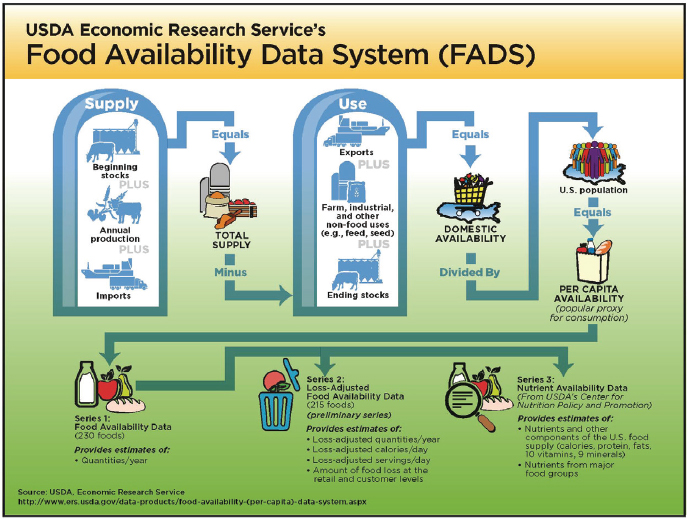
The ERS has a data series known as the Food Loss-Adjusted Food Availability (LAFA) series, as part of its Food Availability Data System (see Series 2 in Figure 2-1). While LAFA’s primary purpose is to provide a per-capita estimate of food availability in terms of amount, calories, and food pattern equivalents (i.e., “servings”), a secondary purpose is to provide estimates of food loss at the retail and consumer levels in the United States (which include food waste as described in the ERS definition above). These data are presented in terms of amount, calories, and value by retail price.
The data series tracks 215 commodities. Adjustments are made for losses at the primary, retail, and consumer levels. Using fresh apples as an example, the data track domestic production and add imports and beginning stocks, then subtract out exports and ending stocks. A per-capita quantity is derived by dividing the quantity by total U.S. population.
The big picture revealed by this data series is that the total amount of food loss in the United States is 133 billion pounds per year, worth an estimated $162 billion in terms of retail prices and equivalent to 141 trillion calories.5 On a per-capita basis, this represents 290 pounds of food worth about $370 per person per year. Collectively, 31 percent of food that is available for consumption goes uneaten: 10 percent at the retail level and 21 percent at the consumer level.
Looking at different foods, Dr. Buzby said that potatoes, tomatoes, and romaine and leaf lettuce have the highest quantity of losses, in part because they are among the most popular vegetables. Losses of other greens, such as mustard and turnip greens, are lower in quantity but higher percentage-wise, some approaching 60 percent.6 Grain products are mostly lost at the consumer level, while dairy products had the highest amount at the retail level.
___________________
5 Buzby, J., H. F. Wells, and J. Hyman. 2014. The estimated amount, value, and calories of postharvest food losses at the retail and consumer levels in the United States. Economic Information Bulletin Number 121. Washington, DC: Economic Research Service. Note: A new report released by ReFED after this workshop in November 2018 states, “U.S. consumers, businesses, and farms spend $218 billion a year, or 1.3% of GDP, growing, processing, transporting, and disposing food that is never eaten.” See ReFED. 2018. 2018 U.S. food waste investment report: Trends in private, public, and philanthropic capital. Available at https://www.refed.com/downloads/ReFED-2018-US-Food-Waste-Investment-Report.pdf.
6 Buzby, J. C., J. T. Bentley, B. Padera, C. Ammon, and J. Campuzano. 2015. Estimated fresh produce shrink and food loss in U.S. supermarkets. Agriculture 5(3):626-648.
SOURCE: Jean Buzby, Presentation, National Academies of Sciences, Engineering, and Medicine, October 17, 2018, Washington, DC. Also see https://www.ers.usda.gov/data-products/food-availability-per-capita-data-system.
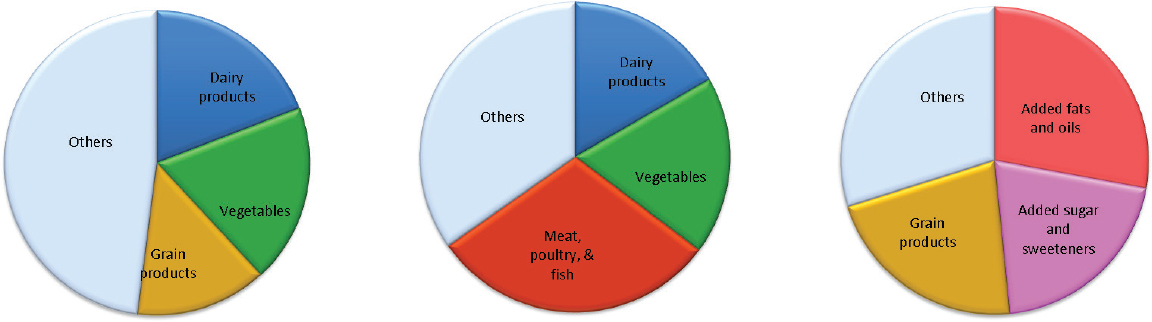
The top three food groups affected by food loss vary when measured by amount, retail value, or calories (Figure 2-2). For example, in terms of amount or weight, vegetables have the largest single share, with dairy products and grains also significant contributors. In terms of value or prices, meat, poultry, and fish represent the largest share because the cost per pound is relatively higher, while added fats and oils are dominant when measuring calories because of the higher caloric content per pound.
The ERS is working to improve underlying assumptions and documentation to develop better indicators. Efforts include an expert panel on technical questions and data gaps (see Box 2-1); updates of estimates using the Food Acquisition Purchase Survey (Food-APS); and improved retail loss factors. A recent contract signed with RTI International is designed to update retail loss factors for many of the 215 commodities.
Dr. Buzby briefly explained the EPA’s methodology, which provides an annual estimate of food waste with a primary focus on municipal solid
SOURCE: Jean Buzby, Presentation, National Academies of Sciences, Engineering, and Medicine, October 17, 2018, Washington, DC, based on USDA Economic Research Service Loss-Adjusted Food Availability data.
waste. It currently covers residential, commercial, and institutional sources, but not industrial sources such as processing and manufacturing, although revisions are underway. Federal data sources do not estimate food loss on the field, although an ERS study has begun that looks at farm-to-retail food loss for produce.
FOOD LOSS + WASTE PROTOCOL
The final presenter in this session, Kai Robertson, lead advisor for the Food Loss and Waste Protocol representing the World Resources Institute, described the Protocol and how it can be used. First, she underscored that food loss and waste is a multidimensional problem encompassing different definitions, data, and methods. In 2013, the World Resources Institute published a white paper on this problem, “Reducing Food Loss and Waste,” in which developing a Food Loss + Waste (FLW) Protocol was among the recommendations. An FLW Protocol Steering Committee was therefore convened in 2013, and based on input from more than 200 stakeholders around the world representing diverse interests, the voluntary Food Loss
and Waste Accounting and Reporting Standard was published in 2016.7 It contains common language and practical guidance, including how to make comparisons across inventories to assist organizations in making better decisions. An increasing number of companies and organizations, including Kellogg’s, Tesco, Ahold Delhaize, Nestle, and the Waste and Resources Action Programme, are measuring and reporting on food loss and waste by using the FLW Standard.
Measurement can be used to track progress, identify opportunities, and serve as an act of prevention. Even without perfect data, Ms. Robertson said, “measurement gets us along the path to reduction.” The FLW Standard encompasses 10 steps to measurement:
- Define goals;
- Review accounting and reporting principles;
- Establish scope;
- Decide how to quantify food loss and waste;
- Gather and analyze data;
- Calculate inventory results;
- Assess uncertainty;
- Perform a review (optional);
- Report food loss and waste inventory; and
- Set target (optional) and track over time.
Throughout the process, the emphasis is on an entity choosing its goals and other methods while being transparent about the decisions.
Ms. Robertson noted that organizations’ and companies’ goals around food loss and waste can differ. Examples include the goals embodied in SDG 12.3, the Food Waste Resolution developed by the Consumer Goods Forum, and companies’ own targets. Establishing the scope of what is measured should be based on the foundation of a common language. As defined in the FLW Standard, food includes plants, animals, and fungi that are grown or reared, as well as associated inedible parts. In some cases, determining what is inedible for humans to eat is culturally subjective. Unconsumed food can also be diverted to many possible destinations. To accommodate these differences, the FLW Standard allows an entity to select
___________________
7 World Resources Institute. 2016. Food Loss and Waste Accounting and Reporting Standard. Washington, DC. Available at https://www.wri.org/sites/default/files/REP_FLW_Standard.pdf.
which combination of material types and destinations it considers as “food loss and waste.”
Understanding these differences sheds light on why different entities have developed different numbers, which Ms. Robertson said can move decisions forward. The Champions 12.3 Coalition interpreted the scope of SDG 12.3 to include both the food intended for consumption and the inedible parts of food (e.g., bones, rinds, pits/stones) as loss or waste and to exclude the diversion of food to animal feed and biomaterials processing where material is converted into industrial uses (see also presentation by Carola Fabi, Chapter 2).8 There is a hierarchy of destinations, with food for people (e.g., through food donations) as the first priority.
She also briefly described the Food Waste Index, which is still in draft form (Figure 2-3). Because no single method will work for all countries, three approaches are being refined and tested to provide data for the index:
- Modeling, which provides acceptable data quality and is feasible for most countries, would subtract consumption from supply using widely available collected data.
- Proportion of total waste, which provides better data quality and is feasibly tracked by the majority of countries, would apply a percentage to an estimate of total municipal waste generation that is food and the associated inedible parts, using data from moderately frequent studies.
- Supply chain stage-specific studies, which would provide the best data quality but is feasible for only some countries, would collect data from primary studies of each relevant supply chain stage.
The key is to make clear what is in and what is outside of the scope being measured. “At the end of the day,” she said, “We will have better clarity about data and a richer dataset over the next several years.” Ms. Robertson shared some examples of efforts from the private sector, including Ahold Delahaize, Tesco, and Campbell’s.
A new tool, the Food Loss and Waste Value Calculator, estimates the value of food loss and waste in terms of nutritional and environmental
___________________
8 Also see Champions 12.3. 2017. Guidance on interpreting Sustainable Development Goal Target 12.3. Available at http://flwprotocol.org/wp-content/uploads/2017/08/Champions-12.3-Guidance-on-Interpreting-SDG-Target-12.3.pdf.
SOURCE: Fabi, C., and A. English. 2018. SDG 12.3.1: Global Food Loss Index. Rome, Italy: Food and Agriculture Organization of the United Nations. Reproduced with permission.
impacts. A website and other resources provide information on how to use the tool to gain insights.9
DISCUSSION HIGHLIGHTS
A participant urged that efforts be made to determine the quality of the food lost in terms of nutritional value, as well as the environmental impacts of how the food was produced in addition to the economic impacts. He acknowledged that this complicates the data collection but that it could provide data more useful for policy making. Ms. Robertson said the Food Loss and Waste Standard focuses on quantity, but an appendix and the Food Value Calculator try to address other aspects such as nutritional value and environmental impact. Dr. Buzby said that the LAFA system does not measure food quality, but she is open to thinking about how that could be done. It is expensive and difficult to collect nationally representative data on underlying loss conversion factors, and this underscores the need to prioritize research efforts.
Another participant asked about the need for a common definition of food loss and waste. Ms. Robertson said that different definitions of these terms are driven by different organizations’ different objectives. Ms. Fabi observed that some countries had already developed their own definitions prior to the establishment of the SDGs. Rather than making a country change its definition and introduce breaks in its dataset, she suggested letting different definitions coexist, understanding what they are, and trying to reconcile them with the data as much as possible afterwards.
___________________
9 Additional information about the Food Loss and Waste Value Calculator is available at http://flwprotocol.org/why-measure/food-loss-and-waste-value-calculator.
This page intentionally left blank.


