
4
Illustrative Model of Decision Tools
This chapter provides an example model and analysis for supporting decision making around coral intervention strategies. The committee’s goal in providing this example is to illustrate the questions faced during the process of creating a modeling framework to inform decision making and the types of insights that can be gained. The committee uses a coral reef community model to simulate the effects of two example interventions on a simplified coral reef system: assisted gene flow and atmospheric shading. As part of this analysis, the committee illustrates the use of Bayesian networks to evaluate the impact of the interventions on management objectives in a probabilistic manner, represented by a range of model outcomes resulting from uncertainty around climate projections, intervention efficacy, and intervention risk. These efforts serve to exemplify the process described in Steps 2 and 3 in Chapter 3.
Because the committee’s simplified model is for illustration only, the specific example results and analyses are not designed for adoption. The process of selecting management objectives and selecting interventions of interest begins with stakeholder engagement as described as Step 1 in Chapter 3. This is beyond the committee’s purview because this involves extensive elicitation, consultation, and deliberation and must be done with attention to the specific environmental, ecological, economic, and cultural contexts of an individual location (e.g., Gregory et al., 2012). Without the consideration of this social and local decision context, as well as detailed site-specific environmental data, the committee cannot use or develop any model to advise on the implementation of one or a
combination of specific interventions. Additionally, evaluating all alternative interventions and their combinations for any real reef setting will be a computationally intensive effort (including more complex model structures to accurately represent each intervention) with many combinations of results to analyze. Instead, this illustration provides a concrete example of the construction of a decision support framework to analyze the risks and benefits of example interventions, evaluate the likelihood of achieving intervention goals under different scenarios, and communicate potential outcomes.
MODEL APPROACH
The committee constructed the simplest possible model that captures the coral reef dynamics relevant to two example interventions: assisted gene flow (the relocation of stress-tolerant—in this example, heat-resistant—corals within their range) and atmospheric shading (in this case through marine cloud brightening or marine sky brightening). The committee’s approach is to construct a general, “strategic” model appropriate for qualitative and comparative interpretation, as opposed to a realistic, “tactical” model appropriate for quantitatively precise predictions (May, 2001). As described in Step 2 in Chapter 3, any model used in a decision-making process would require (a) tailoring the model structure to the dynamics most important to the location and risks and benefits of the intervention(s) under consideration, and (b) basing model parameters on the local system. In addition, a tactical model and approach would require model validation as described in Chapter 3, such as by ground truthing model outputs against independent data (e.g., whether coral declines occur in observed bleaching events; Baskett et al., 2009). The committee did not undertake such validation here, but presents a more strategic approach for the purpose of illustration. The committee’s model serves as a communication tool to illustrate how the problem of identifying and choosing among restoration and intervention options to build reef resilience under climate change could significantly benefit from the use of quantitative models to inform the decision-making process. Quantitative models and associated analyses can open the door for reef managers and policy makers to assess and compare benefits and risks of available intervention options, and thereby make more informed strategy choices under uncertainty.
Biophysical Model
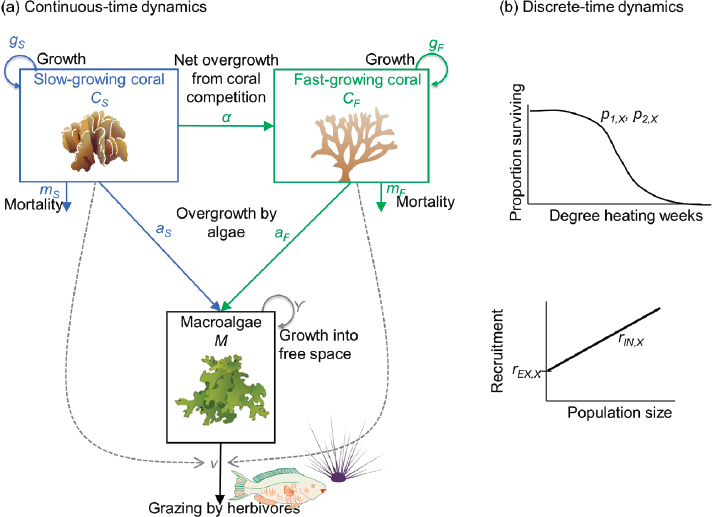
The committee developed a model that follows the dynamics (change over time) of the proportion of area covered by two functional groups of coral—fast-growing corals (such as branching corals) (CF) and
slow-growing corals (such as foliose corals or massive corals) (CS)—as well as by macroalgae (M) (see Figure 4.1). These focal variables provide the simplest possible representation of the committee’s chosen metric of intervention success: coral cover. The two broad categories of coral morphology represent extremes in the range of possible coral life history strategies and responses to thermal stress in a community (Darling et al., 2012; Loya et al., 2001) and a diversity in response strategies to disturbance among community members (high stress tolerance versus fast regrowth) can drive overall community resilience (Baskett et al., 2014). This representation assumes that many ecosystem services and values correlate positively with coral cover. The inclusion of two broad categories of morphological types can also provide initial insight into structural complexity that can be related to multiple reef functions (Graham and Nash, 2013). In addition, the focus on coral cover for simplicity ignores
ecological dimensions such as differences in growth rate, survival, reproductive output, and stress tolerance of coral recruits as compared to established corals (and other such differentiation in demography by coral stage or size). Inclusion of macroalgal dynamics allows for exploration of how local management of nutrient inputs and/or herbivorous fish affects macroalgae cover, which is likely to affect intervention success due to the added dynamic of competition with corals.
The proportion of cover of each coral population changes over time as a result of a set of dynamics (growth, baseline mortality, and competition) that happen continuously throughout the year and a set of discrete events (bleaching and recruitment) that happen once per year during the summer. Mathematically, these two sets of dynamics are represented with a pulse-impulsive or semidiscrete model structure, following Baskett et al. (2014) and Fabina et al. (2015). Thus, this representation captures bleaching mortality separate from background processes. The focal stressor is sea surface warming driven by climate change; for simplicity of this illustration, additional possible global-change-dependent stressors such as ocean acidification (OA) and stronger storms are ignored.
To model the continuous dynamics of growth, baseline mortality, and competition (see Figure 4.1a), the committee built on a commonly used framework by Mumby et al. (2007), which has been examined and extended for many studies (Anthony et al., 2011; Baskett et al., 2014; Blackwood et al., 2011, 2012; Fabina et al., 2015; Fung et al., 2011; McManus et al., 2018). Specifically, given the proportion of available habitat (P) (P = 1 for a pristine habitat and P < 1 with habitat destruction), each population grows into free space (P – CF – CS – M) at a rate (gX) for each coral (X) (X = F, fast-growing, or X = S, slow-growing) and a rate γ for macroalgae. Growth captures somatic growth processes that extend the proportion of area covered. In addition, the model includes competition as net overgrowth by the superior competitor of each pairwise interaction, where the fast-growing coral overgrows the slow-growing coral at a rate (α) and macroalgae overgrows both corals at a coral-specific rate (aX). Herbivorous fish graze on macroalgae at a baseline rate (v) without corals, and the grazing rate increases with increasing coral cover. Each coral also experiences background mortality at a rate (mX). Together, the mathematical representation of the continuous dynamics is:
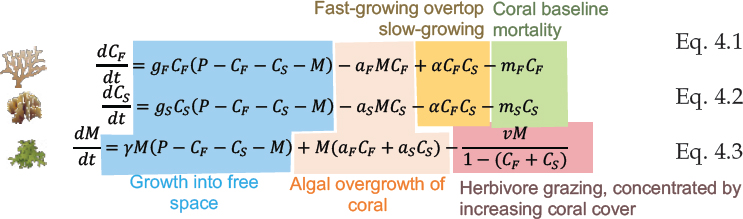
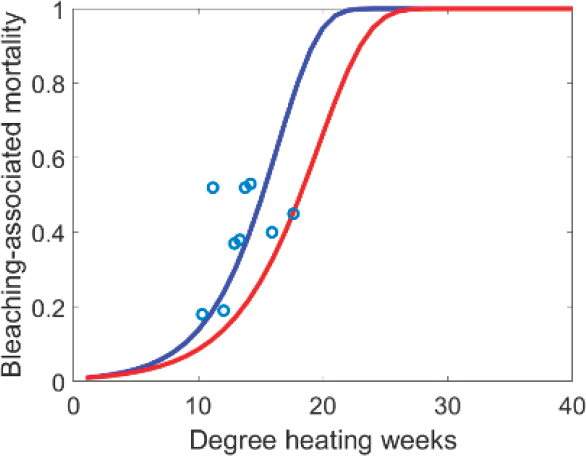
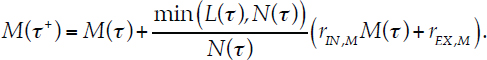
To model the discrete dynamics (see Figure 4.1b), each summer (t = τ), both bleaching mortality and recruitment occur as discrete events. The proportion of mortality due to bleaching is modeled as a function of predicted degree heating weeks (see section on “Natural Adaptation” for degree heating week [DHW] calculation). Annual bleaching-related mortality μX(τ) is assumed to follow a Gompertz cumulative distribution function (see Figure 4.2; Ricklefs and Scheuerlein, 2002) with coral-specific shape parameters p1,X and p2,X. Specifically, p1,X mainly influences the amount of coral mortality at low DHW values and p2,X mainly skews the curve to the right toward higher DHW, representative of higher thermal tolerance (see Figure 4.2). Then the proportion surviving bleaching hX(τ) = 1 − μX(τ) is
| hx (τ) = exp[−p1,X exp(p2,XDHW (τ) − 1)]. | Eq. 4.4 |
After bleaching mortality, the total area available for new recruits at time τ is the total area of hard substrate available for coral and algal colonization (P) minus the remaining cover from each population:
| L(τ) = P− M(τ) − hB(τ)CB(τ) − hF(τ)CF(τ). | Eq. 4.5 |
Each coral population receives new recruits through internal recruitment at a per-capita amount (proportion cover added) (rIN,X) and external recruitment at an amount (rEX,X). The external recruitment can provide initial insight into the role of connectivity between locations, but the focus on a single location does not explicitly account for how variability in conditions and climate impacts across locations might affect recruitment, including recruitment declines that might arise from anthropogenic impacts such as pollution and sedimentation as well as coral regional declines (Richmond et al., 2018). In addition, macroalgae receive a small amount of internal recruitment rIN,M based on the amount of macroalgal cover as might occur from spores and external recruitment rEX,M as might occur from spores and drift algae. The inclusion of external recruitment can allow both coral and macroalgae recovery from zero cover. Therefore, the total area potentially covered by all recruits is
| N(τ) = rIN,ShS(τ)CS(τ) + rEX,S + rIN,FhF(τ)CF(τ) + rEX,F + rIN,MM(τ) + rEX,M. | Eq. 4.6 |
If the total area covered by recruits N (τ) exceeds the total area available L(τ), then recruitment fills the remaining area available, with the relative proportion of recruits for each coral group held constant.
The cover for each coral group after both bleaching and recruitment is then
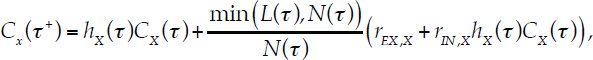 |
Eq. 4.7 |
and the macroalgal cover after recruitment is
 |
Eq. 4.8 |
Natural Adaptation
The extent to which the rate of natural adaptive processes (whether through acclimatization, phenotypic plasticity, and/or genetic adaptation) by corals can keep up with the rate of global warming has been the focus of numerous studies in the past two decades (e.g., Baker, 2003; Barshis et al., 2013; Fitt et al., 2001; Hughes et al., 2003; Pandolfi et al., 2011; Pratchett et al., 2013). Projections of coral reef persistence into the future under climate change without adaptation typically predict coral collapse regardless of future climate scenario (i.e., under committed climate change), while those that account for adaptation predict that coral persistence depends on climate scenario and the level of adaptive diversity in the population (Baskett et al., 2009; Bay et al., 2017; Donner, 2009; Logan et al., 2014). Specifically, adaptation at the intensities expected under typical population sizes and levels of natural selection often lead to coral persistence under more moderate but not more severe climate scenarios. In particular, the rate of climate change outpaces the rate of evolution under more severe scenarios (Baskett et al., 2009; Bay et al., 2017). Therefore, models that ignore the potential for natural adaptation bias their results toward the need for earlier and more significant intervention even under a moderate climate scenario. Likewise, models without adaptation are likely to be biased against the value of moderate interventions in supporting coral cover. In addition to avoiding this bias, accounting for natural adaptation allows a process to represent the benefit of interventions that accelerate adaptation, such as assisted gene flow.
In this model, the potential for natural adaptation is represented using “rolling” climatologies (Logan et al., 2014; see Box 4.1). The typical approach to predict bleaching, such as that done by the National Oceanic and Atmospheric Administration Coral Reef Watch program, is to calculate the cumulative heat stress above the mean summertime maximum temperature on a given reef. For example, Coral Reef Watch first calculates the mean maximum monthly (MMM) annual temperature climatology in a given reef over a fixed period of time (1985-1993) and then sums thermal anomalies above that climatology (e.g., anomalies 1°C above the MMM) over a 12-week period to calculate DHWs. Different amounts of DHWs are then used to predict real-time bleaching and mortality. The DHW concept has also been applied to monthly sea surface temperature outputs from global climate models to predict future bleaching rates (e.g., Donner et al., 2005). In this case, a degree heating month (DHM) calculation is used and then converted to the DHW index using a conversion factor of 4.3 (weeks per month; Donner et al., 2005). To simulate the possibility that corals can adapt or acclimatize to more recently experienced changes in temperature, a climatology can also be calculated based on a window that “rolls” in time relative to the recent past (e.g., Logan et al.,
2014). For example, a model that uses the average temperature in 1970-2050 to calculate the anomaly in 2051 (i.e., the most recent 80-year window) would assume adaptation to more recent temperatures as compared to a model that uses 1920-2000. The time period over which the climatology is calculated can be shorter or longer in duration to represent faster or slower rates of adaptation, respectively (see Box 4.1 for an extended description of this calculation). For example, a model that compares 2051 temperatures to those experienced by corals from 2010-2050 (i.e., 40-year window) would result in fewer DHWs than if the average from 1970-2050 (80-year window) were used.
Projected Sea Surface Temperatures Forcing the Dynamic Coral Model
In the present modeling exercise, rolling climatologies calculated for reef cells located within the Caribbean region (157 reef cells; see Figure 4.3) were used to calculate DHMs (converted to DHWs) based on bias-corrected global climate model data presented in Logan et al. (2014). Climate scenarios follow the representative concentration pathway (RCP) scenarios developed by the Intergovernmental Panel on Climate Change (Collins et al., 2013). RCP2.6 represents a strong mitigation scenario, and RCP8.5 represents a “worst-case” business-as-usual scenario. The RCP
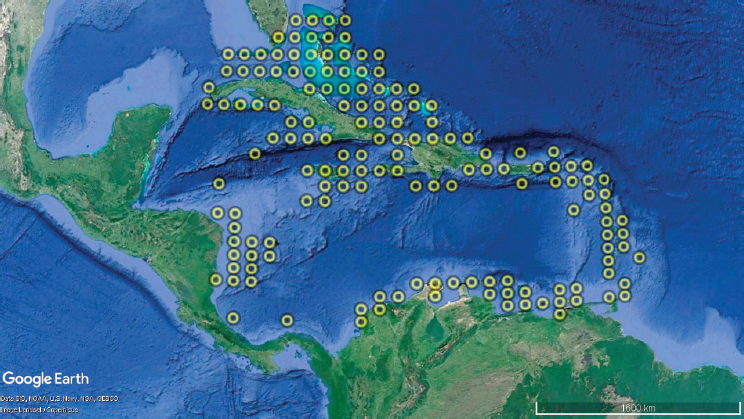
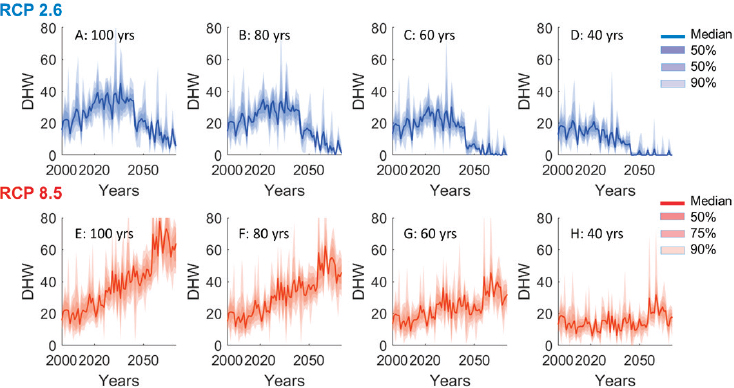
scenarios translate to predicted future climate trajectories based on global climate models and are incorporated into the average temperatures used in the DHW calculation. Specifically, for each of the two climate change scenarios (RCP2.6 and RCP8.5), trajectories of DHWs for four different climatologies consisting of rolling windows of different length were produced (Logan et al., 2014; see Figure 4.4). Because the trajectories in Figure 4.4 represent DHWs expected in bleaching years only, these are converted to DHW probability distributions for the Caribbean in any given year using observed DHW values bleaching and nonbleaching years during the past decade using Lough et al. (2018). In other words, Figure 4.4 was converted to DHW probability functions.
The outputs were then used as input into the bleaching survival function (see Figure 4.2 and Equation 4.4). A rolling window of 80 years was chosen as the default natural adaptation case because this window predicts high-frequency bleaching in severe but not more moderate climate scenarios (Logan et al., 2014), in line with mechanistic genetic models (Baskett et al., 2009; Bay et al., 2017). Interventions that alter a coral’s rate of adaptation are represented by alteration of the rolling window period, as described in the “Modeling the Interventions” section.
Modeling the Interventions
Any modeling framework used in a decision-making process would need to clearly represent both anticipated benefits and anticipated risks
of interventions. Although broader decision support frameworks should include environmental, social, economic, and cultural benefits and risks, in this example they are limited to ecological or biological only. Table 4.1 describes how biological and ecological risks and benefits are expected to occur based on the state of knowledge of each intervention (as described in the committee’s first report, NASEM, 2019) might be assessed in the committee’s model. The different modeling frameworks described in Table 3.2 (and the “Relevant Mechanistic Modeling Framework” column of Table 4.1) can more mechanistically represent many of these risks and benefits for improved predictive ability. For example, while the rolling window calculation of DHWs implicitly accounts for genetic adaptation, explicitly accounting for genetic dynamics can allow the model to predict the expected evolutionary outcome from interventions that affect genetic composition rather than assuming a particular adaptive rate. These and other factors ignored here for simplicity (e.g., ocean acidification [OA] effects, coral size-dependent demography, additional coral species, spatially explicit dynamics associated with connectivity) would be an essential part of constructing a location-specific and intervention-specific model for an on-the-ground decision-making process.
As Table 4.1 illustrates, in some cases risks and benefits might affect the same value or process in the model, in which case mechanistic models are particularly necessary. For example, both risks and benefits of managed breeding arise through effects on genetic variance and fitness. Specifically, a key benefit of managed breeding is the potential to enhance genetic variance, and therefore adaptive capacity, through reducing the effects of drift and introducing novel genetic combinations. However, such enhanced genetic variance might pose a risk if it includes the maintenance of maladapted genes that would otherwise be lost under natural selection. In addition, depending on the approach to managed breeding, there might be a risk of loss of genetic variance if the approach disproportionately favors a subset of genotypes (“sweepstakes events”; Crow and Denniston, 1988; Hedgecock, 1994; Lande and Barrowclough, 1987). A genetic model could capture how these potential risks and benefits combine to determine genetic variance and fitness and therefore the overall outcome. Analogously, both risks and benefits of antibiotics arise through effects on disease prevalence; in addition to potentially benefiting corals by reducing disease, antibiotics might destabilize beneficial microbes and promote resistance to antibiotics in deleterious microbes, and therefore a key risk is increased disease prevalence. A model that incorporates the dynamics of both beneficial and deleterious microbes with both antibiotic-susceptible and antibiotic-resistant types could mechanistically determine
TABLE 4.1 Anticipated Benefits and Risks of Interventions and the Biophysical Parameters for Modeling Using the Committee’s Example Model
| Relevant Interventions | Potential Effect in Committee’s Model | Relevant Mechanistic Modeling Framework | |
|---|---|---|---|
| Benefit | |||
| Increase thermal tolerance physiologically | Pre-exposure, algal symbiont manipulation, microbiome manipulation, antioxidants, nutritional supplementation | Temporarily increase coral survival at a given DHW (lowering p2,X in hX(τ)) | Physiological model |
| Increase thermal tolerance via genetic adaptatio | Managed selection, managed breeding, genetic manipulation, assisted gene flow | Narrow rolling window for calculating the DHW value in hX(τ) | Genetic model |
| Reduce exposure to thermal stress | Shading, mixing of cool water | Reduce DHWs experienced | Oceanographic model |
| Reduce exposure to OA stress | Abiotic OA interventions, seagrass meadows and macroalgal beds | Incorporate OA dependency for coral growth (gX) | Structured population model |
| Increase disease tolerance | Antibiotics, phage therapy microbiome manipulation | , Decrease coral background mortality (mX) | Disease dynamics model |
| Enhance population size | Managed breeding, gamete and larval capture and seeding, managed relocation | Increase in coral external recruitment (rEX,X) | Structured population model and genetic model |
| Risk | |||
| Reduced fitness (e.g., outbreeding depression, domestication) | Managed breeding | Increase coral background mortality (mX) | Genetic model |
| Reduced rate of adaptation | Shading, mixing of cool water, abiotic OA interventions, seagrass meadows and macroalgal beds | Longer rolling window for DHW value in hX(τ) | Genetic model |
| Relevant Interventions | Potential Effect in Committee’s Model | Relevant Mechanistic Modeling Framework | |
|---|---|---|---|
| Tradeoff between stress tolerance and other demographic processes | Managed selection, assisted gene flow, antioxidants, algal symbiont or microbiome manipulation, pre-exposure, OA interventions | Decrease coral growth (gX) and/or increase coral background mortality (mX) | Physiological model |
| Disease or other pest introduction | Managed relocation | Increased coral background mortality (mX) | Disease dynamics model |
| Destabilization of beneficial versus deleterious microbes | Microbiome manipulation, antibiotics, phage therapy | Increased coral background mortality (mX) | Physiological model |
| Increased macroalgal growth | Nutritional supplementation, macroalgal beds to reduce OA | Increase in algal growth (γ) | Community model with explicit herbivore dynamics |
the balance of risk and benefit from different approaches to this intervention. While relevant mechanistic modeling frameworks are suggested in Table 4.1 based on the target process of a given intervention (e.g., genetics, physiology), in some cases a combination of frameworks will be necessary to capture the full array of risks and benefits, as discussed in Chapter 3.
For the purpose of this modeling study, two example interventions that affect different processes in the system have been chosen for illustration: assisted gene flow (for increased thermal tolerance) and atmospheric shading (for reduced exposure to thermal stress). Importantly, the model results are only an example of the potential benefits, risks, and limits of these interventions. The model ignores unanticipated risks or benefits, which could be analyzed through scenario planning (assessing a range of plausible future scenarios, usually qualitatively; Peterson et al., 2003). In addition, the model has only minimal accounting of the potential for ineffective intervention or intervention failure (whether due to scientific or human error), which can be analyzed by modeling a probability of failure (no benefit realized) or of partial benefit. The model includes the
probability that shading may occasionally fail and thus the benefit potentially not achieved every year (described in more detail below). However, it does not include potential failure of assisted gene flow, such as the possibility that assisted gene flow might not increase adaptive capacity due to moving the wrong individuals to the wrong place or at the wrong time. Mechanistic models can account for uncertainty in whether anticipated benefits are realized.
Atmospheric shading interventions cool the sea surface over coral reefs locally, regionally, or globally (Gattuso et al., 2018). In this example, local-to regional-scale atmospheric shading (e.g., as marine cloud brightening) is simulated as reductions in DHW exposure during the bleaching season using hypothetical estimates of shading efficacy. The benefits of shading are modeled simply as a lowering of DHW exposure during thermal anomalies using a low efficacy level of 0.3°C cooling during summer. For simplicity and to focus on the primary anticipated benefit, the potential for shading to reduce macroalgal growth is ignored, an effect to consider in a more predictive model. The risk from shading is represented as reduced rates of adaptation and consequently enhanced heat stress in years of shading system failure, or potentially decommissioning. Specifically, when shading is implemented, the rolling window for calculating DHW values is increased by 20 years. In addition, the likelihood of atmospheric shading failure (and therefore corals experiencing baseline rather than shading-adjusted DHW) is drawn from a Poisson distribution with mean λSF = 0.1. While there are other potential risks to atmospheric shading, such as changes in local precipitation and ocean productivity or deposition of aerosols (salts) on neighboring land, these are not included in the model.
Assisted gene flow (a type of managed relocation) is the active transport of genes within a locally adapted population to other locations within their range where they are expected to match future climate conditions (Aitken and Whitlock, 2013). Because the model represents a single focal location, assisted gene flow (applied to both coral types) is modeled as the introduction of corals with high thermal tolerance genes from locations that have historically experienced, and therefore are adapted to, high thermal stress. This is represented in the model as narrower rolling windows for calculating the mean climatology that determines the DHWs experienced (60 or 40 years as two levels of intervention, potentially determined by how distant of a location from which to select transported corals). The approach of shifting rolling windows (as opposed to shifting
the parameters in the bleaching mortality function in Equation 4.4) was chosen to bound the expectations for how much assisted gene flow might increase stress tolerance based on a representation of an adaptive process. The addition of the transported coral fragments or recruits with assisted gene flow also adds a small amount to coral cover, which is added to the coral recruitment rEX,X (10% increase in value) for each focal coral X.
Risks of assisted gene flow include disruption of local adaptation to nonclimatic factors and other sources of outbreeding depression, accidental transport of invasive pests and pathogens, and tradeoffs between enhanced thermal tolerance and additional demographic processes (e.g., growth, physiological maintenance, and resistance to additional stressors that underlie survival). A typical risk involved for assisted gene flow is outbreeding depression for hybrids between the native and transplanted corals (Aitken and Whitlock, 2013). Accidental introduction of invasive species is typically invoked for assisted migration outside of a species’ range (Hewitt et al., 2011) rather than assisted gene flow over small distances. However, in coral systems, accidental introduction of diseases might pose a significant risk for assisted gene flow due to the large geographic range for many coral species (basin-wide in some cases) and prevalence of diseases, with regional heterogeneity in incidence, that significantly affect coral cover (Rosenberg et al., 2007; Ruiz-Moreno et al., 2012), hence its inclusion here. These risks are modeled as a decrease in growth (gX) and an increase in baseline mortality (mX) for each translocated coral type (X). Both of these changes can represent effects of outbreeding depression and tradeoffs between stress tolerance and other demographic processes, and the change to baseline mortality can also represent the effects of accidentally introduced diseases. Changes in growth and mortality are increased with increasing intervention levels under the assumption that achieving a greater increase in thermal tolerance might involve transport from more distant or environmentally different locations and therefore incur greater risk. For each 20-year window of accelerated adaptation, the value for growth decreases by 10% and the mean amount by which mortality increases is 0.05 yr–1. In each simulation, an increase in mortality is drawn from an exponential distribution given the intervention-dependent mean to represent stochasticity in the likelihood of pest or pathogen introduction and uncertainty in the amount of demographic tradeoffs. This approach of adjusting baseline mortality represents the potential for nonlocal pathogens as endemic (permanently present) rather than epidemic (short-term outbreak) diseases.
No intervention (i.e., maintaining all parameters at default values) is modeled as a counterfactual. Establishing a counterfactual provides an
essential comparison point in a decision framework for understanding the potential for the focal interventions to enhance the likelihood of coral reef persistence and sustained delivery associated with the ecosystem services. In the context of rapid climate change, the counterfactual can provide insight into the damage prevention afforded by an intervention strategy and the value of early action.
Conventional management of local stressors is considered across all scenarios (no intervention, shading, assisted gene flow) by exploring a range of values for herbivory rate (v) and macroalgal growth rate (γ). These two distinct parameters and processes interact to determine the overall macroalgal dynamics (net growth). These parameters can represent how local management and reef context might affect the likelihood of intervention importance and success. Increasing herbivory rate provides initial insight into the effect of sustainable fisheries management. Decreasing macroalgal growth provides initial insight into the potential effect of nutrient control. As with the two sample interventions, this exploration is a subset of possible actions and outcomes from conventional management, which could also include actions to reduce local anthropogenic impacts on coral growth, survival, and recruitment (e.g., from sedimentation and pollution). The herbivory and macroalgal growth rate values are set at model initialization to represent the local conventional management context, while the parameter changes associated with atmospheric shading or assisted gene flow change in a specified “deployment year” to represent additional interventions implemented in the local context. Interventions (or intervention effects) occur continuously after the deployment year until the end of the simulations. As with the coral interventions, these explorations represent illustrations of how one might develop and analyze a decision framework for the interaction between local management controls and interventions; predictive frameworks for these local management controls would also rely on more mechanistic models (e.g., explicit herbivore dynamics for herbivorous fish control).
Numerical Analysis
The expected outcomes were analyzed for different intervention scenarios by simulating Equations 4.1-4.8 in MATLAB. The MATLAB code was developed by two committee members, and verified by a third. The code and output are available in the National Academies public access file on request. Initial proportional coral cover was randomly chosen to either represent potentially initially degraded (5%) or “pristine” (30%) coral conditions. The model is initially simulated with nonintervention
default parameter values until an intervention time point (deployment year), and then parameter values are altered as described in the “Modeling the Interventions” section to implement interventions until the end of the simulated management horizon (2060). Within each 1-year time step, (1) the discrete-time bleaching mortality and recruitment are applied according to Equations 4.4-4.8, and (2) the continuous-time dynamics in Equations 4.1-4.3 are numerically integrated over 1 year using the MATLAB function ode45.
In setting parameter estimates, ranges from the literature were used to the extent possible. For most of the parameters that describe the continuous-time processes of growth, competition, and baseline algal grazing, values are drawn from the ranges in Fung et al. (2011). Baseline mortality is informed by Madin et al. (2014), converted from discrete-time proportion mortality pm,X to continuous-time mortality rate mX as mX = −ln(1 − pm,X). For bleaching mortality, parameters p1,X and p2,X of the Gompertz function are estimated by anchoring the midsection of the curve in the 2005 Caribbean mass bleaching event (see Figure 4.2). Note that without calibration of the bleaching mortality parameters to more extensive data in the region, outputs are associated with high uncertainty. A summary of parameter estimates for different interventions is presented in Table 4.2.
The vital rates of coral growth, recruitment, and mortality will inevitably vary between species and locations. Furthermore, responses to new interventions are in many cases uncertain because the research and development necessary to establish how the environment or the ecosystem responds to intervention has not been carried out. However, because the purpose of this example is to provide an illustration of assessing the scope that new interventions might have in improving coral condition or preventing coral loss, the focus is on relative impacts rather than projecting absolute reef states that depend on precise parameter estimates.
Strategy Design and Simulations
The performance of the example interventions is assessed using a structured design that compares interventions individually and in combination. The combinations are referred to as “strategies” that constitute options (alternatives) for decision making. For the purpose of this example, all possible combinations of interventions and conditions at multiple levels were analyzed (see Table 4.3) for a total of 192 strategy combinations. In reality, a subset of strategies can be identified where, for example, water quality and herbivore management are an agreed prerequisite for new interventions. Strategy-generation tables elicited with the help of reef managers and stakeholders can help narrow in on such a subset of
TABLE 4.2 Summary of Symbols, Functions, and Default Parameter Values Used in the Model
| Symbol | Unit | Interpretation | Range | Source |
|---|---|---|---|---|
| CF | Prop | Area covered by fast-growing corals | 0-1 | — |
| CS | Prop | Area covered by slow-growing corals | 0-1 | — |
| M | Prop | Area covered by macroalgae | 0-1 | — |
| P | Prop | Proportion habitat available | 1 | — |
| gF | yr–1 | Growth rate of fast-growing corals | 0.5 | Anthony et al., 2011; Fung et al., 2011 |
| gS | yr–1 | Growth rate of slow-growing corals | 0.3 | Fung et al., 2011 |
| yr–1 | Growth rate of macroalgae | 0.8 | Fung et al., 2011 | |
| aF | yr–1 | Rate of macroalgae overgrowing fast-growing corals | 0.05 | Fung et al., 2011 |
| aS | yr–1 | Rate of macroalgae overgrowing slow-growing corals | 0.07 | Fung et al., 2011 |
| α | yr–1 | Rate of fast-growing coral overgrowing slow-growing corals | 0.03 | Tanner et al., 1994 |
| mF | yr–1 | Base rate mortality for fast-growing corals | 0.1 | Madin et al., 2014 |
| mS | yr–1 | Base rate mortality for slow-growing corals | 0.05 | Madin et al., 2014 |
| v | yr–1 | Baseline grazing rate on macroalgae | 0.4 | Fung et al., 2010 |
| rEX,F | Prop | External recruitment of fast-growing corals | 0.001 | Fung et al., 2010 |
| rEX,S | Prop | External recruitment of slow-growing corals | 0.001 | Fung et al., 2010 |
| rEX,M | Prop | External recruitment of macroalgae | 0.001 | This study |
| rIN,F | nd | Internal recruitment of fast-growing corals | 0.005 | Fung et al., 2010 |
| rN,S | nd | Internal recruitment of slow-growing corals | 0.005 | Fung et al., 2010 |
| rIN,M | nd | Internal recruitment of macroalgae | 0.005 | This study |
| p1,F | nd | Shape parameter 1 for fast-growing corals | 0.02 | This study |
| p2,F | nd | Shape parameter 2 for fast-growing corals | 0.28 | This study |
| Symbol | Unit | Interpretation | Range | Source |
|---|---|---|---|---|
| p1,S | nd | Shape parameter 1 for slow-growing corals | 0.02 | This study |
| p2,S | nd | Shape parameter 2 for slow-growing corals | 0.23 | This study |
| DHW | °C wk | Degree heating weeks | Logan et al., 2014 |
NOTE: The term “nd” indicates nondimensional (relative) units.
strategy alternatives (Howard, 1988; Ohlson and Serveiss, 2007). Comparing all intervention combinations and all conditions, however, enables one to understand the extent to which interventions in strategies might synergize or antagonize (combined effect greater or less than the sum of each alone, respectively), and under what conditions. From the perspective of coral resilience, supporting multiple processes that together alleviate pressures, underpin survival, and promote growth and recruitment will increase the likelihood that the system can gravitate to a coral-dominated state (Anthony et al., 2015).
The design for intervention strategies (all combinations) is replicated for a set of conditions, specifically early versus late deployment years, low
TABLE 4.3 Summary of Conditions and Interventions at Increasing Levels of Intensity Used in Model Simulations as Part of the Strategy Design
| Levels | |
|---|---|
| Conditions | |
| Climate change scenario | RCP2.6, RCP8.5 |
| Start state (total coral cover) | 5%, 30% |
| Deployment year | 2025, 2035 |
| Interventions | |
| Algal growth (stimulated by nutrient load) | 0.6, 0.2 |
| Algal grazing rate (herbivores) | 0.2, 0.6 |
| Assisted gene flow (as rolling-window climatologies) | 80, 60, 40 years |
| Atmospheric shading (for 12 weeks during bleaching season, with risk of failure) | Nil, 6 DHWs |
NOTE: Model results were reported for years 2020, 2030, 2040, 2050, and 2060.
versus high start states for coral cover, and moderate to severe climate change scenarios (see Table 4.3). Exploring these combinations allowed us to examine under what condition(s) interventions have high versus low efficacy, and with what risks. For example, while early deployment of assisted gene flow may seek to stem coral decline, the associated risk of also introducing a pathogen may counter that benefit, especially for a high start state representing a healthy reef. Such examples are explored in the context of climate outlooks, intervention benefits, and risks to inform the discussion around decisions to deploy versus delay (Iacona et al., 2017).
Each line in the resulting design table hence provides the command structure for the 192 combinations in the model simulations. In this analysis, 10 simulations (trajectories) were run for each line in the design table (for a total of 1,920 simulations) using a Monte Carlo approach. The modeling was limited to only 10 simulations because the only source of stochastic variation was the temperature inputs, resulting in narrow confidence bands around coral and macroalgal projections. The probability of a thermal anomaly and its severity (as DHW) is drawn annually from a random distribution under predicted max DHWs from rolling windows. Intervention uncertainty and varying conditions were represented by the low versus high parameter estimates set to bracket their likely range (the “Levels” identified in Table 4.3). Ideally, a larger number of simulations should be run, that number being a tradeoff between precision and computing power available when modeling complex systems. This is especially so if the stochastic variation or uncertainty of many different environmental and ecological model parameters are also included in simulations.
Results of Analysis
The focal output metrics for each of the 1,920 simulations is coral cover over time combined for the two coral groups. Figure 4.5 illustrates a selection of example trajectories from the model with varying levels of RCP scenarios, conventional management, and assisted gene flow. Under RCP2.6, low grazing and high nutrients (driving algal growth) and low start state (initial coral cover), coral cover is projected to decline further, while macroalgae cover is projected to increase. This trajectory occurs with and without assisted gene flow (see AGF in Figure 4.5a and b). However, setting conventional management to high (high grazing and low nutrients; BPM for best practices management) changes the outlook dramatically, but more so with conventional management alone than when high levels of assisted gene flow are introduced (Figure 4.5c versus Figure 4.5d). This is explained by the risks associated with high assisted
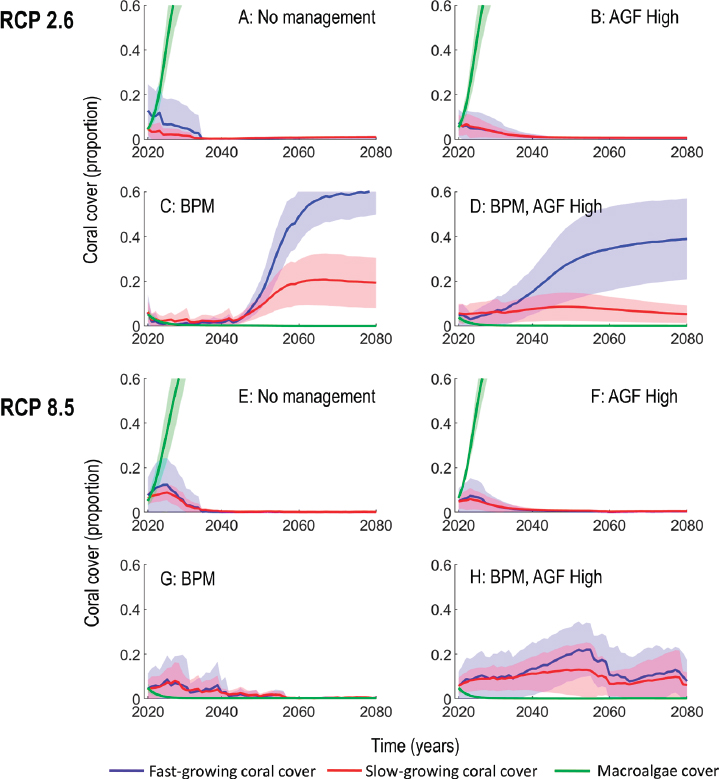
gene flow, with uncertainty in mortality effects manifested in Figure 4.5d as a broader confidence band around the trajectory line (the mean estimate). Under RCP8.5, the situation is the same for the no/low conventional management scenario (low grazing and high nutrients), again with or without assisted gene flow (see Figure 4.5e and f). Although moving from low to best-practice conventional management does not improve the coral outlook by itself (see Figure 4.5g), setting assisted gene flow to high in combination with high levels of conventional management leads to coral recovery and sustained cover to 2080 under RCP8.5 (see Figure 4.5h). These sample modeling results and the conclusions drawn from them are sensitive to the assumptions made around how different environmental, biological, and ecological processes interact and the strength of these interactions.
BAYESIAN NETWORK ANALYSES
The large number of model outputs (coral cover over time based on 192 combinations of conditions and interventions) produced by the model means that general conclusions cannot be drawn easily from inspecting the many trajectories of outcomes for corals and macroalgae. To identify which strategy solutions perform better requires the ability to query all dimensions of the results and evaluate their tradeoffs using one of the systematic approaches described in Step 3 in Chapter 3. In this section, the committee uses a method whereby trajectories of dynamic and uncertain coral cover are converted to a network of conditional (Bayesian) likelihoods. The method is adapted from one described by Nicol and Chades (2017) but uses model outputs to replace expert opinion (see also Ni et al., 2011). Networks of conditional likelihoods have the advantage of translating easily to the language of risk (i.e., probability and consequence). While some uncertainty is accounted for in the outputs (mainly DHW), a fuller account of uncertainty will require that multiple sources of variation and uncertainty are hard-wired into the modeling. This will require a larger number of simulations to filter signal from noise. While results of the Bayesian network model (as well as the dynamic, mathematical mode) are presented nonspatially, they can also be presented spatially when geographic information systems data are available and used as inputs (Gonzalez-Redin et al., 2016).
The method for converting the biophysical model output into data for a Bayesian network is described in detail in Appendix B. Ten data points of coral cover were collected at decadal time steps (2020-2060) and organized according to the scenarios identified in Table 4.3. In the current example, these 10 points comprised all data points produced by
the dynamic model. If more points are produced by the model (e.g., 1,000 simulations per combination of interventions and conditions), an appropriate subset of those results can be sampled and exported to the Bayesian analysis. The data are then imported into Netica1 using the method described by Ni et al. (2011) to populate an empty Bayesian network diagram that mirrors the data column headers.
Results of Analyses
In the following example analyses, a basic exploration of the results of the modeling outputs of the dynamic coral reef model illustrates how one might use the output in a decision-making process for a set of example management questions. The results are analyzed using a Bayesian network to capture all model outputs as likelihoods, and then results are brought together for comparison in a strategy (or consequence) table to inform decision making. In a Bayesian network analysis, one or more parameters (each represented by nodes) are fixed at a chosen value in order to evaluate the relative impact that the remaining parameters have on achieving those chosen states. Managers can translate their objectives into these fixed parameters. The following examples explore how selecting fixed coral cover as a simple objective, under selected timeframe and climate scenario conditions, influences the relative importance of other parameters, such as the need for intervention or improved management of local stressors.
Example 1: What Will Be Required to Sustain Coral Cover Under Substantial Greenhouse Gas Mitigation (RCP2.6)?
To address this question, the Bayesian network is examined in diagnostics mode by locking in the objective of at least 20% coral cover as the dependent variable (0.2 to 1 range in node CoralCover) and the condition for RCP2.6 (node Scenario). At the modeled endpoint of 2060, RCP2.6 would represent average atmospheric temperature increases of about 1.5°C relative to preindustrial level, as compared to increases of about 2.7°C under RCP8.5 (Collins et al., 2013). Note that 20% coral cover represents a relatively unambitious objective compared to a more “pristine” historical state. High coral cover is now set as the primary management objective (with 100% likelihood as the ambitious target). This setting updates the nine independent parent nodes.
In the illustrative results (see Figure 4.6a), the distributions of likelihoods within each of the independent nodes provide indication of the
___________________
1 Available at https://www.norsys.com.
node states or levels that contribute most to achieving high coral cover under RCP2.6. For example, among all years in the modeled horizon, the coral cover objective has the highest likelihood of being met in years 2020 and 2060 (node Years). While this is at first counterintuitive, the result is consistent with the declining pattern of DHWs in Figure 4.6 for the rolling windows. In other words, as global temperatures start to stabilize mid-century under RCP2.6, and surviving corals adapt, coral cover is expected to recover. Also, a high start state (coral cover in year 2020, in node StartState) provides the highest chance of meeting the objective of sustained coral cover. Furthermore, a high grazing rate by herbivores on macroalgae (Grazing) improves the chance of achieving high coral cover. Therefore, under the particular parameterization and model structure used in this example, an example message would be that the management of herbivores is generally more important than new interventions (AGF and Shading) under RCP2.6.
Example 2: What Will Be Required to Sustain Coral Cover Under Business-as-Usual Greenhouse Gas Emissions (RCP8.5)?
To address this question, RCP8.5 is selected in Scenario instead of RCP2.6. The example results in Figure 4.6b illustrate three possible conclusions for this model structure and parameterization. First, the likelihood of sustaining coral cover declines precipitously with time (node Years). Specifically, there is a fourfold greater chance of sustaining greater than 20% coral cover in 2020 compared to 2060. Second, the opportunity for a high assisted gene flow (AGF) effort to contribute to coral cover is increased compared to RCP2.6. Third, the role of grazing remains significant. Given that the legacy of start state is likely to decline over time, it is assumed that the importance of high start state in the results is linked predominantly to years 2030 and 2040. Shading has a minimal role because its positive effects (nominally 6 DHW cooling) are offset by the shift to a longer rolling climatology window (due to slower rates of adaptation) in combination with the risk of shading failure. Cases such as this when a conclusion is a direct outcome of model assumptions illustrate how model explorations can identify crucial assumptions that require validation with data and exploration with more mechanistic models.
Example 3: What Will Be Required to Sustain Corals on the Long Time Horizon Under Business-as-Usual Greenhouse Gas Emissions?
To model the specific conservation goal of sustaining high coral cover in the long term under the business-as-usual climate change scenario, the
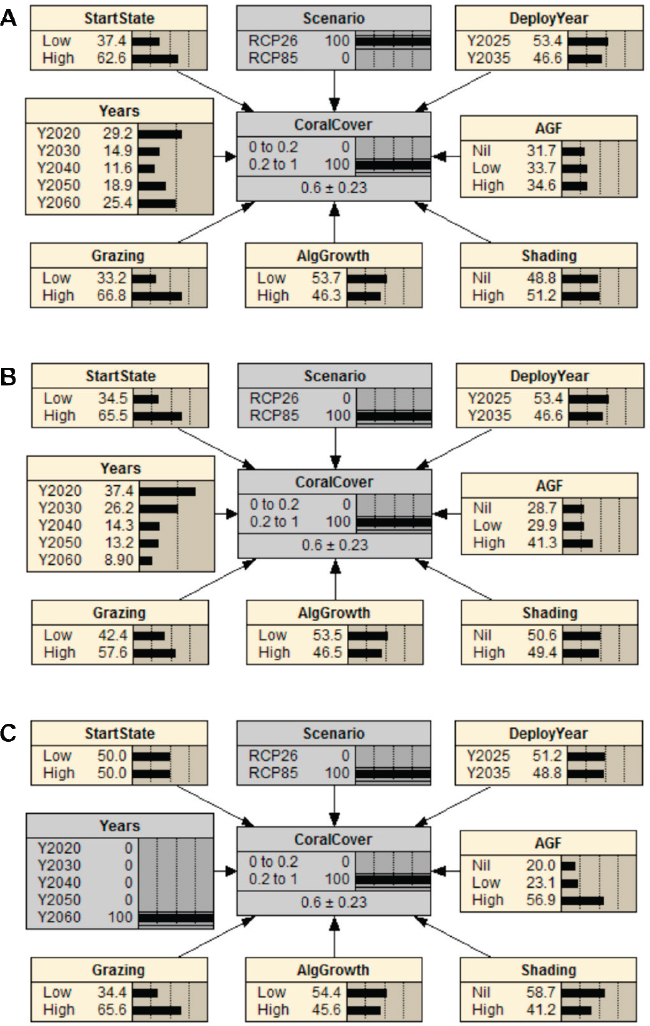
target year is set to 2060 (node Year) under the RCP8.5. Note that modeling of longer time horizons, to at least 2100, would likely be preferred as a representation of “sustained” coral cover, although uncertainty in climate predictions will increase for longer projections.
Under this illustration, an example central conclusion is that achieving high coral cover is now nearly three times as likely to occur under a high effort to support assisted gene flow (AGF; see Figure 4.6c). Interestingly however, absence of shading (“Nil”) produces a higher likelihood of sustaining coral cover. The explanation for this is likely similar to that described under Example 2: the 6 DHW cooling is offset by the shift to a longer rolling window for adaptation built into the model. Importantly, similar to the general RCP2.6 scenario (see Example 1), there is twice the chance of sustaining high coral cover under severe climate change by 2060 under a high compared to low rate of algal grazing, a component of conventional management. The relatively low impact of high versus low algal growth compared to grazing is likely to be the result of the relatively low and narrow range of algal growth rates used in the model (0.2 yr–1 to 0.6 yr–1).
Comparing Management Options
The three questions above are examples of diagnosing the system for the purpose of understanding what conditions and interventions most strongly drive high coral cover and when. While the examples show how one might inform decision making, they do not directly assess which interventions may produce the highest (or lowest) chances of success (i.e., meeting the primary objective). Such an assessment can be conducted by using the Bayesian network in predictive mode. In this case, the likelihoods of high coral cover (more than 20%) are recorded while systematically varying conditions and interventions from Table 4.3 (Options A through E described below). The output of this analysis becomes a consequence table, which can be used to identify high-performing strategy options or alternatives (Gregory et al., 2012; Groves and Game, 2016). Note that coral cover is only one example of an ecological objective, and that a more complete structured decision analysis will need to take account of additional objectives, including economic, social, and ideally cultural value sets (Gregory et al., 2012; Keeney and Raiffa, 1993).
Results are compared for two management horizons, years 2040 and 2060. The near horizon exemplifies how early assessment affects the expected detectability of intervention efficacy, whereas the longer horizon provides insight into whether interventions have long-term potential as impacts of climate change (or mitigation) progress. Within these horizons
are eight scenario combinations: RCP2.6 versus RCP8.5, low versus high start state, and early versus late deployment year (2025 versus 2035, which can indicate the role of early versus late intervention in a race against time; e.g., Anthony et al., 2017) for new interventions (assisted gene flow and shading). Because RCP2.6 and RCP8.5 do not diverge strongly until after 2040 or 2050, comparisons of intervention performance between RCP2.6 and RCP8.5 at the year 2040 horizon provide limited information.
For the baseline option (Option A in Figure 4.7), grazing rate is set to low and algal growth to high, representing the current condition of many reefs. Furthermore, shading and assisted gene flow (AGF) are set to nil. High, or best practices, conventional management of local stressors (BPM) is included in the strategy options (Option B) by setting algal grazing to high and algal growth rate to low. Option C represents a strategy that deploys a high rate of assisted gene flow in combination with best practices conventional management. This is achieved by selecting the 40-year rolling climatology (AGF High), which will include a downside risk of increased chance of disease mortality. Option D expands Option C by adding shading, specifically by simulating 6 DHW cooling during
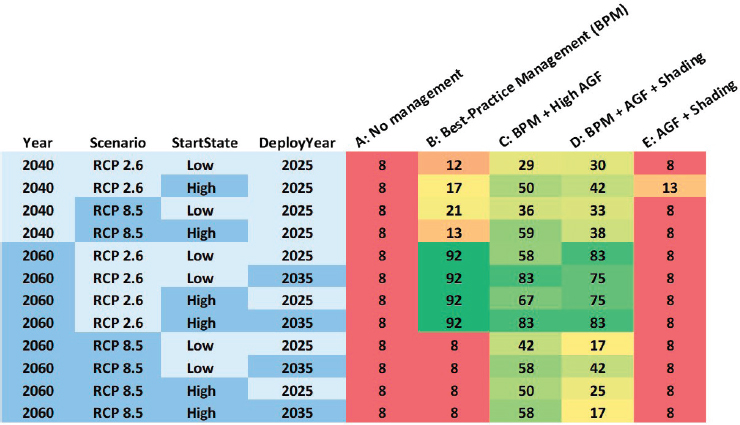
summer in addition to high rates of assisted gene flow and best-practice management. Lastly, Option E is a high rate of assisted gene flow and shading, but with a low level of conventional management. This option enables assessment of how important effective conventional management is in combination with new interventions. The likelihoods that each strategy option (A to E) sustains coral cover greater than 20%, given the varying conditions, are illustrated in Figure 4.7.
Example insights that one might gain from this type of analysis are:
Importantly, all likelihoods presented in these analyses, including likelihoods for the low conventional management option, are associated with uncertainty. They are partly driven by the parameter values set for the different variables in the model (see Table 4.2), including range boundaries set for interventions and other conditions (see Table 4.3). This example illustrates how a Bayesian network analysis can identify particularly influential parameters, such as those related to conventional management (grazing rate and algal growth), that would require careful measurement for accurate predictions. In addition to context-dependent model formulation and parameterization, ground truthing of model projections would be necessary to inform analyses that can guide strategy comparisons and inform decision analyses with confidence.
ADDITIONAL DIRECTIONS
Four general principles drive interest in modeling interventions to evaluate expected outcomes: (1) interventions could make a difference in sustaining coral cover over decadal timescales but incur uncertain risks; (2) some interventions may work better in certain conditions than others; (3) some interventions may work more or less effectively when they are implemented together; and (4) the order in which multiple interventions are implemented at a site may influence their success. As illustrated in this chapter, a structured decision-making framework informed by both a dynamic reef system model and a Bayesian network analysis can help managers identify and quantify (with uncertainty) which interventions, or sequence of interventions, might best deliver management objectives. For example, the results from the particular model structure and parameterization used in this example would suggest that (1) assisted gene flow and shading can alter expected coral trajectories over decadal timescales, but risks can outweigh benefits under high mitigation scenarios; (2) these interventions are more likely to be effective with strong fishery management and nutrient control; and (3) assisted gene flow and shading are less
effective together than separately given that the assumed risk of shading (slowed evolution) counteracts the benefit of assisted gene flow (accelerated evolution). While these results will certainly change with more mechanistic model and ground-truthed parameterization, these example conclusions illustrate how building and parameterizing a model for a target location and set of interventions can lead to insights that inform the local decision process of what, when, and where to intervene.
Additional analyses of this type of framework can inform other aspects of the decision-making process outlined in Chapter 3. For example, projections from this type of modeling framework can inform monitoring and adaptive management decisions such as which metrics might best indicate success and risks (starting from the array of possibilities in Table 4.1), when to expect detectable changes in those metrics and therefore when to evaluate success or risk (e.g., when trajectories diverge between the plots with different interventions in Figure 4.5), and what magnitude of outcomes in those metrics to expect (see Kaplan et al., 2019, for an example of this type of analysis). Comparing such expectations to observed outcomes leads to improved knowledge. In the adaptive management process, this knowledge is used to update the relevant modeling framework and thus inform improved management decisions (Holling, 1973; Walters, 1986; Walters and Holling, 1990).
A crucial component of any model analysis will be a sensitivity analysis. By quantifying the effect of uncertainty on the model outcome, parameter sensitivity analysis can indicate which empirical data might most improve model projections (Cariboni et al., 2007). Different parameters can also represent different environmental, ecological, or management contexts such that sensitivity analysis to such parameters can indicate where interventions might be most effective or risky (as illustrated by exploration of the different values of herbivory rate and macroalgal growth rate here). Functional sensitivity analysis can help identify the simplest possible model relevant to a set of interventions.
In addition to varying model inputs, different types of model outputs and analyses can inform decisions as they might depend on stakeholder and manager risk tolerance. For example, a model output and analysis focused on minimizing the likelihood of a risk, such as minimizing the probability of particularly low reef state, might be more relevant to a risk-averse manager. Another type of model analysis can be an evaluation of how benefits and risks depend on the decision process for when and where to intervene (including how long to intervene; the example model assumed continual intervention, or intervention effect, after the deployment year). Context-dependent or condition-dependent decisions might include whether to intervene before a forecasted bleaching event or after an observed bleaching event, or more generally, whether to intervene on
healthier reefs or following coral decline, and how to stagger multiple interventions. In other words, a modeling framework of the type illustrated here can quantitatively evaluate many of the intuitively expected context dependencies for prioritizing intervention described in Chapter 2.
Conclusion: A successful modeling framework requires substantial effort in tailoring model structure and parameters to the decision context, risks and benefits of the interventions under consideration, and local environmental conditions and reef ecosystem dynamics. As demonstrated by the committee’s illustrative effort, the utility and payoff of this approach are the ability to identify
- The conditions necessary for new and potentially risky interventions to outperform the no-action alternative under different future climate scenarios.
- The interventions expected to be most effective at achieving management objectives.
- Potential synergistic and antagonistic interactions across multiple interventions, including management of local stressors.
- The key dynamics and parameters to resolve empirically in order to improve the capacity to predict intervention efficacy and risks.
Further applications of such modeling frameworks include identifying indicators for context- or condition-dependent decisions, monitoring, and adaptive management. The insight provided by a quantitative model enables decision makers and reef stakeholders to compare the benefits and risks of different intervention options with more clarity and transparency than provided by qualitative or conceptual approaches or by expert opinion only. The benefits of a quantitative model are greatest when local ecosystem and evolutionary dynamics are known, and when primary sources of uncertainty are considered.


