
Appendix E
Consultant Reports
The reports included in this appendix were prepared by Mathematica Policy Research in response to requests made by the study sponsor. As noted in the study statement of task (see Chapter 1, Box 1-2), as a consultant, Mathematica Policy Research was asked to develop tools to facilitate surveillance within the topical area of community supports for active transportation, including:
- two brief sets of prioritized questionnaires to assess: (1) an individual’s perceptions of community support for physical activity; and (2) members of a professional organization’s design policies and zoning codes supportive of active transportation (the consultant will develop a validation protocol for the questionnaires).
- two “how-to” protocols to: (1) identify, capture, and store Geographic Information System (GIS) data in a centralized location, and (2) automate the remote collection of audit data.
The appendix is organized as follows: Part I includes the brief questionnaires on individual perceptions of community supports for active transportation and for members of a professional organization, and an accompanying validation protocol; Part II includes the GIS protocol; and Part III pertains to the protocol of remote collection of audit data.
Evaluation, validation, and testing of the questionnaires and protocols were not carried out under the scope of this study. The reports do not necessarily reflect the opinions of the committee and served as additional pieces of evidence that informed the committee in its development of the strategies and supporting actions for implementation.
PART I
TWO BRIEF QUESTIONNAIRES TO ASSESS COMMUNITY SUPPORTS FOR ACTIVE TRANSPORTATION AND VALIDATION PROTOCOL

Background
Per the statement of task, Mathematica provided several potential questions for each questionnaire. Above each item, we also provide the relevant construct from the seven top priorities for surveillance of community supports for active transportation identified in Pate et al. 2018.1
Brief Questionnaire #1: Perceptions of Community Supports for Active Transportation
The first questionnaire is intended to be administered to a census sample of the general population. In this first questionnaire, we provide recommendations for item consideration based on our review of existing instruments assessing similar constructs as those identified in Pate et al. (2018). Because of publisher permission rules and regulations, we cannot reproduce the item in its original form, so we instead describe the intended item, and we link to its source or sources (if multiple exist). In addition, we provide published data on a selected item’s reliability coefficient, and the source of the reliability information.2 In one instance, we were unable to identify a relevant item, so we proposed a novel item and briefly explained the item’s intent. This novel item should be considered tentative since it has not undergone any validation exercise. In an effort to keep scaling consistent, we applied the same scale used for the existing items to this novel item. We identify which items are existing and which are novel.
| Construct: | Land Use, Item #1—Existing Item |
| Item 1: | We recommend including an item which asks about the opportunities for individuals to walk to multiple destinations from their home. |
| Source: | PANES, Item 2, test-retest reliability .63 |
| Similar sources: | |
| Source #1 | NEWS_CFA, Item C3, test-retest reliability .71 |
| Source #2 | Twin Cities Walking Survey, Item G4, test-retest reliability .79 |
| Source #3: | PANES Item 17, test-retest reliability .74 |
| Note: | Item 2 from the PANES study has been prioritized here because it has been used extensively in research. This item asks specifically about proximity to destinations |
___________________
1 The construct “parks” was not identified as part of these seven constructs but was included as a construct per request from the expert committee.
2 For the PANES and NEWS instruments, test-retest reliability was generated as one-way random effect model single measure intra-class correlations. For the Twin Cities instrument, test-retest reliability was generated as Pearson correlation coefficients for the scale (not the individual item).
| where things can be bought. The items under the similar sources ask about destinations more generally. Item G4 from Source #2 and Item 17 from Source #3 are identical, but these items and Item C3 from Source #1 have one small difference. Item C3 does not ask about “ease of access,” whereas items G4 and 17 do ask respondents to consider this concept. | |
| The recommended items here aim to understand opportunities to walk to destinations, defined broadly. If the committee seeks to expand the number of items, these instruments also ask about proximity to specific destinations such as stores, shopping, and transit, and they include items that ask respondents to specify how long it would take to walk to a number of specific destinations. | |
| Construct: | Street Connectivity, Item #2—Existing Item |
| Item 2: | We recommend including an item which asks about opportunities for choice in terms of selecting different routes when traveling to destinations. |
| Source #1: | NEWS_CFA Item D3, test-retest reliability .57 |
| Source #2: | Twin Cities Walking Survey Item H5, test-retest reliability .67 |
| Construct: | Multimodal Transportation, Item #3—Existing Item |
| Item 3a: | We recommend including an item which asks about the accessibility of sidewalks. |
| Source #1: | NEWS_CFA Item E1, test-retest reliability .17 |
| Source #2: | PANES Item 4, test-retest reliability .76 |
| Item 3b: | We recommend including an item which asks about the accessibility of bicycle facilities. |
| Source: | PANES Item 5, test-retest reliability .63 |
| Note: | The items we recommend for 3a and 3b ask about infrastructure. These instruments also include items that ask about safety and traffic hazards as they pertain to walking or biking. |
| Item 3c: | We recommend including an item which asks about access to public transit. |
| Source: | PANES Item 3, test-retest reliability .62 |
| Construct: | Traffic-related safety, Item #4—Existing Item |
| Item 4: | We recommend including an item which asks whether the amount of traffic is a barrier to walking. |
| Source #1: | NEWS_CFA, Item G2, test-retest reliability .62 |
| Source #2: | Twin Cities Walking Survey, Item K2, test-retest reliability .71 |
| Source #3: | PANES Item 8, test-retest reliability .65 |
| Note: | The recommended items here aim to understand traffic safety broadly as it pertains to walking. These surveys include a number of additional items that assess specific aspects of traffic safety as well as cycling. |
| Construct: | Parks, Item #6—Proposed Novel Item |
| Item 5: | Public parks are easily accessible in my community. |
| Strongly disagree (1)Somewhat disagree (2)Somewhat agree (3)Strongly agree (4) | |
| Source: | Developed from NEWS_CFA Item B21, test-retest reliability .67 |
Brief Questionnaire #2: Professionals’ Understanding of Community Supports for Active Transportation in the Communities where they Work
Brief questionnaire 2 aims to survey working people in relevant professional organizations (for example, a local planner who is a member of the American Planning Association) about where these people work and whether the communities they work in have policies, practices, or guidelines in service of community supports for active transportation. Few relevant questionnaires exist for this population, and the ones available generally do not align with the type of information relevant to this task. As a result, we developed new items for consideration. These novel items should be considered tentative since they have not undergone any validation exercise. We identified steps for validating these new items in a validation protocol that accompanies this questionnaire. We also identified two questionnaires, the National Survey of Land-Use Regulations and the National Survey on Local Residential Development Regulation, both of which collect survey data from similar respondent types as this questionnaire. When we identified similar items in the existing surveys, we included those items below each of our developed items.
It is worth noting that the types of working professionals targeted for this survey represent a diverse group of professions including planners and transportation officials. Not all items presented in the survey below are relevant to all professional groups intended to participate in the survey, for example, some items may only be relevant for transportation officials.
Our draft items are based on the seven constructs identified in Pate et al. (2018). To appropriately frame our newly developed items for surveillance, we use the indicator metrics described in Table 2 of Giles-Corti et al. (2016) as examples. These indicators serve as a potential metric to understand how well communities plan and design best practices for promoting health and increasing physical activity. We identify the construct and appropriate indicator for each of our items. We also include a Likert scale commonly used in many general population surveys on this topic.
One complexity to consider is the number of work locations respondents should draw upon when answering these questions. For example, respondents might work in multiple locations, and it might not be feasible or appropriate for them to provide a single response across multiple locations. Asking respondents to consider the community where they work most frequently is one possible strategy. In the items below, we employ this strategy of asking respondents to consider the community where they work most often when providing answers.
Instructions for Respondents: The questions below ask you to consider the community where you work when providing answers to the survey questions. If you work in multiple communities, we ask that you consider the single community where you work most often. Please provide the main jurisdiction associated with this community (for example, town, city, county, state, etc.).
| Construct: | Land Use, Item #1— Proposed Novel Item |
| Indicator: | Density |
| *Item 1a: | The community I work in has specified a target for minimum density development around activity centers or transportation hubs (for example, dwellings or areas which contain at least 4 units per acre). |
| Strongly disagree (1)Somewhat disagree (2)Somewhat agree (3)Strongly agree (4) | |
| Sources for similar items: | |
| Source #1: | National Survey of Local Land Use Regulations, Item 18 (page 115). This item asks about requirements posed for maximum buildable density of dwellings. The unit of measurement is net acres. |
| Source #2: | The National Survey on Local Residential Development Regulation, Item 3 (page 2) provides a similar item to the one suggested from source #1. |
| Indicator: | Diversity |
| Item 1b: | The community I work in has specified policies or requirements which aim to encourage mixed-use development (for example, different housing types and local destinations). |
| Strongly disagree (1)Somewhat disagree (2)Somewhat agree (3)Strongly agree (4) | |
| As mentioned earlier all novel items proposed in this survey should be considered tentative. We wish to highlight that these items that measure the construct “land use” should especially be considered tentative. There is disagreement among experts over the best way to measure this construct. Other potential ways of measuring this construct include: asking about the presence of zoning overlays which increase density, the use of density bonuses, and the reduction of minimum parking requirements to stimulate denser development. | |
| Construct: | Street Connectivity, Item #2—Proposed Novel Item |
| Indicator: | Design |
| Item 2a: | The community I work in has targets for street connectivity (for example, sidewalk completion programs, back alley improvement programs). |
| Strongly disagree (1)Somewhat disagree (2)Somewhat agree (3)Strongly agree (4) | |
| Item 2b: | The community I work in has policies, programs, or requirements for encouraging pedestrian-friendly environments (for example, infrastructure provisions which enhance street connectivity for pedestrians, like sidewalk completion programs). |
| Strongly disagree (1)Somewhat disagree (2)Somewhat agree (3)Strongly agree (4) | |
| Item 2c | The community I work in has policies, programs, or requirements for encouraging cycling-friendly environments (for example, infrastructure provisions which enhance street connectivity for cyclists, like complete bicycle networks). |
| Strongly disagree (1)Somewhat disagree (2)Somewhat agree (3)Strongly agree (4) | |
| Construct: | Multimodal Transportation, Item #3—Proposed Novel Item |
| Indicator: | Air pollution |
| *Item 3: | The community I work in has policies or requirements that reduce emissions of exhaust fumes caused by public transportation. |
| Strongly disagree (1)Somewhat disagree (2)Somewhat agree (3)Strongly agree (4) | |
| Construct: | Public Transit, Item #4—Proposed Novel Item |
| Indicator: | Public transport access |
| *Item 4: | The community I work in has policies or requirements that a specified percentage of the population live in close proximity to high-frequency public transit (for example, 0.25 to 0.5 miles). |
| Strongly disagree (1)Somewhat disagree (2)Somewhat agree (3)Strongly agree (4) | |
| Sources for similar items: | |
| Source #1: National Survey of Local Land Use Regulations, Item 23 (page 116). This item asks about requirements posed on residential builders to set aside funds in support of community infrastructure (for example, public transportation). | |
| Source #2: The National Survey on Local Residential Development Regulation, Item 14 (page 5) provides a similar item to the one suggested from source #1. | |
| Construct: | Traffic Safety, Item #5—Proposed Novel Item |
| Indicator: | Road trauma |
| *Item 5a: | The community I work in has policies or requirements which aim to reduce pedestrian and cyclist injuries and death (for example, complete streets, traffic calming measures, safe street crossings, and safe routes to schools). |
| Strongly disagree (1)Somewhat disagree (2)Somewhat agree (3)Strongly agree (4) | |
| Indicator: | Demand management |
| *Item 5b: | The community I work in has policies or restrictions that limit car parking (for example, pricing parking appropriately for the context). |
| Strongly disagree (1)Somewhat disagree (2)Somewhat agree (3)Strongly agree (4) | |
| Construct: | Parks, Item #5—Proposed Novel Item |
| Indicator: | Open or green space |
| Item 6: | The community I work in has policies or requirements that a defined percentage of residents live within a specified proximity to a park. |
| Strongly disagree (1)Somewhat disagree (2)Somewhat agree (3)Strongly agree (4) | |
VALIDATION PROTOCOL FOR BRIEF QUESTIONNAIRES #1 AND #2
I. Overview
This protocol describes two important next steps in refining the items and brief questionnaires that Mathematica developed in response to the statement of task. The brief questionnaires are entitled Perceptions of Community Supports for Active Transportation (questionnaire #1) and Professionals’ Understanding of Community Supports for Active Transportation in the Communities Where They Work (questionnaire #2). The first step is establishing content validity, and the second step is conducting cognitive interviews.3 These two steps, described below, build on our earlier work in establishing face validity through literature reviews, in reviewing existing instruments and items, and in engaging in an iterative review process with the expert committee.
II. Content Validity
Content validity refers to the extent to which an item is measuring a given construct. A researcher demonstrates content validity by establishing rules that reflect the construct and then assessing the items against those rules to ensure that the content of each item matches the defined content of the construct (Trochim 2006). The step-by-step process for establishing content validity is described below.
1. Defining Constructs
The first step in establishing content validity is to define each construct. Mathematica developed the two brief questionnaires with items intended to measure the seven constructs identified by Pate et al., 2018 as priorities for measuring community supports for active transportation4. Pate and his colleagues defined these constructs through examples. For instance, the construct “multimodal transport infrastructure” is defined through examples such as sidewalks, bike facilities, traffic-calming features, and street-crossing design. These examples provide a good foundation for defining the constructs represented by the two questionnaires.
After the constructs are defined, the next step is to both solicit feedback from stakeholders on whether the items in the questionnaire are aligned with the defined criteria for the construct and determine whether the items are meaningful, whether they cover the intended constructs, and whether anything is missing. An efficient way to do this is through focus groups, although it also possible to obtain this information through one-on-one interviews.
2. Identifying Focus Group Participants
In order to obtain useful feedback about the items, it is important to consider who should participate in the focus groups. Since the questionnaires are oriented toward community and policy domains, the most appropriate participants are professionals in the public health, planning, and
transportation fields who have a deep knowledge of the field. These individuals can provide feedback on whether the items are adequately measuring the important constructs associated with active transportation and physical activity.
3. Conducting Focus Groups
The purpose of focus groups is to have an open-ended discussion in which an exchange of ideas centers around the content of items and constructs. Focus groups are typically conducted with approximately five to eight participants. A benefit of focus groups over individual interviews is that participants also respond to comments made by other members in the group. In addition to having someone take notes in person, it may be helpful to record focus groups for later analysis, assuming that the moderator obtains consent from participants.
Since the goal of the focus groups is to generate qualitative data that can help to inform revisions to items, a moderator may want to do the following:
- State the definition of a particular construct to ensure that it is understood by all participants in the same way. For instance, the construct “multimodal transport infrastructure” is defined through examples such as sidewalks, bike facilities, traffic-calming features, and street-crossing design.
- List the draft item(s) that are intended to measure that construct, and ask the focus group members if the item(s) are in fact doing this. For example, “One item we are considering is: ‘The community I work in has specified policies or requirements that reduce emissions of exhaust fumes caused by public transportation.’ Does this item measure the construct of ‘multimodal transport infrastructure’?”
- Ask the focus group if any key items that measure “multimodal transport infrastructure” are missing but should be included. If a focus group member provides another item, then the moderator should ask the other members of the focus group if this other item resonates with them.
- Repeat this process for all eight constructs.
- Conclude by reminding the focus group members of the eight constructs that were discussed, and ask them if there are key constructs that are missing. If key construct(s) are identified as missing, ask the focus group members to provide a definition of the missing construct(s) and examples of key items that may measure the missing construct(s).
4. Using Focus Group Data to Improve Items
Data obtained from the focus groups may be helpful in improving specific items and overall questionnaires. After the moderator conducts the focus groups, a team of at least two researchers should review the transcripts and/or audio recordings and identify salient themes that emerge from the data. These themes may reflect areas of agreement or disagreement in terms of how well the items measured the intended construct and whether any important items were missing. For example, the focus group may agree that the construct of “multimodal transport infrastructure” is important in assessing community supports for active transportation, but they may have different opinions on the items that most closely align with the construct. Over the course of the focus group, the members may ultimately reach consensus on the item(s) that are appropriate for measuring this construct, but if the
members remain split, then it may make sense to retain several items for the next phase of item and questionnaire development, cognitive interviewing.
III. Cognitive Interviewing
Cognitive interviewing is used to select and refine items, and is often conducted when pilot testing a questionnaire. The techniques for cognitive interviewing should be tested at a point in questionnaire development when there is still time to change the questionnaire.
As in focus groups, it is important in cognitive interviewing to engage with respondents who are representative of a target population. In a general population survey (the population for brief questionnaire #1), cognitive interview respondents should represent individuals in the general population. For questionnaire #2, respondents should represent members of the target population: working professionals who belong to professional organizations like the American Planning Association.
During the cognitive interview, the interviewer administers the questionnaire and then asks the respondent a series of questions designed to understand the respondent’s interpretation, judgment, and thought processes when responding to each item. This approach is intended to access the respondent’s metacognition, which may help to understand whether the item is measuring what we intend it to measure. The following strategies for conducting a cognitive interview can build an understanding of how the target population interprets and responds to recommended items.
1. Strategies for Conducting a Cognitive Interview
The research team may conduct the cognitive interview either in person or by telephone. The interviewer reads each item aloud and then pauses to allow the respondent time to answer the item. After the respondent has answered the item, the interviewer then asks a series of probes to assess how the respondent understood the item and how that understanding was reflected in the response. For example, item #6 in questionnaire #2 states: “The community I work in has specified policies or requirements that a defined percentage of residents live within a specified proximity to a park.” At this point, the interviewer can use the comprehension and interpretation probe to understand how the respondent interpreted policies or requirements. Alternatively, the interviewer may use another comprehension and interpretation probe to ask about how a respondent understood the meaning of a park. Asking these questions of different respondents will help to generate useful data for improving not only items but also any instructions or guidance to respondents that may precede or be included in an item.
This probe may also help to determine which items in a pool of similar items should be retained. In the example in Section II, in which focus group members may be split on which item(s) most closely align with a given construct, researchers can use cognitive interviewing techniques to determine which of the items is best eliciting the intended information.
The comprehension and interpretation probe is a useful technique for conducting cognitive interviews but represents one of many different probes. The work by Willis (1999) is useful for individuals interested in a discussion of other probes mentioned in this protocol as well as other techniques and approaches for conducting cognitive interviews.
2. Using Cognitive Interview Data to Improve Items
Cognitive interviews can improve questionnaires by clarifying two main features of the items (1) the intent or purpose of an item and (2) the meaning of how individual words come together to form the item.
Intent of items. Data generated from cognitive interviews can help to refine the intent of items. For example, for the item that measures policies or requirements that a percentage of residents live in close proximity to a park, the intent is to understand whether or not there are policies or requirements that a defined percentage of people live close to a park. However, the respondent might interpret the item’s intent as whether there is community interest in parks, so he or she may respond “strongly agree” even if there are no policies or requirements in place. Clarifying intent, an important aspect of questionnaire development, can be assessed through cognitive interviewing and may lead to emphasizing words in an item, such as “policies and requirements”, by using formatting such as italics, bold font, or underlining key word or phrases.
Meaning of items. In the example above, several words must come together for a respondent to answer the item accurately. He or she must understand not only what is meant by a policy or requirement but also what is meant by percentage, residents, living, proximity, and park. For example, proximity is a word that is clearly subject to interpretation. What might be considered close for some individuals is not close for others. The cognitive interviewing process may help questionnaire designers to decide whether or not to include instructions that define words like proximity for respondents.
IV. Concluding Remarks
This validation protocol summarized two methods, establishing content validity and conducting cognitive interviews, for refining the items and the two brief questionnaires. These methods build on our earlier work of establishing face validity through literature reviews, a review of existing instruments, and iterative communication with the committee.
After a final set of items are endorsed by stakeholders, and when the items are interpreted and responded to by the target population as intended, researchers should then consider how these items might be included in existing surveillance systems (for example, as part of existing scales or as new scales). From there, researchers may want to initiate a validation study with a larger sample of respondents who represent the target population. As part of this validation study, researchers may want to investigate psychometric properties such as test-retest reliability and internal consistency (for example, average inter-item correlation, average total item correlation, split half reliability, and Cronbach’s alpha). More advanced psychometric procedures involve establishing predictive validity and may require researchers to explore methods in factor analysis and structural equation modeling. When designing and conducting a validation study, researchers may want to consult with individuals who have expertise in measurement or quantitative psychology.
References
Pate, R.R., D. Berrigan, D.M. Buchner, S.A. Carlson, G. Dunton, J.E. Fulton, E. Sanchez, R.P. Troiano, J. Whitehead, and L.P. Whitsel. “Actions to Improve Physical Activity Surveillance in the United States.” NAM Perspectives. Discussion Paper, National Academy of Medicine, Washington, DC, 2018. doi: 10.31478/201809f
Trochim, William M. “The Research Methods Knowledge Base.” 2nd edition. Available at http://www.socialresearchmethods.net/kb/ (version current as of October 20, 2006).
Willis, George B. “Cognitive Interviewing: A ‘How To’ Guide.” Research Triangle Park, NC: RTI International, 1999. Available at http://www.chime.ucla.edu/publications/docs/cognitive%20interviewing%20guide.pdf. Accessed February 12, 2019.
PART II
USING GIS DATA: A “HOW TO” PROTOCOL

| FINAL |
| Revised: Using Geographic Information System (GIS) Data to Understand Community Supports for Active Transportation: A “How To” Protocol |
| February 21, 2019 |
| Rebecca Dunn Max Pohlman Andrew Hurwitz Kelley Borradaile Daniel Finkelstein |
| Submitted to: National Academies of Science, Engineering, and Medicine 500 Fifth St., NW Washington, DC 20001 Project Officer: Heather Cook Contract Number: 2000009777 |
| Submitted by: Mathematica Policy Research P.O. Box 2393 Princeton, NJ 08543-2393 Telephone: (609) 799-3535 Facsimile: (609) 799-0005 Project Director: Daniel Finkelstein Reference Number: 50688 |
CONTENTS
Purpose and organization of this protocol
How can GIS data help me identify community supports for active transportation?
II IDENTIFYING AN AREA AND CONSTRUCT OF INTEREST
IV DOWNLOADING AND STORING GIS DATA
Working with GIS tabular files
V OPENING AND PROJECTING DATA IN ARCMAP 10.2.2
VI WORKING WITH TRUSTED GIS DATA SETS
Other trusted national data sets
I. INTRODUCTION
Purpose and organization of this protocol
The purpose of this protocol is to help readers with a limited working knowledge of geographic information systems (GISs) successfully use GIS tools to assess local and national supports for active transportation in defined communities of interest. The protocol is designed to help users achieve three main objectives: (1) define an area and construct of interest aligned with community supports for active transportation, (2) capture GIS data at both the local and national level, and (3) store local and national GIS data in a central repository. Sections II, III, and IV provide detailed instructions for accomplishing each of these tasks, along with illustrative examples of community supports for active transportation at the local and national level.
Subsequent sections explore other aspects of GIS work for users who want to go beyond these three objectives. Section V describes how to manipulate GIS data using specialized software (such as ArcGIS) and provides step-by-step instructions for creating a static and multilayered map using a local data set in ArcGIS. Section V builds off of earlier sections of the protocol because in order to successfully manipulate GIS data, users must already complete the steps outlined in section II through IV. Section VI takes a more in-depth look at working with national GIS data sets, describing how they are created and the issues to consider when choosing a national database. This section also provides descriptions and examples of several national GIS data sets that users can trust.
What is GIS?
GIS is a framework for manipulating and analyzing geographic data by charting spatial locations and organizing layers of information into visualizations, such as maps and three-dimensional figures. Manipulating GIS data requires a specialized software program such as ArcMap 10.2.2, an ArcGIS Desktop software package from Esri. ArcMap 10.2.2 is the latest software supported by Esri for importing GIS data in order to conduct a variety of tasks related to the analysis of geospatial data. This software can run on desktop systems, web map servers, spatial database management systems, or be used in conjunction with programming languages to create digital maps from georeferenced data. In Section V of this protocol, which is intended for users who have some familiarity with ArcGIS Desktop, we use ArcMap 10.2.2 in our examples.
The Centers for Disease Control and Prevention (CDC) provides free introductory information on spatial data and trainings in ArcGIS.5 More advanced courses in ArcGIS are available for purchase through the Esri Academy.6
___________________
5 For more information on GIS training at CDC, see https://www.cdc.gov/dhdsp/maps/gisx/training/index.html.
6 For more information on GIS training at Esri, see https://www.esri.com/training/.
How can GIS data help me identify community supports for active transportation?
By creating maps using GIS data sets, you can highlight the community supports that have been put in place in specific areas (such as local, county, state, or national areas) to encourage active transportation by communities. Community supports for active transportation are understood through eight categories, or constructs: land-use mix, street connectivity, multimodal transport infrastructure, traffic safety, zoning and related policies, public transit, parks, and programs.7
You can both identify and visualize detailed features of geographic space in your given area to better understand factors such as street connectivity, traffic volume, and ease of access for pedestrians and cyclists. You can then use this information to gain insights into the level of community support for active transportation.
__________________
7 For more information on the constructs, Pate et al. (2018). Actions to Improve Physical Activity Surveillance in the United States. Discussion Paper for National Academy of Medicine.
II. IDENTIFYING AN AREA AND CONSTRUCT OF INTEREST
This section defines two key concepts necessary for successfully working with GIS data: area and construct. As a user of GIS, you must first articulate how your selected geographic area meets the goals of your GIS project and then identify how a construct related to community supports for active transportation can be better understood via a GIS approach.
Area
The first step for creating a GIS map is to identify a geographic area of interest. This area can be a state, county, city, or smaller area such as a census block group.8 You should select the area based on your goals; for example, if you wish to understand features of a dense urban environment, you should not select a rural area like Alma, Missouri, as your area.
Construct
The relevant constructs are land use, street connectivity, multimodal transport infrastructure, traffic safety, zoning, public transit, parks, and programs. After choosing one, you can then specify a topic within the construct. In Sections III and V of this protocol, we use the “bikeability” topic, within the multimodal transport infrastructure construct, to show how to use GIS data at the local level (see the appendix for details on the topics used in this protocol).
__________________
III. CAPTURING GIS DATA
The ability to capture and store GIS data depends on the availability of a relevant GIS data set. Government agencies (at the federal, state, county, and municipal level) and academic institutions allow users to access their GIS data. For example, at the federal government level, relevant GIS data sets are available through the Open Data Initiative’s website (http://opendata.dc.gov/), including city-, county-, and state-level data.9 The Library Services Group at the Massachusetts Institute of Technology (MIT) also provides local GIS data. GIS researchers at MIT compiled a data inventory containing reliable and openly available U.S. data organized by state.10
You could also contact your local transport, planning, and public works departments or metropolitan planning organizations for additional guidance. Section VI of this protocol describes additional, trusted GIS data sets that are reliable and valid.
Capturing local GIS data
To capture local GIS data, you must first identify an area, construct, and topic. You can then capture the relevant GIS data using one of several websites. For example, let’s say our area of interest is Washington, DC; our construct is multimodal transport infrastructure; and our topic is bikeability. For our website, we choose http://data.dc.gov/, which is a reputable resource for GIS data sponsored by the DC government.
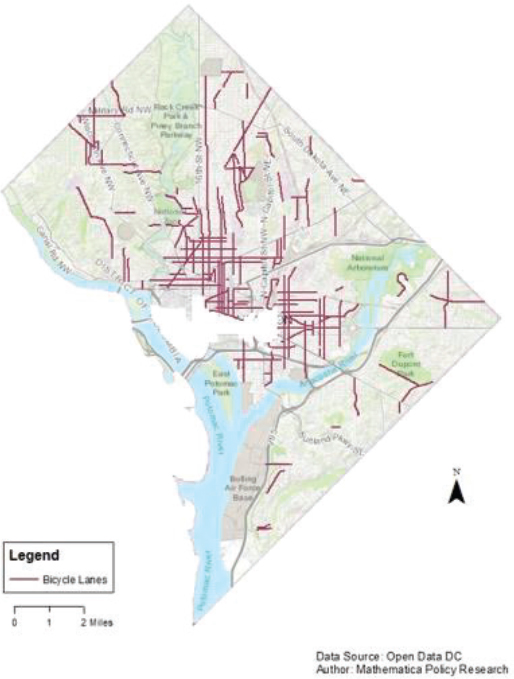
Given our focus on multimodal transport infrastructure and bikeability, we enter the term “bike” into the search bar, which returns two data sets: “bicycle lanes” and “bicycle trails.” Selecting the data set “bicycle lanes”11 returns a map at the top of the page that highlights in blue all existing bicycle lanes in Washington, DC.
Many local government websites that contain data sets are organized in a similar way as DC’s, with a page showing a visual map of the data set, a description of the data set, and options for downloading the data. To enable users to further refine their search or identify other constructs, some sites have a section at the bottom or side of the page for related data sets (i.e., other data sets which are similar to the results returned for the current search). Step 10 in Section V of this protocol describes how to incorporate multiple constructs into one data set to create multilayered maps.
Capturing national GIS data
In our discussion below about capturing national GIS data, we use a specific national data set for illustrative purposes. Section VI provides additional options for trusted national GIS data sets.
___________________
9 For more information on the Open Data Initiative, see http://opendata.dc.gov/
10 For more information on MIT’s GIS data, see https://libguides.mit.edu/c.php?g=176295&p=1161385.
11 For more information on this data set, see http://opendata.dc.gov/datasets/bicycle-lanes.
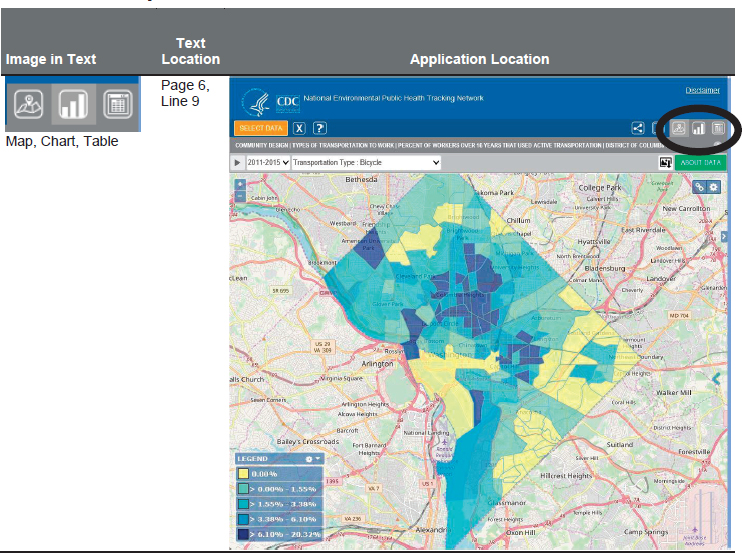
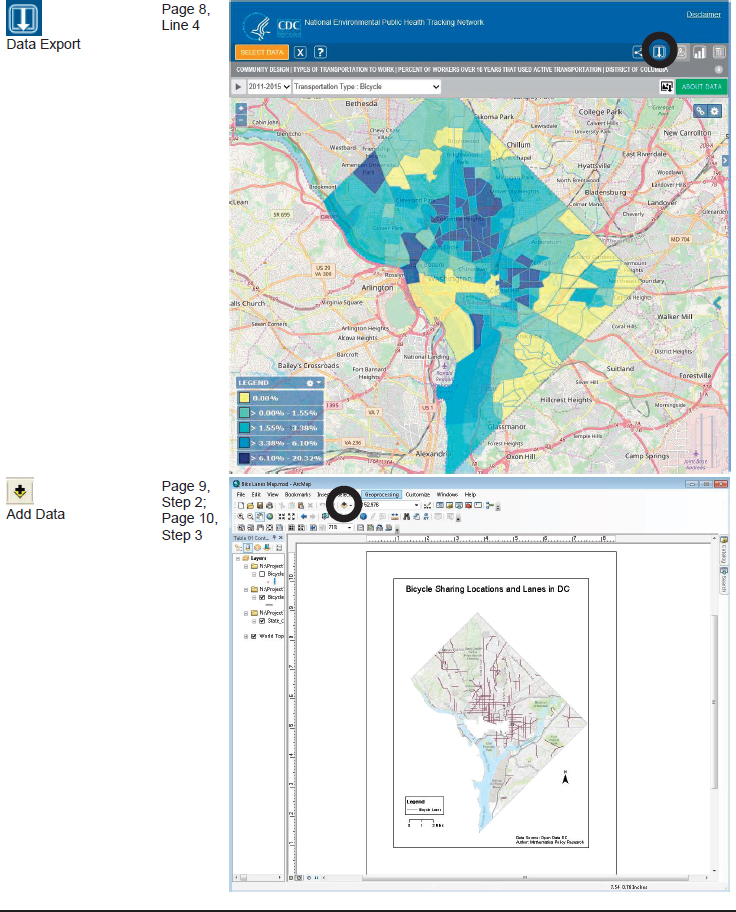
CDC houses several GIS data sources, including the National Environmental Public Health Tracking Network.12 This data set contains a wide variety of national health data, including information on environments and hazards, health effects, and population health, and it includes a web application for easy manipulation.13 When you open the web application for the first time, the site will prompt you to select which data to access. To return to this navigation page at any time, click the orange “Select Data” button on the top left, select the data, and click the “Go” button. A map will populate showing the locations and metrics specified.
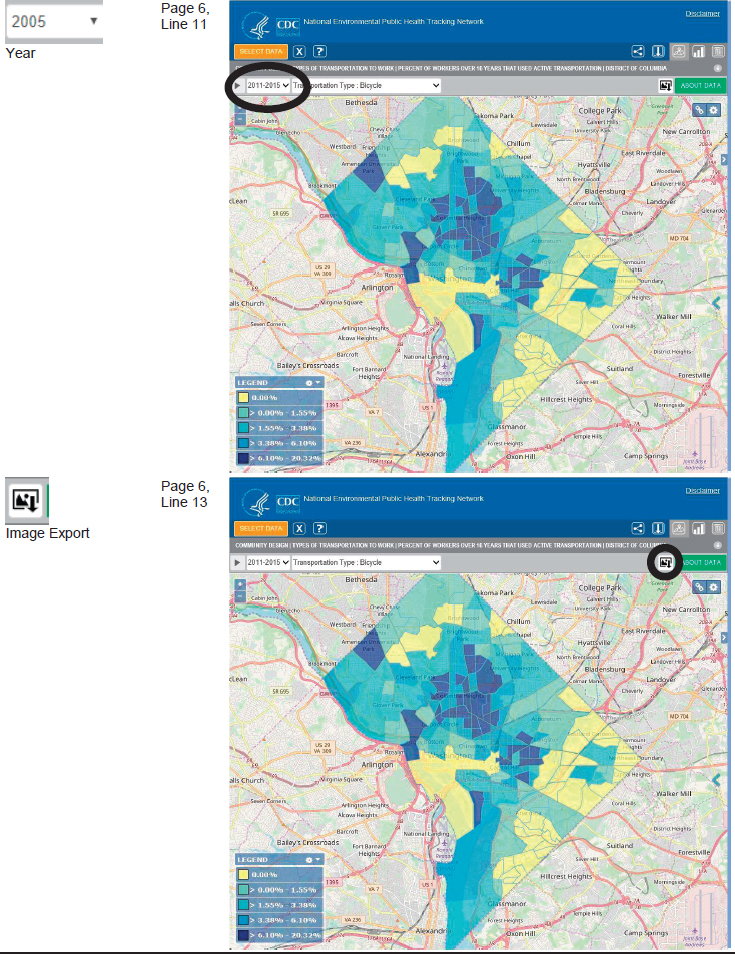
Switch the view from the map to a bar chart or a table using the view buttons on the top right:  . If multiple years of data are selected, note that only one year will be displayed at a time. You can change the year by using the dropdown menu on the top left:
 ![]() .
.
If you want to save the map or chart as an image, you can download the current viewport, complete with a title and source, by clicking the download image button: ![]() .
.
___________________
12 For more information on the network, see https://ephtracking.cdc.gov/showHome.action.
13 For access to the Data Explorer web application, see https://ephtracking.cdc.gov/DataExplorer/#/.
IV. DOWNLOADING AND STORING GIS DATA
If you wish to do more than simply view a single data set via a web application, you will need to download and store GIS data on a local computer. GIS data can come from shapefiles, which store data containing relevant geometric properties, or tabular files, which may contain coordinates for marking latitude and longitude but lack relevant geometric information. Shapefiles, which are discussed further in Section V, are the most common repository for spatial data and end with the .shp extension. Although this file type was originally developed by Esri for ArcGIS software, it has become universal, and any GIS data-processing software should be able to read and write it.
Working with GIS shapefiles
Shapefiles with .shp extensions are always accompanied by files with .shx and .dbf extensions. The .shx file contains information in code language about the shapefile and the .dbf file represents the local database for how the shapefile was saved. You should not need to use these adjacent files directly when conducting GIS analysis but should make sure they are present in the same folder as your shapefile. When you download a shapefile, or when the software writes a shapefile to your computer, these additional files are generated. These files must be present in the folder when you import the data into a program. In addition, when sharing data with another user, always include these additional files. Certain types of spatial data have more secondary files than other types of data; therefore, when writing to a shapefile, it is a good idea to keep all files relevant to that shapefile in a designated project folder.
Shapefiles usually contain spatial data at a 1:1 rate of data set per file; in terms of geographic features, for example, state boundaries would be one shapefile, rivers would be another shapefile, and roads would be a third shapefile. Despite the data being isolated, you can incorporate multiple shapefiles into a single map. In ArcGIS, these shapefile data sets are classified as separate “layers” of a map.14Section V describes how to import a geographic data set to create a layer on a map.
Working with GIS tabular files
GIS sites sometimes provide the option to download a .csv file of the data set. A .csv or any other tabular file (for example, .xlsx) contains data in an easy-to-read, easy-to-write format. But .csv files do not contain any references to geometries, even if there are columns with latitudes and longitudes. To show tabular data in a spatial context, you will need to use GIS software to join the data with a spatial data file, such as a shapefile. The most common files to use for joining tabular files to spatial data are the U.S. Census Bureau’s state or county shapefiles, which can be found on a number of official government websites15.
__________________
14 For more information on ArcGIS layers, see http://desktop.arcgis.com/en/arcmap/10.3/map/working-withlayers/what-is-a-layer-.htm.
15 For more information, see http://opendata.dc.gov/
Downloading GIS data
You can download and save a captured data set to a computer. In the example of bicycle lanes in Washington, DC, you can click the “Download” button in the top right corner. To download data from the National Public Health Network’s web application, click the export button: ![]()
The downloaded files will save as a .zip file. To unzip the file, right-click and select “Extract all” to view and manipulate the files inside. As discussed earlier, the unzipped folder will contain a couple of different types of files, such as shapefiles (.shp).
Creating a geodatabase
If you are identifying multiple areas and constructs, and then following the steps in this section and Section III to download and store multiple data sets, you may want to create a file geodatabase. A geodatabase will enable you to collect numerous geographic data sets in one large file, denoted by a .gdb extension.16 Instead of storing multiple shapefiles in different folders, a geodatabase can help you organize your data in one central location.
Supplemental sections
The remaining sections of this protocol are for users who are interested in going beyond capturing, downloading, and storing GIS data for areas, constructs, and topics of interest. Section V discusses how to manipulate GIS data in ArcGIS (other software options are available, but we focus on ArcGIS because it is popular and easy to use). Section VI provides tips for assessing the credibility of national GIS data sets, and provides additional trusted sources of GIS data related to community supports for active transportation.
__________________
16 For more information on creating a geodatabase, see http://desktop.arcgis.com/en/arcmap/10.3/managedata/geodatabases/a-quick-tour-of-the-building-geodatabases-tutorial.htm.
V. OPENING AND PROJECTING DATA IN ARCMAP 10.2.2
Identifying, capturing, and storing GIS data is a useful way to build a robust library of relevant GIS data sources. However, to capitalize on the benefits of these data, a user needs to work with the data in a GIS program such as Esri’s ArcGIS Desktop. This section focuses on the ArcMap 10.2.2 interface. It describes how to open and project a simple map and introduces the “Join” function, which enables you to add supplemental data to one or more basemap layers or to the “bottom,” foundational layer of a map. Basemaps are foundational layer maps which allow for more advanced maps to be projected.17 This section also provides tips on how to make a visually impactful and accurate map using the layout view.
For simplicity, we will continue to use Washington, DC; the multimodal transport infrastructure construct; and the bikeability topic in our instructions below. However, these instructions can be applied to any area or construct.
- Preparing the data set. First, prepare the data for use in ArcMap 10.2.2. To do this, ensure that the variable names are no more than 10 characters long and do not contain dashes, spaces, or brackets. (Many government shapefile data sets are already prepared for use in ArcMap 10.2.2.)
-
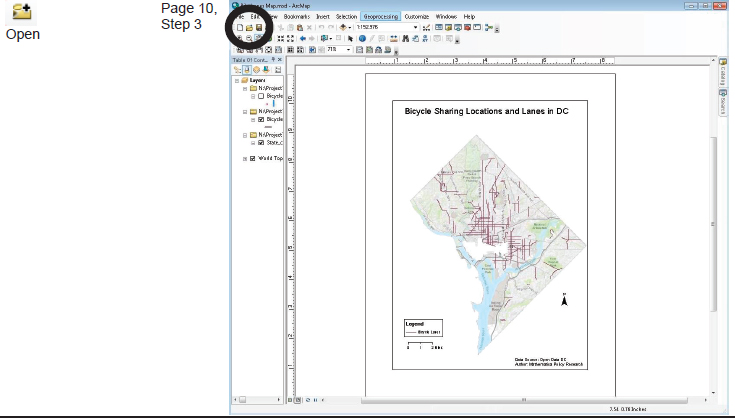
Getting started with ArcMap. Open ArcMap 10.2.2 by clicking the icon on the desktop or selecting the program from your computer’s start menu. To get started, add a preloaded basemap by clicking on the “Add Data” icon
 and selecting “Add Basemap.” ArcMap has several preloaded data sets to choose from, including streets, topography, U.S. Geological Survey (USGS), and terrain. Since our focus is on active transportation, the best option to select is “topographic”. The World Topographic Map, also known as “the community basemap,” includes administrative boundaries, cities, water features, parks, landmarks, highways, roads, buildings, and other features overlaid on land cover. This example is instructive because it shows a large variety of features, from natural to manmade, which may affect active transportation. Depending on your research questions, you may want to select a map with fewer features, such as streets or terrain only.
An alternative to using preloaded basemaps is to download geographic shapefiles from the U.S. Census Bureau’s TIGER/Line® shapefiles, which include options for geographic areas and features such as roads, railways, and water.18 Another option is to download data from OpenStreetMap (http://openstreetmapdata.com/data), a collaborative open-source project containing a myriad of physical and natural features including roads, buildings, amenities (such as healthcare and schools), natural resources, and more.19
- Defining the boundaries of the data set. Boundary shapefiles are available from Esri or the U.S. Census Bureau.20 (See Section II to recall which area was selected and which
__________________
17 For more information about basemap layers, see http://desktop.arcgis.com/en/arcmap/10.3/map/working-withlayers/working-with-basemap-layers.htm.
18 To download TIGER/Line® shapefiles, see https://www.census.gov/geo/maps-data/data/tiger-line.html.
19 To download OpenStreetMap data, go to http://openstreetmapdata.com/data.
20 An example of shapefiles are cartographic boundaries. For more information on these files, see https://www.census.gov/geo/maps-data/data/cbf/cbf_state.html.
- boundaries are needed for a map, such as state, county, or city boundaries.) After downloading a boundary shapefile (following the steps in Section IV), you can add it as a “layer” to your map in ArcMap. For example, download a Washington, DC, boundaries layer,21 and add it to the map by clicking the “Add Data” icon:
 In the menu that appears, click the “Connect to a Folder” icon:
  Navigate to the folder that contains the saved shapefile on your computer (for example, you can designate files to a local folder, GIS_Files) and click “OK.” Now that the appropriate folder is connected to ArcMap, select the appropriate layer by navigating through the folder structure, and click “Add.”22
 -
Using a spherical projection system. Because the earth is a sphere, projecting it onto a flat surface causes distortions. As a result, using an unprojected map for analysis purposes leads to inaccurate results. To restore accuracy to the shape, area, distance, or direction of a map, it is necessary to project the map using a projected coordinate system.
To do this, right-click the map and select “Data Frame Properties.” Go to the “Coordinate System” tab and select the appropriate system, such as “Albers Equal Area Conic,” in the search box. Select “Projected Coordinate Systems” → “Continental” → “North America” → and click “OK.” Note: use the Albers Equal Area Conic projection system whenever mapping the entire U.S. or other countries or continents that are mainly East-West in orientation. For smaller geographic areas, other projection systems are preferable23.
- Cropping basemaps. Given that ArcMap’s basemaps include data from all around the world, you might want to crop the selected basemap to a specific area. To do this, click the “View” menu and “Choose Data Frame Properties.” In the “Data Frame” tab, look for “Clip Options,” and choose “Clip” to shape. In the “Specify Shape” box, select “Outline of Features,” choose the appropriate boundary layer, and click “Apply.” The basemap will now be cropped to the specified boundaries.
-
Using an appropriate color scheme. Notice that the imported Washington, DC, boundary layer is solid blue, which obscures the basemap. To change a layer to a different color or hollow (no-fill), double-click the box below the layer name in the “Table of Contents.” The outline width, color, and other style preferences can also be modified. When choosing colors, it is best to use pale yellows, greens, and light browns to represent land. Avoid using blues for land because blue is typically associated with water. When there are several shades of the same color on a map, the darker shades tend to connote more of something (such as a higher density of people or greater incidence of crime).
Try to limit a map to no more than three colors and no more than three symbols (for example, circle, square, or star to represent landmarks). Limiting the number of colors and symbols will make the map more user-friendly. Be mindful that if the map is going to be printed, not all colors may print as they appear on the computer screen. If this is a major concern, consider using gray scale for the map.
__________________
21 For more information on the Washington, DC, boundary layer, visit http://opendata.dc.gov/datasets/state-ofwashington-dc.
22 You can right-click and select “Zoom to Layer” in the “Table of Contents” on the left side of the screen to quickly zoom in on an area to examine.
23 See the Projection and Coordinate fact sheet in Appendix C of the ArcMap users’ manual for more details.
- Adding layers to the map. To add a layer to the map saved in Section IV—for example, the bike lanes shapefile—follow the directions in Section III. If you are a more advanced ArcGIS user, pull data from the file geodatabase created in Section IV.
-
Viewing and printing the map. There are now three layers in the “Table of Contents” on the left panel of ArcMap: bicycle lanes; the state boundaries of Washington, DC; and the topographic basemap. Having learned the basics of adding data to a map, you can begin to create a map suitable for dissemination. In “Layout View,” add important features such as a map legend, scale bar, and compass, which will make the map easier to interpret. (Keep in mind that the goal of a map is to convey a message to a general audience with as little text as possible.) Click “View” → “Layout View” to see what the map will look like upon printing or exporting.
- To ensure that the map prints correctly, go to “Page and Print Setup” to change the orientation to landscape, if necessary.
- Click “View” → “Data Frame Properties → “Size & Position” to change the length, width, and height of the map.
- Insert a scale bar and compass (for example, a north arrow). Make sure to size the scale bar and north arrow so that it does not draw attention away from the map.
- Insert a legend. The legend reflects the same naming conventions used in the “Table of Contents.”
- Adjust the map scale to show only the appropriate area.
- Include an appropriate title and add a text box to cite the data source and author.
- Outputting the map. Output the map to a .jpeg file by clicking “File” → “Export Map” → “Save as Type: JPEG.” Figure V.1 shows the final version of the map created following Steps 1–9.
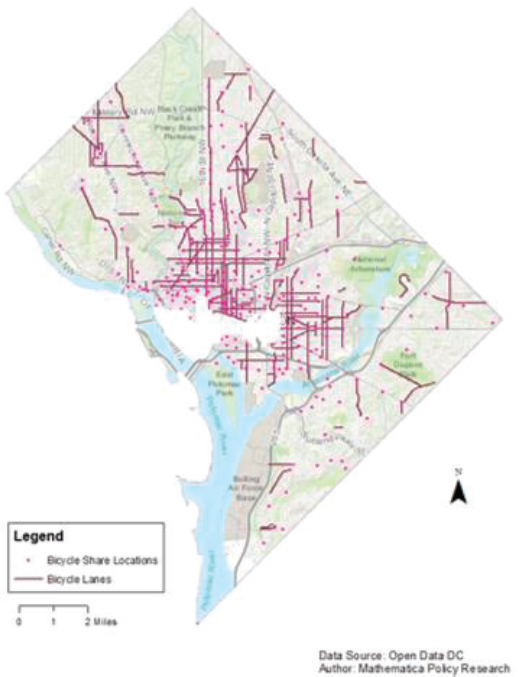
- Creating multilayered maps. You can also create multilayered maps, such as maps with multiple constructs. Suppose you want to make a multilayered map that includes all locations of programs that offer a “bike share” option, in addition to bike lanes, in Washington, DC. One example is Capital Bikeshare, a program that enables people to rent bicycles for a small fee throughout DC and drop the bicycles off at designated locations.24 When downloading the relevant GIS data (see Section IV for guidelines), you should include not only the bicycle lanes but also the Capital Bikeshare program locations. Once the data are downloaded, repeat Steps 1–9 in this section.
__________________
24 For more information about Capital Bikeshare, see https://www.capitalbikeshare.com/.
Figure V.2 shows the final version of the map created by following Steps 1–10.
VI. WORKING WITH TRUSTED GIS DATA SETS
Local and national GIS data are only as reliable as their source. Some data sets that are publicly available online are created by novice GIS users, so beware of simple Google searching when looking for relevant data sets. It is important to identify and use only reliable data.
Data sets from government sites and universities and for purchase from software sites like Esri are more reliable than data sets found on blogs, message boards, and private sites. This is because mapping something spatially is a complex process, with many opportunities for small errors. Data that come from a professional or government-sponsored database are generally held to a higher standard.
National data sets
National data sets show locations and relationships across the United States. Well-constructed national data sets provide homogenous criteria that can be used to compare and contrast locations. For example, the USGS National Transportation Data Set25 enables users to visualize landmarks such as airports and railroads across the United States, providing information on the regions accessible via these modes of transportation.
These national data sets are made up of smaller data sets that may not be based on similar geographic units—some may have data only at the state level, others at the metropolitan or county level, and others at the census track or block group level. For example, the USGS data set contains more than 50 smaller data sets, each corresponding to a different state or U.S. territory. Being able to identify the method used to construct the smaller components of a national data set (in the case of the USGS data, the 50 states and the territories) is important because the method must be standardized in order for intercomponent comparisons to be accurate.
For example, suppose you want to map hiking trails across the United States. First, you must define what is meant by a “trail.” A trail in one state might not be defined the same way as in another, even when the data come consistently from a reputable source. For example, Massachusetts derives its trail data from its department of transportation, whereas Connecticut derives its trail data from its department of environmental protection. Even though both departments are reputable sources of GIS data, the criteria for defining trails is different between the two states, and thus their data cannot be compared.26
When comparing trail data across states, it is best to use a national data set that defines “trail” the same way for all states. The USGS data set, for example, includes trails as part of its transportation network. Although the overall data set contains more than 50 linked data sets, the information retains its internal consistency because all the data were constructed by the same federal department.
__________________
25 For more information on accessing the USGS National Transportation Data set, see http://catalog-webtest.datagov.us/dataset/usgs-national-transportation-dataset-ntd-downloadable-data-collectionde7d2.
26 Criteria for trails varies widely, with some criteria requiring the trail to be paved, officially flagged as a trail, or designated as preserved land.
Other trusted national data sets
EPA’s Smart Location Database. EPA’s Smart Location Database is a useful GIS data set for measuring location efficiency, or factors within the local context that relate to travel behavior.27 It includes characteristics such as housing density, diversity of land use, neighborhood design, destination accessibility, transit service, employment, and demographics for most census block groups across the United States.
For information on how to view the data set online or download the zip file, see the technical documentation within the user guide for the Smart Location Database.28 Use Table 1 in the user guide to identify the variables in the data set that act as proxies for your areas and constructs of interest. After downloading the zip file, follow the directions in Section IV to store the data and proceed to Section V to visualize the data in a map.
CDC’s Behavioral Risk Factor Surveillance System. Another helpful resource is CDC’s Behavioral Risk Factor Surveillance System, which consists of telephone survey data on U.S. residents’ health-related behaviors, chronic health conditions, and use of preventative services.29 Using the survey and location data from its surveillance system, CDC compiled GIS data sources and documentation, saved in zip files, for both states and metropolitan areas.30 Users can combine the survey data and GIS resources to create interesting maps and other features.
Urban Design 4 Health: Natural & Social Environmental Indicator Database. A third option is the Natural & Social Environmental Indicator Database, developed by Urban Design 4 Health and funded by the Robert Wood Johnson Foundation. This database focuses on the use of standardized metrics to assess features of neighborhood environments known to predict physical activity and overall health.31 The datasets contained in this database are not currently available to the public for download but they are searchable and available to the public at the Urban Design 4 Health website.
__________________
27 For more information about the Smart Location Database, see https://www.epa.gov/smartgrowth/smart-locationmapping#SLD.
28 The Smart Location Database’s user guide is located at https://www.epa.gov/sites/production/files/201403/documents/sld_userguide.pdf.
29 For more information on the Behavioral Risk Factor Surveillance System, see https://www.cdc.gov/brfss/about/index.htm.
30 GIS data and documentation on the Behavioral Risk Factor Surveillance System are located at https://www.cdc.gov/brfss/gis/gis_maps.htm.
31 For more information on the Natural & Social Environmental Indicator Database, see http://urbandesign4health.com/projects/ned.
VII. CONCLUDING REMARKS AND FURTHER RESOURCES
The aim of this protocol was to provide users with some working knowledge of GIS resources and how to use GIS tools to assess local and national supports for active transportation in defined communities of interest. We recognize that some users may be ready to pursue more advanced GIS activities and thus we provide two resources to support these efforts. The first resource was developed by Ann Forsyth and describes methods for measuring environmental variables for walking using GIS procedures (http://designforhealth.net/resources/other/gisprotocols/). The second resource was developed by the International Physical Activity and Environment Network (IPEN). Some of the key aims of the IPEN are to stimulate research in physical activity and the environment, and recommend common methods and measures (https://www.ipenproject.org/index.html).
VIII. APPENDIX: LINKING THE TERM “BIKEABILITY” TO THE CONSTRUCT “MULTIMODAL TRANSPORT INFRASTRUCTURE” AND CAPTIONS AND SCREEN SHOTS
Table VIII.1 connects the term “bikeability” used in this protocol with the appropriate construct of “multimodal transport infrastructure” documented in Pate at al. (2018). It also provides the sections where the term “bikeability” is used.
Table VIII.1. Identifying the term “bikeability” in the protocol
| Term | Description | Construct | Sections |
|---|---|---|---|
| Bikeability | Bicycle facilities; bicycle lanes; separated lanes; neighborhood streets; bicycle boulevards; cycle tracks | Multimodal transport infrastructure | II, III, V |
Table VIII.2 provides additional screen shots to better highlight the action figures presented throughout this protocol.
Table VIII.2. Captions and screen shots
Improving public well-being by conducting high quality, objective research and data collection
PRINCETON, NJ ■ ANN ARBOR, MI ■ CAMBRIDGE, MA ■ CHICAGO, IL ■ OAKLAND, CA ■ SEATTLE, WA ■ TUCSON, AZ ■ WASHINGTON, DC ■ WOODLAWN, MD

PART III
USING AUDIT OBSERVATION DATA TO UNDERSTAND COMMUNITY SUPPORTS FOR ACTIVE TRANSPORTATION: A “HOW TO” PROTOCOL

| FINAL |
| Revised: Using Audit Observation Data to Understand Community Supports for Active Transportation: A “How To” Protocol |
| February 21, 2019 |
| Andrew Hurwitz Kelley Borradaile Daniel Finkelstein |
| Submitted to: National Academies of Science, Engineering, and Medicine 500 Fifth St., NW Washington, DC 20001 Project Officer: Heather Cook Contract Number: 2000009777 |
| Submitted by: Mathematica Policy Research P.O. Box 2393 Princeton, NJ 08543-2393 Telephone: (609) 799-3535 Facsimile: (609) 799-0005 Project Director: Daniel Finkelstein Reference Number: 50688 |
CONTENTS
Purpose and organization of this protocol
How can audit observation data help with identifying community supports for active transportation?
II ASSESSING ENVIRONMENTAL DETAILS USING AUDIT DATA
Approaches for conducting audits
Feasibility of using audit data to assess community support for active transportation
Integrating audit and GIS data
TABLES
I. INTRODUCTION
Purpose and organization of this protocol
The purpose of this protocol is to introduce readers to the key elements for planning an audit observation study to assess community supports for active transportation. Section I defines audit observations and how they may be used to study community supports for active transportation. Section II provides a more detailed examination of audit observations by describing approaches for conducting audits, tradeoffs for using the various approaches, the feasibility of using audit observations to measure key constructs associated with community supports for active transportation, and methods for integrating audit data with geographic information system (GIS) data.
How can audit observation data help with identifying community supports for active transportation?
Audits are systematic observations of communities and can be used to identify community features for analysis and policy decision making. Community supports for active transportation are understood through eight categories, or constructs: land-use mix, street connectivity, multimodal transport infrastructure, traffic safety, zoning and related policies, public transit, parks, and programs.32 By conducting audits, researchers, planners, and other stakeholders can document relevant features within communities that support active transportation. For instance, the construct “multimodal transport infrastructure” is defined through examples such as sidewalks, bike facilities, traffic-calming features, and street-crossing design, so an individual could include a sidewalk assessment as part of an audit protocol. Using data generated from the audit observation, one could understand how well sidewalks are maintained in order to better understand one element of the construct multimodal transport infrastructure. These methods can supplement GIS-related work or can be conducted independently. Audits may be particularly useful for assessing characteristics of the built environment that are typically missing in GIS databases, such as sidewalks, crosswalks, street furniture, and aesthetics. In contrast, audits cannot be used for assessing zoning or programs.
__________________
32 For more information on the constructs, Pate et al. (2018). Actions to Improve Physical Activity Surveillance in the United States. Discussion Paper for National Academy of Medicine.
II. ASSESSING ENVIRONMENTAL DETAILS USING AUDIT DATA
Approaches for conducting audits
When deciding on an approach for conducting audits to assess community support for active transportation, one should consider a number of options and priorities. The first decision is whether humans or machines will conduct the audit. The majority of this protocol refers to human conducted audits since machine methods are new and still emerging. Assuming humans are selected to conduct the audit, the second question is whether the audit will be conducted live or remote. A third question is whether to use citizen scientists or trained professionals. When using citizen scientists, a final question concerning whether or not to use a qualitative or quantitative approach must be determined. These various approaches are described below.
- Humans v. machine learning methods. A first consideration for conducting audits is whether to use human observers or a machine learning approach. With machine learning, datasets with labeled images are used to train supervised learning algorithms to recognize features of the image and appropriately code the different features. After the algorithms have ‘learned’ from the training data, future images are automatically labeled with the correct features of the given landscape. These image-based machine learning methods are not well established so their reliability and validity is uncertain. Although not recommended as a main source for conducting audits, this method has been included in this protocol because it is an approach that could be used more widely in the future.
- Live or remote audit methods. Assuming human observers are selected to conduct the audit, another consideration is whether the audit will be conducted live or remote. Live methods involve humans going out into the field, walking the communities where the audit is being conducted, and making their observations in real time. Remote methods involve humans conducting their audits remotely in their office or home, using tools like Google Street View to extract data on the relevant features of a community.
- Citizen scientists or trained professionals. A third consideration with human observers is whether to employ citizen scientists or trained professionals (for example, professional planners, civil engineers, or public works employees). Citizen scientists are members of the public who are interested in participating in research or science-related efforts. Citizen scientists may or may not be trained and certified in collecting audit data. On the other hand, trained professionals are familiar with the tools for completing an audit exercise, and already conduct audits (both live and remote). These individuals may produce high quality audits compared to citizen scientists, but these audits come at a cost. Professionals may be substantially more expensive than even certified citizen scientists so this approach may not be as scalable as using citizen scientists.
- Qualitative or quantitative approach. The final consideration with human observers is whether to use a qualitative or quantitative approach. This determination only comes into question when selecting citizen scientists to conduct audits because trained professionals almost always use a standardized, quantitative tool for the observation. The qualitative approach does not require the human observer to receive any standardized trainings or certifications to conduct community observations. While this approach may be useful for advocacy work, it is not appropriate for surveillance work and will not be discussed further in this protocol. In contrast, the quantitative approach is considered to be more rigorous and
- robust, and therefore, appropriate for surveillance work. The approach of using citizen scientists to conduct quantitative audits requires a tool developed by a group such as the American Planning Association, and requires the completion of a training for certification. The cost and time associated with training is considered a key drawback of this approach but as discussed earlier, trained and certified citizen scientists may still be less expensive than professional experts. Of note, the quantitative approach could be supplemented with qualitative comments and photos for a richer assessment.
In the next section, we discuss the feasibility of using audit data to assess community support for active transportation.
Feasibility of using audit data to assess community support for active transportation
Audit data can be useful in assessing many of the eight constructs associated with community supports for active transportation, but audits also have their limitations. The ranking shown in Table II.1 reflects the feasibility of using audits to assess the relevant eight constructs. We determined feasibility based on whether the constructs had static or changeable features. Constructs that are stable (i.e., do not move) lend themselves to easier observation (for example, land space and streets) because an observer can focus their attention on features of the construct without interruption. Changeable constructs—those subject to movement or affected by factors like time of day—are more difficult to assess via audit methods. Other constructs like zoning and programs are infeasible to assess via audit methods because they do not necessarily represent visual features of communities.
Table II.1. Feasibility of assessing constructs via audit methods
| Constructs | Human conducted live or remote audit methods |
|---|---|
| Land use | 1 |
| Street connectivity | 1 |
| Multimodal transport | 2 |
| Traffic safety | 3 |
| Zoning | N/A |
| Public transit | 2 |
| Programs | N/A |
| Parks | 1 |
1 = High likelihood of success with method
2 = Moderate likelihood of success with method
3 = Low likelihood of success with method
N/A = Not viable to assess with method
In the next section, we discuss integrating audit data collected using human observers with GIS data.
Integrating audit and GIS data
Audit and GIS data can be combined to provide a rich perspective in geospatial analysis on community supports for active transportation. In order to integrate audit and GIS data, an auditor must first identify an area and construct of interest. Next the auditor follows the four key steps below. In the example below, the auditor has identified a local community as their area of interest and selected parks as their construct.
- Identifying salient features. The first step is to identify landmarks within the park or other elements of saliency. Features of parks (for example, playgrounds or walking trails) are examples of salient elements that are supportive of physical activity.
- Scoring salient features. Once the salient features are identified, the auditor uses their standardized coding scheme to appropriately rate each feature. One simple example of scoring would be to have a standard scale from 1 to 10, where 1 denotes observations of features which do not meet expectation and 10 denotes observations of features which exceed expectation. Using this scaling approach, higher scores indicate features that are more supportive of active transportation. The auditor then sums the scores across features for each construct.33
- Data entry. After calculating scores for each construct of interest, a trained data entry technician should enter the scores into a specified database. The trained technician should have been exposed to key logical coherency and reasonableness rules to ensure quality data entry and reduce future burden on the analyst.
- Data analysis. Upon the completion of data entry, a trained data analyst can then perform the appropriate cleaning and reduction techniques to ensure the data’s logical coherency and reasonableness. In order to prepare the data for integration and analysis with GIS data, the analyst should assign the appropriate geocodes so the data is ready for integration. The US Census Bureau (https://geocoding.geo.census.gov/geocoder/)34 is a trusted source for assigning geocodes. Once the geocodes are assigned, the data analyst should conduct a merge using the appropriate software (for example, Excel, SAS, R) to integrate observations from the audit with the relevant GIS data. For information on how to successfully work with GIS data, users should review the “Using Geographic Information System (GIS) Data to Understand Community Supports for Active Transportation: A “How To” Protocol on the use of GIS data to understand community supports.
__________________
33 It is important to point out that the methods for deriving a domain or construct score are not well-established at this time.
34 For more information on geocoding https://geocoding.geo.census.gov/geocoder/
Concluding remarks
Audit observation methods are useful for documenting features of communities to understand supports for active transportation that are not present in GIS data. This protocol summarizes various approaches to conducting audits, and weighs the tradeoffs that planners should consider when selecting one of these approaches. In this protocol, we also discuss the feasibility of using audit data to measure the eight constructs associated with community supports for active transportation, as well as how to integrate audit and GIS data to produce a more comprehensive understanding of community supports for active transportation.
Improving public well-being by conducting high quality, objective research and data collection
PRINCETON, NJ ■ ANN ARBOR, MI ■ CAMBRIDGE, MA ■ CHICAGO, IL ■ OAKLAND, CA ■ SEATTLE, WA ■ TUCSON, AZ ■ WASHINGTON, DC ■ WOODLAWN, MD

This page intentionally left blank.


