
3
Quantification of Legionnaires’ Disease and Legionella
This chapter addresses what is known about the incidence of Legionnaires’ disease from surveillance systems and the occurrence of Legionella bacteria in water systems including the methods used to collect both clinical and environmental data. Both the tracking of disease incidence and monitoring the number of Legionella bacteria in various water systems are fraught with difficulties. These difficulties include deciding who to test, where and when to sample the environment, what methods to use, and how to interpret the data. Despite these challenges, advances have been made and are likely to continue as legionellosis becomes a higher public health priority.
Most cases of Legionnaires’ disease are never linked to any specific environmental source, for many reasons. Most individuals are never diagnosed, even among those who seek medical care. Those who are diagnosed may have no associated clinical isolate to confirm the results of the urinary antigen test (UAT). Sampling for Legionella in buildings is routine in the United States for only a subset of acute care hospitals and other potential sources such as hotels. In addition, most states do not have the capacity to investigate environmental sources of Legionnaires’ disease, with few environmental microbiologists or engineering experts on staff in public health departments. It is still the case that information on Legionnaires’ disease stems mostly from investigations of recognized outbreaks, which account for only 4 percent of cases in the United States (Hicks et al., 2011). Not known is whether the environmental exposures found in outbreak investigations accurately represent the exposures for the majority of cases.
More information is needed about environmental exposures that result in disease in order to estimate their risk. To assess the level of risk of Legionnaires’ disease, a quantitative microbial risk assessment (QMRA) framework can be designed using an estimate of the concentration of Legionella pneumophila (the pathogen most likely to cause disease) associated with a particular source (e.g., showerhead, hot tub, cooling tower) combined with dose-response information about the bacterium. As quantification of viable Legionella in water samples increases, this framework can be used to better understand which environmental exposures are most likely to lead to cases of legionellosis. This chapter ends with a discussion of the role of QMRA in linking clinical and environmental data and informing subsequent actions as well as in determining risk-based numerical values for Legionella in water.
INCIDENCE OF LEGIONELLOSIS IN THE UNITED STATES
To quantify Legionnaires’ disease incidence, national surveillance is undertaken that builds on local and state surveillance efforts. All states require that public health authorities be notified of those diagnosed with Legionnaires’ disease or Pontiac fever. In turn, states voluntarily report their numbers to the U.S. Centers for Disease Control and Prevention (CDC). Separately, states also report waterborne disease outbreaks to the CDC, including those caused by Legionella. Together this information serves as a basis for quantifying the incidence of Legionnaires’ disease and contributes to our knowledge of the epidemiology of the disease. Before describing the nation’s Legionella surveillance systems, the diagnostic tests used to identify cases of Legionnaires’ disease are briefly reviewed (building on the Chapter 2 discussion).
Diagnostic Tests for Legionellosis Used in Surveillance
According to CDC, the preferred diagnostic tests for Legionnaires’ disease are culture of lower respiratory secretions on selective media and the urinary antigen test. Serological assays can be nonspecific and are not recommended in most situations, while polymerase chain reaction (PCR) is utilized by some academic and reference laboratories.
Culture of sputum or bronchoalveolar lavage specimens from pneumonia patients is important to determine if Legionella is the causative agent, regardless of species and serogroup. L. pneumophila forms colonies on buffered charcoal yeast extract agar within three to five days. As discussed in Chapter 2, most non-pneumophila Legionella species (spp.) may require longer incubation times and different media, and some culture media do not support growth of certain non-pneumophila Legionella spp. Culturing Legionella is challenging because of the needs for a lower-respiratory specimen and technical expertise in the laboratory. Furthermore, a history of prior antibiotic use interferes with culture. Most hospitals do not routinely culture sputum for Legionella, although some academic health centers routinely culture bronchoscopy specimens in patients with pneumonia of unknown etiology. Culture methods are critically important to epidemiologic investigations because molecular analysis can link clinical isolates to environmental samples to document the source of the exposure.
Most patients with reported Legionnaires’ disease are diagnosed as a result of a positive Legionella UAT, which is available at commercial laboratories. Its advantages include ease of use, relatively high sensitivity, and the ability to noninvasively diagnose L. pneumophila serogroup 1. The UAT also has a rapid turn-around time (within hours), but this benefit is only available at the 25 percent of acute-care hospitals that conduct the test on site; otherwise, one to three days or more are required (Garrison et al., 2014; McClean et al., 2010) or sometimes longer, particularly for sites that send samples to outside laboratories. The UAT’s selectivity for L. pneumophila serogroup 1 means that patients with clinically important non-serogroup 1 L. pneumophila infections and non-pneumophila Legionella infections will be missed. Finally, as mentioned in Chapter 2, UAT results can be negative early in the disease course and are less likely to be positive with less severe disease (Mercante and Winchell, 2015).
Serology is a valuable tool for epidemiologic studies, but it has little clinical impact because of the delay in receiving results (Reller et al., 2003). Blood samples taken three to six weeks apart are analyzed for rises in antibody titer to Legionella. In most cases of Legionnaires’ disease, a four-fold increase in antibody titer is detected within three to four weeks although it may take longer. Thus, both sensitivity and specificity of serologic tests can be problematic.
Molecular testing for L. pneumophila consists of highly sensitive PCR and other nucleic acid amplification tests. Most published studies utilize PCR testing that targets the macrophage infectivity potentiator (mip) surface protein of L. pneumophila (similar to the PCR tests done for environmental samples). As discussed in Chapter 2, PCR tends to detect more cases than UAT and culture tests, and it has the additional advantage of being useful in patients who are already on antibiotic therapy. PCR methods can currently detect L. pneumophila serogroup 1 and a few non-pneumophila species (Benitez and Winchell, 2013; Cross et al., 2016; Merault et al., 2011). Importantly, PCR for Legionella has been limited primarily to referral laboratories and research laboratories because of its difficulty, limited training, and the need for specialized instrumentation. Recently a multiplex PCR panel that includes L. pneumophila was approved by the U.S. Food and Drug Administration (FDA) for clinical use (Biofire® FilmArray® Pneumonia Panel) on sputum, endotracheal aspirates, bronchoalveolar (BAL), and mini-BAL lower-tract samples.
The criteria for diagnosing legionellosis used by the CDC are given in Box 3-1. These are likely to undergo revision in 2019 (Richard Danila, Minnesota Department of Public Health, personal communication, April 25, 2019).
Surveillance Systems for Legionnaires’ Disease in the United States
All surveillance data must be interpreted in the context of the “surveillance steps” that lead to diagnosis and reporting (see Figure 3-1). To be counted as a case, a person with legionellosis must seek medical care or be assessed as part of an outbreak. A clinical specimen (e.g., urine, respiratory) must be submitted for testing, and the specimen must be tested
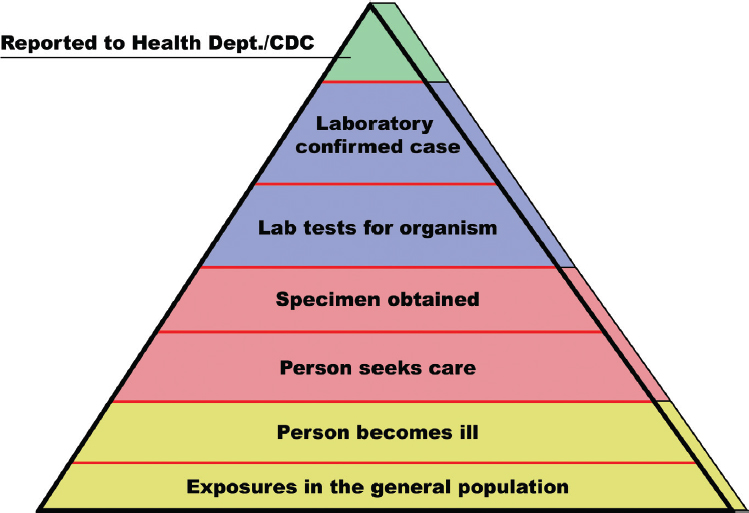
SOURCE: Adapted from https://www.cdc.gov/foodnet/surveillance.html.
for the presence of Legionella. This in turn requires that the laboratory be able to identify Legionella. All cases must meet the surveillance case definition given in Box 3-1. All 50 states, the District of Columbia, and U.S. territories (referred to collectively as the states) require that cases diagnosed as Legionnaires’ disease or Pontiac fever be reported to local or state public health authorities. These cases are to be reported from the state to the CDC. If any step in this process does not occur, an individual ill with legionellosis will not be counted by the CDC. When cases reported through surveillance are clustered in time and space, an outbreak may be identified.
As suggested in Figure 3-1, there are significant losses in numbers as one proceeds through the surveillance steps, such that the number of cases reported to the CDC is likely to be an underestimate of the true incidence of legionellosis by as much as eight- to ten-fold (Dooling et al., 2015; Mercante and Winchell, 2015; Phin et al., 2014; St-Martin et al., 2013; von Baum et al., 2008).
Two national surveillance systems maintained at the CDC have the capacity to collect information on all diagnosed cases of legionellosis from states. These are the National Notifiable Disease Surveillance System (NNDSS) and the Supplemental Legionnaires’ Disease Surveillance System (SLDSS). Separately, CDC has regulatory authority over the cruise ship industry, which must report all cases of Legionnaires’ disease to the CDC.
National Notifiable Disease Surveillance System
Since the disease’s recognition in 1976, surveillance for legionellosis has been conducted by all states, the District of Columbia, and U.S. territories. Reporting is mandatory for all diagnosed cases of Legionnaires’ disease and Pontiac fever by healthcare providers and clinical laboratories to local and state health officials; cases must be reported within a short time period from diagnosis, usually within one to seven days.
All cases of notifiable diseases are then reported voluntarily to CDC from public health officials in states through the National Notifiable Disease Surveillance System (NNDSS). Historically, notifiable diseases have been reported weekly, and the CDC has published preliminary case counts weekly. However, legionellosis reports are often sent to the CDC at irregular and sometimes lengthy intervals, such that the weekly counts may be low and the preliminary statistics for legionellosis often incomplete. Data shared on cases through this system are primarily demographic (e.g., place of residence) and clinical (e.g., date of onset of illness). Environmental source information, including the setting (e.g., hospital, hotel), type of water system (e.g., hot tub, decorative fountain), and type of water exposure (e.g., potable water, recreational untreated water) are not collected by the NNDSS. The NNDSS does not provide information on whether a case is travel-associated, healthcare-associated, or community-acquired.
Supplemental Legionnaires’ Disease Surveillance System
A Supplemental Legionnaires’ Disease Surveillance System (SLDSS) is available at the CDC to collect more comprehensive data on Legionnaires’ disease cases from all states. The SLDSS includes potential environmental exposures, such as whether a case is travel-associated or whether an individual had exposure to hot tubs, respiratory therapy equipment, or a healthcare or senior-living facility. However, these data are often incomplete and not timely, and they frequently do not identify the potential environmental source of exposure. Therefore, these data have been insufficient to track trends in community-acquired, travel-associated, or healthcare-acquired cases (Cynthia Whitney, CDC, verbal communication, March 21, 2018).
In 2018, the CDC published the first surveillance summary focused on Legionnaires’ disease using NNDSS and SLDSS data from 2014 and 2015, analyzing for associations with healthcare facilities, senior- or assisted-living facilities, and travel (Shah et al., 2018). Future summaries are planned with the goal of better understanding the burden, impact, and trends of Legionnaires’ disease over time.
Critique of National Surveillance and Next Steps
Given the loss of cases associated with each step in Figure 3-1, it is no surprise that the NNDSS and SLDSS do not account for most patients with legionellosis. In contrast to the steps leading to diagnosis, however, the reporting step itself is quite complete. In a 2011–2015 study conducted through the Active Bacterial Core Surveillance System to find all laboratory-confirmed cases of legionellosis, almost all cases found in the study had been previously reported through the NNDSS (Dooling et al., 2015).
Having two separate surveillance systems has been problematic, and the CDC plans to address the issue. The CDC is currently integrating the NNDSS and SLDSS through the NNDSS Modernization Initiative (Sam Posner, CDC, personal communication, September 21, 2018), a CDC-wide initiative designed to enhance the system’s capabilities to provide more comprehensive, timely, and higher quality data. Case information that historically was sent through multiple routes will be consolidated into a single data stream.
Surveillance has been frequently referred to as “data for action,” yet neither the NNDSS nor the SLDSS is robust for this purpose because states have not routinely investigated single cases for source(s) of exposure. Better understanding the source of environmental exposure could lead to improved prevention and control measures. Acknowledging that environmental investigation of every case is unlikely to occur because such investigations are resource
intensive, more in-depth studies will be necessary to investigate a subset of cases by setting, source of water (e.g., potable water supply, cooling tower), and building water system for potential environmental exposure.
For decades, legionellosis programs both in states and at the CDC have been given low priority compared to other preventable infectious diseases, including communicable respiratory conditions. Furthermore, because the programs were initially focused on outbreak detection and control, the CDC and other public health agencies did not build expertise and capacity in fields that are needed to understand legionellosis prevention and control (e.g., building water systems, environmental engineering, and industrial hygiene). Legionellosis surveillance has not had dedicated resources to ensure timely environmental investigation of cases. Many state public health laboratories do not have the resources to identify, quantify, or subtype Legionella in water specimens; only three states have capacity to perform genome sequencing (Richard Danila, Minnesota Department of Health, email communication, September 29, 2018). CDC has recently devoted resources to legionellosis in some states through its Epidemiology and Laboratory Capacity cooperative agreements. These include Arizona, California, Colorado, Georgia, Illinois, Los Angeles County, Maryland, Michigan, Minnesota, Nebraska, Nevada, New York City and State, Ohio, Philadelphia, Tennessee, Utah, Virginia, Washington, DC, and Washington State. Some agreements have focused on getting public health laboratories, environmental health experts, and epidemiologists working together; others emphasize locating, registering, and testing cooling towers, whereas others focus on hotels; still others prioritize better cluster detection (Richard Danila, Minnesota Department of Health, personal communication, July 23, 2018). More efforts like these cooperative agreements are needed to help state and local health departments build their capacity for Legionella surveillance and response. New York City provides one of the most comprehensive legionellosis surveillance systems in the United States (see Box 3-2).
With respect to travel-associated cases, the Council of State and Territorial Epidemiologists (CSTE) has stated that surveillance for legionellosis lacks the timeliness and sensitivity necessary to detect outbreaks of these cases (CSTE, 2005). CDC is uniquely positioned to identify connections between cases that occur in residents of different jurisdictions, which is most likely with travel-associated outbreaks. It is particularly important that travel-associated cases be reported by the states to the CDC in almost real time to prevent delays in investigation and control. Following the 2005 CSTE position statement, CDC instituted a dedicated email address to improve reporting of travel-associated cases. Europe has a more extensive reporting system for travel-associated cases, discussed later in this chapter.
Academic centers currently play little, if any, role in either building or assessing prevention and control efforts for legionellosis. If the CDC chose to take a much more comprehensive approach to legionellosis, both the Integrated Food Safety Centers of Excellence and the Regional Centers of Excellence in Vector-Borne Diseases could serve as models. Under the Food Safety Modernization Act of 2011, the CDC designated six Integrated Food Safety Centers of Excellence at state health departments and affiliated university partners not only to identify and implement best practices in foodborne disease surveillance and outbreak response, but also to serve as a resource for other state, regional, and local public health professionals.1 In 2017, five universities were established as regional Centers of Excellence to help prevent and rapidly respond to emerging vector-borne diseases across the United States. The goals of these centers include building effective collaboration between academic communities and public health organizations at federal, state, and local levels for surveillance, prevention, and response; training public health experts in the knowledge and
___________________
1 See https://www.cdc.gov/foodsafety/centers/index.html, accessed March 9, 2019.
skills required to address vector-borne disease concerns; and conducting applied research to develop and validate effective prevention and control tools and methods and to anticipate and respond to disease outbreaks.
U.S. Department of Veterans Affairs Surveillance System
In addition to the national systems, the Veterans Health Administration (VHA) collects information on all cases of legionellosis within its healthcare system. The VHA operates the largest integrated healthcare system in the United States, with more than 1,200 sites of care, serving about 6 million veterans annually. In federal fiscal year (FY) 2016, 91 percent of veterans using VHA benefits were male, with a median age of 64 years and with higher morbidity than in the rest of the United States (Gamage et al., 2018), which as discussed in Chapter 2 are populations with an increased risk of contracting Legionnaires’ disease. As discussed in detail in Chapter 5, the VHA has a Legionella prevention policy for medical facilities to limit Legionella growth in building water systems, requiring the collection of both environmental and clinical data. Concomitant to publication of the policy in 2014, the VHA Central Office implemented a national standardized Legionnaires’ disease reporting system. Compared to the CDC’s notifiable disease reporting system, the VHA collects more detailed information on each case, partly to assess if a person was exposed while inside a VHA facility. As more environmental data are collected throughout the VHA system, the surveillance system will become critical for evaluating the effectiveness of the VHA’s legionellosis prevention policies and also provide useful information for public health agencies and other healthcare facilities.
Waterborne Disease Outbreak Reporting System of the National Outbreak Reporting System
A third U.S. national surveillance system—the National Outbreak Reporting System or NORS—is also maintained by the CDC and collects data on waterborne and foodborne disease outbreaks in the United States. CDC categorizes the sources of waterborne disease outbreaks as follows: (1) drinking water, (2) treated recreational water, (3) untreated recreational water, and (4) another environmental exposure or undetermined source. Legionella was added to this system in 2001. Data from this system are currently publicly available on the NORS dashboard;2 one can sort outbreaks by etiologic agent, year, state, setting (e.g., hotel, trailer park, hospital), water exposure (see above), and type of water system (e.g., hot tub, decorative fountain, cooling tower). NORS does not include detailed information on the setting and type of water system, which would be particularly useful for improving understanding of sources and conditions conducive to transmitting legionellosis.
The waterborne disease outbreak reporting system was initiated in 1971 as a partnership between CDC, CSTE, and the U.S. Environmental Protection Agency (EPA). It is dependent on public health departments in individual states to voluntarily provide complete and accurate data for waterborne disease outbreaks. The waterborne disease outbreak reporting system is important because outbreaks are most likely to be investigated for environmental sources.
A limitation of the NORS program for legionellosis is that the database (and hence the categories of setting, water types, and water exposure) was developed for enteric pathogens, making it less useful for pathogens capable of growth in water systems and transmitted by aerosolized water. Also, NORS data for legionellosis are not updated frequently; until December 2018, only data through 2014 were available.
___________________
European Surveillance
In most European countries, laboratory-confirmed Legionnaires’ disease cases must be reported to the public health authorities of the country (e.g., in Germany, reporting is mandatory to national authorities within 24 hours of diagnosis). Countries of the European Union and the European Economic Area (EEA) report annually to the European Centre for Disease Prevention and Control (ECDC) through the European Legionnaires’ Disease Surveillance Network (ELDSNet) (Lara Payne, ECDC, personal communication, October 31, 2019). In 2017, 30 countries participated in ELDSNet. The ELDSNet network has a coordination committee that, among other things, assists with the review of relevant technical documents and organizes the network’s annual meeting. ELDSNet collaborates with partners, such as the World Health Organization (WHO), and public health authorities of non-EU/EAA countries having a voluntary ELDSNet contact point. The incidence of Legionnaires’ disease in Europe ranges widely among countries, which may largely reflect the variability in diagnosis and reporting. The burden of disease and trends are analyzed and reported in a detailed annual surveillance summary dedicated to Legionnaires’ disease (e.g., ECDC, 2019).
Considerable focus of ELDSNet has been on travel-associated Legionnaires’ disease, which accounts for approximately 20 percent of cases. The operating procedures of the surveillance scheme for travel-associated Legionnaires’ disease in the EU and EEA were updated in December 2017 (ECDC, 2017a), such that these cases are reported in almost real-time. In 2015, the estimated median delay between onset of illness and report to ELDSNet was only 17 days. When a cluster is identified within an EU/EEA country, all participating countries are notified and the public health authorities where the accommodation site is located are expected to report on the investigations conducted on the accommodation site. If the timeline for reporting by the EU/EAA country is not fulfilled or recommendations from the competent authorities are not implemented in a satisfactory way, the name of the accommodation site is published on the ECDC website. Tour operators may subscribe to receive notifications from ELDSNet.
Trends in Reported Legionellosis in the United States
From 2007 to 2018, the rate of reported legionellosis cases through the NNDSS increased from 0.91 cases to 3.04 cases/100,000 persons, with more than 9,900 cases reported in 2018. Although case reporting is officially for legionellosis, 98 percent of the case reports represent individuals hospitalized with pneumonia (Dooling et al., 2015). Therefore, the trends primarily reflect more severe cases of Legionnaires’ disease. It is likely that trends in treatment of outpatients with Legionnaires’ disease and Pontiac fever follow trends similar to the hospitalization data.
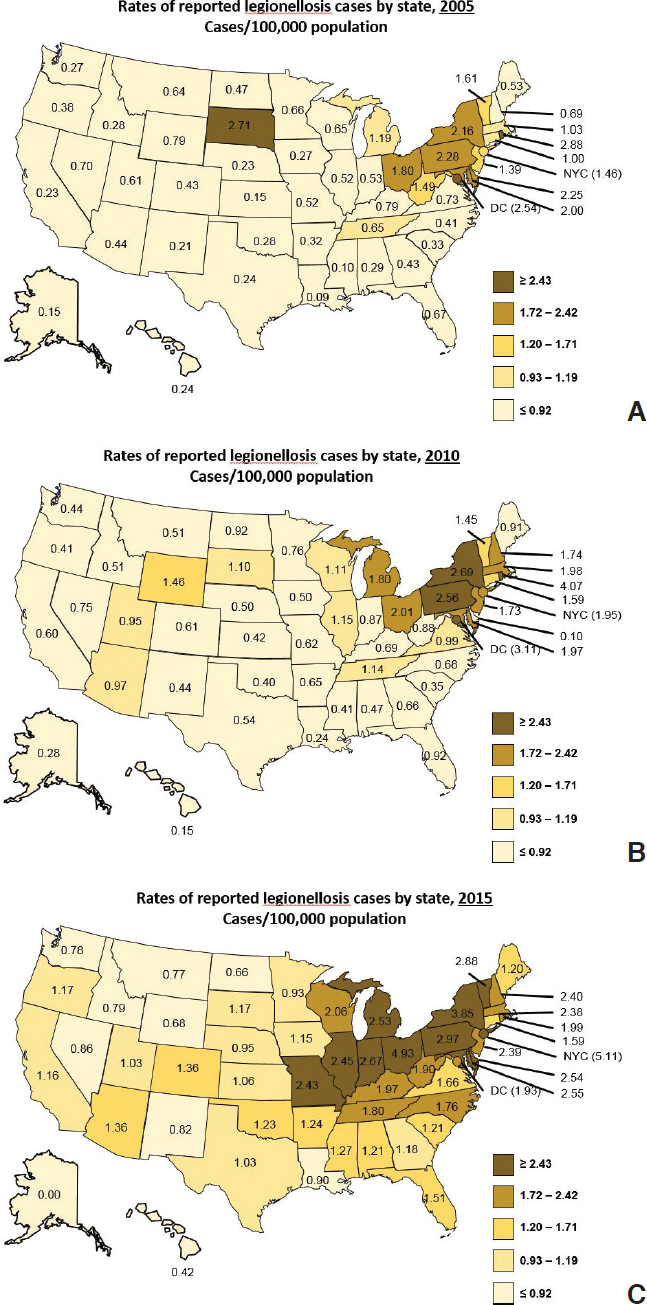
Reported rates of legionellosis are lower in some areas of the United States (e.g., the West) than other areas. But for all areas of the country, the rates have increased from 2005 to 2015 (see Figure 3-2; Cooley, 2018). Weather patterns likely contribute to geographic differences, with warm, humid weather increasing Legionnaires’ disease risk. Population and building density as well as regional differences in water treatment could also be playing a role.
In the United States, seasonal trends are evident, with cases rising in late spring, increasing in the summer, and peaking in late summer and fall. In 2016, 78 percent of cases were reported for the seven months of June through December. The lowest months are generally January through April. As with other variables, for all months from 2007 to 2016, the trend in incidence is generally upward.
After leveling off or decreasing from 2007 to 2010, European case rates have increased from 1.0 to 2.19 cases/100,000 persons from 2011 to 2018 (see Figure 3-3), with the majority
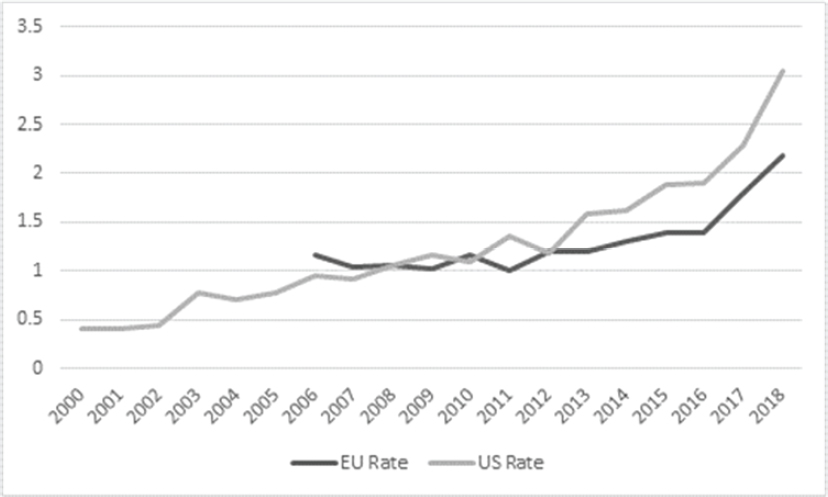
SOURCES: 2018 European data from Lara Payne, personal communication, ECDC, January 20, 2020. 2013–2017 European data from ECDC (2019); 2012 European data from ECDC (2018); 2011 European data from ECDC (2017b); 2008–2010 European data from ECDC (2016); 2006–2007 European data from ECDC (2014); 2000-2002 U.S. data adapted from Shah et al. (2018); 2003-2013 U.S. data from Adams et al. (2015); 2014 U.S. data from Adams et al. (2016); 2015 U.S. data from Adams et al. (2017); 2016, 2017, and 2018 U.S. data from the National Notifiable Disease Surveillance System.
of cases (69 percent) reported from France, Germany, Italy, and Spain. Australia has also noted increases in cases of L. pneumophila between 2005 and 2014 but not of Legionella longbeacheae. L. longbeacheae disease is rarely reported in the United States. Figure 3-3 shows that European rates are slowing relative to those of the United States, with the U.S. rate superseding the European rate since 2011.
Legionellosis cases can be subdivided into various categories. For example, cases may be recognized as part of an outbreak, a term used to describe two or more people with Legionnaires’ disease exposed to Legionella at the same place at about the same time. Cases not recognized as part of an outbreak are considered sporadic. In the United States, waterborne disease outbreaks in the NORS system are subdivided into whether the outbreak source was identified as potable water, recreational water (treated or untreated), or another water source.
Frequently, cases are also categorized as either “healthcare-associated,” “travel-associated,” or “community-acquired.” “Definite” healthcare-associated cases are defined as patients that stayed overnight in a healthcare facility (e.g., a hospital or long-term care facility) for the entire ten days before symptom onset, while “possible” cases are defined as patients with exposure to a healthcare facility for a portion of the ten days preceding symptom onset (Shah et al., 2018). Travel-associated cases must have a history of spending at least one night away from home, either domestically or abroad, in the ten days before symptom onset (CSTE, 2005). Cases are designated as community-acquired when the patient did not spend at least one night away from home in the ten days before onset of illness or was not exposed to a healthcare facility in the ten days before onset of symptoms. Various categorizations are used below to parse occurrence data in the United States.
Healthcare-Associated Cases
Healthcare-associated cases of Legionnaires’ disease make up approximately 20 percent of all legionellosis cases reported in the United States. In 2015, among 21 jurisdictions that reported exposure information on more than 90 percent of cases through the SLDSS, 3 percent of cases were considered “definite” and 17 percent had “possible” exposure to a healthcare facility in the ten days before symptom onset (Soda et al., 2017). Of the definite cases, 80 percent were associated with long-term care facilities, 18 percent with hospitals, and 2 percent with both. In addition, 3 percent were associated with assisted- or senior-living facilities (Shah et al., 2018). An analysis of case reports to the ECDC between 2011 and 2015 reported 7.3 percent as healthcare-related, 4.9 percent of cases as nosocomial (i.e., from a hospital specifically), and 2.4 percent as “other” healthcare-related cases (Beauté, 2017).
Data from the VHA between 2014 and 2016 show that the rate of Legionnaires’ disease significantly increased among veterans receiving VHA healthcare services but with no exposure to a VHA healthcare facility during the disease incubation period (from 0.9 to 1.47/100,000 enrollees). The rate of Legionnaires’ disease among those with an overnight stay at a VHA facility during the disease incubation period significantly decreased (from 5.0 to 2.3/100,000 enrollees with an overnight stay). Most “definite” cases of healthcare-associated Legionnaires’ disease (11 of 13) were in long-term care VHA facilities (Gamage et al., 2018).
Travel-Associated Cases
CDC has reported data on travel-associated Legionnaires’ disease from a limited number of jurisdictions. Benin (2002) found that 20 percent of Legionnaires’ disease cases were reported as possibly travel-associated between 1980 and 1998. From 2005 to 2006, 24 percent of cases reported through the SLDSS were possibly travel-associated (Smith et al., 2007).
In Europe, 20 percent of Legionnaires’ disease cases reported between 2011 and 2015 were travel-associated (Beauté, 2017). ECDC’s case definition for travel-associated cases includes only lodging in a commercial establishment (e.g., hotel, resort), which is a more restrictive definition than the U.S. definition, in which any night away from home during the incubation period was reported as travel-associated. Nonetheless, data on travel-associated cases in the United States are similar to European data.
Box 3-3 discusses Legionnaires’ disease rates for cruise ships, which have plateaued. Hotels and other commercial accommodation sites have been clearly documented to be an important source of environmental exposure to Legionella.
Community-Acquired Cases
Most Legionnaires’ disease cases in the United States are considered to be community-acquired (either sporadic or as part of an outbreak). This is consistent with what is found in Europe, where 70 percent of Legionnaires’ disease cases reported to ELDSNet between 2011 and 2015 were community-acquired (Beauté, 2017). Similarly, the Robert Koch Institute (2013, 2015) estimated that about 70 percent of reported legionellosis cases are neither related to an outbreak nor nosocomial, but rather acquired in private or professional surroundings.
Unfortunately, most of the information on community-acquired cases in the United States comes from outbreak investigations or from the many publications on individual outbreaks. The most comprehensive review of sporadic, community-acquired cases (Orkis et al., 2018) included 47 articles on sporadic cases (excluding healthcare- and outbreak-associated cases)
in which a total of 28 environmental sources were identified. Potable water from single family homes, large building water systems, and car travel appeared to contribute to a substantial proportion of the sporadic Legionnaires’ disease cases. Cooling towers were also noted to be a potentially significant source. The difficulty in source attribution was noted, with definitive links using molecular typing between environmental sources and clinical isolates being made in only eight cases. The authors noted that understanding the risk magnitude of potential sources would make future public health investigations more efficient and enhance prevention efforts.
den Boer (2015) performed source investigations on greater than 75 percent of 1,991 patients with Legionnaires’ disease between 2002 and 2012 (source investigations were only done for clusters of disease after 2006). The paper noted the difficulty and the resource intensity of investigations to locate with certainty the source of an infection, and it reported outcomes of investigations of sporadic cases together with outcomes of cluster investigations. Of the 1,484 source investigations performed, only 367 (24.7 percent) of the sources were positive for Legionella spp., and only 41 patients (2.3 percent) were found to have a clinical strain that matched the environmental source. The sources that matched included a healthcare setting (40 percent), residence (18 percent), industrial complex (8 percent), swimming pool (5 percent), wellness center (8 percent), hotel (5 percent), spa (5 percent), and car wash (3 percent). The study also examined 105 clusters associated with 266 patients based on location and geography: 26 percent of the clusters were associated with garden centers, 16 percent with healthcare facilities, 10 percent with a residence, 9 percent with wellness centers (e.g., spas, saunas), 7 percent with hotels, 5 percent with cooling towers, and 5 percent with holiday parks.
Che and colleagues (2003) reported an increased risk of sporadic cases of community-acquired Legionnaires’ disease in industrial areas of France. They evaluated 880 cases from 1998 to 2000 that were not associated with an outbreak and in which individuals did not report an overnight hospital stay or traveling within ten days of disease onset. Seventy-nine (79) percent of the cases were caused by L. pneumophila serogroup 1. A higher risk was
reported in areas with exposure to aerosols and plumes of smoke, with the greatest risk being in areas with more than one industrial exposure. However, the results are inconclusive and the findings deserve further study.
A study by the New York City (NYC) Department of Health and Mental Hygiene looked at the potential role of occupation among 335 community-acquired cases. Compared with the general population, legionellosis case-patients who were working in the two weeks before diagnosis were significantly more likely to work in transportation, repair, protective services; cleaning services; or construction (Farnham et al., 2014).
Community-acquired cases are commonly attributed to private water systems, under the assumption that the small number of people exposed would not draw the attention of epidemiologists to investigate. For example, Bonilla Escobar et al. (2014) demonstrated that a healthy, immunocompetent young person with no other risk factors contracted Legionnaires’ disease from an improperly maintained household humidifier, but no conclusions were drawn about the frequency of humidifiers being sources of Legionella infections. In another case study, two unrelated individuals appeared to contract Legionnaires’ disease in their homes and both had solar water heaters with inadequately heated water (Erdogan and Arslan, 2016). Currently, it is largely unknown how often private water sources, particularly in individual homes, are the environmental exposure source for sporadic cases.
Outbreak Data That Reveal Environmental Sources
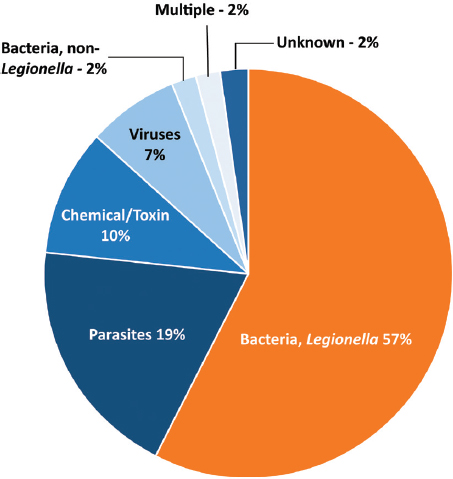
Most legionellosis outbreaks are detected through analysis of surveillance data compiled through the mandatory reporting systems described above. As discussed previously, and unlike the surveillance data reported through NNDSS or SSLDS, NORS data (now available from 2009 to 2017) are examined by water type, i.e., whether the outbreak is associated with drinking water, treated or untreated recreational water, or another water system. During 2013 to 2014, 19 states reported 42 outbreaks associated with drinking water; Legionella was implicated in 57 percent of the outbreaks (see Figure 3-4), 13 percent of the cases, 88 percent of the hospitalizations, and all 13 deaths.5 From 2000 to 2014, NORS reported 363 outbreaks associated with treated recreational water that had a confirmed infectious etiology; 16 percent were caused by Legionella, and legionellosis was confirmed or suspected to be responsible for all eight deaths (Hlavsa et al., 2018). During 2013 to 2014, 15 outbreaks were associated with “another” environmental exposure to water; Legionella was responsible for 63 percent of the outbreaks, 94 percent of hospitalizations, and all 17 deaths (McClung et al., 2017). Finally, 11 of 12 outbreaks associated with an undetermined exposure to water were caused by Legionella (McClung et al., 2017).
Unfortunately, published analyses of NORS data generally do not reveal the setting (e.g., hotel, hospital) or water exposure (e.g., spa, decorative fountain), although some of the data are available and could be stratified for further analysis. The Committee analyzed NORS data between 2009 and 2017, during which 290 legionellosis outbreaks were reported. A substantial percentage of cases were associated with hotels and healthcare facilities. Other implicated locales included long-term care facilities, assisted-living or rehabilitation facilities, apartment buildings, indoor workplaces, factories or industrial settings, and prisons. Within those settings, cooling towers, hot tubs, and ornamental fountains were implicated. The goal of this cursory analysis is to raise awareness of the data available via the NORS dashboard that could be analyzed to determine environmental exposures associated with legionellosis cases.
___________________
5 See www.cdc.gov/healthywater/surveillance/drinking-water-tables-figures/html.
SOURCE: Benedict et al. (2017).
Garrison and colleagues (2016) analyzed data from 27 building-associated Legionnaires’ disease outbreaks (2000–2014) that were investigated by the CDC between 2000 and 2014. Common exposure settings were hotels (44 percent), long-term care facilities (19 percent), and hospitals (15 percent). Common sources (within the settings) were found to be showers and faucets (56 percent), cooling towers (22 percent), hot tubs (7 percent), decorative fountains (4 percent), and industrial equipment (4 percent).
By reviewing the peer-reviewed literature and government documents published between 2006 and 2017, Hamilton and colleagues (2018a) identified 119 legionellosis outbreaks globally for which an environmental source was associated with the event. Potable water was identified as the source in 42 outbreaks (30 percent), although this was not subdivided to better understand whether a specific water system or fixture deficiency was the culprit. Cooling towers, air conditioning, or evaporative condensers were identified in 41 outbreaks (30 percent). Cooling towers were associated with 50 percent of the confirmed cases of legionellosis and the greatest number of fatalities. Fifteen (15) percent of outbreaks occurred at hotels.
One of the world’s largest outbreaks of Legionnaires’ disease was linked to a hot tub exhibited at a Dutch flower show (den Boer et al., 2002). Simply pausing at the hot tub was deemed the most important risk factor for infection, confirming that a contaminated hot tub, even if not used directly, can cause illness in susceptible people. Of particular importance is the potential role of municipal water systems. In Flint, Michigan, the governor’s task force concluded that the management of the Flint River-sourced water supply may have contributed to the outbreaks of legionellosis in 2014 and 2015 in Genesee County (Flint Water Advisory Task Force, 2016), and scientific studies identified aspects of the water that were conducive to Legionella proliferation (Rhoads et al., 2017; Zahran et al., 2018). Outbreaks have also been attributed to wastewater treatment plants (Kusnetsov, 2010; Loenenbach et al., 2018).
The investigation of a large outbreak of Legionnaires’ disease in NYC in 2015 illustrates how a multi-disciplinary approach to outbreak detection and subsequent investigation can
lead to successful control (Box 3-4, Chamberlain, 2017). This investigation is unique in its scope, timeliness, and the extent to which clinical and environmental data were paired to determine the source of the Legionella. It also illustrates the resource intensity and difficulty of investigations of Legionnaires’ disease outbreaks.
Why Are Rates of Legionnaires’ Disease Increasing?
Although often put forward as potential explanations for the increase in Legionnaires’ disease incidence, neither improved reporting nor improved diagnosis are supported by available data as a major contributor to the rapid increase since 2000. Indeed, reporting of diagnosed cases was documented to be extremely high for the period 2011 to 2013 (Dooling et al., 2015). Currently there are very limited data available to assess the role of diagnostic testing in increased incidence.
Both host factors and environmental factors are likely to contribute to the increased number of cases of legionellosis since 2000. As discussed in Chapter 2, increasing numbers of persons are at higher risk of acquiring Legionnaires’ disease because of aging of the population, increased use of immunosuppressant drugs, and higher prevalence of comorbid conditions, including diabetes and chronic obstructive pulmonary disease. There is a growing dependence on heating, ventilation, and cooling systems, as well as increased complexity of indoor plumbing systems in large buildings, which have a labyrinth of water lines and features ranging from hundreds of showerheads along lengthy hospital corridors to hot tubs and indoor decorative fountains. Changes in plumbing materials could play a factor. In addition, increased efforts to conserve water with attendant slower flow in plumbing systems likely enhances biofilm formation and therefore increases risk of Legionella growth in premise plumbing (see Chapter 4). Inadequate maintenance of public water supplies (e.g., water main breaks, corrosion of pipes) may increase risk for contamination of building water systems and other water devices or equipment. Contaminated environmental sources, from dental hygiene equipment to street cleaning machines, continue to be newly identified (Ricci et al., 2012; Schönning et al., 2017; Valero et al., 2017).
Changing environmental conditions are also facilitating human exposure to aerosolized water containing Legionella. Multiple hydrologic factors including humidity and rainfall may influence legionellosis risk, and climate change, including global warming, is likely contributing to the increase in cases (see Chapter 2).
Despite the increase in reported rates, most cases of legionellosis are not diagnosed, even among those who seek medical care, and there is little evidence that diagnostic testing has improved for legionellosis between 2007 and 2016. Diagnostic testing for pneumonia in the United States has been generally discouraged for many reasons. Reimbursement practices deter use of microbiologic diagnostic tests for pneumonia. Professional guidelines of the American Thoracic Society and the Infectious Disease Society of America have also discouraged routine testing of hospitalized patients for community-acquired pneumonia (Bartlett, 2011; Mandell et al., 2007). Although these guidelines are currently being updated, it is not expected that the guidelines’ approach to legionellosis will change. At one academic medical center, adherence to these guidelines for testing of patients for Legionella would have resulted in an underestimate of the burden of Legionnaires’ disease of at least 41 percent (Hollenbeck and Mermel, 2011). In this study, even with more robust testing than recommended by the guidelines, only 35 percent of patients discharged with a diagnosis of pneumonia had been tested.
Microbiologic analysis standards in most laboratories have declined. The belief that a deep respiratory secretion is needed for Legionella culture has discouraged testing, al-
though this assumption is incorrect; sputum specimens that may be inadequate for culture of other pathogens may be sufficient for culture of Legionella (Bartlett, 2011; Ingram and Plouffe, 1994). In 2011, Bartlett reviewed reasons why testing has declined for diagnosis of community-acquired pneumonia. In particular, the Clinical Laboratory Improvement Amendments regulations led to the demise of the “house staff laboratory” and the distancing of microbiological analysis from the site of care, which may delay diagnoses. Obviously, there are fewer options at most community and rural hospitals, many of which have only basic laboratories. Legionnaires’ disease diagnostics, particularly use of culture, may have declined as a result of many of these factors. It is not known whether the use of PCR has had any impact on legionellosis diagnoses, although this may change as more molecular assays gain FDA approval.
There has been little, if any, federal research funding for applied research on legionellosis, which, in turn, may depress training on legionellosis in academic healthcare centers. As a result, academic healthcare centers in the United States have limited expertise on Legionnaires’ disease. The National Institute of Allergy and Infectious Diseases has focused its Legionella funding on basic science related to Legionella and the pathogenesis of the organism (Heilman, 2015).
True Incidence of Legionellosis
It is difficult to determine from available data the true incidence of legionellosis in the United States, although reported cases are certainly an underestimate. Some studies have attempted to determine the incidence of Legionnaires’ disease in hospitalized patients with pneumonia. A population-based study in two counties in Ohio in 1991 estimated 8,000 to 18,000 individuals were hospitalized with community-acquired Legionnaires’ disease per year in the United States (Marston et al., 1997). From 2013 to 2015, 98 percent of patients with pneumonia in a Pittsburgh VHA hospital were tested for Legionnaires’ disease with at least one diagnostic test, documenting that at least 1.7 percent of community-acquired pneumonia and 0.6 percent of healthcare-acquired pneumonia was caused by Legionella (Decker et al., 2016). The incidence of Legionnaires’ disease among hospitalized patients was reported as 8/100,000 veterans, with an incidence of 6/100,000 for community-acquired Legionnaires’ disease. More recently, Gamage et al. (2018) reported an incidence of Legionnaires’ disease in the nationwide VHA system of 1.9/100,000 for the years 2014 to 2016. Since both VHA studies lacked data on veterans admitted to hospitals outside the VHA system, the incidence of pneumonia among veterans was underestimated. The CDC is currently working on better estimates of morbidity and mortality related to waterborne pathogens, including Legionnaires’ disease, but these reports will not be available until late 2019.
To develop its own estimate of the incidence of Legionnaires’ disease, the Committee relied on the estimate from the population-based Etiology of Pneumonia in the Community (EPIC) study of community-acquired pneumonia that required hospitalization (Jain et al., 2015). This CDC-led study is the more recent of only two such studies conducted in the United States that determined the incidence of Legionnaires’ disease (the other being Marston et al., 1997). The EPIC study was conducted from 2010 to 2012 in Nashville, Tennessee, and Chicago, Illinois, and considered 2,488 patients. Using mainly UAT, Jain et al. estimated an incidence of community-acquired pneumonia caused by L. pneumophila of 4/100,000. Starting with this value, the Committee increased this rate to 4.44/100,000 after assuming a 90 percent sensitivity of the UAT for detection of L. pneumophila serogroup 1. This estimate is conservative; other have found that the UAT only detects of 80 percent of L. pneumophila serogroup 1 cases (Mercante and Winchell, 2015; Yzerman, 2001).
Another adjustment to the estimated incidence was made to account for the fact that the EPIC study was not designed to estimate Legionnaires’ disease, and methods of enrollment and exclusion criteria (e.g., excluding immunosuppressed patients) as well as limited testing likely resulted in significant underestimates of the burden of community-acquired Legionnaires’ disease. The Committee assumed that the enrollment and exclusion criteria removed at least 10 percent of actual cases, leading to a rate of 4.88/100,000 people. This adjustment is conservative given other, higher estimates of hospitalized patients with community-acquired pneumonia. For example, Rameriz and colleagues (2017) studied adults hospitalized with pneumonia in Kentucky and reported rates of community-acquired pneumonia more than double those in the EPIC study and similar to rates found by Griffin et al. (2013), a study based on national Agency for Healthcare Research and Quality hospitalization data. Ramirez et al. (2017) attributed the higher rates in their study compared to those in EPIC to the stringent exclusion criteria used by EPIC.
Next, the Committee incorporated evidence (supported by Mercante and Winchell, 2015) that at least 20 percent of patients hospitalized with Legionnaires’ disease have non-L. pneumophila serogroup 1 disease, which was not captured in the EPIC study.6 This consideration increased the rate to 6.17/100,000. The Committee then assumed that 10 percent of all legionellosis cases are healthcare-associated (see previous sections of this chapter), numbers which also would not have been captured in the EPIC study, leading to an adjusted rate of 6.85/100,000.
The EPIC study gathered and analyzed data from 2010 to 2012, such that the incidence cited in that study would reflect those years. According to Figure 3-3, there has been a doubling of the number of reported cases from 2011 to 2018, and this increase should be reflected in any current rate. There is little information available on the frequency of testing or whether diagnostic testing has improved (which could account for the observed doubling), has remained stable, or declined since 2011. The Committee assumed a range from as little as 50 percent of the doubling of reported cases being real (such that the other 50 percent is attributable to improved testing) to 100 percent of the doubling being real, which leads to a rate of 10.25 to 13.7/100,000. Although plausible, the Committee did not consider the possibility that diagnostic testing had decreased, a situation that would further increase its estimate of disease cases.
The U.S. Census Bureau on July 1, 2018, estimated there are 327.2 million people in the United States, of which 253.2 million are 18 years of age and older (children are excluded because there are limited data on estimates of Legionnaires’ disease rates in children).7 Thus, the Committee arrived at an estimate of 26,000 to 35,000 hospitalized cases of Legionnaires’ disease per year.
The EPIC study considered only cases of community-acquired pneumonia that required hospitalization. To determine the incidence of outpatient Legionnaires’ disease, the Committee consulted von Baum et al. (2008) who analyzed data from CAPNETZ, which is a medical competence network for community-acquired pneumonia funded by the German Ministry for Education and Research. von Baum et al. (2008) documented that the fraction of individuals with community-acquired pneumonia who were treated as outpatients was similar to that of persons with community-acquired pneumonia who were hospitalized. To be conservative, the Committee made a similar assumption, although there is evidence that, in the United States, the number of outpatients diagnosed with community-acquired
___________________
6 31 of 32 EPIC cases were detected by UAT, with a single case detected by PCR. Cultures were not performed.
7 See https://www.census.gov/quickfacts/fact/table/US/PST045218.
pneumonia substantially exceeds the number of inpatients diagnosed with community-acquired pneumonia.8 Thus, the Committee arrived at an estimate of 52,000 to 70,000 cases of Legionnaires’ disease per year in the United States (or a rate of 20.5 to 27.4/100,000). This estimate of the rate is approximately ten times higher than the reported rate for 2017 and is felt to be very conservative, as it considers only those cases of Legionnaires’ disease for which treatment was sought (either inpatient or outpatient). It is a coarse analysis that does not reflect all of the uncertainties.
An analysis using different methods to estimate Legionnaires’ disease in hospitalized patients with pneumonia provides further evidence that Legionnaires’ disease may be substantially underdiagnosed in the United States. Cassell et al. (2019) reviewed hospitalization data for all non-federal hospitals in Connecticut from 2000 to 2014; using the International Classification of Diseases, they compiled time series for pneumonia and influenza, and estimated (with a mixed-effects model) the percentage of cases due to Legionella, influenza, and respiratory syncytial virus. The annual incidence rate of Legionnaires’ disease among hospitalized patients was predicted to be 11.7/100,000; this rate was also approximately ten times higher than the average reported rate during the 14-year study period. The estimates of the burden of Legionnaires’ disease put forward by both the Committee and by Cassell et al. (2019) suggest that the U.S. rate of Legionnaires’ disease may be far higher than that indicated by notifiable disease statistics.
ENVIRONMENTAL MONITORING
Monitoring of Legionella bacteria in water systems has been done for several reasons. Water sampling has often been undertaken to locate the source of the bacteria after an outbreak of Legionnaires’ disease was documented or after cases began to accumulate. Routine monitoring is done to verify that a water management plan is working and to determine background levels of Legionella. For example, monitoring of cooling towers or hospitals, in the absence of cases of disease, has largely focused on whether or not to implement water treatment. Presence/absence approaches, where positive results initiate action, have frequently been used rather than quantitative measures. Assessment monitoring has often been done in conjunction with water treatment to determine treatment efficacy. Monitoring is also often carried out for research purposes, which is a valuable means of providing generalizable information to the scientific and practitioner communities about conditions in water systems that are conductive to Legionella growth and the means to control it. Table 3-1 provides a general overview of various methods currently available for environmental monitoring and how each may be applied toward these four goals. Of note, there is presently a great deal of variability in how the methods are actually applied to various systems and scenarios. This is likely because choosing the most appropriate methods, which systems and locations to target for testing and how often, and what medium to sample, are dependent on specific aspects of the water system and building being sampled. These are important considerations for a building’s water management plan (discussed in Chapter 5). This section describes the individual methods and compares their strengths and weaknesses for various purposes. Finally, it summarizes what decades of data collection have revealed about Legionella presence and concentrations in various engineered, environmental niches.
___________________
8 See https://www.ahrq.gov/professionals/quality-patient-safety/hais/tools/ambulatory-care/cap-toolkit.html, accessed June 22, 2019.
TABLE 3-1 Sampling for Legionella in Water Systems: Purpose, Methods, and Other Considerations
| Purpose of Testing | Which Method(s)? | Which Water Systems? | Spatial/Temporal Considerations? | Which Medium/Volume1 to Sample? | |
|---|---|---|---|---|---|
| Outbreak Investigation Culture needed for comparison to patient isolates |
|
Suspect sources? Cooling towers, hot and cold taps, showerheads, hot tubs, decorative fountains, etc. | As soon as possible when an outbreak is suspected | Water | |
| Numbers would be expected to be high in case of outbreak | |||||
| Routine Monitoring Select one, apply consistently |
|
|
Where there is patient risk, e.g., point-of-use devices in intensive care units, neonatal care units | Continuous—Develop feasible plan and frequency (may be stipulated for some entities, locales, guidance, standards). | First draw water samples |
| Where there is system vulnerability, e.g., stagnant zones, distal taps, substandard plumbing material | Biofilms are sampled routinely, but the value of these data over sampling of the water column unclear | ||||
| Mitigation Assessment Select one or more, apply consistently |
|
The system subject to mitigation. Check upstream and downstream of target system and a comparable control. | Before and after mitigation, ideally long-term. Assess the overall effect or changes in baseline. Sample relevant inlets and outlets to point of mitigation. | Water | |
| Biofilm—Can assess if mitigation is reaching sources in biofilms | |||||
| Research Varies according to research question |
In addition to all of the methods above, consider:
|
Water systems in place in the field. These are more real-world, but where there is a weaker understanding of factors at play. | Depends on research question. Longer-term studies are valuable but lacking. Water chemistry fluctuates with time. Three or more years may be required to achieve stable biofilm, which short-term studies overlook. | Water | |
| Biofilm | |||||
| Simulated water systems. This allows for controlled variables and statistical replication, but less real-world significance. | Aerosols—Need to understand transfer of Legionella from biofilms to respirable, infectious aerosols | ||||
1 Volume to be determined based on application and desired detection limit. Larger volumes provide lower detection limits, but also may dilute the Legionella present in first-flush samples.
VBNC = viable but non-culturable.
Methods
Many of the methods used to analyze environmental samples for Legionella are the same as those discussed previously for clinical studies of Legionnaires’ disease. Historically, culture-based methods have been applied as the standard method for monitoring and to obtain isolates for further characterization. However, new methods have been developed that shorten the delay inherent to culture methods and allow for more real-time information gathering.
The methods for environmental monitoring still do not fully account for Legionella’s complex ecology (see Chapter 2). For example, swabbing has been used as a sampling method because Legionella are known to be associated with biofilms that form in pipes and fixtures, yet quantitative data (e.g., area swabbed, method, other measures of total biomass obtained) have not been consistently reported. Few studies address the relationship of Legionella with amoeba and instead measure mostly planktonic bacteria. Recent knowledge of the ecology of Legionella spp. has been slow to impact the development of new methods, even in the research arena. A recent review by Wang et al. (2017) summarizes some of the key challenges to both culture and molecular-based monitoring of Legionella and other pathogens in water systems, including the effects of sampling locations, processing, and preservation techniques.
Table 3-2 compares several methods in use for detection, isolation, characterization and quantification of Legionella from building water systems. The table includes whether the method (1) elicits a presence/absence or quantitative result; (2) allows the bacteria to be isolated; (3) can be used routinely; (4) identifies species, serogroups or genotypes; and (5) detects bacteria that are potentially viable, culturable, or inactivated (killed). Each method has advantages and disadvantages. While culture methods have remained the gold standard, they may need to be adapted or supplemented with other methods to assist in developing risk estimates and informing outbreak investigations. Depending on the application, it is likely that combinations of methods will be used in the future.
Culture Methods
Culture methods capture cells that grow and produce colonies on solid agar, generating quantitative data in the form of colony-forming units (CFU), or in some cases in liquid media. In many early studies using these methods, no quantification was undertaken because the goal was to isolate colonies and identify serogroups using antibodies. Thus, the methods initially focused on cultivation and isolation of the bacteria only. One major shortcoming that still exists today is the length of time it takes to culture Legionella, as results may not be available for eight or more days. This can result in precious time lost for outbreak investigation, but this delay is not typically problematic for routine monitoring.
By the late 1970s and early 1980s, media formulations were focused on growth of L. pneumophila, which led to the predominance of buffered charcoal yeast extract (BCYE) agar and the use of antibiotics as well as acid or heat pretreatment. The BCYE media used for culture tests is insufficient to recover all Legionella spp., although it does not exclusively detect L. pneumophila (Lee et al., 1993). Protocols that used filtration to sample larger volumes of water as well as swab samples became more prevalent (Cordes et al., 1981; Witherell et al., 1988). By 1990, improvements had been made, yet full assessment of a standard method was not forthcoming. There was concern regarding the standardization of the methods toward improved recovery and identification. After examining methods recommended by the VHA, CDC, and a group in Germany, Ta et al. (1995) made recom-
TABLE 3-2 Comparison of Methods for Environmental Legionella Monitoring
| Method | Potential for Quantification | Potential for Isolation | Level of Use1 | Discerns Serogroups/Sequence Types? | Form of Bacteria Measured | Pros | Cons |
|---|---|---|---|---|---|---|---|
| Culture Methods | |||||||
| ISO | Yes | Yes | Routine | Yes | Culturable | Standardized Historical data | Time to results; may underestimate VBNC, other serogroups and species, risks |
| CDC | Yes | Yes | Routine | Yes | Culturable | Standardized Historical data | Time to results; may underestimate VBNC, other serogroups and species, risks |
| AHPA | Yes | Yes | Routine | Yes | Culturable | Standardized Historical data | Time to results; may underestimate VBNC, other serogroups and species, risks |
| Molecular Methods2 | |||||||
| PCR | No | No | Research, used with cultivation | No | Inactivated, VBNC Culturable | Can support sequencing | Need to process gels |
| qPCR | Yes | No | Research, potential for diagnostics and surveillance | No | Inactivated VBNC Culturable | Rapid results Greater sensitivity and specificity |
Measures inactivated cells; less historical use |
| ddPCR | Yes | No | Research, potential for diagnostics and surveillance | No | Inactivated VBNC culturable | Rapid results Greater sensitivity and specificity |
Measures inactivated cells; few studies using and comparing the method |
| Emerging Methods | |||||||
| Next Generation Sequencing | No | No | Research | No | Inactivated VBNC Culturable | Provides info on how bacteria relat to microbial community | Takes special expertise, instrumentation More cost and time to obtain results |
| Amoeba Co-culture | No | Yes | Research | Yes | Culturable | Improves isolation of difficult-to-culture strains | Adds at least 3 days to cultivation |
| Liquid culture-based MPN | Yes | Yes | Research, potential for routine use | No | Culturable | Simple set-up, may be specific to Lp | 7 days for results More difficult to confirm |
| EMA-PCR | Yes | No | Research | No | Viable | Can be used with molecular tools | Not proven to work with disinfection |
| PMA-PCR | Yes | No | Research | No | Viable | Can be used with molecular tools | Not proven to work with disinfection |
| Flow Cytometry | Yes | Yes | Research, potential for routine use | Yes | Inactivated VBNC Culturable | Simple set-up, specific to Lp serogroups based on antibodies | Early commercial release, limited validation, higher detection limit |
1 Categories include Routine, Research, Potential for Routine, or Potential for Diagnostics and Surveillance; 2Molecular tools require special instruments, training, and expertise; AHPA: American Public Health Association; ddPCR: digital droplet PCR; EMA: ethidium monoazide; MPN: most-probably-number; PMA: propodium monoazide; VBNC: Viable-but-Non-Culturable.
mendations to enhance recovery of culturable species and identification of strains. Finally, in 1998 International Organization for Standardization (ISO) culture methods were updated and published (ISO, 1998). A variety of standardized and consensus-based methods are now available including Standard Methods for the Examination of Water and Wastewater (APHA, 2007); Procedures for the Recovery of Legionella from the Environment (CDC, 2005); and ISO methods ISO 11731-2 (100-ml membrane filtration) (ISO, 2004, 2017). Procedures were directed toward the isolation of culturable colonies, in part to facilitate comparison of environmental and clinical isolates during outbreak investigations.
A new, easier culture method specifically for L. pneumophila has been developed that uses a liquid-based most-probable-number (MPN) approach (Legiolert™/Quanti-Tray™, IDEXX). The comparative data from four studies (see Box 3-5) suggest that the method is equivalent to other methods but generally trends higher in concentration estimations. One
limitation of the reported evaluations of the MPN method was the lack of confirmation tests on positive wells in the tray with genetic methods. The studies mentioned in Box 3-5 evaluated the positives only via culture. The method also does not differentiate among serogroups of L. pneumophila nor is its specificity for all 61 species of Legionella available, making further testing necessary if this information is needed. Another drawback of this MPN method is that colonies are not readily available for molecular discrimination assays. As new methods develop, there is a need for greater systematic study and reporting of information, including a full description of the types of samples compared, characterization of the genera and species eliciting false positives, and genetic characterization of the Legionella spp. and serogroups that are detected.
Although culture methods have been standardized, inter-laboratory precision and accuracy are still uncertain. In a methods comparison (Ta et al., 1995), filtration, use of BCYE agar, and acid buffer treatment gave the highest recoveries. One inter-laboratory study using seeded samples for proficiency testing examined how well various laboratories performed in detecting and quantifying Legionella (Lucas et al., 2011). Ten in-house protocols (which were not described in the paper) were used, based on American Society of Microbiology, ISO, or CDC methods. CDC and nine other laboratories including county, state, hospital, and private entities participated, with CDC as the reference laboratory. The key findings included the following:
- The detection limit of the methods and laboratories were similar; samples were negative 93.1 percent of the time with less than 10 CFU/mL and positive 85.3 percent of the time with samples with greater than 10 CFU/mL.
- Quantification errors averaged about 1 log and underestimated the expected concentrations. However, this conclusion was tenuous, as formal assessment of the quantification results were not clearly articulated in the publication.
- Statistics on accuracy and precision with only ten laboratories was similar to European studies. While the details were not provided, the study concluded that sampling protocol, treatment regimen, culture procedure, and laboratory experience did not significantly affect the accuracy of reported concentrations.
The advantages of culture include (1) its ability to compare with historical samples, (2) it is an accepted measure of viability, and (3) it can be used to isolate bacteria for epidemiologic investigations. The disadvantages are that final results are not available for eight to 14 days depending on the chosen laboratory, making rapid decisions impossible, and the cost and expertise needed to run the method limits its widespread use. Furthermore, the method cannot capture Legionella cells in the viable but non-culturable (VBNC)–like state, and it favors L. pneumophila and a few other Legionella spp., such that not all Legionella spp. associated with disease are identified (Lee et al., 1993). Approaches to recover the bacteria from the VBNC-like state have been reported (Oliver, 2005), including co-culture with Acanthamoeba polyphaga (Dusserre et al., 2008) as discussed below. Newer MPN methods may be easier to implement and, once fully vetted, could facilitate more widespread use by utilities, building owners, and public health laboratories.
Use of Amoeba
Amoeba co-culture for the recovery of legionellae from clinical and environmental samples was first described by Rowbothom (1980, 1983). While there are many bacterial pathogens that resist the digestive processes of predatory amoeba (so-called amoeba-resisting bacterial
pathogens, Thomas et al., 2010), L. pneumophila is the most recognized in water systems (Corsaro et al., 2010; Tosetti et al., 2014). Amoeba of the genus Acanthamoeba are generally used for co-culture (Pagnier et al., 2008) because of the ease with which they are grown in cell culture, but different amoebal hosts and incubation temperatures may influence which specific L. pneumophila strains are recovered (Buse and Ashbolt, 2011). Use of amoeba from the local environment has also recovered L. pneumophila when other American Type Culture Collection (ATCC) Acanthamoeba polyphaga failed to recover any isolate (Dey et al., 2019).
Methods to recover amoebae from environmental samples are based on those developed over the past several decades. An environmental sample is applied to a lawn of viable E. coli prey on non-nutrient agar plates (e.g., 2% Neff’s saline) and incubated at 25°C for up to two weeks, identifying any clearing zones with observable trophozoites moving away from the originally applied zone, and then re-streaking onto fresh plates (e.g., Amaro and Shuman, 2019; Lorenzo-Morales et al., 2005). The use of different prey and temperatures can recover a greater diversity of isolates, but is generally not undertaken.
To isolate legionellae using the amoeba co-culture method, an environmental water sample is incubated with amoeba obtained from a fresh, exponential culture using several dilutions to optimize the prey-to-host ratio, and then incubating the co-culture at 30°C for 12 hours. Co-cultures are observed by phase microscopy to identify trophozoites exhibiting lysis or growth of intracellular bacteria. Finally, the Legionella is isolated on BCYE agar.
Amoebae co-culture methods have not been standardized and have primarily been used in the research arena and in reference laboratories in Europe for water and clinical samples. This culture technique takes at least an additional three days, whereby the sample is first co-cultured, then the resulting amoebae-resisting bacteria are grown as usual on BCYE agar or are rapidly identified by qPCR/sequencing (e.g., Corsaro et al., 2009; Lienard et al., 2011). Advantages of co-culture are improved isolation and detection of viable microbes and recovery of isolates to compare to clinical isolates. Amoebae co-culture is also presumably biased toward Legionella that readily infect amoebae, thus serving as a proxy for virulence within human macrophages. The disadvantages of co-culture are lack of quantification, the time to obtain results, lack of standardization, and minimal information on its utility in routine monitoring.
PCR, qPCR, and ddPCR
There has been significant growth in the use of molecular techniques either in combination or independently for detection and characterization of Legionella in environmental samples (Borges et al., 2012). PCR was first introduced in 1985 and initially provided presence/absence data. Today PCR kits that include appropriate standards and quality controls and instruments to run the test are widely available. PCR can be much less expensive than culturing Legionella and entails less time per sample, producing results in hours instead of days. Because it relies on DNA sequence recognition, PCR can provide very high specificity and confidence in detecting the intended target.
PCR works by cycling between high and low temperatures to separate and then anneal the DNA in a water sample. Specific, small pieces of DNA called primers direct the polymerase enzyme to copy a specific gene sequence. Finally, the genetic sequence of the DNA fragment that has been amplified is determined. The amount of target DNA produced each cycle increases exponentially, enabling easy visualization of the final PCR product by staining and verifying the correct molecular weight by size separation methods, such as electrophoresis. In practice, the water sample is initially filtered, the captured bacteria are removed from the filter and lysed, and their DNA is extracted for use as the template in the PCR amplification reaction. The method detects all cells in the sample, including culturable, inactivated,
and VBNC-like cells, and potentially any DNA from dead organisms. PCR approaches are available for all species in the genus of Legionella (by analyzing the 16S or 23S rRNA gene), for L. pneumophila (mip gene), and for L. pneumophila serogroup 1 (a region of the wzm gene, spanning nucleotides 99 to 392). Primer sets have also been published for L. anisa, L. bozemanii, L. longbeachae (Saint and Ho, 1999), and L. micdadei (Cross et al., 2016). The use of L. pneumophila serogroup 1-specific primers is relatively new, but appears to be gaining momentum since it was first introduced (Mérault et al., 2011).
More recently, quantitative PCR (qPCR) and droplet digital PCR (ddPCR) methods have been developed, which are a great improvement over traditional PCR in that they provide quantitative information. The quantitative units of qPCR and ddPCR are gene copies (GC) per unit volume (e.g., GC/L). qPCR works the same as traditional PCR, but it incorporates a dye or probe in the reaction and uses a specialized instrument that can detect and quantify the signal as product is formed. Comparison of the exponential product amplification curves of samples to those generated by a standard curve of positive control DNA templates of known concentration allows quantification of gene copies per reaction. Units can then be converted to gene copies per volume of sample collected and subject to DNA extraction. ddPCR is a newer alternative to qPCR that provides rapid absolute quantification, without need for a standard curve, and is less sensitive to PCR inhibitors. Consequently, ddPCR can be applied to more than one genetic marker at a time, a procedure called multiplexing. The method works by dividing the sample into about 60,000 droplets wherein the PCR reaction occurs; the numbers of positive and negative droplets then provide a most probable number of the concentration.
Figure 3-5 provides the results from a seeded water sample using the primers and gene sequence for the genus Legionella (23S rRNA gene) and the L. pneumophila-specific mip gene.
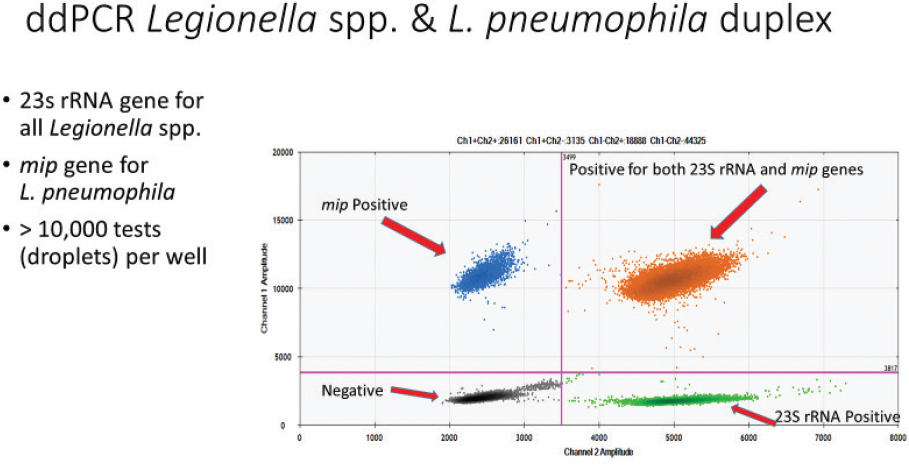
SOURCE: Courtesy of Joan Rose.
Because qPCR and ddPCR capture all DNA, even from dead cells, more evaluation is needed before one could apply these methods during routine monitoring, particularly in environments containing high levels of disinfectants (e.g., cooling towers, hot tubs) where there is likely to be more DNA derived from dead cells. Culture and qPCR have been compared and contrasted for drinking water and cooling towers for detection of L. pneumophila and L. pneumophila serogroup 1 (Toplitsch et al., 2018). Twenty (20) drinking-water samples were examined, and the agreement was very good for L. pneumophila (90 percent positive by qPCR, 95 percent positive by culture, and 85 percent positive for both). In contrast, samples from cooling towers (n = 52) were scored as 60 percent positive using qPCR, 23 percent positive by culture methods, and 19 percent positive by both methods. For L. pneumophila serogroup 1, the agreement was poor for drinking water (10 percent, 5 percent, and 0 percent positive by qPCR, culture, or both, respectively), although slightly better for cooling towers (21 percent, 13 percent, and 4 percent positive by qPCR, culture, or both, respectively). When both tests were positive, generally qPCR reported 10- to 100-fold higher concentrations, although there was a positive correlation between the two tests. Another study similarly found that quantification of L. pneumophila by qPCR trends with that by culture in both hot water and cooling tower samples, but with consistently higher estimates (Yaradou et al., 2007). Lee et al. (2011) attempted to translate CFU/L into GC/L by comparing international results for both metrics from 232 cooling tower samples and 506 hot- and cold-water samples. There was a 2-log difference between qPCR (GC/L being higher) and culture (CFU/L) in cooling towers for Legionella species, but only a 0.71-log difference for L. pneumophila. For drinking water taps, there was a 1.05-log and 0.62-log difference between GC/L and CFU/L, respectively, for Legionella and L. pneumophila. PCR and culture-based tests can produce distinct results for several reasons. In addition to the capture of both VBNC-like and dead cells by PCR, variability in the distribution of the bacteria in any given water sample (e.g., one sample may have a clump of cells), differences in detection limits, efficiencies of the methods, and multiple gene or genome copies within a cell can result in different outcomes.
The advantages of qPCR and ddPCR include rapid results, the ability to design primers that have high specificity, and low cost, which allows for large numbers of samples to be tested. The disadvantages are that qPCR detects cells regardless of their viability. The use of PCR methods is becoming more widespread for clinical surveillance and outbreak detection and, if applied appropriately, could also be used for routine monitoring of water systems. Cooling towers are rarely monitored routinely by qPCR, in part because of the high concentrations of disinfectant and corresponding high levels of DNA from dead cells. However, even an increase in total Legionella DNA means that growth conditions are not being controlled somewhere in the system and is worthy of further investigation. When applied consistently, qPCR can be very useful for estimating baseline numbers of Legionella, even in disinfected systems, with increases and decreases indicative of growth and death in the system. Yaradou et al. (2007) noted good correspondence between qPCR and culture-based methods targeting L. pneumophila in cooling towers and suggested that qPCR could be adapted for more wide-scale cooling-tower monitoring in the future. It is not unprecedented to move from a culture-based method to qPCR, as was done for recreational waters (i.e., beaches) for E. coli and enterococci monitoring (Gonzalez and Noble, 2014). Now that there is an ISO method for qPCR detection of Legionella (ISO, 2019), it would be appropriate to compare the two methods (qPCR and a culture method) for a variety of buildings and water systems in order to help interpret qPCR-generated data. It is likely that greater application of qPCR will occur in the future given the speed with which qPCR can provide information.
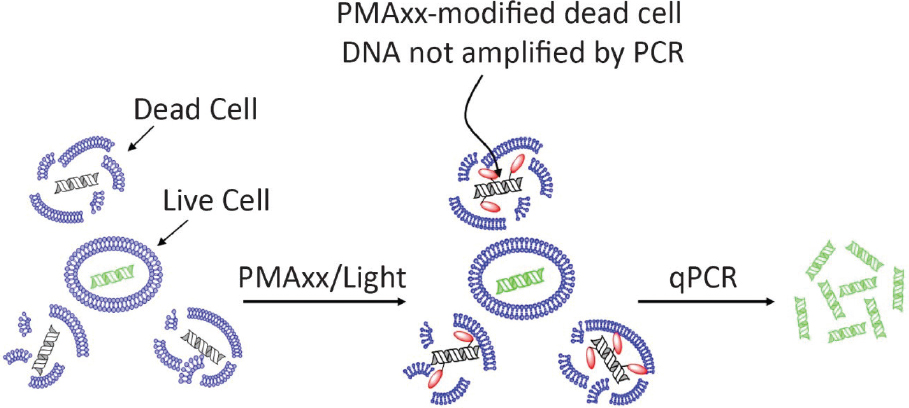
SOURCE: https://biotium.com/product/viability-pcr-starter-kits. Image by Biotium® Inc.
Viability Analyses. To alleviate concerns that qPCR also detects non-viable bacteria, several methods have been developed that favor DNA (or RNA) detection and quantification of viable Legionella. One such method uses ethidium monoazide (EMA) or propodium monoazide (PMA) in combination with qPCR (Nocker et al., 2006; Nogva et al., 2003), referred to as viability qPCR. The first working principle is that on light exposure, both PMA and EMA bind to DNA and, as a result, this bound DNA can no longer be amplified by qPCR because the qPCR primers cannot bind to EMA/PMA-bound DNA (see Figure 3-6). Second, theoretically EMA and PMA cannot enter a cell when the cell membrane is intact, which is one of the viability parameters of a microbial cell (Hammes et al., 2011). As a result, free DNA and DNA from cells with a compromised membrane are bound with EMA or PMA, and that DNA will not be amplified during qPCR. In a similar way, cell integrity vital staining can be used in combination with flow cytometry.9
Viability qPCR has been used to quantify membrane-intact legionellae cells (e.g., Chen and Chang, 2010; Lizana et al., 2017). In general, these studies showed that when disinfected water samples were exposed to PMA or EMA, the gene copy numbers of Legionella calculated were between the number of Legionella colony forming units obtained by culture and the number of gene copies obtained with qPCR without PMA or EMA exposure. Accordingly, PMA or EMA seem to bind some of the Legionella DNA from membrane-intact cells that might still be viable after disinfection. However, serious precautions have been raised about the use of EMA and PMA to quantify viable Legionella, especially for environmental samples (Kirschner, 2016). These methods are not appropriate for studies involving a disinfectant whose mode of action does not affect membrane integrity, such as ultraviolet (UV) light. Furthermore, there has been a lack of consistency among viability qPCR studies. For instance, the optimal EMA or PMA concentration for the viability assay reported in one study was shown to be cytotoxic to Legionella in another (Chang et al., 2010; Reyneke et al., 2017; Scaturro et al., 2016). In addition, the PMA method can overestimate viable Legionella cells (Scaturro et al., 2016). Moreover, Taylor et al. (2014)
___________________
concluded that PMA is not an appropriate method for discriminating between live and dead Legionella cultivated under environmental conditions. Similar results have been obtained with EMA and PMA treatment of Legionella cells directly harvested from drinking water biofilms or cooling tower water, although the assay worked well with laboratory grown Legionella cells (Ditommaso et al., 2014; Wullings et al., 2016).
When compared to live/dead stain flow cytometry, viability qPCR for L. pneumophila overestimated membrane-intact cells when a large portion of the cells were membrane-compromised but underestimated membrane-intact cells when a large portion of the cells were membrane-intact. Thus, viability qPCR appears to be qualitative rather than quantitative. Furthermore, the performance of EMA and PMA treatment is much lower with shorter amplicon lengths (less than 200 base pairs or bp) than with larger amplicon lengths (greater than 400 bp) (Ditommaso et al., 2015; Wullings et al., 2016). Accordingly, larger qPCR gene targets of Legionella may be optimal. However, most companies providing molecular tools for qPCR recommend that amplicon lengths not exceed 200 bp for optimal qPCR. Kontchou and Nocker (2019) have recently optimized the PMA assay for L. pneumophila, which includes a longer amplicon (633 bp), higher incubation temperature, and addition of ethylenediamine tetraacetic acid (EDTA) and deoxycholate. They determined that the membrane-intact L. pneumophila cell numbers obtained with PMA-qPCR were in agreement with membrane-intact cell numbers obtained with flow cytometry, demonstrating potential for this optimized assay, with the caveat that L. pneumophila strains were cultivated under optimal conditions. Overall it can be concluded that, although PMA or EMA treatment in combination with qPCR might have merit to distinguish between membrane-intact and membrane-compromised Legionella, additional studies on the reliability of the method, standardization of the method, and its application to environmental samples need to be performed before qPCR assays can be applied routinely to detect viable Legionella.
Another promising molecular method that distinguishes between viable and nonviable Legionella detects precursor RNA, which is only produced by viable cells on exposure to fresh nutrients (Cangelosi and Meschke, 2014). To detect L. pneumophila by assaying for precursor RNA, samples are exposed to fresh nutrients for three hours, RNA is extracted, and then RNA from the precursor region of the 16S rRNA gene of L. pneumophila is specifically amplified with reverse transcriptase (such that the method is called RT-qPCR) (Boss et al., 2018). In one study, L. pneumophila in drinking water samples taken from public sport facilities was analyzed by RT-qPCR, cultivation, and qPCR. For 86 percent of the samples, the results with RT-qPCR and cultivation were consistent. In 7 percent of the samples the culture method was positive but RT-qPCR was negative, whereas in the other 7 percent of the samples RT-qPCR was positive but culture was negative. In addition, 17 percent of the samples that were negative with RT-qPCR were positive with qPCR, indicating the presence of DNA from dead L. pneumophila. Others have also used RT-qPCR to detect RNA of specific genes (including virulence genes) of L. pneumophila after exposure to synthetic grey water (Buse et al., 2015) or copper (Lu et al., 2013). The specific analysis of virulence genes in these assays might provide information not only on viable L. pneumophila cells but also on their virulence potential. Although RT-qPCR seems promising, additional studies are needed in which RT-qPCR results are compared with cultivation, qPCR, and viability qPCR for detection and quantification of Legionella in different environmental samples.
Next-Generation DNA Sequencing
A handful of studies have used next-generation DNA sequencing approaches to examine Legionella or other relevant members of the microbial community in drinking water systems. Amplicon sequencing is one application that is applied to amplified PCR products obtained
from DNA extracted from mixed microbial communities. Most often amplicon sequencing uses universal primers for bacterial 16S rRNA genes to profile which organisms are in a particular drinking water or biofilm sample. Organisms are identified based on the similarity of the 16S rRNA gene sequence to entries in online databases, and the term operational taxonomic unit (OTU) defines the bacteria identified. Because at best the resolution is at the genus level, the presence of pathogens cannot be ascertained.
Nevertheless, amplicon sequencing has proved to be a powerful tool to reveal the surprising diversity of microorganisms inhabiting drinking water (Pinto et al., 2012) as well as estimate their relative abundance. In one laboratory study of domestic hot water, qPCR and amplicon-sequencing-based methods estimated Legionella spp. to be around 3 percent of the total community (Ji et al., 2018). Next-generation DNA sequencing can be applied directly to the DNA extract, without first PCR-amplifying a gene of interest, an approach referred to as shotgun metagenomic sequencing. The advantage of shotgun metagenomic sequencing is its potential to sequence all genes in a sample, including markers of function (e.g., nitrification, iron oxidation, virulence), and thus provide much richer functional information and taxonomic resolution (Gomez-Alvarez et al., 2012). However, currently metagenomic sequencing is very costly; consequently, researchers tend to employ less thorough sequencing, which results in false negatives because of high detection limits and lack of coverage. Both amplicon sequencing and metagenomic sequencing also provide rich information about non-Legionella species in water systems and could potentially provide new insight into the role of microbial ecology in Legionella propagation (Dai et al., 2018). However, for potential application to Legionella monitoring, these tools are still in their infancy (Borthong et al., 2018). In the future, next-generation sequencing of both environmental and human isolates could potentially provide insight into the relationship between environmentally abundant Legionella and disease and perhaps help to identify previously unidentified clusters of disease.
The third application of next-generation sequencing is whole genome sequencing of individual Legionella isolates (Reuter et al., 2013). Whole genome sequencing makes possible high-resolution phylogenetic comparisons of isolates associated with outbreaks, and it can also be adapted to determine the sequence type (Raphael et al., 2016). Raphael et al. (2019) have used whole genome sequencing on cultures of clinical specimens to reveal a highly diverse population of strains causing legionellosis in Arizona.
Sampling Strategy
A Legionella monitoring plan for water systems should include (1) the purpose of the monitoring, (2) what medium to sample, (3) the method to be used, and (4) where and when to sample. As discussed in Chapter 5, the precise sampling strategy should be developed and adapted to the system of interest as part of a comprehensive water management plan (see the example in Box 3-6). Monitoring for Legionella in building water systems can have many purposes including to investigate outbreaks, to support remediation or mitigation, to demonstrate compliance with a guideline or regulation, as part of diagnostic surveys, and for research (see Table 3-1). Once the purpose is determined, the methods should be linked to the desired information. The priority may be confirmation or quantification, determining viability, or distinguishing serogroups or sequence type. For example, culture and viability are of interest when disinfection is being used for remediation. For compliance monitoring, the methods are usually prescribed. Surveys generally attempt to use standardized methods to facilitate comparison. Nonetheless, newer methods such as qPCR have great potential to quantitatively examine more samples at a lower cost and much more rapidly. Legiolert™ may enable greater ease in sampling at a lower cost than current culture methods, although the time to receive results remains one week.
First, the water system to be sampled must be identified, such as cooling towers, residences, public buildings such as hotels, resorts, hospitals, drinking water, and wastewater. In particular, points thought to be most vulnerable to Legionella growth and where potential for human exposure is high should be prioritized. For example, within buildings, premise plumbing monitoring should include distal sites that have potential both for Legionella growth and human exposure; these include showers and taps, decorative fountains, and storage tanks. Although Legionella growth is less likely in the hotter water of recirculation lines and water heaters, sampling these locations is also important for confirmation and to provide a baseline.
The various media that can be targeted for sampling include the bulk water, biofilm, or the aerosols generated. Most sampling strategies and methods have focused on the bulk water because it is easy to collect, various volumes can be readily targeted, and it can be concentrated via filtration. In addition, first-flush samples are thought to capture water that has been stagnating (thus more likely allowing for bacterial growth), potentially better representing what has sloughed or diffused off of the biofilm. (It should be noted that most studies lack any quantitative assessment of stagnation. For example, a study of 807 drinking water samples from nine buildings found occurrences to be significantly
correlated with stagnation, but this was described only qualitatively as “low withdrawals” [Völker et al., 2016]).
Legionella bacteria are known to associate with biofilms and their amoeba. However, swab samples have had limited value in decision making for remediation of premise plumbing. Swabs are not analyzed routinely because it is impossible to collect a representative biofilm sample from the miles of premise plumbing in a building, there is no standard method available, and there is no consistent way to report the concentrations found. Developing better methods for sampling premise plumbing biofilms is clearly a research need.
Because aerosol sampling is much more complicated than sampling the bulk water and still under development, aerosols are generally not included in a sampling strategy. Nonetheless, aerosols can be collected as they are generated using various types of impingers or impactors. A research program to understand the difference between measured Legionella concentrations in bulk water and in aerosols would be useful (Prussin et al., 2017).
The detection methods applied should include more than one technology (likely a culture method and a molecular method, e.g., qPCR) and be quantitative. Laboratories will continue to use culture but may use more than one medium; this may be unnecessary if, for example, qPCR or ddPCR was used first to examine more rapidly the concentrations of
specific species or L. pneumophila serogroup 1. The detection limit should be carefully documented, addressing both the volume collected and concentrated. More experience is needed where both types of results (culture and molecular methods) are available, thus providing knowledge on their comparability. Sivaganesan et al. (2019) have compared qPCR methods to culture for fecal indicator bacteria on beaches over many years during the swim season. These data are now being analyzed in several states to address the comparable level of gene copies per 100 ml that would lead to beach closure on the same day rather than waiting 24 hours to obtain culture data. A similar approach could be used for Legionella.
The frequency of environmental sampling for Legionella is highly variable and ranges from once per week to once per year, depending on many factors such as the size and use of the building. Box 3-6 describes the Legionella sampling strategy applicable to large buildings with complex premise plumbing systems such as hospitals, while Box 3-7 describes the sampling strategy for cooling towers; both boxes prescribe sampling frequencies. In general, however, the numbers of samples taken and how often they are collected have been based on resources and logistics rather than on an understanding of the ecological niche of the bacteria. Temporal studies with recommendations on how often to monitor and over what
time frame have yet to be undertaken. Nor has there been a clear statistical assessment of the frequency of sampling needed to capture Legionella growth, blooming, and sloughing events. To evaluate temporal changes such as seasonality, several years of monitoring would be needed.
More widespread and improved national laboratory certification is needed for current approaches and for new methods, which includes standardized protocols, quantitative assessment, training and proficiency testing. The Environmental Legionella Isolation Techniques Evaluation (ELITE) Program has oversight from the CDC, but since November 2016, the Wisconsin State Laboratory of Hygiene has managed the production and distribution of testing samples as well as analysis of laboratory results. Twice per year, participating laboratories receive cultures for verification tests.10 The program issues certificates to laboratories that successfully isolate legionellae from simulated environmental samples by culture, but it is not a laboratory certification process. New York State certifies laboratories11 as do the Quebec and Alberta provincial governments in Canada.
___________________
Occurrence of Legionella in Water Systems
Much of the emphasis for environmental sampling of Legionella has been to understand its occurrence and (in some cases) concentrations in different locations. Sampling has focused on sites where aerosols that might contain the bacteria are formed, including cooling towers, showers, hot tubs, fountains, and buildings with vulnerable populations (e.g., hospitals). Over the years, better methods and lower detection limits have increased the percentage of samples that test positive for Legionella, yet concentrations have remained variable. Despite this variability, a general picture regarding the occurrence of the genus, its various species, and serogroups is emerging.
The sections below present occurrence and (when available) concentration data on cooling towers, residences, hotels and resorts, recreational venues, hospitals, cruise ships, and drinking water and wastewater treatment plants. The data were generated using either culture methods that quantify colony forming units and include cells that grow and produce colonies on solid agar, or qPCR for which the data are referred to as gene copies and that include live, VBNC-like, and dead cells with intact DNA. Data presented below represent both outbreak investigations as well as routine sampling.
Cooling Towers
Legionella data from cooling towers were collected from general surveys conducted in the absence of outbreaks as well as from outbreak investigations. One of the first studies to collect environmental data on Legionella in cooling towers was conducted in 1983 (Howland and Pope, 1983). Nine cooling towers were routinely sampled over an 18-month period (162 samples). The culture methods used only identified presumptive L. pneumophila, which was found in all samples and all systems (100 percent positive). The levels were noted to be higher in systems that were used seasonally (i.e., shutdown in the winter and drained); however, the data were not presented in detail.
In 1983, a 12-city study took place to investigate Legionella in potable water and cooling towers in Canada (Tobin et al., 1986). Calgary, Edmonton, Fredericton, Halifax, Mississauga, Montreal, Ottawa, Poplar River, Quebec City, Regina, Winnipeg, and Vancouver were part of the survey. Sampling occurred from July to September, using a 1- to 2-liter sample that was filtered and plated on BYCE agar. Of the cooling towers that were specifically examined, 28.9 percent of the samples were positive. Legionella concentrations in cooling towers were a maximum of 3.3 × 10⁴ CFU/L with a geometric mean of 4 × 10³ CFU/L. Almost all isolates were L. pneumophila species including serogroups 1, 3, 4, and 6. One isolate was L. dumoffii.
A 2016 study collected 196 cooling tower samples across various regions of the United States (Llewellyn et al., 2017). In this study, 62 percent were positive by qPCR for Legionella spp., 32 percent were positive for L. pneumophila, and 20 percent were positive for L. pneumophila serogroup 1. The authors cultured only PCR-positive samples and found that 47 percent were positive for Legionella spp., 32 percent were positive for L. pneumophila, and 24 percent were positive for L. pneumophila serogroup 1. No concentrations were reported, and no geographic differences were found.
A study of cooling towers in Singapore was one of the few conducted in a tropical environment (Lam et al., 2011). Over an eight-year period (2000–2008), 18,164 samples were analyzed by culture methods and 15.6 percent were positive for Legionella. How-
___________________
ever, a greater prevalence of positivity was found in the first three years, ranging from 48 to 68 percent, which then dropped to between 12 and 15 percent from 2004 to 2008. Although it was speculated that this decline was because of the switch to chloramines, the drop occurred prior to implementing the change in disinfectants (which was in 2005). Again, concentrations were not reported.
Investigations into 255 industrial cooling towers in China revealed a positivity rate of 37 percent using culture techniques (Li et al., 2015). 121 isolates were characterized and all were L. pneumophila, mostly serogroup 1 (56.2 percent), although serogroups 6, 5, 8, 3, and 9 (at 20.7, 9.9, 6.6, 5.0, and 1.6 percent, respectively) were also identified. Concentrations between 100 CFU/L and 88,000 CFU/L were reported, with an average of 9,100 CFU/L.
Widespread monitoring of cooling towers in NYC was undertaken during an outbreak of Legionnaires’ disease from November 2014 to January 2015. This included power plant cooling towers, in which 29 of 30 samples were positive by PCR (although primers or genes examined were not mentioned), as well as shopping mall cooling towers, in which eight of ten were positive by PCR for L. pneumophila. Those that were positive were cultured, and 90 percent (27/30) and 12 percent (1/8) from the power plants and shopping mall cooling towers, respectively, were positive for L. pneumophila serogroup 1 using serology (Benowitz et al., 2018). Concentrations were not reported in these studies. The methods used are poorly described, with no indication of the detection limit for the sampling.
Walser et al. (2014) summarized 19 outbreaks associated with cooling towers from around the world, nine of which had environmental sampling data. Interestingly, the Legionella concentrations were greater than 5 × 10⁵ CFU/L and as high as 1 × 10⁸ CFU/L with an average 1.4 × 10⁷ CFU/L, with the exception of one outbreak from Norway (2 × 10³ CFU/L). These concentrations are above the average found in the Chinese studies of 9.1 × 10³ CFU/L. Attack rates were not calculated because it was unknown how many people were exposed to the cooling towers. The concentrations were not related to the number of cases or cases/day, although there was a positive relationship between duration of the outbreak and concentrations.
Residences and Public Buildings
Surveillance of Legionella in residential premise plumbing taps and showers has been undertaken in many parts of the world because of the concerns associated with sporadic cases of Legionnaires’ disease in a community that cannot be linked to hospitals, hotels, or cooling towers. Some studies have linked an individual with Legionnaires’ disease to a source within their residence, such as Chen et al. (2002). L. pneumophila serogroup 6 was isolated from both the patient and his home potable water system as confirmed by pulsed-field gel electrophoresis (a method used to fingerprint DNA from bacteria). Other studies implemented over the past 30 years have tried to broadly survey environmental data from residences in China, Germany, Italy, Spain, the United Kingdom (UK), and the United States. In some cases, there was an attempt to examine levels of Legionella in taps in homes or areas of a city where Legionnaires’ disease cases had occurred (Stout et al., 1992).
The data from 11 studies are shown in Figure 3-7. Taken together, these data show that the percentages of samples positive for L. pneumophila (using culture methods for Legionella followed by a colony confirmation test specific to L. pneumophila) ranged from 5 percent to as high as 33 percent. When culture methods for Legionella (without colony confirmation testing) were used, positives ranged from 8 percent to 23 percent. As expected, qPCR reported higher numbers of positive samples for Legionella spp. (28 percent to
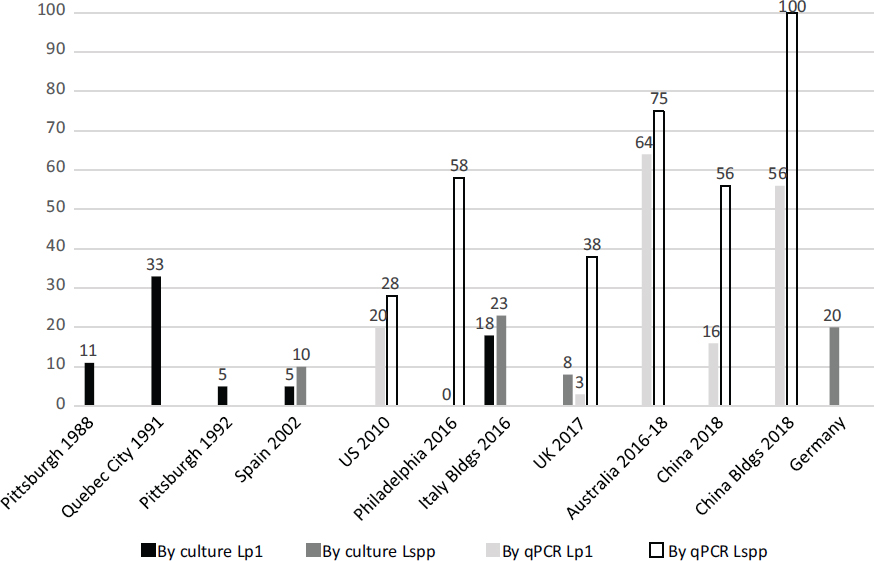
SOURCES: Pittsburgh 1988 (Lee et al., 1988); Quebec City (Alary and Joly, 1991); Pittsburgh 1992 (Stout et al., 1992); Spain (Codony et al., 2002); U.S. 2010 (Donohue et al., 2014); Philadelphia (Hamilton et al., 2018b); Italy (Totaro et al., 2017); UK (Collins et al., 2017); both China columns (Li et al., 2018); Germany (Dilger et al., 2018).
100 percent) but not notably higher for L. pneumophila (3 percent to 64 percent). Average concentrations for L. pneumophila reported in the various studies were 1.1 × 10³ CFU/L (UK), 3-5 × 10³ CFU/L (Spain) and 1 × 10⁴ to 6 × 10⁵ CFU/L (Pittsburgh). Using qPCR approaches, concentrations were reported at 4.0 × 10³ GC/L for L. pneumophila (UK) and 104 GC/L (China). For other Legionella species, the concentrations were 1.2 × 10⁴ GC/L (UK) and 7.7 × 10⁴ to 8.4 × 10⁶ GC/L (China). Levels were found at 105 GC/L for Legionella spp. in rain barrels (where no L. pneumophila was detected).
Insights are provided by the studies in Figure 3-7. Stout et al. (1992) found L. pneumophila was associated with lower water temperatures in water heaters (at or below 41°C), with no prevalence in any particular kind of tap. While many suggest warm-water taps should be sampled, the data suggest that all taps can be positive. In China, L. pneumophila was more frequently found in public buildings than in residential buildings, perhaps because of higher water age (Li et al., 2018). In public buildings in China, negative correlations were noted between Legionella numbers and total chlorine residuals and between total 16S rRNA gene copy numbers and total chlorine in both the first draw and post flushing (Li et al., 2018). Storage appeared to increase Legionella numbers, which were slightly higher in underground systems (average 1.95 × 10⁶ ± 2.49 × 10⁶ GC/L) compared to rooftop storage (7.8 × 10⁵ ± 1.40 × 10⁶ GC/L, P < 0.05).
A German study (Dilger et al., 2018) involved 76,200 samples taken from 13,397
warm-water systems. Ninety-four (94) percent were private homes, with the rest being schools, town halls, sports facilities, hotels, hospitals, and retirement homes. While the average Legionella concentration was not reported, 14 percent had less than 103 CFU/L (reported per 100 mL in the paper, i.e., 100 CFU/100mL) and 0.19 percent had 104 to 105 CFU/L (which according to German standards is a level at which showering would be restricted). 20.7 percent of samples were positive for Legionella spp., of which L. pneumophila was the prominent species (83.9 percent) followed by L. anisa and 12 other species. The differences in abundance of the various species detected were partly explained by temperatures, as L. pneumophila was present at all temperatures from 10°C to 60°C, while L. anisa was more abundant at low temperatures and other species were limited to narrower temperature ranges.
Higher Acanthamoeba concentrations in taps fed by tanks compared to those fed by mains were reported in the studies in Hong Kong, Korea, and the UK (Boost et al., 2008; Jeong and Yu, 2005; Seal et al., 1992). L. pneumophila, Acanthamoeba, and V. vermiformis were also detected in tank and tap water in the Chinese study (Li et al., 2018).
Donohue et al. (2014) surveyed 68 public and private cold-water taps from 2009 to 2010. Low concentrations of L. pneumophila serogroup 1 were found, between 40 and 620 GC/L, in around 50 percent of the positive samples; yet on occasion, a high level was found up to 105 GC/L, creating an average of 1.97 × 10³ GC/L with a median of 62 GC/L. This study found that 47 percent of sampled drinking fountains were contaminated with L. pneumophila serogroup 1, with 18 percent of the fountains (3/17) consistently positive.
The prevalence of Legionella in hot and cold water was investigated in 141 homes equipped with various types of domestic water heaters (38 percent gas, 38 percent electric, 18 percent oil, and 7 percent solar) in four regions of France (Wallet et al., 2016). Samples by culture exceeded 1,000 CFU/L in 5 percent of hot water and 5.6 percent of cold water from mixing valves and taps. Results using solid phase cytometry for Legionella were strikingly higher, with a prevalence of 41 percent in hot water, 52 percent for cold water, and 53 percent for mixed water.
Verhoef et al. (2004) showed that Legionella was present more often in homes that had not been inhabited for ten days than those that had been occupied. Although the results were not significant, the study suggested that some Legionnaires’ disease attributed to temporary accommodation sites (e.g., hotels) might be due to domestic exposure.
A study in Australia examined the occurrence and concentrations of Legionella in home showers using qPCR (Hayes-Phillips et al., 2019). Legionella spp. and L. pneumophila were positive in 74.6 percent (50/68) and 64.2 percent (43/68) of the showers, respectively. The researchers also demonstrated that qPCR had the potential to demonstrate increased growth potential of the bacteria and exposures at temperatures between 40°C and 60°C.
Hotels and Resorts
Legionella is frequently found in hotels and resorts. Papadakis et al. (2018) collected 518 samples from 119 hotels in Crete and assayed them by culture; of these, 36 percent (n = 43/119) of the hotels and 13 percent of the samples (n = 67/518) tested positive. The majority of positive samples were from swimming pool showers (see Figure 3-8). Like many studies, few samples (n = 5) tested positive for L. pneumophila serogroup 1. Table 3-3 shows the distribution of species, serogroups, and concentrations, respectively. The concentrations of L. pneumophila serogroup 1 ranged from 3.5 × 10² to 1.15 × 10³ CFU/L. This study is similar to many surveys where a range of isolates is found, with concentrations similar to those previously reported.
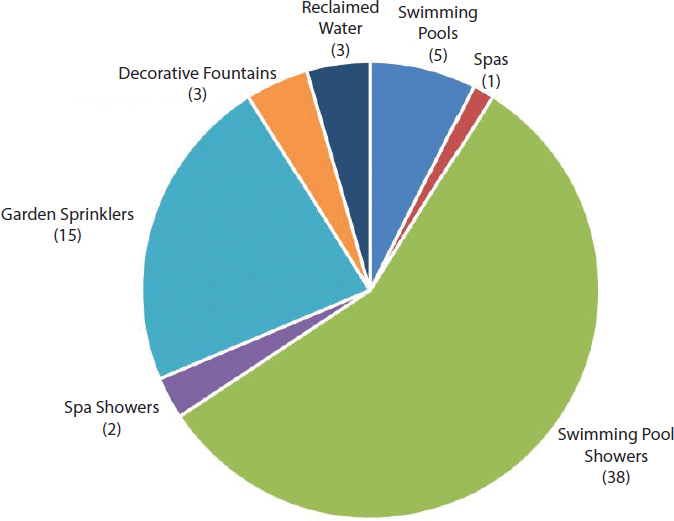
SOURCE: Papadakis et al. (2018).
TABLE 3-3 Concentration Ranges of Legionella Species and Serogroups Detected in Hotel Swimming Pool Showers by Culture
| Species/Serogroup | # of Positive Samples | Pool Shower Low CFU/L | Pool Shower High CFU/L |
|---|---|---|---|
| L. pneumophila serogroup 1 | 5 | 350 | 1,150 |
| L. pneumophila serogroup 2 | 4 | 100 | 2,050 |
| L. pneumophila serogroup 3 | 0 | ||
| L. pneumophila serogroup 6 | 1 | 150 | |
| L. pneumophila serogroup 7 | 5 | 200 | 3,350 |
| L. pneumophila serogroup 8 | 1 | 50 | |
| L. pneumophila serogroup 13 | 0 | ||
| L. pneumophila serogroup 14 | 3 | 150 | 100,000 |
| L. pneumophila serogroup 15 | 0 | ||
| L. pneumophila serogroup 2-15 | 8 | 50 | 100,000 |
| L. anisa | 9 | 250 | 300,000 |
| L. erythra | 3 | 400 | 13,000 |
| L. taurinensis | 2 | 650 | 8,250 |
| L. birminghamensis | 1 | 50 | |
| L. rubrilucens | 3 | 50 | 6,500 |
| L. species | 4 | 50 | 1,000 |
SOURCE: Papadakis et al. (2018).
In Flint, Michigan, 16 samples from hotels and schools were collected from 2015 (during the Legionnaires’ disease outbreak) to 2016 (after the outbreak). No L. pneumophila was detected, but about 50 percent of the samples were positive for Legionella spp. by qPCR at 2.3 × 10³ GC/L (Rhoads et al., 2017).
In a study of 51 hotels in Greece and Corfu that had been linked to travel-associated Legionnaires’ disease (via epidemiological methods although no outbreaks were identified), Kyritsi et al. (2018) reported that 74.5 percent of the hotels were colonized with Legionella spp. The study took place between October 2011 and December 2012, and hygienic inspections and physiochemical data were also collected. Samples were primarily collected from showers (n = 496), with a few others from swimming pools (n = 36), taps (n = 8), coolers (n = 2), boilers (n = 3), cold-water tanks (n = 3), hot tubs (n = 4), cooling towers (n = 3) and one fountain, for a total of 556 samples. For each sample, 500 mL were filtered and assayed by culture methods with a detection limit of 100 CFU/L. In hot- and cold-water taps, L. pneumophila was found in 76.8 percent of the samples (with L. pneumophila serogroup 1 and L. pneumophila serogroups 2-15 at positive rates of 35.8 percent and 41.4 percent, respectively). Non-pneumophila Legionella was detected in 10.9 percent of the samples. Detection was greater in hot water (41 percent positive) and hot tubs (75 percent) compared to cold-water samples (21.4 percent). Those systems with copper piping had samples that were 12.1 percent positive versus 30.4 percent positive in systems without copper. Free chlorine levels of greater than 0.375 mg/L were negatively associated with Legionella. The following parameters were positively associated with Legionella in the cold-water systems (pH >7.45, heterotrophic bacteria ≥2.5 × 10⁴ CFU/mL, conductivity ≥1,775 uS/cm (at 25°C), hardness ≥321 mg CaCO3/L, and calcium concentrations ≥150 mg CaCO3/L) (Kyritsi et al., 2018). The regulations in Greece set a limit of 103 CFU/L for Legionella. Some of the hotels in this study that were deemed unsatisfactory using parameters such as hygiene and chlorine were also above this limit for Legionella.
Recreational Venues. Recreational sources such as hot tubs and hot-spring baths have long been associated with outbreaks of Legionnaires’ disease and Pontiac fever, primarily caused by L. pneumophila serogroup 1. Table 3-4 shows the concentration data collected
TABLE 3-4 Attack Rates, Case Numbers, and Legionella Concentrations Measured in Recreational Waters During Selected Outbreaks
| Venue | Attack Rate (%) | Cases | Concentrations (CFU/L) |
|---|---|---|---|
| Pontiac Fever | |||
| Indoor whirlpool | 38 | 13 | 1.00 × 10⁶ |
| Hotel whirlpool spa | 66–72 | 45 | 9.00 × 10⁴ |
| Resort spa | 86 | 6 | 100 |
| Legionnaires’ Disease | |||
| Public bathhouse | 0.13 | 23 | 8.80 × 10⁵ |
| Public bathhouse | 0.2 | 34 | 8.42 × 10⁴ |
| Hot-spring bath | 1.5 | 295 | 1.60 × 10⁶ |
| Public bathhouse | 0.13 | 9 | 1.30 × 10⁶ |
| Public whirlpool spa | ? | 3 | 1.50 × 10⁵ |
SOURCE: Leoni et al. (2018).
from recreational waters by Leoni et al. (2018) during outbreak investigations that included environmental monitoring using culture techniques. The Legionella concentrations were generally greater than 105 CFU/L in these outbreaks, with little association among cases, attack rates, and concentrations. Pontiac fever outbreaks showed much higher attack rates than Legionnaires’ disease.
Hospitals
There is great concern about Legionella infections in hospitals because of their susceptible populations. As mentioned in Box 3-6, in many large hospitals Legionella monitoring has been undertaken to confirm that water treatment is suppressing bacterial growth in the premise plumbing. The goal for most hospitals is to detect no Legionella. Monitoring is undertaken to provide assurance to patients and managers of the building that controls are working. Culture methods are used most frequently, and any positive results tend to instigate investigation and remediation.
Stout et al. (2007) examined Legionella culture data from 20 hospitals in 14 U.S. states between 2000 to 2002 (see Table 3-5). As few as ten and as many as 80 samples were col-
TABLE 3-5 Legionella Detection in Premise Plumbing of 20 Hospitals
| Hospital Location | Cases of Legionellosis Identified | >30% of Distal Water Outlets Positive for L. pneumophila | L. pneumophila sg 1 %+ (#+/total) | L. pneumophila sg 2-14 %+ (#+/total) | L. anisa %+ (#+/total) |
|---|---|---|---|---|---|
| CA | Yes | Yes | 47 (7/15) | 0 (0/15) | 13 (2/15) |
| PA | Yes | Yes | 30 (12/40) | 25 (10/40) | 0 (0/40) |
| NY | Yes | Yes | 36 (8/22) | 0 (0/22) | 0 (0/22) |
| IA | Yes | Yes | 35 (19/55) | 0 (0/55) | 0 (0/55) |
| NE | No | Yes | 83 (58/70) | 0 (0/70) | 24 (17/70) |
| OH | No | No | 25 (11/44) | 0 (0/44) | 0 (0/44) |
| AZ | No | No | 20 (10/49) | 12 (6/49) | 16 (8/49) |
| MI | No | No | 5 (2/44) | 14 (6/44) | 7 (3/44) |
| FL | No | No | 17 (2/12) | 0 (0/12) | 8 (1/2) |
| WV | No | No | 12 (7/58) | 0 (0/58) | 12 (7/58) |
| CA | No | No | 7 (3/42) | 0 (0/42) | 0 (0/42) |
| OH | No | No | 0 (0/57) | 67 (38/57) | 28 (16/57) |
| TN | No | No | 0 (0/28) | 7 (2/28) | 4 (1/28) |
| MA | No | No | 0 (0/20) | 5 (1/20) | 0 (0/20) |
| KY | No | No | 0 (0/10) | 0 (0/10) | 0 (0/10) |
| MI | No | No | 0 (0/44) | 0 (0/44) | 0 (0/44) |
| DE | No | No | 0 (0/23) | 0 (0/23) | 9 (2/23) |
| NY | No | No | 0 (0/12) | 0 (0/12) | 0 (0/12) |
| NY | No | No | 0 (0/13) | 0 (0/13) | 0 (0/13) |
| MI | No | No | 0 (0/10) | 0 (0/10) | 0 (0/10) |
SOURCE: Stout et al. (2007).
lected per hospital. Legionella (specifically L. pneumophila serogroup 1, L. pneumophila serogroups 2-14, and L. anisa) was detected in 70 percent of the hospitals. These investigators characterized “high level colonization” as when 30 percent or more of the distal outlets were positive for L. pneumophila. A total of 668 samples were collected and 21.4 percent were positive for L. pneumophila serogroup 1, 9.4 percent for L. pneumophila serogroups 2-14, and 9.9 percent for L. anisa. At hospitals that were positive, the percentages ranged from 5 to 83 percent, 5 to 67 percent, and 4 to 28 percent for L. pneumophila serogroup 1, L. pneumophila serogroups 2-14, and L. anisa, respectively. Eleven (11) hospitals had L. pneumophila serogroup 1, but only four of these had known cases of Legionnaires’ disease.
Two hospitals in Flint, Michigan, were tested after an outbreak of Legionnaires’ disease in 2014 and 2015. The prevalence and concentrations of Legionella from October 2015 and March 2016 were measured using qPCR (see Table 3-6 and Rhoads et al., 2017). These two time points corresponded to before and after the Flint drinking water was switched from the Flint River back to Lake Huron; October 2015 was also identified as near the end of the outbreak. The percent positives ranged from 3 to 74 percent for L. pneumophila and from 29 to 94 percent for Legionella spp. Concentrations in the positive samples were similar (103 GC/L), regardless of the percent positive. Nonetheless, both percent positives and concentrations were considerably higher in October 2015 compared to March 2016.
Although dozens of hospitals are monitoring for Legionella, long-term monitoring data are not readily available. Box 3-8 describes the Legionella monitoring program and the resulting data, as well as the engineering approaches used, from one hospital after a decade of testing the water in the hospital’s premise plumbing. This extensive database suggests that non-detects can be achieved and that improvements in water treatment of hospital plumbing systems assist in achieving this outcome.
Monitoring has also been used to prove that remediation efforts in hospitals are successful after an outbreak. A nosocomial outbreak of Legionnaires’ disease in 2013 in Australia was followed by extensive cleaning of the water system using heat, flushing, and chlorination
TABLE 3-6 Number and Percentage of Samples Positive and Average Concentrations for L. pneumophila and Legionella spp. at Hospitals in Flint, Michigan, October 2015 and March 2016, by qPCR
| Locations | Total # of samples | Lp # + | % Positive | Average Concentration GC/L | L spp. # + | % positive | Average Concentration GC/L |
|---|---|---|---|---|---|---|---|
| October 2015 | |||||||
| Total | 98 | 51 | 52 | 3,000 | 80 | 82 | 3,300 |
| Hospital A | 46 | 34 | 74 | 3,000 | 43 | 94 | 3,400 |
| Hospital B | 52 | 17 | 33 | 3,000 | 36 | 69 | 3,100 |
| March 2016 | |||||||
| Total | 44 | 1 | 2 | Below quantification | 16 | 36 | 2,300 |
| Hospital A | 35 | 1 | 3 | Below quantification | 10 | 29 | 2,500 |
| Healthcare facility | 9 | 0 | 0 | Below quantification | 6 | 67 | 1,900 |
| Grand total | 142 | 52 | 36.5 | 96 | 67.7 | ||
NOTE: GC = gene copy detected by qPCR.
SOURCE: Rhoads et al. (2017).
(Bartley et al., 2016). The environmental monitoring used culture methods, which attempted to match the clinical isolates to water isolates from the patients’ rooms (showers and taps were cultured). Overall 18 percent of the water samples were positive for L. pneumophila serogroup 1 ranging from 6.3 percent to 71.4 percent positive in one of the wings of the hospital. The premise plumbing was treated with 60°C water for ten minutes, yet positive samples were still detected (5/89, 5.6 percent). Disinfection was then carried out by flushing the system with a chlorinated alkaline detergent (pH = 10.0) and then superchlorinating with 10 mg/L free chlorine. Three cycles of treatment were needed to rid the hospital of Legionella.
Cruise Ships and Ferries
Goutziana et al. (2008) studied Legionella on cruise ships and ferries in Greece. No Legionella was found in the ten cruise ships’ water systems. However, 14 of the 21 ferries were positive when 276 samples of hot and cold water were analyzed, and remediation commenced. There was greater contamination in the ferries’ hot-water systems, with 38, 34, 19, 15, and 7 percent of the samples positive for Legionella spp., L. pneumophila, L. pneumophila serogroup 1, L. pneumophila serogroups 2-14, and L. pneumophila serogroup 1
concurrent with other serogroups, respectively. In cold water, 18, 15, 11, 4, and 2 percent of the samples were positive for Legionella spp., L. pneumophila, L. pneumophila serogroup 1, L. pneumophila serogroups 2-14, and L. pneumophila serogroup 1 concurrent with other serogroups, respectively. In another similar study, 12 cruise ships were found to be negative for Legionella, while 28 ferries were sampled and found to be positive 81 percent of the time (Mouchtouri and Rudge, 2015).
Drinking Water and Wastewater
Many fewer monitoring studies have focused on drinking water or wastewater systems compared to the other categories, with most studies undertaken as investigative special surveillance studies. A national study found Legionella spp. in 12 of 18 samples (67 percent positive by qPCR) from the sediments of drinking water storage tanks of nine states (i.e., Alabama, Arizona, California, Illinois, New Jersey, North Carolina, Ohio, Pennsylvania, Tennessee) at average concentrations of 5.2 × 10³ cell equivalents(CE)/gram of wet weight of sediment (Lu et al., 2015). L. pneumophila was found in 33 percent of the samples, and L. pneumophila serogroup 1 was found in 28 percent. (To facilitate comparison with other studies, dry weight rather than wet weight should have been recorded.) Developing consen-
sus on methods and data reporting is needed for these types of investigations in order to begin to build national databases and to understand the role of drinking water in seeding of premise plumbing.
Drinking water and reclaimed water were examined for Legionella species by Garner et al. (2018) using qPCR (see Table 3-7). Prevalence was higher in reclaimed water compared to potable water (89 percent versus 55 percent), and concentrations of gene copies were 10- to 100-fold higher in reclaimed water. There was no quantification of L. pneumophila, although it was annotated in samples using metagenomic approaches.
The best known example of a drinking water source playing a major role in an outbreak of Legionnaires’ disease occurred in Flint, Michigan, in 2014–2015. The outbreak coincided with a change in the source and treatment of drinking water for the City of Flint. In the absence of proper chemical corrosion control, this change in source water led to drastic increases in iron levels in the water and also risked disrupting biofilms coating the surfaces of pipes, releasing Legionella into the potable water supply of many buildings. Box 3-9 discusses this case in greater detail.
Wastewater treatment plants have been identified as sources for Legionnaires’ disease or Pontiac fever in different countries. In 2013, a large outbreak of legionellosis (159 cases) occurred in Warstein, Germany. The source for the outbreak was a cooling tower that received river water into which a biological wastewater treatment plant discharged (Maisa et al., 2015). The effluent of this wastewater treatment plant contained high numbers of L. pneumophila (approximately 107 CFU/L), and genotyping showed identical patterns in patient strains and strains from the wastewater treatment plant (Maisa et al., 2015). Investigations at the treatment plant showed that the aerobically pre-treated wastewater contained high numbers of cultivable legionellae (108 to 1010 CFU/L) (Noguiera et al., 2016), demonstrating that legionellae were capable of multiplying in this treatment process.
Wastewater treatment plants that service wood-, plant-, or food-processing industries in Denmark, Finland, Sweden, and the United States have also been identified as a source of L. pneumophila (Castor et al., 2005; Gregersen et al., 1999; Kusnetsov et al., 2010). At these locations, only workers at the treatment plants became ill with Legionnaires’ disease or Pontiac fever. L. pneumophila at relatively high concentrations (107 to 109 CFU/L) was mainly observed in sludge and effluent at these plants.
Two recent separate outbreaks of Legionnaires’ disease in The Netherlands were traced to biological wastewater treatment plants that treat animal waste (Loenenbach et al., 2018; Alvin Bartels, Dutch National Institute for Public Health and the Environment,
TABLE 3-7 Legionella spp. by qPCR in Potable and Reclaimed Waters and Biofilms
| Sample | % Positive (n=) | GC/L |
|---|---|---|
| Potable water POE | 67 (15) | 5.6 × 10⁵ |
| Potable water POU | 56 (102) | 4.7 × 10⁵ |
| Reclaimed water POE | 91 (22) | 3.8 × 10⁷ |
| Reclaimed water POU | 87 (96) | 9.6 × 10⁷ |
| Swabs from potable water POU | 52 (60) | 1.9 × 10⁵ |
| Swabs from reclaimed water POU | 92 (51) | 5.6 × 10⁶ |
NOTE: Averages in the final column were determined from positive samples only. POE refers to the point of entry to the distribution system, while POU refers to the point of use from the distribution system.
SOURCE: Garner et al. (2018).
personal communication, July 2018). L. pneumophila was observed in high numbers (106 to 108 CFU/L) in their aeration ponds, which contain nutrient-rich water and operate at 35°C. Genotyping of the L. pneumophila strains demonstrated that the same sequence type (ST 1646) was observed in patients and in the treatment plant aeration ponds (Loenenbach et al., 2018). Box 3-10 describes the investigation of a Norwegian outbreak of Legionnaires’ disease attributed to a wastewater treatment plant.
Occurrence Summary
The vast majority of studies reviewed for this chapter reported presence/absence data but not quantitative concentration data, making it difficult to draw meaningful conclusions about the extent of Legionella risk from built water systems. Nonetheless, the preceding section makes it clear that over the 30 years that Legionella data have been gathered, the percent positives and concentrations found have not changed significantly over time or with building or device type. Thus, whether large-scale surveys examine cooling towers, residences, hotels, or hospitals, between 30 and 80 percent of the samples are positive for Legionella species and 3 to 20 percent are positive for L. pneumophila.
The more limited set of studies for which concentrations were reported demonstrates that higher concentrations of Legionella are associated with higher disease risk. For example, the studies of Legionella outbreaks associated with cooling towers suggest that duration of the outbreak, but not the total number of cases, is related to Legionella concentrations
averaging greater than 106 CFU/L (Walser et al., 2014). One small study in Flint, Michigan, showed positivity levels in hospital taps dropping from 55 percent to 2 percent for L. pneumophila along with concentrations dropping from 106 CFU/L to below detection limits once the outbreak subsided. Similarly, in two Flint hospitals there was a drop from 80 percent to 40 percent positivity for Legionella spp. (with no drop in concentrations) after the outbreak (Rhoads et al., 2017). Non-detectable CFU/L is possible in hospital taps as shown by data obtained from a major hospital’s 11-year monitoring program (see Box 3-8).
A number of the studies cited in this chapter included environmental monitoring that recorded concentrations of culturable Legionella. The Walser et al. (2014) review of cooling tower outbreaks from France, Germany, Italy, New Zealand, The Netherlands, Norway, Spain, and the UK reported Legionella concentrations (for nine outbreaks) ranging from 2.0 × 10³ to 1.0 × 10⁸ CFU/L with an average of 1.39 × 10⁷ CFU/L. Leoni et al. (2018) evaluated nine recreational outbreaks of Pontiac fever and Legionnaires’ disease associated with hot tubs and bathhouses. Their work reported Legionella concentrations ranging from 8.4 × 10⁴ to 1.6 × 10⁶ CFU/L with an average of 8.0 × 10⁵ CFU/L. An outbreak associated with a wastewater treatment plant showed that Legionella concentrations from the aerators ranged from 2.0 × 10⁶ to 2.2 × 10⁹ CFU/L with an average of 1.1 × 10⁹ CFU/L (Loenenbach et al., 2018). Finally, Orkis et al. (2018) reviewed data from sporadic cases of disease from several environments (e.g., apartments, homes, high rises, and associated showers and storage tanks) and reported a range of 1.0 × 10⁴ to 2.0 × 10⁵ CFU/L with an average of 1.0 × 10⁵ CFU/L. These data were contrasted to routine sampling concentrations of Legionella from reclaimed water, residential properties, hotel showers, and industrial cooling towers (Codony et al., 2002; Johnson et al., 2018; Li et al., 2015; Papadakis et al., 2018). The results are graphed in Figure 3-9. The goal of this exercise was to see whether there was an obvious break in the data between sporadic cases and outbreaks, similar to an analysis done for Cryptosporidium (Haas and Rose, 1995). The Committee identified the concentration of 5 × 10⁴ CFU/L as such a break. Hence, a Legionella concentration of 5 × 10⁴ CFU/L should be considered an “action level”—that is, a concentration high enough to warrant serious concern and to move remediation forward immediately. A lower action level may be necessary to protect those at higher risk for legionellosis such as hospital patients, particularly those in intensive care, cancer, and solid-organ transplant units.
QUANTITATIVE MICROBIAL RISK ASSESSMENT FRAMEWORK FOR LEGIONELLA
Quantitative microbial risk assessment (QMRA) is the process whereby the risk associated with exposure to pathogens is assessed (Haas et al., 2014). It evolved from the National Academies of Sciences, Engineering, and Medicine’s framework on risk assessment (see Box 3-11), which focused on chemical and physical environmental hazards. QMRA can also be used to assess the Legionnaires’ disease risk from exposure to waters containing L. pneumophila under various scenarios (e.g., aerosols from toilets, showers, or cooling tower drift).
Risk assessment has multiple applications in understanding and controlling problems from Legionella. For example, given an acceptable level of risk in a particular venue or application (e.g., hospital showers, cooling towers), one can use QMRA to estimate the concentration of L. pneumophila in the breathing zone (or ultimately, in the water being aerosolized) that would result in that risk. This concentration could be used as a standard, criterion, or operational target to which one would compare the results of routine environmental sampling for Legionella to determine whether it is necessary to remediate a building water system and to what extent (i.e., the “how clean is clean” problem). This does not
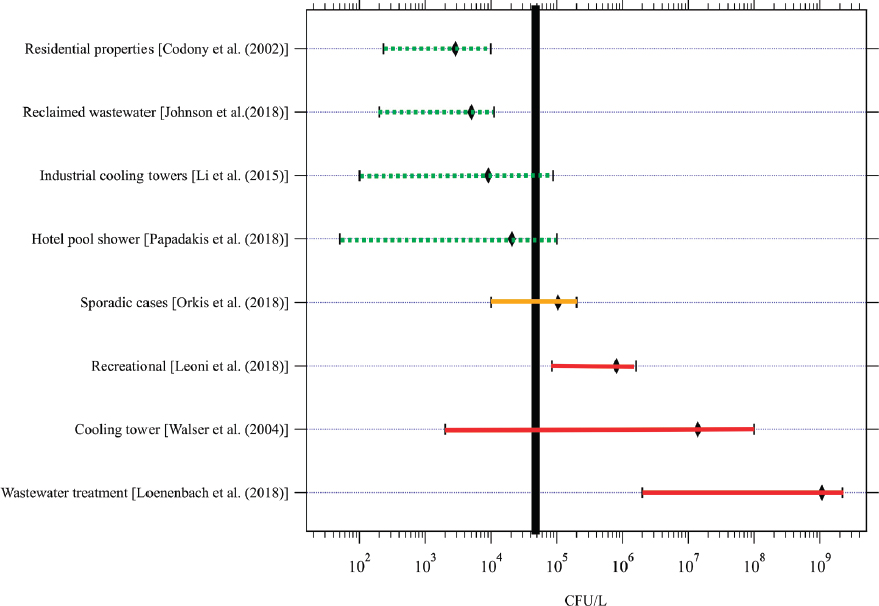
SOURCES: Cooling towers outbreaks (Walser et al., 2014), recreational water outbreaks (Leoni et al., 2018), wastewater treatment plant outbreaks (Loenenbach et al., 2018), sporadic cases from buildings (Orkis et al., 2018), reclaimed wastewater (Johnson et al., 2018), residences (Codony et al. 2002), showers at hotel pools (Papadakis et al., 2018), and industrial cooling towers (Li et al., 2015).
imply conducting QMRA for each situation, but rather developing a generic QMRA for types of buildings or exposures to develop actionable cleanup targets (e.g., cleanup such that the average of ten air samples does not exceed a certain value).
Another application of QMRA is outbreak investigations. In this situation the plausibility of a particular source being the cause of an outbreak can be determined by back-calculating the Legionella concentrations that would have been there if in fact that site was the cause. There are many other applications of QMRA in the design or remodeling stage of a building. QMRA can inform design decisions and determine, for example: (1) the length of a shower hose that should not be exceeded to avoid unacceptable amplification of pathogens; (2) the setback distances from populations for large industrial cooling towers; or (3) the adequacy of building-level hydraulic design to maintain acceptable microbial quality. In all the above cases, even in the absence of precise data for all inputs, risk can be calculated by estimating the uncertainties for each input and propagating them through the calculations.
From a mechanistic standpoint, a Legionella QMRA can be conducted by going through the series of steps shown in Figure 3-10. Given a recovery-corrected concentration of infec-
tious and viable Legionella in water, the aerosol generation rate can be computed. Some enrichment of Legionella in the aerosol may occur, since bacteria selectively accumulate at air-water interfaces (Schäfer et al., 1998). The size distribution of bacterial-laden aerosols is important with respect to transport, survival, and passage to the lungs.
Once aerosols of the appropriate size are inhaled, the inhaled dose can be used to determine the risk from the exposure via application of a dose-response model. There are dose-response models for L. pneumophila that have been derived from animal experiments and validated against outbreaks (Armstrong and Haas, 2007a, 2008). These are consistent with the beta-Poisson and exponential models (Haas, 2015), such that there is no “threshold” dose below which zero risk occurs. In other words, for any dose, no matter how small, there is a finite non-zero risk of infection, since even a single organism can, in some fraction of hosts, multiply to a biologically significant level in vivo.
Because the QMRA approach relies on dose-response models from only a few selected strains for which animal testing has been performed, one uncertainty is the incorporation of any strain variability, or variability associated with prior history of bacterial exposure, such as the acquisition or expression of virulence factors (Buse et al., 2015). Also, the current dose-response models are only for L. pneumophila serogroup 1; the relative potency of
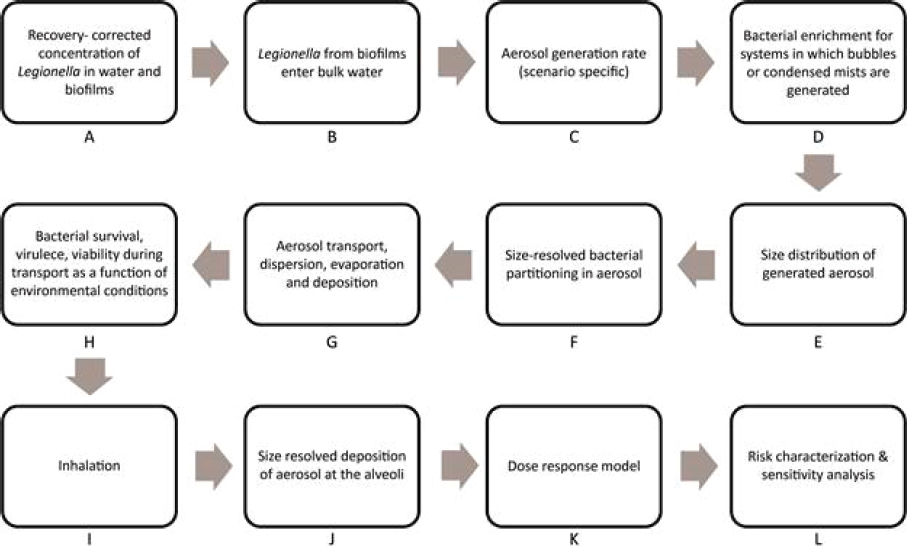
SOURCE: Revised from Hamilton and Haas (2016). Reproduced with permission of R S C Publications in the format Book via Copyright Clearance Center.
other serogroups is unknown. The dose-response models do not account for any differences in host characteristics, such as age, gender, or immune status.
If actual data are available for microorganisms at one of the intermediate points in the flow chart, it is possible to start the QMRA at that point. For example, size-resolved microbial concentrations in aerosols might exist, which could be used as a starting point (Step F). There have been more than 18 exposure assessments and more than ten full risk assessments conducted on L. pneumophila (Hamilton and Haas, 2016).
In some cases, concentrations may only be reported as presence/absence. In this situation, concentrations can be estimated using an MPN approach. This is discussed and illustrated in Box 3-12, which indicates that non-detects can be informative if the volume examined is known. Non-detects, as well as samples that are “too numerous to count” (TNTC), can also be informative for exposure assessment as long as the volumes examined and the cut-offs for TNTC are known (Haas and Heller, 1988).
Environmental measurements of Legionella are frequently made using molecular methods, with qPCR being the most prevalent technique. However, direct sequencing approaches (Timms et al., 2017) may become more common. (A discussion of these and putative viability assays is found earlier in this chapter.) Exposure estimates are necessary to produce good risk estimates, and the number of samples collected in a monitoring program and their detection limits should be sufficient to determine exceedance or compliance with an acceptable risk value. The number of samples can be determined using standard quality control statistics.
As was made obvious earlier in this chapter, the chosen Legionella sampling method may influence the measurements of occurrence and concentration. For example, a recent
study comparing the concentrations of Legionella spp. in wastewater treated for non-potable reuse found dramatic differences between the results from culture, qPCR, and EMA-qPCR methods (Johnson et al., 2018), as shown in Figure 3-11. Culture-based methods generally reported the lowest occurrence and concentrations.
Regardless of the sampling method used for exposure assessment, quantification of any microorganism carries with it many sources of variability. Some variability may be inherent in the time-to-time and place-to-place differences in actual microbial levels, which is irreducible by more sampling. This variability was exemplified by a detailed investigation of hot- and cold-water outlets in nine residential homes and hotels in Cologne, Germany (Völker et al., 2016). The 807 samples taken showed significant variability (up to 4 logs) in Legionella spp. concentrations in flushed samples between sampling points within a single building and, for a given point, between hours in a day or between weeks. Other variability may be due to the experimental techniques themselves, including sample collection, concentration, decontamination, processing, and detection. Only a true end-to-end comparison can assess the extent of this intrinsic variability. Such a study requires that a sample be spiked with a known number of organisms and then processed through the entire protocol (i.e., concentration, decontamination, detection) to assess the recovery and its variability. An example of such a study is Bonilla et al. (2015). Sufficient numbers of samples should be taken to make the effect of this intrinsic variability small with respect to the irreducible variability.
For L. pneumophila, there are no good published studies to assess the intrinsic variability of different sampling methods, including culture techniques, molecular techniques, or various proprietary test kits. However, one known factor (albeit with coliforms) is that the variability associated with methods that result in actual concentrations tends to be less than the variability associated with MPN-type techniques, although this does depend on how many actual counts are enumerated, and the protocol (number of dilutions and/or replicates), particularly for the modern MPN tests. As an example, early work by Thomas and Woodward (1955) showed that the MPN enumeration of coliform tended to have about 2.5 times the coefficient of variation for replicates than the membrane filter colony count methods.
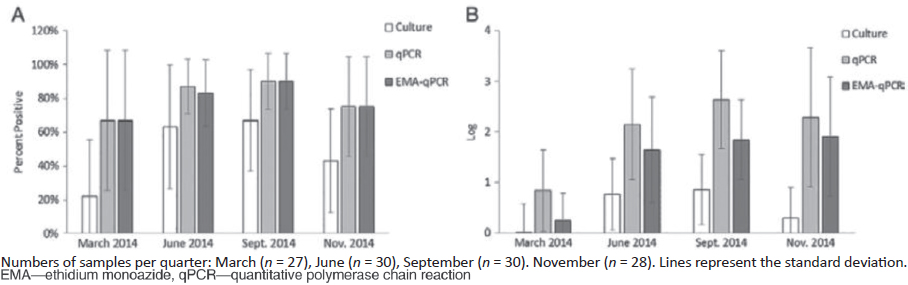
SOURCE: Johnson et al. (2018).
QMRA Case Studies for Legionella
As an example of a forward QMRA, the risks associated with Legionella exposure in aerosols generated from toilet flushing using reclaimed wastewater were examined by Hamilton et al. (2018c). The key inputs required were:12
- The concentration of L. pneumophila; in this analysis, the monitoring results from several water reuse facilities were used (Johnson et al., 2018) in which Legionella spp. were measured using culture techniques, qPCR, and EMA-qPCR, the latter of which is thought to be more closely related to viability (Mansi et al., 2014).
- Measurements of aerosol concentrations in a respirable size range in the vicinity of the toilet after flushing; the size-resolved concentrations from Johnson et al. (2013) were used and aerosols in the range of 1 to 10 µm were considered respirable.
- Respiration rate for light activity of 0.013 to 0.017 m3/min from the Exposure Factors Handbook (EPA, 2011) was used.
- Number of flushes per day; a value of 5/d was used (DeOreo et al., 2016).
- Time of exposure to aerosol per occurrence; a range of 1 to 5 minutes exposure per flush was used based on Lim et al. (2015).
- Dose-response relationship for L. pneumophila developed by Armstrong and Haas (2007a) from the underlying data of Muller et al. (1983) and Fitzgeorge et al. (1983) were used.
In particular, the first bullet (concentration) has uncertainty because of the issues associated with environmental measurements of viable infectious L. pneumophila discussed above. The final bullet (dose-response) has uncertainty because of the use of animal models on a particular strain of Legionella, although this has been shown to be consistent with human outbreaks (Armstrong and Haas, 2007b).
Several factors not considered could be of importance. These include the difference between Legionella spp. and L. pneumophila, the possibility of accumulation of microorganisms at air–water interfaces and thus selective enrichment in the aerosols (Blanchard, 1989), and any inactivation of microorganisms in the period between aerosol formation and inhalation. Based on this analysis, using the three different means of enumerating bacteria in the water (i.e., culture techniques, qPCR, and EMA-qPCR), the annual risks (median) were estimated to be:
- 3.2 × 10⁻⁹ (using culture)
- 1.02 × 10⁻⁷ (using qPCR)
- 2.56 × 10⁻⁸ (using EMA-qPCR)
When compared to a common benchmark of 1/10,000 annual risk, these estimates were substantially lower.
It is also possible to perform a reverse QMRA (Soller et al., 2010), in which the starting point is the desired risk of a scenario (Step L in Figure 3-10); then, the calculations are run “backwards” to ascertain the water quality (Step A in Figure 3-10), aerosol concentration, etc. corresponding to that desired risk. An example of a reverse QMRA is the work of Schoen and Ashbolt (2011), of which a portion is summarized here. They considered the risk of Legionella exposure during a single showering event. Starting from a maximum
___________________
12 This is designated as “Model 2” in the paper. Three different models, yielding a span of results, were compared.
inhaled L. pneumophila dose of 1–100 CFU,13 they considered what the water concentration in the shower might be to attain that level. Key inputs required for their reverse QMRA were:
- Aerosol production rate and microbial partition coefficient (from bulk water to aerosol); values used were based on the experiments of Perkins et al. (2009).
- A respiration rate of 0.012−0.025 m3/min was used (EPA, 2004).
- Size-specific aerosol deposition fractions in the lungs from Schlesinger (1989) were used.
- Duration of exposure in the shower was assumed to be 15 minutes (Perkins et al., 2009).
With this analysis, they computed that a bulk air concentration of 35 to 3,500 CFU/m3, and a bulk water concentration of 3.5 × 10⁶ to 3.5 × 10⁸ CFU/L would be required to attain the delivered dose.
In all cases, the performance of a QMRA (either in the forward or reverse direction), requires a substantial number of input parameters, each of which may have uncertainty. The resultant risk estimate (or in the case of a reverse QMRA, the exposure estimate) will also not be known with certainty. The calculation of these uncertainties is possible using a variety of techniques, with Monte Carlo methods being the most common.
Acceptable Risk
A key question for any QMRA is what level of risk should be regarded as acceptable. This is not (solely) a scientific question, but must be informed by policy, economic, and other social factors. In developing U.S. drinking water regulations for virus and protozoa, EPA was informed by an annual risk level of 10−4 infections/year (Regli et al., 1991). For regulation of carcinogens, a range of 10−4 to 10−6 cases/lifetime has been used as a range of acceptability (Travis and Hattmer-Frey, 1988). The World Health Organization (WHO) has widely promoted the use of 10−6 disability-adjusted life years (DALY)/person-year as being an acceptable risk for illnesses from drinking water microbes (Havelaar and Melse, 2003; WHO, 2008).
The broad community of stakeholders in the Legionella arena need to be engaged in a deliberative process to develop acceptability levels in different venues (Renn, 1999). It may be that different venues with different types of exposure and different exposed populations should have different acceptability levels—for example, hospitals with acute susceptible populations and relatively short stays, versus cooling towers with broad, potentially frequent exposure to the general population.
The level of risk that may be regarded as acceptable is associated with the type of hazard (how well it is understood, natural versus human-derived), the consequences (e.g., death), and the ability to control the exposure. For drinking waterborne pathogens, The Netherlands has codified an annual risk of 10−4 (1 infection in 10,000 over a one-year time frame). In the United States, for drinking water standards primarily aimed at controlling mild to moderate gastroenteritis, a value of 10−4 infections per year is also considered acceptable. However, it is important to examine the daily risk versus an annual risk, as both are incurred every day in the context of drinking water. Annual risk is translated to a daily risk via the relationship below (Haas, 1996):
___________________
13 This would produce a risk unacceptably high in the general population, but was used as an extreme example.
Pannual = 1 − (1 − Pdaily)365
If daily risk varies day to day, then the annual risk can be computed as follows:
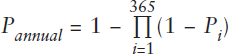
For an exposure that is relatively continuous to a large population, an annual risk level may be an appropriate approach to control. This could be pertinent to exposures such as large industrial cooling towers. For exposures that may only be short-term, especially to susceptible subpopulations, the control of daily risk could be appropriate. This could be pertinent to situations such as hospitals and nursing homes.
Use of a daily risk level could lead to a different monitoring and control scheme. This is illustrated by the hypothetical Figure 3-12 below. The solid line indicates the uniform daily risk that would correspond to 1/10,000 infections per year. The black plot illustrates a random set of daily risks that over the course of the year would result in the same annual risks, despite a high degree of day-to-day variability. For shorter-term exposures, therefore, a population would be exposed to higher risks from time to time rather than to a uniform risk. In the case of Legionella, there is a lack of data to know how variable day-to-day exposures, and hence the resultant risks, might be.
In addition to the choice of annual or daily (or some other time period) averaging for assessing acceptability of risk in particular venues, the choice of the endpoint metric needs to be addressed. Both the 10−4 annual risk of infection and the 10−6 DALY per person per year that have been put forth as useful endpoint metrics in the context of drinking water were developed with regard to the risks of gastroenteric pathogens such as enteric bacteria, viruses, and protozoans (e.g., Giardia and Cryptosporidium). Such organisms have mild to moderate health consequences, such that the 10−4 annual risk of infection and 10−6 DALY endpoints produce similar results with respect to acceptable microbial quality of water (i.e., the concentration of Cryptosporidium in water). However, the severity of legionellosis leads to a much higher ratio of DALYs per infection as noted in Table 3-9. Compared to cryptosporidiosis, legionellosis is more than 300-fold more consequential. Hence, endpoints of 10−4 annual risk of infection and 10−6 DALY are not equivalent in this case.
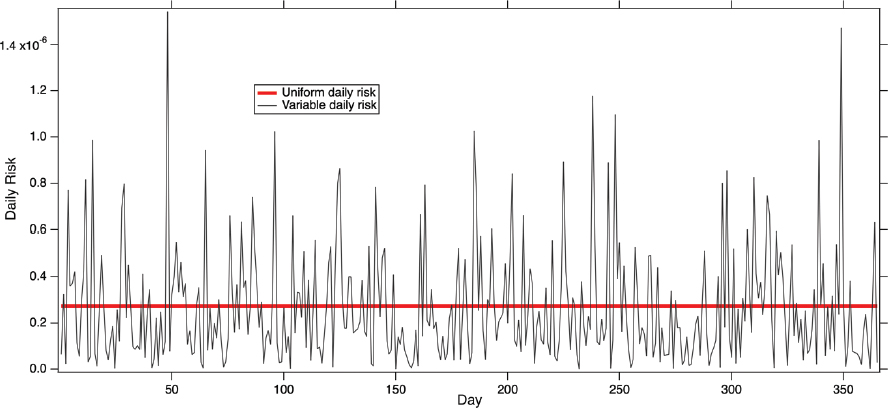
TABLE 3-9 Ratio of DALYs to Infections for Various Pathogens Conveyed via Water
| Illness | DALYs/100 infections |
|---|---|
| Cryptosporidiosis | 0.3 |
| Norovirus | 0.3 |
| Salmonellosis | 0.3 |
| Hepatitis | 17 |
| Legionellosis | 97 |
SOURCE: Abstracted from van Lier et al. (2016).
This is illustrated in Figure 3-13, in which the water concentrations corresponding to acceptable risk based on per exposure or annually (using either infections or DALYs as the endpoint) are graphed for different types of exposures. In this case, faucet, shower, and toilet exposures using both conventional and water-efficient fixtures are tabulated. Once a risk manager has decided what endpoint metric and acceptability level and what averaging period (if any) are appropriate, then the corresponding water concentration can be determined. For example, if an acceptable annual risk of 10−4 has been chosen, then the concentration of L. pneumophila measured at a conventional faucet, toilet, or showerhead should be no more than 105, 8.6 × 10⁵, and 1.4 × 10³ CFU/L, respectively (see Table 3-10). On the other hand, if acceptable risk is based on the 10−6 DALY, then the concentration of L. pneumophila measured at a conventional faucet, toilet, or showerhead should be no more than 103, 8.8 × 10³, and 14 CFU/L, respectively. (These numbers are revisited in Chapter 5 as thresholds to help interpret monitoring data.)
Risk management decisions need to be developed for target levels of acceptability to Legionella in various settings. While U.S. practice has been to use a 1/10,000 annual infection endpoint as a measure of acceptability in drinking water (Rose et al., 1991), WHO has promoted use of a 10−6 DALY annual risk as an endpoint because of the increased severity of Legionnaires’ disease. Which risk target is more appropriate, and whether an annual or a daily (or some other time period) average is more appropriate, are specific questions that need to be addressed by risk managers.
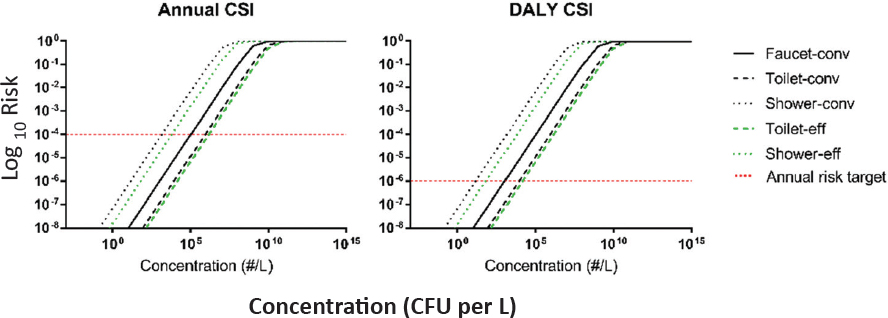
SOURCE: Hamilton et al. (2019). https://pubs.acs.org/doi/10.1021/acs.est.8b03000>; further permissions related to the material excerpted should be directed to the American Chemical Society.
TABLE 3-10 L. pneumophila Concentrations in Various Plumbing Fixtures that Correspond to Target Risk Levels
| Devices/Fixtures | Critical Average Concentration (CFU/L) |
|---|---|
| Target Risk Value: 10−4 infections per person per year | |
| Conventional faucet | 104,000 |
| Conventional toilet | 857,000 |
| Conventional shower | 1,410 |
| Target Risk Value: 10−6 DALY per person per year | |
| Conventional faucet | 1,060 |
| Conventional toilet | 8,830 |
| Conventional shower | 14.4 |
Note: Median estimates from a Monte Carlo simulation.
SOURCE: Hamilton et al. (2019).
The examples above focused on exposure to aerosols in the indoor environment from plumbing fixtures. It is also possible to conduct a QMRA for exposure to cooling towers and other aerosols in the outdoor environment (see Hamilton et al., 2018c), but these circumstances require much more site-specific information. This includes (1) characteristics of the cooling tower, including aerosol generation rate and height, (2) the concentration of L. pneumophila within the water producing the aerosol, and (3) wind direction (relative to exposed population), velocity, and meteorological conditions (atmospheric stability).
How to Respond to Data and Information Generated from Sampling
The role of liability in the control and prevention of Legionnaires’ disease has been mixed in the United States. Multi-million-dollar lawsuits are not uncommon for Legionnaires’ disease when the environmental source is tracked to a large building or other entity where the owner and/or other persons are responsible for the safety of those served by an implicated water system. Manslaughter charges have been filed on rare occasions. To protect their clients, some lawyers have advocated that the water facilities considered at-risk (e.g., hotels, hospitals) test their water for Legionella as part of a water management plan, while others have advocated that it is better not to test since results could potentially be used against their client. This latter argument will probably not become entrenched as testing becomes more common, and “not knowing” may hurt rather than help the defense. The growing number of litigants and large size of settlements may result in the insurance industry pushing many clients with water systems serving the public into improving their prevention program for legionellosis.
A challenge inherent in implementation of Legionella control programs by healthcare centers, assisted-living facilities, hotels, and other commercial buildings, as well as public water supplies, is balancing professional or commercial responsibility with notification of the public when disease cases or water system contaminations occur. No guidelines currently exist, for hospitals or other building management or municipalities, on how to release information when Legionella and Legionnaires’ disease are detected. Such guidelines are critically important, given the need to provide accurate, actionable information to the public, while protecting patient confidentiality, and taking resource limitations for the entities involved in releasing information into account. CSTE’s Legionnaires Disease
Surveillance Working Group plans to focus on risk communication, including notification and disclosure, with regard to Legionnaires’ disease outbreak investigations and will be coordinating with other relevant national organizations, including the CDC, in the coming months (Monica Schroeder, CSTE, personal communication, April 26, 2019). A policy framework for risk communication should be developed by a coalition of stakeholders, with representatives from infectious disease, epidemiology, microbiology, and public health; healthcare and assisted-living management; hotel and resort management; cooling tower and municipal water management; insurance; liability and privacy law; and ethics. The work of this coalition could be informed by the European Legionnaires’ Disease Surveillance Network (ELDSNet); the Public Services and Procurement Canada’s Legionella Management Communications and Actions Protocol; the federal Sunshine Act to increase transparency in government; and the CDC Foodborne Diseases Active Surveillance Network (FoodNet), a national food safety policy and prevention effort that monitors trends, attributes illness to source, and disseminates information about current foodborne illnesses to the public.
CONCLUSIONS AND RECOMMENDATIONS
This chapter has demonstrated that Legionnaire’s disease rates have been rising in the United States and Europe for the past 20 years, and current reported incidence is likely a substantial underestimate of the actual disease burden. The Committee estimates 52,000 to 70,000 cases of Legionnaires’ disease in the United States each year. There are many sources of Legionella risk in engineered water systems, from cooling towers to premise plumbing to hot tubs. Most of the occurrence data gathered from these sources has not been reported as concentrations, making it difficult to discern trends over time and conduct microbial risk assessment. In only a few outbreak investigations have clinical and environmental data been linked to definitively show that a particular water system was the etiological source of disease cluster. The following conclusions and recommendations are made to improve surveillance and diagnosis of legionellosis, monitoring of water systems for Legionella, and identification of sources of exposure for both sporadic and outbreak-associated Legionnaires’ disease.
There is an urgent need to develop better clinical tools that will capture more Legionnaires’ disease cases and identify pathogenic Legionella beyond L. pneumophila serogroup 1. The increasing rates of legionellosis, combined with its associated morbidity and mortality, demand improved diagnostics. First, hospitals in both rural and urban areas should have access to on-site urinary antigen testing to facilitate more targeted antimicrobial therapy and to increase disease recognition. Second, efforts to develop standardized molecular methods for Legionella diagnoses (including non-pneumophila species and pneumophila serogroups other than serogroup 1) should be prioritized by research laboratories and federal agencies. Such methods could increase understanding of the extent of the underestimate of reported disease rates and should be accessible outside of research and academic institutions. Finally, the U.S. Department of Health and Human Services should fund multi-center prospective studies of clinical respiratory samples using these new assays to better understand prevalence and diversity of the Legionella species and serogroups causing clinical disease. Once the “true” diversity of human-infectious legionellae is identified, a range of environmental niches could then be explored to identify isolates representing genotypes by niche and preferred methods for their identification from environmental samples. There is also a need for education and a cultural shift from empiric treatment to use of available and future diagnostic tools for Legionella to better characterize the true incidence of legionellosis in the community.
The CDC should strengthen the (soon-to-be-merged) National Notifiable Disease Surveillance System and the Supplemental Legionnaires’ Disease Surveillance System to include environmental exposures as feasible, including both the potential exposure setting and the type of related building water systems. Although all cases will not receive thorough environmental investigations, at a minimum it should be discerned whether a case may be associated with a healthcare facility, accommodation site, hot tub or other well-recognized potential source, as well as some information about the building water system and any known deficiencies (e.g., water main breaks) during the incubation period. Similarly, within NORS, the CDC should consider housing Legionella outbreak data in a separate database from enteric pathogens to make NORS more useful for legionellosis prevention and control. In addition, timely analyses by setting and type of water system, with more frequent updating of publicly available data, would improve the usefulness of NORS for assessment of Legionella prevention efforts.
An improved understanding of sporadic, community-acquired cases of Legionnaires’ disease is critical to reducing the rising rates observed over the past 20 years. Determining the most common sources of sporadic disease will require well-funded, population-based studies in multiple jurisdictions (e.g., cities, counties, states). Such studies would require the recruitment of multiple medical centers with an adequate number of Legionella cases each year, willingness and capacity to collect clinical samples for Legionella culture, environmental personnel with knowledge of how to sample the most likely sources of exposure for legionellosis patients, and laboratory capacity to reliably grow Legionella from clinical and environmental samples. In the United States, clinical cultures are currently available for less than 10 percent of cases; thus, an effective study would have to dramatically improve on the current capacity to obtain cultures from patients. Enhanced clinical culture capacity is also essential to accurately assess the contribution to disease from non-pneumophila Legionella, and L. pneumophila that is not serogroup 1 (recommended above).
The CDC should work with states to gain closer to real-time reporting and investigation of travel-associated cases. Many outbreaks of travel-associated disease can be best detected at the national level, since many of the patients who report staying in a hotel or other accommodation during the incubation period have crossed state lines. Currently, reporting of travel-associated cases from many states is neither timely nor complete. Better understanding travel-associated cases is an easy target for intervention, as these data are often readily available from patient interviews, can help to link individual cases to larger clusters, and may help to identify opportunities to limit further exposures.
Although additional Legionella program efforts are under way in some states, these efforts are not comprehensive, and most state health departments are severely lacking (both in resources and expertise) in their programs of surveillance, prevention, and control for Legionnaires’ disease. Regional Centers of Excellence for prevention and control of legionellosis could serve as a backbone to strengthen the capacity of state health departments to detect and investigate cases of Legionnaires’ disease. These centers could be modeled on the Integrated Food Safety Centers of Excellence and the Centers of Excellence for Vector Borne Diseases, with modifications to include the relevant disciplines needed for Legionella applied research and control. The Centers could undertake critical applied research (e.g., optimizing culture methods and comparing them to new methods and coordinating the in-depth, multiple-jurisdiction studies of environmental exposures recommended above). By building a cadre of experts in Legionella prevention and control that includes industrial hygienists and
engineers, these centers could promulgate best practices for prevention and control measures (see Chapter 4). Finally, these Centers could train and assist building managers as they create water management plans, and they could initiate certification programs for those responsible for the safety of water systems in built environments (see Chapter 5).
A systematic study to compare culture methods for L. pneumophila (and other pathogenic legionellae) with qPCR, viability-qPCR, and RT-qPCR is needed to determine comparability. qPCR and its variants offer a more rapid method to quantify Legionella in the environment and could be used consistently to inform decisions on decontamination and restoration of affected systems, to investigate the bacteria’s ecology and exposure pathways, and as a quality control method. Yet, there are few comparisons of methods, and a better sense of real-world performance under “normal” and “bloom” conditions is needed. There are reasons why culture techniques may underestimate the true Legionella risk (e.g., VBNC cells) whereas qPCR might overestimate risk (due to response to nucleic acid in nonviable organisms). Whether use of viability qPCR or RT-qPCR could balance these issues in unknown. With side-by-side comparisons of methods in a broad range of settings, it may be that PCR-based or other simplified methods or test kits could be shown to be useful predictors of human health risk and adequacy of remediation.
By reviewing dozens of Legionella studies on various building types from around the world, the Committee found the Legionella occurrence data to be highly variable and sparse, making comparisons among studies difficult and detection of spatial and temporal trends almost impossible. The available data suggest that cooling towers, hot tubs, showers, and wastewater treatment plants can be hot spots for growth of Legionella and exposures. This data set could be improved by adopting standardized molecular methods that allow for greater quantitation and more rapid results. Improved environmental monitoring methods could facilitate a temporal and spatial assessment of changes in Legionella levels within buildings in several special studies to better understand background levels, potential exposure, and ultimately risk. Finally, a collaborative, widespread national survey of Legionella that included distribution systems, premise plumbing in various types of buildings, and cooling towers would be useful for further understanding the concentrations of concern and the risks of sporadic Legionnaires’ disease.
The Committee’s analysis of studies on Legionella occurrence that collected concentration data suggests that a Legionella concentration of 5 × 10⁴ CFU/L should be considered an “action level,” that is, a concentration high enough to warrant serious concern and trigger remediation. This concentration could be used for many purposes, including to set an acceptable risk level for Legionnaires’ disease and for regulations and guidelines on Legionella management in building water systems (see Chapter 5).
There is a good framework to perform quantitative microbial risk assessment for various L. pneumophila exposures. To strengthen these tools, additional knowledge is needed about the impact of virulence and strain differences, phenotypic alterations in potency and aerosol survival, and generation rate of aerosols from various devices. Data on exposures, especially for cooling towers, are lacking. Also, validation of models for predictive growth of L. pneumophila in water systems is required. QMRA has many applications from setting action levels for the occurrence of L. pneumophila in different venues or targets for remediation to informing design and permitting decisions about pipe length, setback distances for large industrial cooling towers, and building-level hydraulic design to maintain acceptable
microbial quality. QMRA can be used to determine Legionella concentrations in building water systems that correspond to certain Legionnaires’ disease risk levels.
REFERENCES
Adams, D. A., K. Fullerton, R. A. Jajosky, P. Sharp, D. H. Onweh, A. W. Schley, W. J. Anderson, A. Faulkner, K.Kugeler, and the Nationally Notifiable Infectious Conditions Group. 2015. Summary of notifiable infectious diseases and conditions—United States, 2013. Morbidity and Mortality Weekly Report 62(53):1-119.
Adams, D. A., K. R. Thomas, R. A. Jajosky, L. Foster, P. Sharp, D. H. Onweh, A. W. Schley, W. J. Anderson, and the Nationally Notifiable Infectious Conditions Group. 2016. Summary of notifiable infectious diseases and conditions—United States, 2014. Morbidity and Mortality Weekly Report 63(54):1-152.
Adams, D. A., K. R. Thomas, R. A. Jajosky, L. Foster, G. Baroi, P. Sharp, D. H. Onweh, A. W. Schley, and W. J. Anderson. 2017. Summary of notifiable infectious diseases and conditions—United States, 2015. Morbidity and Mortality Weekly Report 64(53):1-143.
AIHA (American Industrial Hygiene Association). 2015. Recognition, evaluation and control of Legionella in building water systems. Falls Church, VA: AIHA.
Alary, M., and J. R. Joly. 1991. Risk factors for contamination of domestic hot water systems by Legionella. Applied and Environmental Microbiology 57:2360-2367.
Amaro, F., and H. Shuman. 2019. Selection of Legionella virulence-related traits by environmental protozoa. Methods in Molecular Biology 1921:55-78.
American Public Health Association/American Water Works Association/Water Environment Federation (APHA/AWWA/WEF). 2007. Detection of pathogenic bacteria: Legionella. In: Standard Methods for the Examination of Water and Wastewater, 21st edition. Washington, DC: American Public Health Association/American Water Works Association/Water Environment Federation.
Armstrong, T. W., and C. N. Haas. 2007a. A quantitative microbial risk assessment model for Legionnaires’ disease: Animal model selection and dose–response modeling. Risk Analysis 27(6):1581-1596.
Armstrong, T. W., and C. N. Haas. 2007b. Quantitative microbial risk assessment model for Legionnaires’ disease: Assessment of human exposures for selected spa outbreaks. Journal of Occupational Environmental Hygiene 4:634-46.
Armstrong, T. W., and C. N. Haas. 2008. Legionnaires’ disease: Evaluation of a quantitative microbial risk assessment model. Journal of Water and Health 6:149-66.
ASHRAE (American Society of Heating, Refrigeration and Air-Conditioning Engineers). 2000. Minimizing the risk of legionellosis associated with building water systems. Atlanta, GA: ASHRAE.
ASHRAE. 2015. Standard 188 legionellosis: Risk management for building water systems. Atlanta, GA: ASHRAE.
Bartlett, J. G. 2011. Diagnostic tests for agents of community-acquired pneumonia. Clinical Infectious Diseases 52(S4):S296-S304.
Bartley, P. B., N. L. Ben Zakour, M. Stanton-Cook, R. Muguli, L. Prado, V. Garnys, K. Taylor, T. C. Barnett, G. Pinna, J. Robson, D. L. Paterson, M. J. Walker, M. A. Schembri, and S. A. Beatson. 2016. Hospital-wide eradication of a nosocomial Legionella pneumophila serogroup 1 outbreak. Clinical Infectious Diseases 62(3):273-279.
Beauté, J. 2017. Network on behalf of the ELDS. Legionnaires’ disease in Europe, 2011 to 2015. Eurosurveillance 22(27):30566. doi:10.2807/1560-7917.ES.2017.22.27.30566.
Benedict, K. M., H. Reses, Vigar M., D. M. Roth., V. A. Roberts, M. Mattioli, L. A. Cooley, E. S. Hilborn, T. J. Wade, K. E. Fullerton, J. S. Yoder, and V. R. Hill. 2017. Surveillance for waterborne disease outbreaks associated with drinking water—United States, 2013–2014. Morbidity and Mortality Weekly Report 66:1216-1221.
Benin, A. L., R. F. Benson, K. E. Arnold, A. E. Fiore, P. G. Cook, L. K. Williams, B. Fields, and R. E. Besser. 2002. An outbreak of travel-associated Legionnaires’ disease and Pontiac fever: The need for enhanced surveillance of travel-associated legionellosis in the United States. Journal of Infectious Diseases 185(2):237-243.
Benitez, A. J., and J. M. Winchell. 2013. Clinical application of a multiplex real-time PCR assay for simultaneous detection of Legionella species, Legionella pneumophila, and Legionella pneumophila serogroup 1. Journal of Clinical Microbiology 51(1):348-351.
Benowitz, I., R. Fitzhenry, C. Boyd, M. Dickinson, M. Levy, Y. Lin, E. Nazarian, B. Ostrowsky, T. Passaretti, J. Rakeman, A. Saylors, E. Shamoonian, T. Smith, and S. Balter. 2018. Rapid identification of a cooling tower-associated Legionnaires’ disease outbreak supported by polymerase chain reaction testing of environmental samples, New York City, 2014–2015. Journal of Environmental Health 80(8):8-12.
Blanchard, D. C. 1989. The ejection of drops from the sea and their enrichment with bacteria and other materials: A review. Estuaries 12(3):127.
Blatny, J. M., B. A. P. Reif, G. Skogan, Ø. Andreassen, E. A. Høiby, E. Ask, V. Waagen, D. Aanonsen, I. S. Aaberge, and D. A. Caugant. 2008. Tracking airborne Legionella spp. and Legionella pneumophila at a biological treatment plant. Environmental Science and Technology 42:7360-7367.
Bonilla, J., T. Bonilla, A. Abdelzaher, T. Scott, J. Lukasik, H. Solo-Gabriele, and C. Palmer. 2015. Quantification of protozoa and viruses from small water volumes. International Journal of Environmental Research and Public Health 12(7):7118-7132.
Bonilla Escobar, B. A., J. C. Montero Rubio, and G. Martínez Juárez. 2014. Legionella pneumophila pneumonia associated with the use of a home humidifier in an immunocompetent girl. Medicina Clinica 142(2):70-72.
Boost, M., P. Cho, S. Lai, and W.-M. Sun. 2008. Detection of Acanthamoeba in tap water and contact lens cases using polymerase chain reaction. Optometry and Vision Science 85(7):526-530.
Borgen, K., I. Aaberge, O. Werner-Johansen, K. Gjøsund, B. Størsrud, S. Haugsten, K. Nygård, T. Krogh, E. A. Høiby, D. A. Caugant, A. Kanestrøm, Ø. Simonsen, and H. Blystad. 2008. A cluster of Legionnaires’ disease linked to an industrial plant in southeast Norway, June–July 2008. Eurosurveillance 13(38):pii=18985. https://doi.org/10.2807/ese.13.38.18985-en.
Borges, A., M. Simões, A. Martínez-Murcia, and M. Saavedra. 2012. Detection of Legionella spp. in natural and man-made water systems using standard guidelines. Journal of Microbiology Research 2(4):95-102.
Borthong, J., R. Omori, C. Sugimoto, O. Suthienkul, R. Nakao, and K. Ito. 2018. Comparison of database search methods for the detection of Legionella pneumophila in water samples using metagenomic analysis. Frontiers in Microbiology 9 https://doi.org/10.3389/fmicb.2018.01272.
Boss, R., A. Baumgartner, S. Kroos, M. Blattner, R. Fretz and D. Moor. 2018. Rapid detection of viable Legionella pneumophila in tap water by a qPCR and RT-PCR-based method. Journal of Applied Microbiology 125:1216-1225.
Buse, H. Y., and N. J. Ashbolt. 2011. Differential growth of Legionella pneumophila strains within a range of amoebae at various temperatures associated with in-premise plumbing. Letters in Applied Microbiology 53(2):217-224.
Buse, H. Y., J. Lu, and N. J. Ashbolt. 2015. Exposure to synthetic gray water inhibits amoeba encystation and alters expression of Legionella pneumophila virulence genes. Applied and Environmental Microbiology 81:630-639.
Byrne, B. G., S. McColm, S. P. McElmurry, P. E. Kilgore, J. Sobeck, R. Sadler, N. G. Love, and M. S. Swanson. 2018. Prevalence of infection competent serogroup 6 Legionella pneumophila within premise plumbing in Southeast Michigan. mBio 9:e00016–18. https://doi.org/10.1128/mBio.00016-18.
Cangelosi, G. A., and J. S. Meschke. 2014. Dead or alive: molecular assessment of microbial viability. Applied and Environmental Microbiology 80:5884-5891.
Cassell, K., P. Gacek, T. Rabatsky-Her, S. Petit, M. Cartter, and D. M Weinberger. 2019. Estimating the true burden of Legionnaires’ disease. American Journal of Epidemiology 188(9):1686-1694.
Castor, M. L., M. L. Castor, E. A. Wagstrom, R. N. Danila, K. E. Smith, T. S. Naimi, J. M. Besser, K. A. Peacock, B. A. Juni, J. M. Hunt, J. M. Bartkus, S. R. Kirkhorn, and R. Lynfield. 2005. An outbreak of Pontiac fever with respiratory distress among workers performing high-pressure cleaning at a sugar-beet processing plant. Journal of Infectious Diseases 191(9):1530-1537.
CDC (U.S. Centers for Disease Control and Prevention). 2005. Procedures for the recovery of Legionella from the environment. Atlanta, GA: CDC.
CDC. 2010. Case definition of Legionnaires’ disease and Pontiac fever. https://www.cdc.gov/legionella/health-depts/surv-reporting/case-definitions.html.
CDC. 2015. CDC’s sampling procedure and potential sampling sites: A protocol for collecting environmental samples for Legionella culture during a cluster or outbreak investigation or when cases of disease may be associated with a facility. https://www.cdc.gov/legionella/downloads/cdc-sampling-procedure.pdf.
CDC. 2017. Developing a water management program to reduce Legionella growth and spread in buildings: a practical guide to implementing industry standards. Version 1.1.
Chamberlain, A. T., J. D. Lehnert, and R. L. Berkelman. 2017. The 2015 NYC Legionnaires’ disease outbreak: A case study on a history-making outbreak. Journal of Public Health Management and Practice 23(4):410-416.
Chang, B., T. Taguri, K. Sugiyama, J. Amemura-Maekawa, F. Kura, and H. Watanabe. 2010. Comparison of ethidium monoazide and propidium monoazide for the selective detection of viable Legionella cells. Japanese Journal of Infectious Diseases 63:119-123.
Che, D., B. Decludt, C. Campese, and J. Desenclos. 2003. Sporadic cases of community acquired Legionnaires’ disease: An ecological study to identify new sources of contamination. Journal of Epidemiology and Community Health 57(6):466-469.
Chen, Y. S., W. R. Lin, Y. C. Liu, C.-L. Chang, V.-L. Gan, W.-K. Huang, T.-S. Huang, S.-R. Wann, H.-H. Lin, S. Lee, C.-K. Huang, C. Chin, Y.-S. Lin, and M.-Y. Yen. 2002. Residential water supply as a likely cause of community-acquired Legionnaires’ disease in an immunocompromised host. European Journal of Clinical Microbiology and Infectious Diseases 21(10):706-709.
Chen, N. T., and C. W. Chang. 2010. Rapid quantification of viable legionellae in water and biofilm using ethidium monoazide coupled with real-time quantitative PCR. Journal of Applied Microbiology 109:623-634.
Cochran, W. G. 1950. Estimation of bacterial densities by means of the most probable number. Biometrics 6:105-116.
Codony, F., J. Álvarez, J. M. Oliva, B. Ciurana, M. Company, N. Camps, J. Torres, S. Minguell, N. Jové, E. Cirera, T. Admetlla, R. Abós, A. Escofet, A. Pedrol, and R. Grau. 2002. Factors promoting colonization by legionellae in residential water distribution systems: An environmental case-control survey. European Journal of Clinical Microbiology and Infectious Diseases 21(10):717-721.
Collins, S., D. Stevenson, A. Bennett, and J. Walker. 2017. Occurrence of Legionella in UK household showers. International Journal of Hygiene and Environmental Health 220:401-406.
Committee on Foundations of Risk Analysis. 2015. SRA Glossary. http://www.sra.org/sites/default/files/pdf/SRAglossary-approved22june2015-x.pdf.
Cooley, L., 2018. Centers for Disease Control and Prevention Presentation to the National Academies’ Committee on Management of Legionella in Water Systems. Washington, DC. February 8, 2018.
Cordes, L. G., A. M. Wiesenthal, G. W. Gorman, J. P. Phair, H. M. Sommers, A. Brown, V. L. Yu, M. H. Magnussen, R. D. Meyer, J. S. Wolf, K. N. Shands, and D. W. Fraser. 1981. Isolation of Legionella pneumophila from hospital shower heads. Annals of Internal Medicine 94(2):195-197.
Corsaro, D., V. Feroldi, G. Saucedo, F. Ribas, J. F. Loret, and G. Greub. 2009. Novel Chlamydiales strains isolated from a water treatment plant. Environmental Microbiology 11(1):188-200.
Corsaro, D., G. S. Pages, V. Catalan, J. F. Loret, and G. Greub. 2010. Biodiversity of amoebae and amoeba-associated bacteria in water treatment plants. International Journal of Hygiene and Environmental Health 213(3):158-166.
Cross, K. E., J. W. Mercante, A. J. Benitez, E. W. Brown, M. H. Diaz, and J. M. Winchell. 2016. Simultaneous detection of Legionella species and L. anisa, L. bozemanii, L. longbeachae and L. micdadei using conserved primers and multiple probes in a multiplex real-time PCR assay. Diagnostic Microbiology and Infectious Disease 85(3):295–301.
CSTE (Council of State and Territorial Epidemiologists). 2005. Strengthening surveillance for travel-associated legionellosis and revised case definitions for legionellosis. 05-ID-01. Atlanta, GA: CDC.
Dai, D., W. J. Rhoads, M. A. Edwards, and A. Pruden. 2018. Shotgun metagenomics reveals taxonomic and functional shifts in hot water microbiome due to temperature setting and stagnation. Frontiers in Microbiology 9:2695.
Decker, B. K., P. L. Harris, R. R. Muder, J. H. Hong, N. Singh, A. F. Sonel, and C. J. Clancy. 2016. Improving the diagnosis of Legionella pneumonia within a healthcare system through a systematic consultation and testing program. Annals of the American Thoracic Society 13:1289-1293.
den Boer, J. W., E. P. Yzerman, J. Schellekens, K. D. Lettinga, H. C. Boshuizen, J. E. Van Steenbergen, A. Bosman, S. Van den Hof, H. A. Van Vliet, M. F. Peeters, R. J. Van Ketel, P. Speelman, J. L. Kool, and M. A. Conyn-Van Spaendock. 2002. A large outbreak of Legionnaires’ disease at a flower show, The Netherlands, 1999. Emerging Infectious Diseases 8:37-43.
den Boer, J. W., S. M. Euser, P. Brandsema, L. Reijnen, and J. P. Bruin. 2015. Results from the national Legionella outbreak detection program, The Netherlands, 2002–2012. Emerging Infectious Diseases 21(7):1167-1173.
DeOreo, W. B., P. W. Mayer, B. Dziegielewski, and J. Kiefer. 2016. Residential end uses of water, Version 2. Denver CO: Water Research Foundation.
Dey, R., H. Mount, A. Ensminger, G. Tyrrell, L. Ward, and N. Ashbolt. 2019. Legionellosis case linked to contaminated hot tub water: importance of local amoeba to isolate the causative L. pneumophila strain. Emerging Infectious Diseases 25(11):10.3201/eid2511.190522
Dilger, T., H. Melzl, and A. Gessner. 2018. Legionella contamination in warm water systems: a species-level survey. International Journal of Hygiene and Environmental Health 221:199-210.
Ditommaso, S., E. Ricciardi, M. Giacomuzzi, S. R. Arauco Rivera, A. Ceccarelli, and C. M. Zotti. 2014. Overestimation of the Legionella spp. load in environmental samples by quantitative real-time PCR: Pretreatment with propidium monoazide as a tool for the assessment of an association between Legionella concentration and sanitary risk. Diagnostic Microbiology and Infectious Disease 80:260-266.
Ditommaso, S., M. Giacomuzzi, E. Ricciardi, and C. M. Zotti. 2015. Viability-qPCR for detecting Legionella: Comparison of two assays based on different amplicon lengths. Molecular and Cellular Probes 29:237–243.
Donohue, M. J., K. O’Connell, S. J. Vesper, J. H. Mistry, D. King, M. Kostich, and S. Pfaller. 2014. Widespread molecular detection of Legionella pneumophila serogroup 1 in cold water taps across the United States. Environmental Science and Technology 48(6):3145-3152.
Dooling, K. L., K.-A. Toews, L. A. Hicks, L. E. Garrison, B. Bachaus, S. Zansky, L. R. Carpenter, B. Schaffner, E. Parker, S. Petit, A. Thomas, S. Thomas, R. Mansmann, C. Morin, B. White, and G. E. Langley. 2015. Active bacterial core surveillance for legionellosis—United States, 2011–2013. Morbidity and Mortality Weekly Report 64(42):1190-1193.
Dusserre, E., C. Ginevra, S. Hallier-Soulier, F. Vandenesch, G. Festoc, J. Etienne, S. Jarraud, and M. Molmeret. 2008. A PCR-based method for monitoring Legionella pneumophila in water samples detects viable but noncultivable legionellae that can recover their cultivability. Applied and Environmental Microbiology 74:4817–4824.
ECDC (European Centre for Disease Prevention and Control). 2014. Legionnaires’ disease. In: ECDC. Annual epidemiological report for 2012. Stockholm: ECDC.
ECDC. 2016. Legionnaires’ disease. In: ECDC. Annual epidemiological report for 2014. Stockholm: ECDC.
ECDC. 2017a. Technical document. European Legionnaires’ disease surveillance network (ELDSNet). Operating procedures for the surveillance of travel-associated Legionnaires’ disease in the EU/EEA. Stockholm: ECDC.
ECDC. 2017b. Legionnaires’ disease. In: ECDC. Annual epidemiological report for 2015. Stockholm: ECDC.
ECDC. 2018. Legionnaires’ disease. In: ECDC. Annual epidemiological report for 2016. Stockholm: ECDC.
ECDC. 2019. Legionnaires’ disease. In: ECDC. Annual epidemiological report for 2017. Stockholm: ECDC.
El-Shaarawi, A. H., S. R. Esterby, and B. J. Dutka. 1981. Bacterial density in water determined by poisson or negative binomial distributions. Applied and Environmental Microbiology 41:107-116.
EPA (U.S. Environmental Protection Agency). 2004. Air quality criteria for particulate matter (final report). EPA 600/P-99/002aF-bF. Washington, DC: EPA.
EPA. 2011. Exposure factors handbook. Washington, DC: EPA.
Erdoğan, H., and H. Arslan. 2016. Domestically acquired Legionnaires’ disease: Two case reports and a review of the pertinent literature. Balkan Medical Journal 33(3):350-353.
Farnham, A., L. Alleyne, D. Cimini, and S. Balter. 2014. Legionnaires’ disease incidence and risk factors, New York, New York, USA, 2002–2011. Emerging Infectious Diseases 20(11):1795-1802.
Fitzgeorge, R., A. Baskerville, M. Broster, P. Hambleton, and P. Dennis. 1983. Aerosol infection of animals with strains of Legionella pneumophila of different virulence: comparison with intraperitoneal and intranasal routes of infection. Epidemiology and Infection 90(1):81-89.
Flint Water Advisory Task Force. 2016. Final Report. https://www.michigan.gov/documents/snyder/FWATF_FINAL_REPORT_21March2016_517805_7.pdf.
Gale, P., P. A. H. van Dijk, and G. Stanfield. 1997. Drinking water treatment increases microorganism clustering: the implications for microbiological risk assessment. Journal of Water Supply Research and Technology-Aqua 46:117-126.
Gamage, S., M. Ambrose, S. Kralovic, L. A. Simbartl, and G. A. Roselle. 2018. Legionnaires’ disease surveillance in U.S. Department of Veterans Affairs medical facilities and assessment of health care facility association. JAMA Network Open 1(2):e180230. doi:10.1001/jamanetworkopen.2018.0230
Garner, E., J. McLain, J. Bowers, D. M. Engelthaler, M. A. Edwards, and A. Pruden. 2018. Microbial ecology and water chemistry impact regrowth of opportunistic pathogens in full-scale reclaimed water distribution systems. Environmental Science and Technology 52(16):9056-9068.
Garrison, L., K. Shaw, J. McCollum, C. Dexter, P. Vagnone, J. Thompson, and G. Langley. 2014. On-site availability of Legionella testing in acute care hospitals, United States. Infection Control and Hospital Epidemiology 35(7):898-900.
Garrison, L. E., J. M. Kunz, L. A. Cooley, M. R. Moore. C. Lucas, S. Schrag, J. Sarisky, and C. G. Whitney 2016. Vital signs: Deficiencies in environmental control identified in outbreaks of Legionnaires’ disease—North America, 2000–2014. Morbidity and Mortality Weekly Report 65:576-584.
Gomez-Alvarez, V., R. P. Revetta, and J. W. Santo Domingo. 2012. Metagenomic analyses of drinking water receiving different disinfection treatments. Applied and Environmental Microbiology 78(17):6095-6102.
Gonzalez, R. A., and R. T. Noble. 2014. Comparisons of statistical models to predict fecal indicator bacteria concentrations enumerated by qPCR- and culture-based methods. Water Research 48:296-305.
Goutziana, G., V. A Mouchtouri, M. Karanika, A. Kavagias, N. E. Stathakis, K. Gourgoulianis, J. Kremastinou, and C. Hadjichristodoulou. 2008. Legionella species colonization of water distribution systems, pools and air conditioning systems in cruise ships and ferries. BMC Public Health 8:390.
Griffin, M. R., Y. Zhu, M. R. Moore, C.G. Whitney, and C. G. Grijalva. 2013. U.S. hospitalizations for pneumonia after a decade of pneumococcal vaccination. New England Journal of Medicine 369:155-163.
Haas, C. N. 1996. How to average microbial densities to characterize risk. Water Research 30(4):1036–1038.
Haas, C. N. 2015. Microbial dose response modeling: past, present, and future. Environmental Science and Technology 49:1245-1259.
Haas, C. N, and B. Heller. 1988. Averaging too-numerous-to-count counts. Applied and Environmental Microbiology 54:2069-2072.
Haas, C. N., and J. B. Rose. 1995. Development of an Action Level for Cryptosporidium. Journal of the American Water Works Association 87:81-84.
Haas, C. N., J. B. Rose, and C. P. Gerba. 2014. Quantitative Microbial Risk Assessment. 2nd ed. New York: John Wiley.
Hamilton, K. A., and C. N. Haas. 2016. Critical review of mathematical approaches for quantitative microbial risk assessment (QMRA) of Legionella in engineered water systems: Research gaps and a new framework. Environmental Science: Water Research and Technology 2:599-613.
Hamilton, K. A., A. J. Prussin II, W. Ahmed, and C. N. Haas. 2018a. Outbreaks of Legionnaires’ disease and Pontiac fever, 2006–2017. Current Environmental Health Reports 5(2):263-271.
Hamilton, K. A., K. Parrish, W. Ahmed, and C. N. Haas. 2018b. Assessment of water quality in roof-harvested rainwater barrels in greater Philadelphia. Water 10(12):doi:10.3390/w10020092.
Hamilton, K. A., M. T. Hamilton, W. Johnson, P. Jjemba, Z. Bukhari, M. LeChevallier, and C. N. Haas. 2018c. Health risks from exposure to Legionella in reclaimed water aerosols: toilet flushing, spray irrigation, and cooling towers. Water Research 134:261-279.
Hammes, F., M. Berney, and T. Egli. 2011. Cultivation-independent assessment of bacterial viability. In: High Resolution Microbial Single Cell Analytics. Advances in Biochemical Engineering/Biotechnology. S. Müller and T. Bley (eds.). Berlin: Springer.
Havelaar, A., and J. M. Melse. 2003. Quantifying public health risk in the WHO guidelines for drinking-water quality: A burden of disease approach. RIVM raport 734301022. http://www.rivm.nl/bibliotheek/rapporten/734301022.pdf.
Hayes-Phillips, D., R. Bentham, K. Ross, and H. Whiley. 2019. Factors influencing Legionella contamination of domestic household showers. Pathogens 8(1):27.
Heilman, C. 2015. Meeting of the Board of Scientific Counselors on Infectious Diseases, Atlanta, GA, December 9-10, 2015.
Hicks, L., L. E. Garrison, G. E. Nelson, and L. M. Hampton. 2011. Legionellosis—United States, 2000–2009. Morbidity and Mortality Weekly Report 60(32):1083-1086.
Hlavsa, M. C., B. L. Cikesh, V. A. Roberts, A. M. Kahler, M. Vigar, E. D. Hilborn, T. J. Wade, D. M. Roellig, J. L. Murphy, L. Xiao, K. M. Yates, J. M. Kunz, M. J. Arduino, S. C. Reddy, K. E. Fullerton, L. A. Cooley, M. J. Beach, V. R. Hill, and J. S. Yoder. 2018. Outbreaks associated with treated recreational water—United States, 2000–2014. Morbidity and Mortality Weekly Report 67:547-551.
Hollenbeck, B., I. Dupont, and L. A. Mermel. 2011. How often is a work-up for Legionella pursued in patients with pneumonia? A retrospective study. BMC Infectious Diseases. doi:10.1186/1471-2334-11-237.
Howland, E. B., and D. H. Pope. 1983. Distribution and seasonality of Legionella pneumophila in cooling towers. Current Microbiology 9(6):319-323.
HSE (Health and Safety Executive). 2013. HSG274 Part 1 Published 2013. Legionnaires’ disease: Technical guidance Part 1: The control of Legionella bacteria in evaporative cooling systems. http://www.hse.gov.uk/pubns/priced/hsg274part1.pdf.
Ingram, J. G., and J. F. Plouffe. 1994. Danger of purulence screens in culture of Legionella species. Journal of Clinical Microbiology 32(1):209-210.
ISO (International Organization for Standardization). 1998. Water quality—Detection and enumeration of Legionella. ISO 11731:1998. Geneva, Switzerland: ISO.
ISO. 2004. Detection and enumeration of Legionella—Part 2: Direct membrane filtration method for waters with low bacterial counts. ISO 11731–2:2004. Geneva, Switzerland: ISO.
ISO. 2017. Water quality—Enumeration of Legionella. ISO 11731:2017. Geneva, Switzerland: ISO.
ISO. 2019. Water quality—Detection and quantification of Legionella spp. and/or Legionella pneumophila by concentration and genic amplification by quantitative polymerase chain reaction (qPCR) (revised). ISO/TS 12869:2019. Geneva, Switzerland: ISO.
Jain, S., W. H. Self, R. G. Wunderink, S. Fakhran, R. Balk, A. M. Bramley, C. Reed, C. G. Grijalva, E. J. Anderson, D. M. Courtney, J. D. Chappell, C. Qi, et al., for the CDC EPIC Study Team. 2015. Community-acquired pneumonia requiring hospitalization among U.S. adults. New England Journal of Medicine 373(5):415-427.
Jeong, H. J., and H. S. Yu. 2005. The role of domestic tap water in Acanthamoeba contamination in contact lens storage cases in Korea. Korean Journal of Parasitology 43(2):47-50.
Ji, P., W. J. Rhoads, M. A. Edwards, and Amy Pruden. 2018. Effect of heat shock on hot water plumbing microbiota and Legionella pneumophila control. Microbiome 6. doi:10.1186/s40168-018-0406-7.
Johnson, D., R. Lynch, C. Marshall, K. Mead, and D. Hirst. 2013. Aerosol generation by modern flush toilets. Aerosol Science and Technology 47(9):1047-1057.
Johnson, W. J., P. K. Jjemba, Z. Bukhari, and M. LeChevallier. 2018. Occurrence of Legionella in non-potable reclaimed water. Journal of the American Water Works Association 110:15-27.
Kaplan, S., and B. J. Garrick. 1981. On the quantitative definition of risk. Risk Analysis 1(1):11-27.
Kirschner, A. K. T. 2016. Determination of viable legionellae in engineered water systems: Do we find what we are looking for? Water Research 93:276-288.
Kontchou, J. A., and A. Nocker. 2019. Optimization of viability qPCR for selective detection of membrane-intact Legionella pneumophila. Journal of Microbiological Methods 156:68-76.
Kusnetsov, J., L. K. Neuvonen, T. Korpio, S. A. Uldum, S. Mentula, T. Putus, N. N. Tran Minh, and K. P. Martimo. 2010. Two Legionnaires’ disease cases associated with industrial wastewater treatment plants: a case report. BMC Infectious Diseases 10:343. https://doi.org/10.1186/1471-2334-10-343.
Kyritsi, M. A., V. A. Mouchtouri, A. Katsioulis, E. Kostara, V. Nakoulas, M. Hatzinikou, and C. Hadjichristodoulou. 2018. Legionella colonization of hotel water systems in touristic places of Greece: Association with system characteristics and physicochemical parameters. International Journal of Environmental Research and Public Health 15(12):2707-2719.
Lam, M. C., W. L. Ang, A. L. Tan, L. James, and K. T. Goh. 2011. Epidemiology and control of legionellosis, Singapore. Emerging Infectious Diseases 17(7):1209-1215.
Lee, T. C., J. E. Stout, and V. L. Yu. 1988. Factors predisposing to L. pneumophila colonization in residential water systems. Archives of Environmental Health: An International Journal 43(1):59-62.
Lee, T. C., R. M. Vickers, V. L. Yu, and M. M. Wagener. 1993. Growth of 28 Legionella species on selective culture media: A comparative study. Journal of Clinical Microbiology 31(10):2764-2768.
Lee, J. V. S. Lai, M. Exner, J. Lenz, V. Gaia, S. Casati, P. Hartemann, C. Lück, B. Pangon, M. L. Ricci, M. Scaturro, S. Fontana, M. Sabria, I. Sánchez, S. Assaf, and S. Surman-Lee. 2011. An international trial of quantitative PCR for monitoring Legionella in artificial water systems. Journal of Applied Microbiology 110:1032-1044.
Leoni, E., F. Catalani, S. Marini, and L. Dallolio. 2018. Legionellosis associated with recreational waters: a systematic review of cases and outbreaks in swimming pools, spa pools, and similar environments. International Journal of Environmental Research and Public Health 15(1612):doi:10.3390/ijerph15081612.
Li, L., T. Qin, Y. Li, H. Zhou, H. Song, H. Ren, L. Li, Y. Li, and E. Zhao. 2015. Prevalence and molecular characteristics of waterborne pathogen Legionella in industrial cooling tower environments. International Journal of Environmental Research and Public Health 12(10):12605-12617.
Li, H., S. Li, W. Tang, Y. Yang, J. Zhao, S. Xia, W. Zhang, and H. Wang. 2018. Influence of secondary water supply systems on microbial community structure and opportunistic pathogen gene markers. Water Research 136:160-168.
Lienard, J., A. Croxatto, S. Aeby, K. Jaton, K. Posfay-Barbe, A. Gervaix, and G. Greub. 2011. Development of a new Chlamydiales-specific real-time PCR and its application to respiratory clinical samples. Journal of Clinical Microbiology 49(7):2637-2642.
Lim, K.-Y., A. J. Hamilton, and S. C. Jiang. 2015. Assessment of public health risk associated with viral contamination in harvested urban stormwater for domestic applications. Science of the Total Environment 523:95-108.
Lizana, X., A. Lopez, S. Benito, G. Agusti, M. Rios, N. Pique, A.M. Marques, and F. Codony. 2017. Viability qPCR, a new tool for Legionella risk management. International Journal of Hygiene and Environmental Health 220:1318-1324.
Llewellyn, A. C., C. E. Lucas, S. E. Roberts, E. W. Brown, B. S. Nayak, B. H. Raphael, and J. M. Winchell. 2017. Distribution of Legionella and bacterial community composition among regionally diverse U.S. cooling towers. PLoS ONE 12(12):e0189937. https://doi.org/10.1371/journal.pone.0189937.
Loenenbach, A. D., C. Beulens, S. M. Euser, J. P. G. van Leuken, B. Bom, W. van der Hoek, A. M. de Roda Husman, W. L. M. Ruijs, A. A. Bartels, A. Rietveld, J. W. den Boer, and P. S. Brandsema. 2018. Two community clusters of Legionnaires’ disease directly linked to a biologic wastewater treatment plant, The Netherlands. Emerging Infectious Diseases 24(10):1914-1918.
Lorenzo-Morales, J., A. Ortega-Rivas, P. Foronda, E. Martinez, and B. Valladares. 2005. Isolation and identification of pathogenic Acanthamoeba strains in Tenerife, Canary Islands, Spain from water sources. Parasitology Research 95(4):273-277.
Lu, J., I. Struewing, H. Y. Buse, J. Kou, H. A. Shuman, S. P. Faucher and N. J. Ashbolt. 2013 Legionella pneumophila transcriptional response following exposure to CuO nanoparticles. Applied and Environmental Microbiology 79:2713-2720.
Lu, J., I. Struewing, S. Yelton and N. Ashbolt. 2015. Molecular survey of occurrence and quantity of Legionella spp., Mycobacterium spp., Pseudomonas aeruginosa, and amoeba hosts in municipal drinking water storage tank sediments. Journal of Applied Microbiology 119:278-288.
Lucas, C. E., T. H. Taylor, Jr., and B. S. Fields. 2011. Accuracy and precision of Legionella isolation by U.S. laboratories in the ELITE Program pilot study. Water Research 45:4428-4436.
Maisa, A., A. Brockmann, F. Renken, C. Lück, S. Pleischl, M. Exner, I. Daniels-Haardt and A. Jurke. 2015. Epidemiological investigation and case-control study: A Legionnaires’ disease outbreak associated with cooling towers in Warstein, Germany, August–September 2013. Eurosurveillance 20(46): https://doi.org/10.2807/1560-7917.ES.2015.20.46.30064.
Mandell, L. A., R. G. Wunderink, A. Anzueto, J. G. Bartlett, G. D. Campbel, N. C. Dean, S. F. Dowell, T. M. File, Jr., D. M. Musher, M. S. Niederman, A. Torres, and C. G. Whitney. 2007. Infectious Diseases Society of America/American Thoracic Society consensus guidelines on the management of community-acquired pneumonia in adults. Clinical Infectious Diseases 44:S27-72.
Mansi, A., I. Amori, I. Marchesi, A. M. Marcelloni, A. R. Proietto, G. Ferranti, V. Magini, F. Valeriani, and P. Borella. 2014. Legionella spp. survival after different disinfection procedures: Comparison between conventional culture, QPCR and EMA–QPCR. Microchemical Journal 112:65-69.
Marston, B., J. F. Plouffe, T. M. File, B. A. Hackman, S. J. Salstrom, H. B. Lipman, M. S. Kolczak, and R. F. Breiman. 1997. Incidence of community-acquired pneumonia requiring hospitalization results of a population-based active surveillance study in Ohio. Archives of Internal Medicine 157:1709-1718.
McClean, C. M., B. J. Silk, J. W. Buehler, and R. L. Berkelman. 2010. Disease reporting among Georgia physicians and laboratories. Journal of Public Health Management and Practice 16(6):535-543.
McClung, R. P., D. M. Roth, M. Vigar, V. A. Roberts, A. M. Kahler, L. A. Cooley, E. D. Hilborn, T. J. Wade, K. E. Fullerton, J. S. Yoder, and V. R. Hill. 2017. Waterborne disease outbreaks associated with environmental and undetermined exposures to water—United States, 2013–2014. Morbidity and Mortality Weekly Report 66:1222-1225.
Mérault, N., C. Rusniok, S. Jarraud, V. Gomez-Valero, C. Cazalet, M. Marin, E. Brachet, P. Aegerter, J. L. Gaillard, J. Etienne, J. L. Herrmann, the DELPH-I Study Group, C. Lawrence, and C. Buchrieser. 2011. Specific real-time PCR for simultaneous detection and identification of Legionella pneumophila serogroup 1 in water and clinical samples. Applied and Environmental Microbiology 77(5):1708-1717.
Mercante, J. W., and J. M. Winchell. 2015. Current and emerging Legionella diagnostics for laboratory and outbreak investigations. Clinical Microbiology Reviews 28(1):95-133.
Mouchtouri, V. A., and J. W. Rudge. 2015. Legionnaires’ disease in hotels and passenger ships: a systematic review of evidence, sources, and contributing factors. Journal of Travel Medicine 22(5):325-337.
Muller, D., M. L. Edwards, and D. W. Smith. 1983. Changes in iron and transferrin levels and body temperature in experimental airborne legionellosis. Journal of Infectious Diseases 147(2):302-307.
NAS (National Academy of Sciences). 1983. Risk assessment in the federal government: Managing the process. Washington DC: National Academy Press.
Nocker, A., C. Y. Cheung, and A. K. Camper. 2006. Comparison of propidium monoazide with ethidium monoazide for differentiation of live vs. dead bacteria by selective removal of DNA from dead cells. Journal of Microbiological Methods 67:310-320.
Nogueira, R., K. U. Utecht, M. Exner, W. Verstraete, and K. H. Rosenwinkel. 2016. Strategies for the reduction of Legionella in biological treatment systems. Water Science and Technology 74:816-823.
Nogva, H. K., S.M. Dromtorp, H. Nissen, and K. Rudi. 2003. Ethidium monoazide for DNA-based differentiation of viable and dead bacteria by 5’-nuclease PCR. BioTechniques 34:804-813.
Nygård, K., O. Werner-Johansen, S. Rønsen, D. A. Caugant, Ø. Simonsen, A. Kanestrøm, E. Ask, J. Ringstad, R. Ødegård, T. Jensen, T. Krogh, E. A. Høiby, E. Ragnhildstveit, I. S. Aaberge, and P. Aavitsland. 2008. An outbreak of Legionnaires’ disease caused by long-distance spread from an industrial air scrubber in Sarpsborg, Norway. Clinical Infectious Diseases 46:61-69.
Oliver, J. O. 2005. The viable but nonculturable state in bacteria. Journal of Microbiology 43:93–100.
Olsen, J. S., T. Aarskaug, I. Thrane, C. Pourcel, E. Ask, G. Johansen, V. Waagen, and J. M. Blatny. 2010. Alternative routes for dissemination of Legionella pneumophila causing three outbreaks in Norway. Environmental Science and Technology 44:8712-8717.
Orkis, L. T., L. H. Harrison, K. J. Mertz, M. M. Brooks, K. J. Bibby, and J. E. Stout. 2018. Environmental sources of community-acquired Legionnaires’ disease: a review. International Journal of Hygiene and Environmental Health 221:764-774.
Pagnier, I., D. Raoult, and B. La Scola. 2008. Isolation and identification of amoeba-resisting bacteria from water in human environment by using an Acanthamoeba polyphaga co-culture procedure. Environmental Microbiology 10(5):1135-1144.
Papadakis, A., D. Chochlakis, V. Sandalakis, M. Keramarou, Y. Tselentis, and A. Psaroulaki. 2018. Legionella spp. risk assessment in recreational and garden areas of hotels. International Journal of Environmental Research and Public Health 15:598. doi:10.3390/ijerph15040598.
Perkins, S. D., J. Mayfield, V. Fraser, and L. T. Angenent. 2009. Potentially pathogenic bacteria in shower water and air of a stem cell transplant unit. Applied and Environmental Microbiology 75(16):5363-5372.
Petrisek, R. and J. Hall. 2018. Evaluation of a MPN method for enumerating Legionella pneumophila in water. Journal of Water and Health. 16(1):25-33.
Phin, N., F. Parry-Ford, T. Harrison, H. R. Stagg, N. Zhang, K. Kumar, O. Lortholary, A. Zumla, and I. Abubakar. 2014. Epidemiology and clinical management of Legionnaires’ disease. Lancet Infectious Diseases 14(10):1011-1021.
Pinto, A. J., C. Xi, and L. Raskin. 2012. Bacterial community structure in the drinking water microbiome is governed by filtration processes. Environmental Science and Technology 46:8851-8859.
Pipes, W. O., P. Ward, and S. H. Ahn. 1977. Frequency distributions for coliform bacteria in water. Journal of the American Water Works Association 69(12):664-668.
Prussin, A. J., II, D. O. Schwake, and L. C. Marr. 2017. Ten questions concerning the aerosolization and transmission of Legionella in the built environment. Building and Environment 123:684-695.
PWGSC (Public Works and Government Services Canada). 2016. Control of Legionella in mechanical systems. MD 15161–2013. Ottawa, Canada: PWGSC.
Ramirez, J. A., T. L. Wiemken, P. Peyrani, F. W. Arnold, R. Kelley, W. A. Mattingly, R. Nakamatsu, S. Pena, B. E. Guinn, S. P. Furmanek, A. K. Persaud, A. Raghuram, F. Fernandez, L. Beavin, R. Bosson, R. Fernandez-Botran, R. Cavallazzi, J. Bordon, C. Valdivieso, J. Schulte, R. M. Carrico, and the University of Louisville Pneumonia Study Group. 2017. Adults hospitalized with pneumonia in the United States: incidence, epidemiology, and mortality. Clinical Infectious Diseases 65(11):1806-1812.
Raphael, B. H., D. J. Baker, E. Nazarian, P. Lapierre, D. Bopp, N. A. Kozak-Muiznieks, S. S. Morrison, C.E. Lucas, J. W. Mercante, K. A. Musser, and J. M. Winchell. 2016. Genomic resolution of outbreak-associated Legionella pneumophila serogroup 1 isolates from New York State. Applied and Environmental Microbiology 82(12):3582-3590.
Raphael, B. H., T. Huynh, E. Brown, J. C. Smith, I. Ruberto, L. Getsinger, S. White, and J. M. Winchell. 2019. Culture of clinical specimens reveals extensive diversity of Legionella pneumophila strains in Arizona. mSphere January/February 4(1):e00649-18
Rech, M. M., B. W. Swalla, and J. K. Dobranic. 2018. Evaluation of Legiolert for quantification of Legionella pneumophila from non-potable water. Current Microbiology 75:1282-1289.
Regli, S., J. B. Rose, C. N. Haas, and C. P. Gerba. 1991. Modeling the risk from Giardia and viruses in drinking water. Journal of the American Water Works Association 83:76-84.
Reller, L. B., M. P. Weinstein, and D. R. Murdoch. 2003. Diagnosis of Legionella infection. Clinical Infectious Diseases 36(1):64-69.
Renn, O. 1999. A model for an analytic-deliberative process in risk management. Environmental Science and Technology 33:3049-3055.
Reuter, S., T. G. Harrison, C. U. Köser, M. J. Ellington, G. P. Smith, J. Parkhill, S. J. Peacock, S. D. Bentley, M. E. Török. 2013. A pilot study of rapid whole-genome sequencing for the investigation of a Legionella outbreak. BMJ Open 3:e002175. doi:10.1136/bmjopen-2012-002175.
Reyneke, B., T. Ndlovu, S. Khan, and W. Khan. 2017. Comparison of EMA-, PMA- and DNase qPCR for the determination of microbial cell viability. Applied Microbiology and Biotechnology 101:7371-7383.
Rhoads, W. J., E. Garner, P. Ji, N. Zhu, J. Parks, D. O. Schwake, A. Pruden, and M. A. Edwards. 2017. Distribution system operational deficiencies coincide with reported Legionnaires’ disease clusters in Flint, Michigan. Environmental Science and Technology 51:11986-11995.
Ricci, M. L., S. Fontana, F. Pinci, E. Fiumana, M. F. Pedna, P. Farolfi, M. A. Bucci Sabattini, and M. Scaturro. 2012. Pneumonia associated with a dental unit waterline. Lancet 379(9816):684.
Robert Koch Institute. 2013. Infektionsepidemiologisches Jahrbuch meldepflichtiger Krankheiten für 2012, p. 207. Berlin, Germany: Robert Koch Institut.
Robert Koch Institute. 2015. Epidemiologisches bulletin 15/2015, p. 12. Berlin, Germany: Robert Koch Institut.
Rose, J. B., C. N. Haas, and S. Regli. 1991. Risk assessment and control of waterborne giardiasis. American Journal of Public Health 81(6):709-713.
Rowbotham, T. J. 1980. Preliminary report on the pathogenicity of Legionella pneumophila for freshwater and soil amoebae. Journal of Clinical Pathology 33(12):1179-1183.
Rowbotham, T. J. 1983. Isolation of Legionella pneumophila from clinical specimens via amoebae, and the interaction of those and other isolates with amoebae. Journal of Clinical Pathology 36(9):978-986.
Sartory, D. P., K. Spies, B. Lange, S. Schneider, and B. Langer. 2017. Evaluation of a most probable number method for the enumeration of Legionella pneumophila from potable and related water samples. Letters in Applied Microbiology 64:271-275.
Scaturro, M., S. Fontana, I. Dell’eva, F. Helfer, M. Marchio, M. V. Stefanetti, M. Cavallaro, M. Miglietta, M. T. Montagna, O. DeGiglio, T. Cuna, L. Chetti, M. A. Bucci Sabattini, M. Carlotti, M. Viggiani, A. Stenico, E. Romanin, E. Bonanni, C. Ottaviano, L. Franzin, C. Avanzini, V. Demarie, M. Corbella, P. Cambieri, P. Marone, M. C. Rota, A. Bella, and M. L. Ricci. 2016. A multicenter study of viable PCR using propidium monoazide to detect Legionella in water samples. Diagnostic Microbiology and Infectious Disease 85:283-288.
Schäfer, A., H. Harms, and A. J. B. Zehnder. 1998. Bacterial accumulation at the air-water interface. Environmental Science and Technology 32(23):3704-3712.
Schlesinger, R. B. 1989. Pp. 163–192. In: Concepts in inhalation toxicology. R. O. McClellan and R. F. Henderson (eds.). New York: Hemisphere Publishing Corp.
Schoen, M. E., and N. J. Ashbolt. 2011. An in-premise model for Legionella exposure during showering events. Water Research 45:5826-5836.
Schönning, C., C. Jernberg, D. Klingenberg, S. Andersson, A. Pääjärvi, E. Alm, E. Tano, and B. Lytsy. 2017. Legionellosis acquired through a dental unit: A case study. Journal of Hospital Infection 96(1):89-92.
Schwake, D. O., E. Garner, O. R. Strom, A. Pruden and M. A. Edwards. 2016. Legionella DNA markers in tap water coincident with a spike in Legionnaires’ disease in Flint, MI. Environmental Science and Technology Letters 39:311–315.
Seal, D., F. Stapleton, and J. Dart. 1992. Possible environmental sources of Acanthamoeba spp. in contact lens wearers. British Journal of Ophthalmology 76(7):424-427.
Sivaganesan, M., T. G. Aw, S. Briggs, E. Dreelin, A. Aslan, S. Dorevitch, A. Shrestha, N. Isaacs, J. Kinzelman, G. Kleinheinz, R. Noble, R. Rediske, B. Scull, S. Rosenberg, B. Weberman, T. Sivy, B. Southwell, S. Siefring, K. Oshima, and R. Haugland. 2019. Standardized data quality acceptance criteria for a rapid Escherichia coli qPCR method (Draft Method C) for water quality monitoring at recreational beaches. Water Research 156:456-464.
Smith, P., M. Moore, N. Alexander, L. Hicks, and R. O’Loughlin. 2007. Surveillance for travel-associated Legionnaires disease—United States, 2005–2006. Morbidity and Mortality Weekly Report 56(48):1261-1263.
Soda, E. A., A. E. Barskey, P. P. Shah S. Schrag, C. G. Whitney, M. J. Arduino, S. C. Reddy, J. M. Kunz, C. M. Hunter, B. H. Raphael, and L. A. Cooley. 2017. Vital signs: Health care–associated Legionnaires’ disease surveillance data from 20 states and a large metropolitan area—United States, 2015. Morbidity and Mortality Weekly Report 66:584-589.
Soller, J. A., T. Bartrand, N. J. Ashbolt, J. Ravenscroft, and T. J. Wade. 2010. Estimating the primary etiologic agents in recreational freshwaters impacted by human sources of faecal contamination. Water Research 44:4736-4747.
Spies, K., S. Pleischl, B. Lange, B. Langer, I. Hübner, L. Jurzik, K. Luden, and M. Exner. 2018. Comparison of the Legiolert™/Quanti-Tray® MPN test for the enumeration of Legionella pneumophila from potable water samples with the German regulatory requirements methods ISO 11731–2 and ISO 11731. International Journal of Hygiene and Environmental Health 221:1047-1053.
St-Martin, G., S. Uldum, and K. Mølbak. 2013. Incidence and prognostic factors for Legionnaires’ disease in Denmark, 1993–2006. ISRN Epidemiology 2013:847283. http://dx.doi.org/10.5402/2013/847283.
Saint, C. P., and L. Ho. 1999. A PCR test for the identification and discrimination of Legionella longbeachae serogroups 1 and 2. Journal of Microbiological Methods 37:245-253.
Stout, J. E., V. U. Yu, Y. C. Yee, S. Vaccarella, W. Diven, and T. C. Lee. 1992. Legionella pneumophila in residential water supplies: Environmental surveillance, with clinical assessment for Legionnaires’ disease. Epidemiology and Infection 109:49-57.
Stout, J. E., R. R. Muder, S. Mietzner, M. M. Wagener, M. B. Perri, K. DeRoos, D. Goodrich, W. Arnold, T. Williamson, O. Ruark, C. Treadway, E. C. Eckstein, D. Marshall, M. E. Rafferty, K. Sarro, J. Page, R. Jenkins, G. Oda, K. J. Shimoda, M. J. Zervos, M. Bittner, S. L. Camhi, A. P. Panwalker, C. J. Donskey, M.-H. Nguyen, M. Holodniy, V. L. Yu, and Legionella Study Group. 2007 Role of environmental surveillance in determining the risk of hospital-acquired legionellosis: A national surveillance study with clinical correlations. Infection Control and Hospital Epidemiology 28(7):818-824.
Ta, A. C., J. E. Stout, K. Walsh, and B. Dutka. 1995. Comparison of culture methods for monitoring Legionella species in hospital potable water systems and recommendations for standardization of such methods. Journal of Clinical Microbiology 33(8):2118-2123.
Taylor, M. J., R. H. Bentham, and K. E. Ross. 2014. Limitations of using propidium monoazide with qPCR to discriminate between live and dead Legionella in biofilm samples. Microbiology Insights 7:15-24.
Thomas, H. A., and R. L. Woodward. 1955. Estimation of coliform density by the membrane filter and the fermentation tube methods. American Journal of Public Health 45(11):1431-1437.
Thomas, V., G. McDonnel, S. P. Denyer, and J.-Y. Maillard. 2010. Free-living amoebae and their intracellular pathogenic microorganisms: risk for water quality. FEMS Microbiology Reviews 34:231-259.
Timms, V. J., R. Rockett, N. L. Bachmann, E. Martinez, Q. Wang, S. C.-A. Chen, N. Jeoffreys, P. J. Howard, A. Smith, S. Adamson, R. Gilmour, V. Sheppeard, and V. Sintchenko. 2017. Genome sequencing links persistent outbreak of legionellosis in Sydney (New South Wales, Australia) to an emerging clone of Legionella pneumophila sequence type 211. Applied and Environmental Microbiology 84(5):e02020-17.
Tobin, R. S., P. Ewan, K. Walsh, and B. Dutka. 1986. A survey of Legionella pneumophila in water in 12 Canadian cities. Water Research 20(4):495-501.
Toplitsch, D., S. Platzer, B. Pfeifer, J. Hautz, F. Mascher, and C. Kittinger. 2018. Legionella detection in environmental samples as an example for successful implementation of qPCR. Water 10:1-11.
Tosetti, N., A. Croxatto, and G. Greub. 2014. Amoebae as a tool to isolate new bacterial species, to discover new virulence factors and to study the host-pathogen interactions. Microbial Pathogenesis 77:125-130.
Totaro, M., P. Valentini, A. L. Costa, L. Frendo, A. Cappello, B. Casini, M. Miccoli, G. Privitera, and A. Baggiani. 2017. Presence of Legionella spp. in hot water networks of different Italian residential buildings: A three-year survey. International Journal of Environmental Research and Public Health 14(11):1296.
Travis, C. C., and H. A. Hattemer-Frey. 1988. Determining an acceptable level of risk. Environmental Science and Technology 22:873-876.
Valero, N., M. de Simón, P. Gallés, N. Izquierdo, J. Arimon, R. González, S. Manzanares-Laya, I. Avellanes, and A. Gómez. 2017. Street cleaning trucks as potential sources of Legionella pneumophila. Emerging Infectious Diseases 23(11):1880-1882.
Van Lier, A., S. A. McDonald, M. Bouwknegt, EPI group, M. E. Kretzschmar, A. H. Havelaar, M.-J. J. Mangen, J. Wallinga, and H. E. de Melker. 2016. Disease burden of 32 infectious diseases in the Netherlands, 2007–2011. PLoS ONE 11(4):e0153106.
Verhoef, L. P., E. P. F. Yzerman, J. P. Bruin, and J. W. den Boer. 2004. Domestic exposure to legionellae for Dutch Legionnaires’ disease patients. Archives of Environmental Health 59:597-603.
Völker, S., C. Schreiber, and T. Kistemann. 2016. Modelling characteristics to predict Legionella contamination risk—Surveillance of drinking water plumbing systems and identification of risk areas. International Journal of Hygiene and Environmental Health 219(1):101-109.
von Baum, H., S. Ewig, R. Marre, N. Suttorp, S. Gonschior, T. Welte, and C. Lück. 2008. Community-acquired Legionella pneumonia: New insights from the German competence network for community acquired pneumonia. Clinical Infectious Diseases 46(9):1356-1364.
VSP (Vessel Sanitation Program). 2018. Operations manual. U.S. Department of Health and Human Services U.S. Public Health Service, Centers for Disease Control and Prevention.
Wallet, F., C. Emery, E. Briand, and P.-A. Cabanes. 2016. Prevalence of Legionella in the production and distribution of domestic hot water. Environnement, Risques & Santé 15(1):29-38.
Walser, S. M., D. G. Gerstner, B. Brenner, C. Höller, B. Liebl, and C. E. W. Herr. 2014. Assessing the environmental health relevance of cooling towers—A systematic review of legionellosis outbreaks. International Journal of Hygiene and Environmental Health 217:145-154.
Wang, H., M. Bedard, M. Prevost, A. K. Camper, V. R. Hill, and A. Pruden. 2017. Methodological approaches for monitoring opportunistic pathogens in premise plumbing: A review. Water Research 117:68-86.
WHO (World Health Organization). 2008. Guidelines for drinking-water quality. Second amendment to the third edition. Volume 1 recommendations. Geneva, Switzerland: World Health Organization.
Witherell, L. E., R. W. Duncan, K. M. Stone, L. J. Stratton, L. Orciari, S. Kappel, and D. A. Jillson. 1988. Investigation of Legionella pneumophila in drinking water. Journal of the American Water Works Association 80(2):87-93.
Wullings, B. A., R. Italiaander, and P. W. J. J. van der Wielen. 2016. Differentiating between dead and live bacteria using EMA or PMA and detection with qPCR. Report BTO 2016.072, KWR Watercycle Research Institute, Nieuwegein, The Netherlands (in Dutch).
Yaradou, D. F., S. Hallier-Soulier, S. Moreau, F. Poty, Y. Hillion, M. Reyrolle, J. André, G. Festoc, K. Delabre, F. Vandenesch, J. Etienne, and S. Jarraud. 2007. Integrated real-time PCR for detection and monitoring of Legionella pneumophila in water systems. Applied and Environmental Microbiology 73(5):1452-1456.
Yzerman, E. P. F., J. W. den Boer, K. D. Lettinga, J. Schellekens, J. Dankert, and M. Peeters. 2001. Sensitivity of three urinary antigen tests associated with clinical severity in a large outbreak of Legionnaires’ disease in The Netherlands. Journal of Clinical Microbiology 40(9):3232-3236.
Zahran, S., S. P. McElmurry, P. E. Kilgore, D. Mushinski, J. Press, N. G. Love, R. C. Sadler, and M. S. Swanson. 2018. Assessment of the Legionnaires’ disease outbreak in Flint, Michigan. Proceedings of the National Academy of Sciences 115:E1730-E1739.


