
4
Current Condition
This chapter will describe the evolution and current state of the National Institutes of Health Bethesda Campus (NIH-BC), including the purpose and size of its buildings, their defined uses and current condition for their intended uses, and a recent history of investment for specific purposes and sustaining needs.
INFRASTRUCTURE IN SUPPORT OF SCIENTIFIC ACTIVITIES AT NIH-BC
Overview
The NIH Bethesda Campus currently utilizes facilities dating back to 1923. Of the nearly 13.5 million net assignable square feet (SF) of research and administration building space, one-half requires renovation at levels ranging from complete demolition (1.2 million SF); substantial improvement (3.5 million SF); and safety code required remodeling (2 million SF). The underground utilities that service 98 buildings need maintenance and upgrades to prevent critical disruptions of water, heat, electricity, and communications.
Over the past nearly 100 years, the campus has seen many changes. Starting with a few small buildings originally, the campus now includes approximately 98 buildings totaling 13.5 million square SF of facilities and 20 miles of underground utilities having a current replacement value of $7.5 billion. These facilities are located on a 310-acre mixed-use campus that includes roadways, walkways, parking structures, and significant green spaces to buffer the campus from surrounding neighbors.
Sixteen of the campus facilities are in such a deteriorated condition that they are recommended for demolition. These facilities account for approximately 1.2 million SF, of which approximately 40 percent is laboratory and 60 percent administrative space. Another 3.5 million SF are in need of substantive improvement, maintenance, and repair to perform their defined service. Another 2 million SF are in need of attention to improve comfort and power systems, weather tightness, and code and life safety issues. The balance of 6.7 million SF, about half of the total square footage of the campus’s built environment, are in reasonably serviceable condition and are fit for their assigned uses. The 20 miles of underground utilities and their sources have an array of problems needing significant attention to sustain and support the 98 buildings they serve.
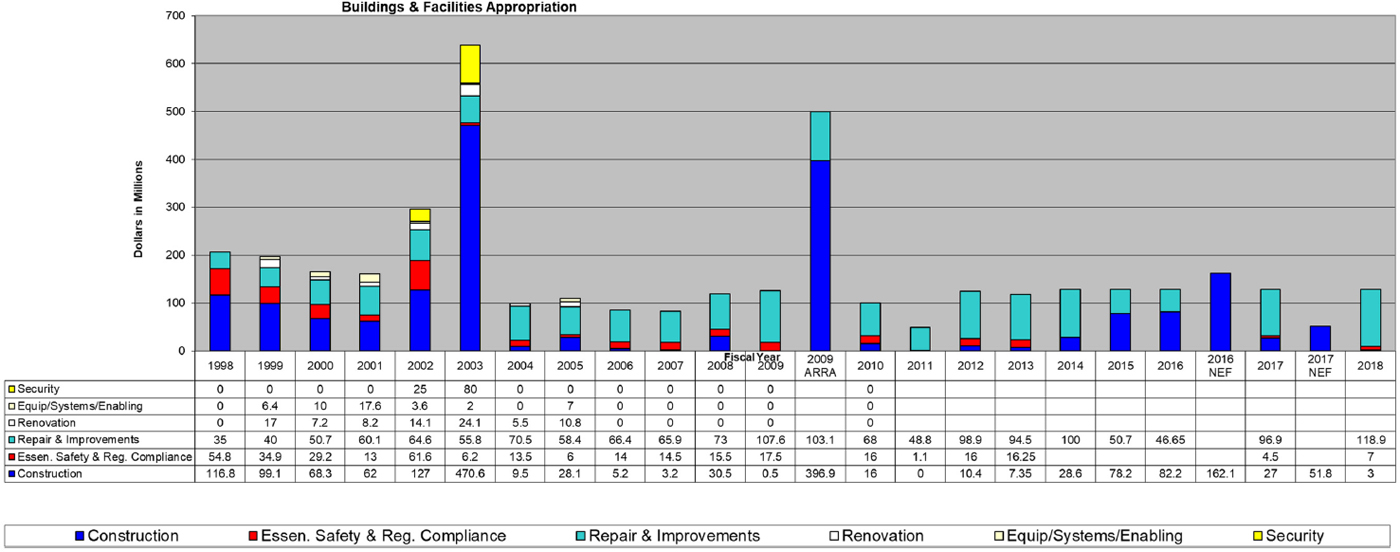
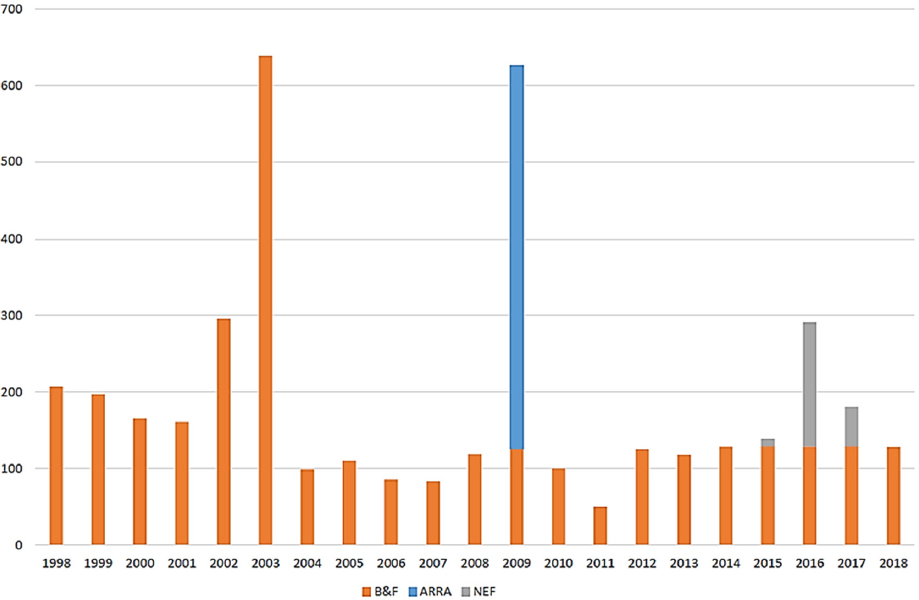
Over the last two decades, NIH has expended slightly over $4.1 billion (Figure 4.1) from its Buildings and Facilities (B&F) appropriation on new, renovated, and updated buildings and safety and support of its built environment. Approximately $2.3 billion of that is for construction-related activity. These activities include constructing new buildings; reconfiguring existing spaces to accommodate new services; repairing existing space and structure, including safety, power, and comfort systems; and restoring deteriorating interior and exterior structural features. The planning and implementation of this volume of work has been overseen by a qualified internal team that is required to justify and prioritize needs, advocate for funding, and execute structural changes around fully operational laboratories in a highly regulated and sensitive patient and animal care activity.
Since 1998, significant appropriations have contributed to the campus and its mission. Figure 4.1 shows the use of the funding and illustrates that most of the funding came from a few large special appropriations that were dedicated to major construction projects. These projects are briefly described here:
- The Dale and Betty Bumpers Vaccine Research Center was completed in 2000. This 140,000 SF lab and research building is dedicated to vaccine research; its primary mission has been HIV/AIDS research.
- In 2001, the Louis Stokes Laboratory was completed. This building introduced the concept of research “neighborhoods” to the campus. This 6-story, 565,459 SF building provides 250,000 SF of state-of-the-art laboratory, office, and conference facilities for scientists from nine NIH institutes.
- The Mark O. Hatfield Clinical Research Center was completed in 2004 and added 620,000 SF of inpatient hospital treatment space and day-hospital space and 240,000 SF of laboratory space. Along with the clinical space, two family care facilities were provided.
- The original Porter Neuroscience Research Center was completed in 2004 and provided 600,000 SF of research space housing for personnel from seven different institutes.
- In 2007, the C.W. Bill Young Center for Biodefense and Emerging Infectious Diseases opened with 84,000 SF of research building and parking facilities for over 2000 vehicles.1
- The American Recovery and Reinvestment Act (ARRA) of 2009 provided $500 million for B&F expansion and repair of NIH facilities. This allowed for phase II of the Porter Neuroscience Research Center to be constructed. This added 306,000 SF of integrated laboratory and research space when completed in 2014.
Since 2000, just under 3 million SF of laboratories have been added to the campus. This accounts for 45 percent of all lab space on campus. During this time, several smaller buildings were constructed to house families, support operations, improve security, and improve energy efficiency, sustainability, and utility distribution, including the following:
- The Center for Information Technology Data Center, which was upgraded to increase data storage and transmission speed, as well as weather and disruption sustainability.
- A Thermal Energy Storage system program, storing water that is chilled after-hours, was commissioned in 2018 to significantly enhance the efficiency and reliability of the Central Utility Plant.
- The E and F wings of the original Building 10, about 500,000 SF of hospital converted to lab space use.
___________________
1 Part of Project Bioshield. This included the following monies for NIH buildings: BSL 4 facilities at RML (NIAID) $70 million and Frederick (NIAID) $104 million; Building 33 Bethesda (NIAID) $186 million (D. Cushing, NIH Office of Research Facilities, communication to M. Offutt, National Academies of Sciences, Engineering, and Medicine, August 20, 2018).
Funding for Capital Projects
NIH funding is appropriated each fiscal year through the appropriations process. The budget formulation process occurs each June through December, in which the Department of Health and Human Services (HHS) prepares a budget—as do the other agencies and departments—in consultation with and pursuant to circulars and procedures of the Office of Management and Budget. The resulting President’s Budget Request is submitted to Congress in February or later of the following year. Thereafter, HHS develops Congressional Justifications, which include details of the NIH request for B&F funds 2 years into the future.
Funding for capital projects comes from a number of sources, including the B&F line item in the Congressional appropriation noted above; a nonrecurring expense fund (NEF), from the HHS; and onetime appropriations. (The funding appropriated for NIH does not ring-fence or otherwise separate capital budget dollars from operating budget dollars.) NIH is further able to direct monies from operating funds of individual institutes (using what is known as the special authority, a reference to its origin in the appropriations bills) or from centrally administered funds such as the Capital Improvement Fund using deposits from the institutes and centers’ (ICs) appropriated funds.
The B&F line item has been constant for many years, at roughly $120 million (see Figure 4.1). These funds are intended to support the mission through facilities maintenance and repair. The NEF competes with the needs of other agencies within HHS. Special one-time appropriations come from Congress for various reasons or in support of a defined need, including, most recently the ARRA funds in 2009.
SPACE UTILIZATION AT NIH-BC
The 13.5 million SF on the Bethesda Campus (see Figure 4.2) can be broken down into three main asset categories: laboratories (which includes clinical space),2 administration, and animal care. The remaining space in the 98 buildings comprises support facilities for utilities/industrial uses, parking, housing, warehouses, and so on.
To accommodate a growing residential community around its boundaries over time, as well as emerging federal regulations on security standoffs from boundary perimeters, the Bethesda Campus instituted a buffer zone of 67 acres (22 percent of total acreage) (see Table 4.1). An additional 112 acres (36 percent of total acreage) comprise open space, including gardens and outside seating areas, and 54 acres (17 percent of total acreage) are dedicated for roads, walkways, and service areas. Buildings currently occupy 49 acres (16 percent of total acreage), and a combination of parking facilities occupy the remaining 9 percent of acreage.
The Bethesda Campus consists of almost 11 million net assignable square feet (NASF) within its built facilities. NIH also owns approximately 2.5 million NASF on other campuses, including Fort Detrick, Poolesville, and the Rocky Mountain Laboratory (Hamilton, Montana) and Research Triangle Park (North Carolina) campuses. The building commons areas (such as lobbies, main corridors, restrooms, and building support areas) comprise the majority of the NASF at 54 percent (see Table 4.2). If the building common areas are excluded, over 80 percent of the non-commons NASF is allocated to a single institute or center, and 15 percent of the non-commons NASF is held by the Office of Research Facilities (ORF) or the Office of Research Services. Approximately 48,000 NASF (1 percent of non-commons NASF) is space shared among two or more ICs.
Excluding the building commons NASF, slightly over one-third of the assigned space on the Bethesda Campus (36 percent) is categorized as laboratory space, 27 percent as administrative space, 15 percent as clinical space, and 9 percent as animal care space (see Table 4.3). An additional 13 percent is categorized as “other,” and includes facilities such as the Children’s Inn at NIH (a residential facility on the campus).
___________________
2 The Federal Real Property Council categories are such that investigational space such as the Clinical Center is counted as “Laboratories.”
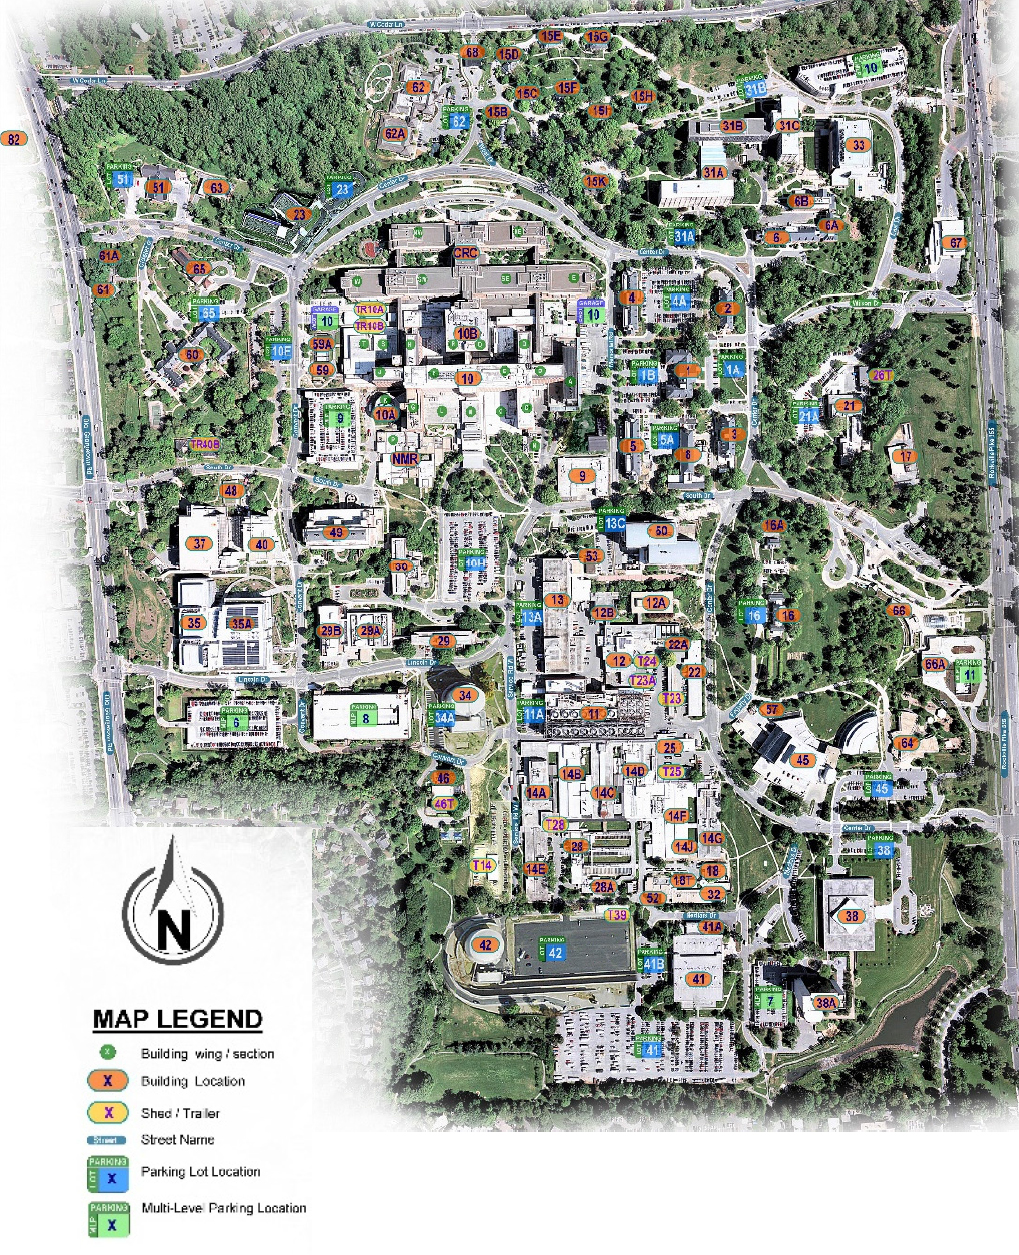
TABLE 4.1 NIH Bethesda Campus Land Use Allocation
| Land Use | Acres | % of Total |
|---|---|---|
| Open space | 112 | 36 |
| Buffer zone | 67 | 22 |
| Roads/walkways/service areas | 54 | 17 |
| Buildings | 49 | 16 |
| Parking | 28 | 9 |
| Total | 310 | 100 |
SOURCE: HHS and NIH, 2013, 2013 Comprehensive Master Plan—Bethesda Campus, June 14, p. 4-3.
TABLE 4.2 NIH Bethesda Campus Building Use Allocation
| Organizational Unit | Net Assignable Square Feet (NASF) | Fraction of Total (%) | Fraction of NASFa (%) |
|---|---|---|---|
| Building commons | 5,873,889 | 54 | |
| IC single unit | 4,215,384 | 39 | 84 |
| ORS/ORF | 738,577 | 7 | 15 |
| IC shared | 48,553 | 0 | 1 |
| Total | 10,876,403 | 100 | 100 |
a Exclusive of building commons.
NOTE: Based on rent model dated 10-16-2017. IC, institute or center; ORS, Office of Research Services; ORF, Office of Research Facilities.
SOURCE: NIH Office of Research Facilities, “Questions from NAS—Part 3,” via e-mail, June 14, 2018.
TABLE 4.3 NIH Bethesda Campus Assigned Space (Excluding Commons) by Four Main Asset Categories
| Occupancy Category | Net Assigned Square Feet | Fraction of Total (%) |
|---|---|---|
| Laboratory | 1,791,301 | 36 |
| Administrative | 1,365,659 | 27 |
| Clinical | 764,295 | 15 |
| Animal | 428,580 | 9 |
| Other | 652,268 | 13 |
| Total | 5,002,103 | 100 |
SOURCE: NIH Office of Research Facilities, “Questions from NAS—Part 3,” via e-mail, June 14, 2018.
The ICs and the administrative units, the latter situated within the Office of the Director, and nonfederal asset holders such as the Foundation and the Children’s Inn have been assigned significant amounts of square footage categorized as “administrative.” Eleven organizational units occupy 38 percent of all administrative space, and 33 percent of all “other” space occupies approximately 15 percent of the assigned space on the Bethesda Campus (734,021 SF). (These organizational units do not occupy other categories of space usage. Please see Appendix G for details.) In addition, approximately 7 percent of the assignable square footage (331,561 SF) is currently vacant (e.g., awaiting renovation or demolition), representing 35 percent of the “other” space, 12 percent of the clinical space, and 10 percent of the laboratory space (see Table 4.4). The ORS and ORF occupy 14 percent of assignable space (738,577 SF) in all categories.
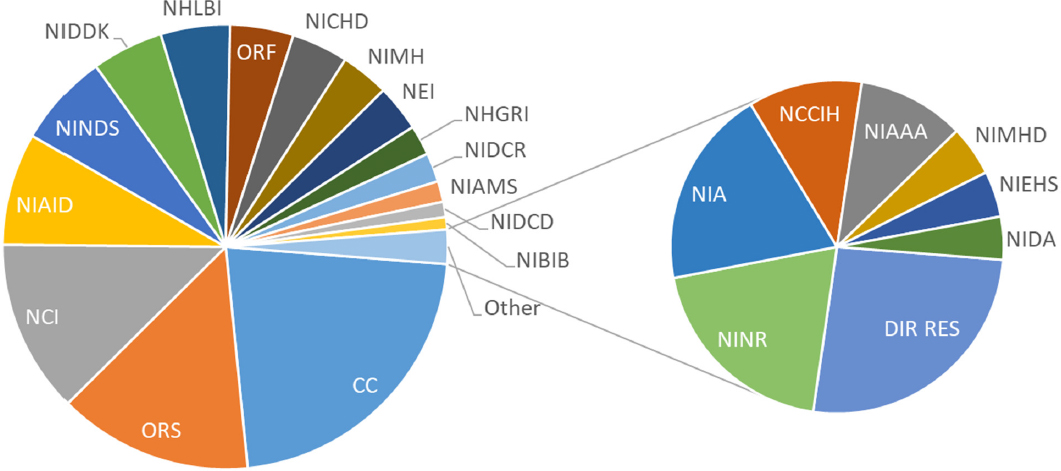
The various NIH ICs—aside from those mentioned in Table 4.4—occupy the remaining 3.2 million SF of assignable space across the Bethesda Campus (see Appendix G). The Clinical Center occupies 86 percent of all clinical assignable space on the campus. The National Eye Institute, National Institute of Neurological Disorders and Stroke, and National Institute of Allergy and Infectious Diseases (NIAID) each occupy 15 percent of the total animal assignable space. NIAID also occupies 12 percent of the total laboratory assignable space, while the National Cancer Institute occupies 20 percent of total laboratory space, 9 percent of all animal space, and 7 percent of all administrative space (see Figure 4.3).
TABLE 4.4 NIH Bethesda Campus Assigned Space by Occupancy: Administrative Units, Institutes or Centers (ICs), and Vacant
| Unit | Administrative | Animal | Clinical | Laboratory | Other | Total | Percentage of all NASF (%)a |
|---|---|---|---|---|---|---|---|
ICs without wet laboratory, animal, or clinical spaceb |
382,600 | — | — | — | 135,529 | 518,130 | 10 |
Administrativec |
138,642 | — | — | — | 77,249 | 215,891 | 4 |
Vacant space |
30,934 | 5,690 | 91,032 | 186,491 | 17,415 | 331,561 | 7 |
Office of Research Facilities |
115,328 | 0 | 597 | 8,979 | 56,547 | 181,451 | 3 |
Office of Research Services |
133,248 | 146,164 | 0 | 19,312 | 258,401 | 557,125 | 11 |
Subtotal |
800,753 | 151,854 | 91,629 | 214,783 | 545,141 | 1,804,159 | 36 |
Percentage of Total by Category |
59 | 35 | 12 | 12 | 84 |
a As a fraction of all assignable square footage (5,002,103 NASF) listed in Table 4.3.
b Includes Center for Information Technology, Center for Scientific Research, National Center for Advancing Translational Sciences, Fogarty International Center, National Institute of General Medical Sciences, and National Library of Medicine.
c Includes Foundation for the NIH; Office of Human Resources, Foundation for Advanced Education in the Sciences, Children’s Inn at NIH, and Office of the Director.
NOTE: May not add due to rounding. NASF, net assignable square feet.
SOURCE: NIH Office of Research Facilities, “Questions from NAS—Part 3,” via e-mail, June 14, 2018.
CURRENT CONDITIONS OF IRP FACILITIES AT NIH-BC
IRP Facilities Are a Mix of Recently Built and Past-Their-Prime Buildings
The Master Plan (NIH ORF, 2013) identifies 16 buildings scheduled for demolition. Of these, 12 are predominantly for laboratory use. These buildings were built in the 1940s and 1950s. Their condition, shape, and utility render them more costly to renovate than to replace. Specifically, the floor-to-floor height of the existing structures is insufficient to support the significant duct work and ventilation systems and other power, water, and data needs. This accounts for 477,457 SF (7.5 percent) of total laboratory space on campus. This specifically includes a major portion of the animal facilities, a major contributor to the testing and research done in early clinical trials.
The other 4 buildings in this list are primarily administrative space and account for 743,482 SF (43.5 percent) of available administrative space.
Since 2000, 2,900,000 SF feet of laboratory space have been added to the campus. This accounts for 45 percent of total lab space on campus. An additional 982,000 SF of parking structure, housing, and support facilities have been added. This represents approximately 28 percent of the campus. Said another way, 72 percent of the campus is over 20 years old.
An additional 1.1 million SF of space have seen significant renovation or reuse. Notably, 765,911 SF of laboratory space have been renovated or reconfigured to support benchtop science. An example of this is the E and F wings of Building 10, which were converted from hospital function to lab function.
NIH BMAR and Facility Condition Index and the Degree to Which Maintenance Backlog Is or Is Not Part of the Decision Making Process
NIH’s Backlog of Maintenance and Repair (BMAR) is developed each year under contract with an outside consultant, who maintains an extensive database of all building system conditions and life cycle cost data to ensure that when each component has reached the end of useful life, the renewable costs are generated automatically into the BMAR calculations. The BMAR is updated each October based on the contractor’s database and adjusted according to a review of any repairs and renovations that occurred since the previous year. Additionally, each April, an escalation factor is added to the BMAR totals, ranging between 2 and 4 percent. The process for determining each year’s specific escalation factor was not provided to the committee, but the amounts seem reasonable.
NIH also incurs costs that do not effectively reduce the BMAR. These include the following: (1) emergency repairs (often due to the age of the facilities); (2) change orders—for unforeseen conditions discovered during renovation and specific aging systems that are impacted by attaching upgraded systems; (3) environmental—the age of the facilities also contributes to significant costs for remediating hazardous materials such as asbestos, lead, and laboratory contaminants such as mercury; and (4) mission support—NIH often needs to conduct repairs and improvements to support new scientific equipment. Combined, these factors often consume a large portion of funding, leaving the balance available to reduce BMAR. In the past, NIH tracked only the Condition Index (CI) and BMAR associated with buildings; recently, it began including infrastructure in the Central Utility Plant (CUP, Building 11 in Figure 4.2) and horizontal site infrastructure (chilled water, steam, fire protection, and electrical power distribution) in those calculations (NIH, 2018a).
The BMAR Reduction Plan for the campus is reported to include the following (NIH, 2018a):
- A combination of capital projects that are already funded but not yet calculated as a reduction;
- Planned capital projects that are developed and shown on the 5-year B&F Plan;3
- Capital projects that need to be planned and funded based on their level of CI, type of facility, and level of risk;
- Mothballed facilities that require modest investment to maintain; and
- Targeted projects to existing facilities for recurring large maintenance issues, emergency issues, and major repairs (based on the 5-year B&F Plan for repair and improvements).
The BMAR is used to create the Asset CI defined by the condition assessment contractor as follows:4
![]()
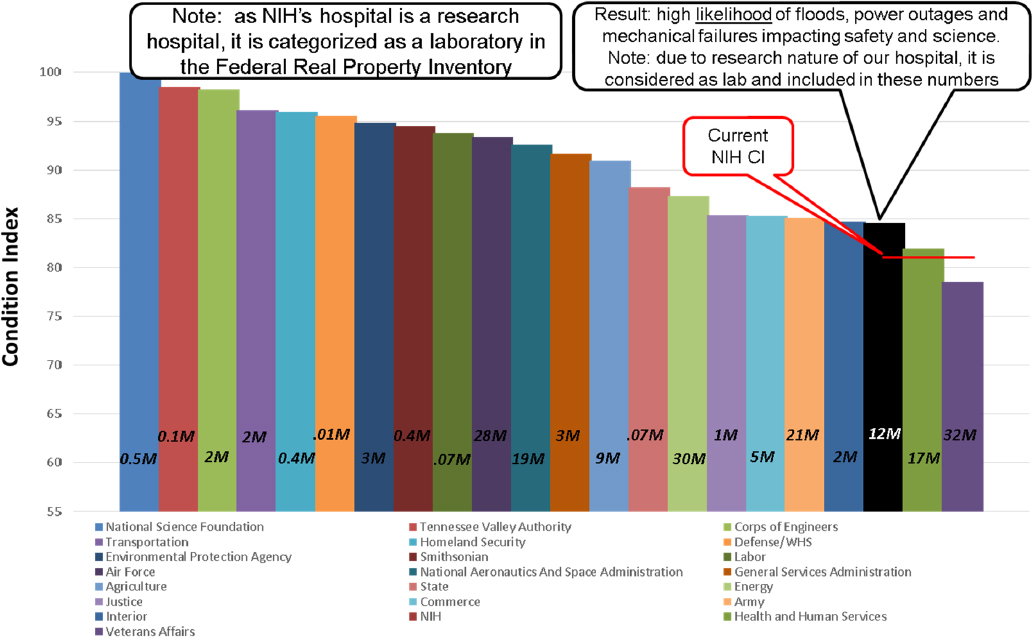
The ORF provided the committee with a listing of all facilities managed at the various NIH properties. This facility list was filtered to include only the Bethesda Campus and is included as Appendix F. The Bethesda facility list includes the facility number, use, year constructed, size, replacement value, BMAR, and condition index. The BMAR is $1.3 billion (on a replacement value for those same facilities and infrastructure of $7.5 billion). The average Condition Index of NIH buildings is 83.3, which is among the lowest in the federal government (see Figure 4.4). As a reference, the International Facility Management Association CI index rating system would consider a rating of 83.3 as “poor.” Figure 4.4 shows the relative comparison of the NIH CI compared to many other federal agencies.
___________________
3 The 5-year B&F Plan is the result of scoring proposals for program impact and facility impact and classifying them into three levels of relative priority for execution (D. Cushing, NIH Office of Research Facilities, “Capital Projects: On Deck, Shovel Ready & Emerging,” presentation to the committee March 20, 2018).
4 Raymond Dufresne, Accruent, LLC, “Benchmarking NIH Assets,” presentation to the committee, August 8, 2018.
TABLE 4.5 Facilities of NIH Bethesda Campus Sorted by Condition Index
| Ratinga | Score | No. of Facilities | Total area (square feet) | Replacement Value ($) | BMAR ($) | Average Facility Age (years) | Average CI |
|---|---|---|---|---|---|---|---|
| Good | 100-95 | 19 | 3,657,835 | 1,792,794,182 | 30,243,802 | 37 | 98.3 |
| Fair | 94-90 | 21 | 3,063,511 | 1,585,947,565 | 114,498,944 | 44 | 92.8 |
| Poor | 89-70 | 38 | 5,311,983 | 3,586,192,920 | 795,842,580 | 59 | 77.6 |
| Critical | < 70 | 20 | 1,450,722 | 577,476,558 | 310,595,055 | 61 | 46.2 |
a International Facility Management Association condition categories.
NOTE: BMAR, Backlog of Maintenance and Repair; CI, Condition Index.
TABLE 4.6 Facilities of NIH Bethesda Campus Sorted by Condition Index, with 16 Buildings Demolished per the 2013 Master Plan
| Ratinga | Score | No. of Facilities | Total area (square feet) | Replacement Value ($) | BMAR ($) | Average Facility Age (years) | Average CI |
|---|---|---|---|---|---|---|---|
| Good | 100-95 | 18 | 3,652,659 | 1,787,953,151 | 30,146,177 | 35 | 98.3 |
| Fair | 94-90 | 19 | 2,889,118 | 1,422,840,559 | 103,219,030 | 42 | 92.7 |
| Poor | 89-70 | 30 | 5,110,382 | 3,439,844,774 | 770,467,982 | 58 | 77.6 |
| Critical | < 70 | 15 | 606,437 | 271,742,056 | 121,800,114 | 60 | 55.2 |
a International Facility Management Association condition categories.
NOTE: BMAR, Backlog of Maintenance and Repair; CI, Condition Index.
Table 4.5 categorizes facilities by CI; the committee developed this table from the data provided by the ORF. Of the 98 facilities on the Bethesda Campus, 58 have a CI rating of poor (<90) or critical (<70). Half of the campus’s total SF is rated at poor or critical and has an average facility age of 59 years for facilities rated poor and 61 years for those rated critical. This compares to an average age of 37 years and 44 years for the facilities rated good or fair, respectively. NIH reports that its goal is to raise the CI above 90 for all campus facilities. Table 4.6 shows how many facilities would be each CI category were the 16 facilities slated for demolition in the Master Plan to be removed.
Risk to Research and Patient Care Created by Outages and Disruptions
The NIH presented information5 that provided the current project score process, called the B&F Project Prioritization Model for fiscal year (FY) 2019-2023 and based on a total possible score of 1,000. The scoring process assigns a potential 222 points out of the 1,000 total, or 22.2 percent of the score to the building systems’ risk of failure impacting life safety and critical mission functions. The Facilities Working Group (FWG) subjectively scores the risk for each project. There is no campus-wide risk assessment process that quantifies the impacts to research and patient care for each facility and facility system. This is discussed further in Chapter 5.
The NIH facilities at the Bethesda Campus have experienced various system failures in the past several years. During the committee’s inspection of various buildings accompanied by members of the NIH ORF staff described several failures of plumbing distribution systems that resulted in flooding to laboratories and operating rooms. NIH did not provide any comprehensive historical reporting (e.g., frequency, system,
___________________
5 D. Cushing, NIH Office of Research Facilities, “Projects Selection and Execution 2018 B&F Proposed Line Item Projects for Prioritization (FY 2019-2023),” presentation to the committee, May 15, 2018.
type of failure, and resulting impacts) of these failures from the Computerized Maintenance Management System such as might support a more comprehensive risk assessment process.
Portions of a presentation6 included information on the Building 10 Complex. This was the only example provided of using condition assessment data to develop the risk assessment. Data for the 2011 facilities condition assessment rated the mechanical systems, the electrical systems, and the functionality and quantity of space. There were no research or patient care impacts identified in this presentation.
Finding: NIH does not have a formalized risk assessment process across the facilities portfolio that measures and ranks facilities or facility systems from historical operations and maintenance records. The facility condition assessment process generates the BMAR, which identifies the associated level of risk to personnel, patients, and research created by potential outages and disruptions of facility systems.
Building Process and Monies Available or Used
The B&F account is one of 27 accounts for which the dollar amount is controlled by Congress (see the section “Funding for Capital Projects,” above). B&F funds are 5-year appropriations, meaning that they can be carried over into subsequent fiscal years, something that is critically important for acquisition of capital projects. Funds are allotted per quarter based on requests typically weighted to second and third quarter (Q2 and Q3). FY 2018 funding was $128 million, roughly consistent with immediate past years.
The FY 2019 B&F funding request was $200 million; this amount was appropriated. Complementing the B&F account, episodic one-time increases have occurred historically based on specific events such as Biodefense (2003) and ARRA (2009) (see Figure 4.1, above).7 Congress typically appropriates the amount requested for the B&F account in the President’s budget.
The so-called special authority is revisited from time to time. Originally, as part of the NIH FY 2007 Appropriation Act,8 Congress authorized NIH to spend IC operating funds of up to $2,500,000 per project to cover costs associated with altering, repairing, or improving NIH facilities. A similar provision was included in the FY 2009 President’s budget request, limiting the total IC operating funds expenditures for renovations, alterations, and repairs to no more than $35,000,000 for the year. From 2008 to 2011, ORF spent an average of $21.7 million per year of IC funds on repairs and improvements.9 A majority of these funds have been spent on specific needs and requests by individual ICs for their spaces. Each year, specific capital projects are presented to the NIH Office of the Director and to the department-level (HHS) entities concerned with facilities and finance for consideration for approval and funding through Facility Project Approval Agreements.
The FY 2012 Omnibus Appropriation Act, Section 216, changed the ceiling on the amount of funds appropriated to the ICs that could be used for alteration, repair, or improvement of facilities to $45,000,000, not to exceed $3,500,000 per project. From 2012 to 2018, ORF spent an average of $37.2 million per year of IC funds on repairs and improvements.10 NIH describes the potential uses of such funds “that count against the ceiling” as follows:
___________________
6 D. Cushing, NIH Office of Research Facilities, “Capital Projects on Deck, Shovel Ready & Emerging,” presentation to the committee, March 20, 2018.
7 D. Cushing, NIH Office of Research Facilities, “Annual Budgets: Buildings and Facilities Maintenance and Process,” presentation to the committee, March 20, 2018.
8 Fiscal Year Consolidated Appropriations Act (Pub. Law 110-161), Division G, Section 223.
9 Stephanie Hixson, NIH Office of Research Facilities, communication to Martin Offutt, National Academies of Sciences, Engineering, and Medicine, February 8, 2019.
10 Ibid.
- Renovations to all office, laboratory, clinical, animal, research, or support space that involve new drywall or masonry partitions, installed doors, ceilings, lighting, and permanent flooring or the reconfiguration of such;
- Alterations that change the use or function of existing program space (i.e., office-to-lab, lab-to-office, lab-to-animal room, etc.);
- Infrastructure repair work that is directly impacted by IC renovations or alterations; and
- Architect and Engineer design and inspection costs.
Examples of project-related costs that do not count against the $3.5 million ceiling include the following:
- Pre-project planning and pre-design studies (studies and Program of Requirements)
- Fee for Service work
- Furniture or furnishings
- Carpet and window coverings
- Casework and counter tops
- Special purpose equipment such as IC scientific instrumentation, CT scanners and work directly incident to such.11
Congress authorized use of the NEF for capital acquisitions related to information technology (IT) and facilities infrastructure. ORF has explored and requested the use of NEF for the past 4 years with success in FY 2015 ($10 million), FY 2016 ($162 million), and FY 2017 ($52 million), as illustrated in Figure 4.5. No funds were made available in FY 2018.
___________________
11 NIH Office of Research Facilities, “Funding and Budget for Construction, Alterations and Renovations,” March 30, https://www.orf.od.nih.gov/Construction/Funding/Pages/default.aspx.
TABLE 4.7 NIH-Bethesda Facilities Maintenance Budget Fiscal Year 2017
| 2017 ($) | 2018 ($) | |
|---|---|---|
| Operations | 60,344,439 | 71,732,713 |
| Maintenance | 45,295,927 | 42,105,421 |
| Total | 105,640,366 | 113,838,134 |
SOURCE: Stephanie Hixson, NIH Office of Research Facilities, communication to Martin Offutt, National Academies of Sciences, Engineering, and Medicine, May 9, 2019.
The Division of Facilities, Operations, and Maintenance (DFOM) is responsible for the safe, efficient, and effective operation and maintenance of NIH real property. The annual budget originates from the ICs’ appropriated funds in the following manner: ICs are charged rent based on the NASF plus common areas for laboratory space ($42 per square foot [/SF]), administrative space ($22/SF), and animal facility ($34.61/SF). These funds are used to fund the ORF operating budget, which includes facilities maintenance. The FY 2017 DFOM annual budget (Table 4.7) was $105.6 million for general operations and maintenance, minor repairs and replace in kind (not to exceed $75,000 each), and maintenance service contracts (there are approximately 70 such contracts for janitorial, elevators, building automation, grounds maintenance, emergency generators, air balancing, and other services including labor and materials). For FY 2018, the operation and maintenance obligations for Maryland campuses were respectively $71.7 million and $42.1 million, for a total of $113.8 million.12 Operations would include, for example, operation of Central Utility Plant; grounds maintenance, including snow removal; and custodial services.
Facility managers for each building manage the day-to-day work associated with operating a building. Branch chiefs are responsible for service areas such as Building 10, the remaining Bethesda Campus, other Maryland campuses (e.g., Bayside in Baltimore) and those in Research Triangle Park (NIEHS) and Rocky Mountain Laboratory (NIAID). A Project Contract Team can do specific project work if the project is valued under $75,000 or in emergencies. DFOM can do in-house engineering design for work that requires a quick turnaround such as during emergencies. All other work requiring engineering that is nonemergency and over $75,000 must be transferred to Design and Construction for B&F funding.
Project Dashboard
NIH shared its project needs in a document titled “400 Project Dashboard,”13 outlining projects for maintenance and repair. This list includes 440 lines of project descriptions and estimates of cost, and it categorizes the projects in a number of ways. The list is generated by the staff who are responsible for the maintenance and upkeep of the facilities and in some cases the design and construction planning team (see Table 4.8).
The committee determined that a number of the categories in Table 4.8 would fall under the heading of “long-term infrastructure” because they are building-agnostic and address campus-wide improvements. If one subtracts the estimates for new buildings ($1.7 billion) and off-site campuses ($209 million) from the total of $3.082 billion, the remaining balance ($1.2 billion) approximates the BMAR values ($1.3 billion) discussed above—an equivalence that further validates the need for this level of investment to sustain these facilities.
___________________
12 Stephanie Hixson, NIH Office of Research Facilities, communication to Martin Offutt, National Academies of Sciences, Engineering, and Medicine, February 15, 2019.
13 NIH Office of Research Facilities, “400 Project Dashboard,” via e-mail, August 24, 2018.
TABLE 4.8 Project Dashboard (Excerpt)
| Line | Description | Estimate ($000,000) | Attributable to Long-Term Infrastructure |
|---|---|---|---|
| 2-85 | Architectural, roof, elevator | 115 | |
| 86-126 | Central utility plant | 162 | 162 |
| 127-171 | Electrical distribution systems | 310 | 310 |
| 173-183 | Environmental/demolition | 15 | 15 |
| 184-203, 344 | Fire protection | 59 | |
| 204-225 | Garage roads and horizontal infrastructure | 111 | 110 |
| 226-234 | New buildings | 1,730 | |
| 235-280 | Institute-specific enhancements | 124 | |
| 172, 281-284 | Misc./emergencies/consultancies | 40 | 40 |
| 285-343 | Mechanical/comfort systems | 157 | |
| 345-408 | Off-site campus facility needs | 209 | |
| 409-421 | Security | 29 | 29 |
| 422-436 | Site needs | 24 | 24 |
| Total | 3,085 | 690 |
As noted, a number of these categories are campus infrastructure and essentially building-agnostic. These categories comprise systems (labeled above as long-term infrastructure) that are needed both to sustain the existing facilities and to support any future campus facilities. Should these systems not get the attention that they need, then the current facilities will not be supported regardless of their individual condition. The committee believes that these systems and the approximately $700 million in repairs and improvements associated with them in Table 4.8 must be addressed. The remaining $600 million in BMAR represents specific systems in specific buildings. The committee believes these also need to be addressed but should be considered in light of the comprehensive Master Plan and its approval. As each building’s future designation is determined, the associated BMAR should be funded to support that designation. For example, the Combined Utility Plant on the Bethesda Campus has completed many upgrade projects in recent years to make the plant more efficient and sustainable. These upgrades generated cost savings and have increased the reliability of generation systems. In 2013, a dedicated “Utility Distribution Branch” was created to focus explicitly on the utility distribution systems. Recent upgrades include major power, steam, and condensate distribution lines and new walkable utility distribution tunnels. In addition, this branch has instituted Geographic Information System tracking of utility assets and nondestructive testing (such as infrared or ultrasonic testing) to detect leaks.14 Based on the age and condition of those distribution systems, the committee believes it is imperative that NIH continue to focus funding on those projects to realize the efficiencies and reliability of the Central Utility Plant.
Many of these estimates have been included in previous Master Plan projects but on a piecemeal basis to support the individual needs of each requested facility. This scattershot method of separate requests leads to inefficiency in planning, procurement, and implementation. For example, decoupling the funding and ability to implement the infrastructure projects as a systematic restoration/upgrade program from individual Master Plan projects can improve current levels of service and sustainability, while simplifying the planning and implementation of system upgrades. These infrastructure projects can be implemented faster than the more complicated development of individual laboratory and support structures because they can be designed and procured in advance of specific building projects. By procuring these systems independently,
___________________
14 NIH, “Central Utility Plant Distribution System: Past-Present-Future,” presentation to the committee, March 20, 2018.
a more appropriate procurement can be developed to utilize utility contractors rather than facility specialist contractors.
FINDINGS AND RECOMMENDATIONS
Finding: The physical deterioration of the NIH Bethesda Campus facilities has outpaced the available resources and needs significant investment.
Finding: The “400 Project Dashboard” substantiates the calculation of the BMAR at approximately $1.3 billion. The committee believes these needs to be real and necessary to sustain current infrastructure and facility use. Approximately $700 million worth of projects are campus infrastructure and essentially building-agnostic. These categories comprise systems needed both to sustain the existing facilities and to support any future campus facilities.
Finding: The funding made available for facilities in the last 20 years (Figure 4.1) indicates that the repair and maintenance of the facilities competes with other facility needs each year, as can be seen by the variation in the amount of such funds devoted to construction. Without sufficient dedicated resources for repair and maintenance, the backlog of such needs will continue to grow.
Finding: The “400 Project Dashboard” indicates many specific needs organized by building or utility system. However, it is not organized in such a way as to prevent or minimize facility disruption or safety violations, or disruption of ongoing research—all of which impact mission dependency. Adoption of such a framework could support the prioritization of funds for maintenance and repair in light of other competitive facility needs.
Recommendation 4.1: The currently identified $1.3 billion in the Backlog of Maintenance and Repair (BMAR) should be funded in two tranches. First, fund the entire long-term infrastructure improvements totaling approximately $700 million over a specific time period (e.g., 5 years) so that a comprehensive plan can be undertaken to support the ongoing research activities and begin preparation and support for any future Master Plan improvements. (The full title is “2013 Comprehensive Master Plan—Bethesda Campus.”) Second, the remaining $600 million needs to be considered for each building in light of its future as defined in the approved Master Plan.
Recommendation 4.2: The Buildings and Facilities account, or other account, should have an annual dedicated investment amount—determined by considering the amount of Backlog of Maintenance and Repair (BMAR), building condition index, and historical levels of spending—for reduction or elimination of BMAR that can be used only for this purpose.
Recommendation 4.3: NIH should adopt and implement a Deferred Maintenance and Repair program focused on building and utility system condition data that will minimize or eliminate specific failures that are disruptive to mission accomplishment and to reduce Backlog of Maintenance and Repair while attaining the building Condition Index (CI) target stated in the Master Plan. The methods that the committee recommends for capital planning prioritization—that is, incorporating CI and mission dependency—can be adapted for this purpose.


