
3
USGS Laboratories
The committee’s first tasks were to provide an overview of all U.S. Geological Survey (USGS) analytical laboratories (Task 1), their analytical and data management procedures (Task 2), and the extent to which resources are available to meet their science and applications objectives (Task 3). Before 2016, the USGS did not have a complete inventory of its laboratories and their capabilities. Consequently, the agency issued two data calls to its employees: one on basic laboratory information (e.g., budget, staff, users, scientific objectives, and analysis capabilities) and one on the quantity of data produced and quality assurance and quality control procedures. In responding to the questionnaires, laboratory managers and principal investigators defined their own laboratory boundaries, with some grouping similar activities into a single laboratory, and some splitting similar activities into more than one laboratory. This exercise yielded 257 analytical laboratories. Some of these laboratories were inactive at the time, so the total number is an approximation.
The USGS provided a redacted version of the laboratory responses to the two data calls (USGS, 2016, unpublished laboratory inventory) to the committee to address Task 1. However, the questionnaires do not lend themselves to quantitative analysis. For example, some questions allow multiple answers (e.g., mission areas served), and some answers encompass multiple variables (e.g., regulators and resource managers are grouped together, and fee for service can include external payments and USGS staff reimbursements). Some answers are given in broad ranges (e.g., budget ranges and data recorded rates), and others are given in relative terms (e.g., high, medium, low, or none user categories). Finally, some questions, particularly those related to quality assurance practices, were sometimes answered inconsistently or not at all. For example, some laboratories reported having a quality management system (QMS), but were missing essential elements (e.g., documentation and independent monitoring for quality assurance; see Chapter 2). Such misunderstandings are not surprising, given that QMS is a relatively new concept in research organizations. With the subsequent QMS rollout, many laboratories now know more about QMS and some have even implemented the system. Despite these limitations, the USGS 2016 laboratory inventory provided invaluable information to broadly characterize the USGS laboratories.
This chapter provides an overview of the USGS laboratories, based on the USGS 2016 laboratory inventory provided to the committee, and summarizes insights on 17 laboratories, based on committee observations at site visits and additional data provided by the USGS.
OVERVIEW OF USGS LABORATORIES
The USGS 2016 laboratory inventory shows that the USGS laboratories are distributed throughout the United States (Figure 3.1), with the largest clusters near USGS headquarters (Reston) and other major USGS offices (Denver and Menlo Park). Some laboratories are focused on a mission area (e.g., Environmental Behavior of Mineral Deposits), although most laboratories support multiple mission areas. Other laboratories are focused on a region (e.g., Grand Canyon Monitoring and Research Center Sediment Lab) or a measurement technique (e.g., Stable Isotope Laboratory).
Most laboratories have multiple sources of funding—such as the USGS, other federal agencies, or user fees—and they may also trade analyses for other services. Similarly, most
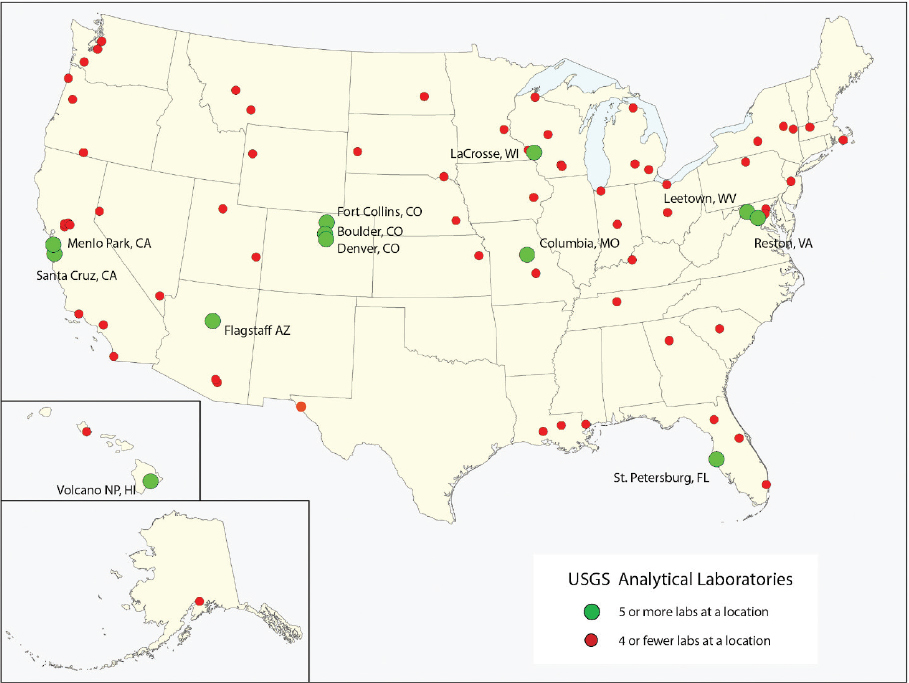
SOURCE: USGS.
laboratories serve multiple types of users, including scientists (USGS, other federal agencies, and academic), regulators and resource managers (federal, state, and local), and private companies. A few serve only USGS scientists.
All of the laboratories support research and nearly half also supply analytical data to external users. The laboratories focused primarily on supporting research are generally small (two or three full-time equivalents [FTEs] on average), have low annual budgets (typically $0.2 million or less), and primarily serve USGS scientists and secondarily scientists in other federal agencies and academic institutions. In addition to carrying out analyses, some of these laboratories develop methods to study processes (e.g., fate and transport of organic contaminants), detect quantities of interest (e.g., microbes in water or fish disease), or improve the speed and accuracy of measurements (e.g., hydraulic conductivity).
In contrast, laboratories that serve federal and state regulators and resource managers and commercial users in addition to scientists generally have more staff (seven FTEs on average) and larger annual budgets (typically two to four times higher) than laboratories primarily supporting research. The largest USGS laboratory—the National Water Quality Laboratory—has 134 FTEs and an annual budget of $6 million or more (Table 3.1). Three-quarters of its work focuses on providing sample analyses and specialized services to its customers. Private companies use data from a handful of USGS laboratories, particularly those focused on remote sensing and earthquake science and engineering. Regulators and resource managers tend to use data from laboratories focused on other subject areas.
Before 2016, the data quality practices of USGS laboratories were largely determined by the laboratory principal investigators, as is generally the case in academic laboratories. Such practices are designed to meet the quality assurance and quality control needs of a laboratory, given its scientific objectives and user needs. All of the laboratories focused primarily on supporting research had at least some written quality assurance and quality control procedures (e.g., standard operating procedures and analysis of duplicate samples, standards, and blanks), and some had developed relatively comprehensive and documented approaches to data quality assurance. Sixteen of the laboratories primarily supporting research reported having a QMS, but committee visits to two of them showed otherwise, suggesting that the QMS concept was not well understood. One of these had many QMS elements in place, but the other was far from implementing a QMS (e.g., only one standard operating procedure had been developed).
Regulators and commercial users often have defined quality standards, and so laboratories that do production work often have more rigorous and documented data quality assurance and quality control procedures than laboratories focused primarily on research. Before 2016, some USGS laboratories with production activities even had a fully implemented QMS. These laboratories had a better understanding of QMS. The committee visited three laboratories with production work that stated they had a QMS in place and found that two had a QMS and one was just beginning to implement one.
TABLE 3.1 USGS Laboratories Visited by the Committee (from USGS)a
| Laboratory Name | Budget | FTEs | Usersb | Average Annual Sample Throughput 2013–2017c | QMS Statusd | Science Applications |
|---|---|---|---|---|---|---|
| June 2018, Reston | ||||||
| Energy Environmental Labs | $0.6M to $2M | 4 | Scientists, regulators, commercial | 3,000 | Implemented | Chemical, microbiological, and toxicological studies to support studies on energy resources, environment, ecosystems, and human health |
| Environmental Organic Geochemistry Lab (inactive) | NA | 2 | Scientists, regulators | 146 | Not applicable | Transport and fate of organic pollutants in the environment, and development of tracers and new methods |
| Microbiology Lab | $0.3M to $0.5M | 2 | Scientists, regulators, commercial | 3,500 | Not started | Microbiological, biogeochemical, and hydrological analyses to understand interactions between microbes and their environment |
| Reston Stable Isotope Lab | $0.6M to $2M | 8.5 | Primarily scientists | 12,600 | Not started | Development of new stable isotope techniques and reference materials, and measurement of light element isotopic compositions |
| Wetland Ecosystems Ecology and Biogeochemistry Laboratory | $0.3M to $0.5M | 7 | Scientists | 2,500 | Not started | Biogeochemical analyses to understand material transport in watersheds, coastal and estuarine processes, and wetland management |
| August 2018, Denver | ||||||
| Analytical Chemistry Project | $0.6M to $2M | 10 | Scientists, regulators, commercial | 12,000 | In progress | Analyses of bulk solid chemistry, mineralogy, or physical properties, and chemical analysis of inorganic or biological media |
| Gas Chromatography/Mass Spectrometry | $0.2M or less | 1 | Scientists | 4,500 | Implemented | Gas chromatograms to better understand the origin, maturity, and secondary alteration of petroleum system components |
| National Water Quality Laboratory | $6M or more | 134 | Scientists, regulators | 33,908 | Implemented | Environmental analytical chemistry in water, sediment, and tissue to support national assessments and trend analysis |
| Plasma Laboratory | $0.6M to $2M | 5 | Primarily scientists | 125 | In progress | Analyses of radiogenic and heavy stable isotopes in geological, biological, and hydrological materials |
| Radiogenic Isotope Laboratory | $0.6M to $2M | 10 | Primarily scientists | 1,500 | Not started | Radiogenic isotopic analyses to support geochronology and tracer studies in rock, mineral, soil, water, and biological materials |
| Spectroscopy Laboratory | $0.6M to $2M | 3 | Scientists | 200–600 | In progress | Spectral measurement of samples, ultraviolet to far infrared, to support spectroscopic and remote sensing research |
| November 2018, Menlo Park | ||||||
| Benthic Lab | $0.3M to $0.5M | 3 | Scientists, regulators, commercial | 650 | Not started | Analysis of benthic samples to help characterize the benthic community of San Francisco Bay |
| Rock Physics Laboratory | $0.3M to $0.5M | 5 | Scientists, regulators, commercial | ~60 | Not started | Determination of physical, mechanical, and chemical properties of rocks and fault zone materials at elevated temperature and pressure |
| Tephrochronology Project Laboratory | $0.3M to $0.5M | 3 | Scientists | 83 | Not started | Geochemical analysis of volcanic glass shards to determine provenance, date geologic events, and support geologic reconstructions |
| Unsaturated Zone Flow Processes Lab | $0.2M or less | 3 | Scientists | NA | Not started | Geochemical analysis to study aquifer recharge, contaminant transport, slope stability, preferential flow, and ecohydrology |
| Laboratory Name | Budget | FTEs | Usersb | Average Annual Sample Throughput 2013–2017c | QMS Statusd | Science Applications |
|---|---|---|---|---|---|---|
| February 2019, Kearneysville | ||||||
| Fish Health Laboratory—Fish Culture and Pathology | $0.2M or less | 8 | Scientists, regulators | 400 | Not started | Aquatic animal disease diagnosis, monitoring, and research investigations |
| Functional Genomic, Biomarker, and Environmental Contaminant Bioanalysis | $0.6M to $2M | 6 | Scientists, regulators | 400 | Not started | Development and application of molecular, protein, and cellular analytical approaches to evaluate fish health |
a Data from USGS 2016 laboratory inventory, except the annual sample throughput, which was collected by USGS in 2018 and 2019 for the committee site visits.
b Regulators is short hand for federal, state, or local government regulators or resource managers.
c The nature of sample analysis varies widely among laboratories, and thus sample throughput does not necessarily reflect laboratory productivity.
d Laboratory reported status of USGS-defined QMS implementation on the date of the site visit.
INSIGHTS FROM VISITS TO USGS LABORATORIES
The committee visited 17 USGS laboratories, including one inactive laboratory. The laboratories were chosen to cover different budgets and staff levels, mission areas, stages in implementing the QMS, and types of laboratory activities (Table 3.1).
Although the site visits offered an opportunity to spot-check the USGS 2016 laboratory inventory, they were intended to learn about the day-to-day operations of the laboratories, their opportunities for advancing knowledge, and the challenges they face. The conversations covered sample flow, quality assurance and quality control practices, adequacy of resources, and accomplishments and concerns. Some common themes that emerged from those conversations are summarized below, and information collected by the USGS in 2018 and 2019 for the site visits is presented in Table 3.2.
The committee met with a principal investigator and/or laboratory manager at each laboratory and also talked with analysts working in the laboratory. The laboratory staff were welcoming and candid with the committee. In all the laboratories visited, the staff were excited to share their work, were skilled in what they do, and took pride in their science, their reputation, and the societal impact of their work. Many of the laboratories had been operating for more than 40 years (Table 3.2), sometimes in different guises, pointing to their ongoing usefulness. Most of the laboratories had state-of-the-art instruments as well as older equipment purchased over their long history. The committee was impressed with the laboratory capabilities and staff.
The staff expressed some concerns about the day-to-day operations of their laboratories. Many staff believed their laboratory is under-resourced, with a shrinking workforce and a limited ability to hire permanent staff. Laboratory information management systems—which are used to efficiently manage samples, data, and workflows—are expensive, and so most laboratories visited are using Excel spreadsheets to manage data. Retirements and the shift toward short-term contractors increase turnover and adversely affects institutional memory and training. In the water mission area, reporting lines are shifting, further complicating staffing issues. A few laboratories suffer from problems associated with aging infrastructure, such as leaking pipes that threaten equipment and samples.
Laboratory staff understood the importance of their results being accurate and reproducible, and they had generally put in place some standard operating procedures and quality assurance and quality control measures. In all of the laboratories visited, the vast majority of standard operating procedures described technical methods (Table 3.2). The National Water Quality Laboratory also had a substantial number of standard operating procedures for laboratory management. Quality assurance and quality control measures varied widely in comprehensiveness across laboratories, and some staff recognized the need to strengthen their procedures.
Some staff in laboratories that had implemented the QMS found that it improved their data quality practices. This observation dovetails with laboratory comments made during
TABLE 3.2 Data Collected in 2018 and 2019 for Committee Laboratory Visits (from USGS)
| Laboratory Name | Age (years) | QMS Statusa | Standard Operating Procedures | |
|---|---|---|---|---|
| Numbera | Type(s)b | |||
| Energy Environmental Labs | 28 | Implemented | 10 | 9 technical methods and 1 laboratory management |
| Environmental Organic Geochemistry Lab (inactive) | 29 | Not applicable | 38 | 34 technical methods, 1 equipment management, and 3 laboratory management |
| Microbiology Lab | 34 | Not started | 44 | 40 technical methods, 1 equipment management, and 3 laboratory management |
| Reston Stable Isotope Lab | 40 | Not started | 28 | 21 technical methods, 6 equipment management, and 1 laboratory management |
| Wetland Ecosystems Ecology and Biogeochemistry Laboratory | 16 | Not started | 33 | 33 technical methods |
| Analytical Chemistry Project | 22 | In progress | 15 | 14 technical methods and 1 laboratory management covering multiple processes |
| Gas Chromatography/Mass Spectrometry | 44 | Implemented | 16 | 14 technical methods and 2 laboratory management |
| National Water Quality Laboratory | 41 | Implemented | 100 | 65 technical methods, 8 equipment management, and 27 laboratory management |
| Plasma Laboratory | 6 | In progress | 1 | 1 technical method |
| Radiogenic Isotope Laboratory | 60 years; current form since 2016 | Not started | 4 | 4 technical methods |
| Spectroscopy Laboratory | 45 | In progress | 4 | 3 technical methods and 1 laboratory management |
| Benthic Lab | 43 | Not started | 2 | 1 technical method covering multiple processes and 1 laboratory management covering multiple processes |
| Rock Physics Laboratory | 49 | Not started | 0 | |
| Tephrochronology Project Laboratory | 45 | Not started | 6 | 1 technical method and 5 laboratory management |
| Laboratory Name | Age (years) | QMS Statusa | Standard Operating Procedures | |
|---|---|---|---|---|
| Numbera | Type(s)b | |||
| Unsaturated Zone Flow Processes Lab | 50 | Not started | 1 | 5 technical methods |
| Fish Health Laboratory—Fish Culture and Pathology | 40 | Not started | 2 | 2 laboratory management |
| Functional Genomics, Biomarker and Environmental Contaminant Bioanalysis | 40 | Not started | 24 | 24 technical methods |
a As of the site visit date.
b Committee interpretation from the titles of the standard operating procedures.
an external audit of QMS implementation in the Energy Resources Program (Meeks et al., 2018). Many of those laboratories found that the QMS process and documentation corroborated data quality.
In contrast, the committee found that laboratories that had not yet begun implementing the USGS QMS had a poor understanding of what was involved. Most laboratory staff expressed a willingness to adopt additional quality assurance procedures in their laboratories if it would improve the defensibility and transparency of their work. However, there was considerable hesitation about whether the USGS QMS would achieve this objective, and fear that it would create unnecessary burdens on their laboratory, detracting from valuable time and limited resources for research activities. In addition, the staff were concerned that the USGS would adopt a “one-size-fits-all” approach to a QMS that would not meet the needs of their laboratory, despite the stated purpose of accommodating the diverse research needs and user profiles of individual laboratories. Such concerns arose because (a) few laboratory staff were involved in QMS development and implementation, and (b) their laboratory has few similarities with the National Water Quality Laboratory (the primary model for the USGS QMS).
A common theme among the 17 laboratory visits was staff dissatisfaction and frustration regarding the USGS QMS implementation process thus far. The primary sources of dissatisfaction included the following:
- Short implementation timeline. USGS staff in the Energy and Minerals Mission Area were expected to learn new procedures and implement the QMS in their laboratory in only about 1 year. Staff believed that meeting such a short timeline was unrealistic and would pull them away from their already demanding schedules.
- Inadequate resources and training to effectively adopt new requirements. No monetary resources are being provided to the laboratories for QMS implementation, stretching
-
already tight budgets and staff time. In addition, laboratory staff implementing the QMS noted that it took weeks or even months to have their standard operating procedures reviewed, and that the reviewers often did not have subject matter expertise, requiring iteration between laboratory staff and reviewers. Many staff scientists wanted QMS training opportunities, frequent access to a quality assurance expert, and discussions with laboratories developing similar standard operating procedures during the implementation phase. Although the USGS plans to hire more QMS personnel (see Figure 1.3), they will not be in place quickly enough to meet the QMS rollout timeline.1
- Ineffective communication from the USGS leadership. Staff in laboratories that had implemented QMS or were next in line were well informed of the USGS implementation process. However, staff in other laboratories further down the rollout queue were largely unaware of the details, suggesting they are not paying attention to USGS communication efforts or that those communications efforts were unsuccessful. The more informed staff were often frustrated by what they perceived as shifting plans, deadlines, and expectations for adopting QMS requirements. For example, a few staff mentioned receiving different instructions at different USGS information sessions over the course of a week. Staff attributed some of these communication problems to inadequate QMS staffing, the rapid rollout, and the sense that the USGS was making up the process as they went along, analogous to “building the plane while it is rolling down the runway.”
These three concerns were also highlighted in the external audit of Energy Research Program laboratories, which made recommendations for resolving them (Meeks et al., 2018; see Chapter 4).
SUMMARY AND ANSWERS TO TASKS 1, 2, AND 3
The committee’s first tasks were to provide an overview of all USGS analytical laboratories (Task 1), their data quality assurance and quality control procedures (Task 2), and the extent to which resources are available to meet their science and applications objectives (Task 3). These tasks are related and are discussed together below.
The approximately 250 USGS analytical laboratories are diverse in their science and applications objectives, budget, staff and user profiles, and sample throughput. Collectively, their science and applications objectives cover all USGS mission and core science areas. All of the laboratories support USGS researchers, and about half also support the needs of federal, state, and local regulators and resource managers. The laboratories primarily supporting
___________________
1 The language of this sentence was modified after release of the publication version to reflect current USGS staffing plans.
research have fewer staff, lower budgets, and fewer and less documented quality assurance and quality control practices than the laboratories that also serve regulators and research managers. Sample throughput depends on the type of sample being analyzed and the analytical procedures being performed, and ranged from 60 samples per year to 33,000 samples per year for the laboratories visited by the committee.
Before the USGS QMS rollout began, most of its laboratories operated like academic research laboratories, with principal investigators obtaining funding and establishing quality assurance and quality control practices. Although laboratory staff recognize that more formal and comprehensive practices may have benefits, many are concerned that the USGS QMS will not meet their specific needs and that QMS implementation is moving too fast with inadequate staff, resources, and communication to roll it out properly.
The laboratories the committee visited are mostly long lived (decades) and had state-of-the-art instruments as well as older equipment purchased over their long history. The laboratories appeared to be meeting their science and applications objectives. However, staffing shortfalls and turnover were a common resource problem. Adding responsibilities for implementing a complex QMS, especially without adding sufficient resources, may hinder their future ability to meet their science goals.


