

The breadth of the possibilities stemming from the translation of biological knowledge into meaningful applications is substantial. This chapter reviews the resources that the United States devotes to investments in this space and considers how one might measure the bioeconomy and assess its economic contributions to the larger U.S. economy. The chapter begins by characterizing the bioeconomy for economic analysis by examining the elements that set it apart from other sectors and reviewing the divergent approaches used to study the bioeconomy. It then addresses how to measure the bioeconomy by identifying approaches to valuing the bioeconomy and intangible assets, ultimately delineating a path forward.
Several factors make it difficult to measure the contribution of the bioeconomy to the overall economy: (1) definitions of the bioeconomy vary substantially; (2) the bioeconomy is tied to both basic science and its commercialization (innovation), suggesting that a broad range of activities is relevant to assessing the value of the bioeconomy; and (3) data on the bioeconomy have substantial gaps. Furthermore, it is difficult to define the economic boundaries of the bioeconomy, both because there are reasonably different ways to conceptualize the bioeconomy (see the discussion in Chapter 2) and because data identifying aspects of the bioeconomy are difficult to capture (e.g., identifying the fraction of a manufactured chemical that is produced through a biosynthetic pathway; see Chapter 2).
Concepts used to value the bioeconomy present additional challenges. Social welfare analysis, which attempts to quantify benefits to producers (e.g., economic rents1) and consumers (e.g., based on the difference between willingness to pay and price), is a particularly demanding approach to computing value and not ideal for valuing a sector as diffuse and challenging to measure as the bioeconomy. One could instead value the bioeconomy as the sum of the private values or value added of all
___________________
1 The extra amount earned by a resource (e.g., land, capital, or labor) by virtue of its present use.
firms active in the sector, thus revealing the contribution of their production to overall gross domestic product (GDP).2 In practice, however, even this approach is difficult to implement, as many of the firms that operate in this sector are diversified (e.g., Dow Chemical), and it is not possible to determine which fraction of total firm value is attributable to the bioeconomic aspects of such firms. In addition, many firms are privately owned (i.e., they are not public corporations), and their market value cannot be observed. Furthermore, focusing on private values where available (e.g., the sum of firm market values) excludes the considerable value of public-sector investments in university research and development (R&D) that supports the bioeconomy. For example, such an approach would exclude important public values associated with the bioeconomy, such as the potential benefits associated with a reduction in petroleum-based production.
Individual willingness to pay versus price issues aside, economic estimates of the value of the bioeconomy are limited in that they may not appreciate the full social value of its contributions. For example, if gasoline sales are replaced by an equal amount of biofuel sales, the two could show up in GDP calculations as equivalent, thus failing to capture the long-term environmental value to society.
CHARACTERIZING THE BIOECONOMY FOR ECONOMIC ANALYSIS
What Sets the Sector Apart?
One of the things that sets the bioeconomy apart is that it is not a discrete economic sector3 like the production of automobiles or ketchup. As a result, no single approach or set of indictors provides a complete picture of the bioeconomy. Instead, the bioeconomy consists of a collection of products and services whose production is enabled by a set of related technologies (as delineated in the committee’s definition and described in the landscape in Chapter 2) and that yields both inputs to and products
___________________
2 GDP is a broad measure of a nation’s overall economic activity. It may be viewed as the sum of gross value added (GVA) production across all sectors in the economy. Alternatively, it may be viewed as the value of all finished goods and services produced within a country’s borders. In practice, there also are reconciling items in the accounting and issues regarding the prices that are used when summing value added across industries versus summing all final expenditures; for more detailed definitions, see https://www.bea.gov/help/glossary?title_1=All&title=GDP or https://stats.oecd.org/glossary/detail.asp?ID=1163.
3 In this context, and in much of the report, the term “sector” is being used to describe a collection of activities that form part of the economy.
TABLE 3-1 Organizing Framework for Sectors and Technologies
| Sectoral Impact | |||
|---|---|---|---|
| Narrow | Broad | ||
| Applications within sector | Selective | Traditional sectors (e.g., ketchup production) | Selective yet broad impact (e.g., CRISPR; bioeconomy tools) |
| Pervasive | Sector-specific (e.g., hybridization of corn) | General-purpose technologies (e.g., electricity, information technology, artificial intelligence) | |
SOURCE: Scott Stern, Massachusetts Institute of Technology, presentation to the committee, May 2, 2019.
of a range of economic sectors. To help provide an approach for characterizing the bioeconomy as a sector for economic analysis, Table 3-1 presents a typology of economic sectors and technologies. The typology distinguishes sectors on two dimensions, one (the columns of the table) that considers the breadth of a technology’s impact across the various sectors of the economy, and a second (the rows of the table) that considers the scope of the technology’s impact within each sector it affects. The columns distinguish between technologies that have a narrow impact on a small number of sectors, such as the technologies required to make ketchup, which impact mainly ketchup manufacturing, or hybrid corn, which affect mainly agriculture, and those that have a broad impact, such as electricity, information technologies, and applications rooted in the biosciences, which affect production processes across a wide range of sectors. The rows of Table 3-1 distinguish between applications that have a selective impact within each sector and those that have a pervasive impact in the sectors they affect. Whereas the bioeconomy has a selective impact within each sector it affects—for example, it affects parts of the production processes in most of the sectors in which it operates (e.g., the design of large-molecule drugs), general-purpose technologies, such as electricity and information technologies, have a pervasive impact on all aspects of the sectors they affect.4
According to this framework, the bioeconomy is a selective yet broad sector of the economy. It is “broad” because the technologies of the bioeconomy are likely to affect a wide range of industries, including those
___________________
4 General-purpose technologies (GPTs; e.g., electricity, computers and communication technologies, artificial intelligence tools) are applicable in just about any sector of the economy. The concept of GPTs was introduced in the literature on the economics of growth by Breshnahan and Trajtenberg (1995).
associated with the production of food, fuel, and medicine, among others, but these technologies are not likely to displace all aspects of those industries. Additionally, as a result of innovation, the bioeconomy’s outputs have benefits over and above the value of the resources devoted to producing them.
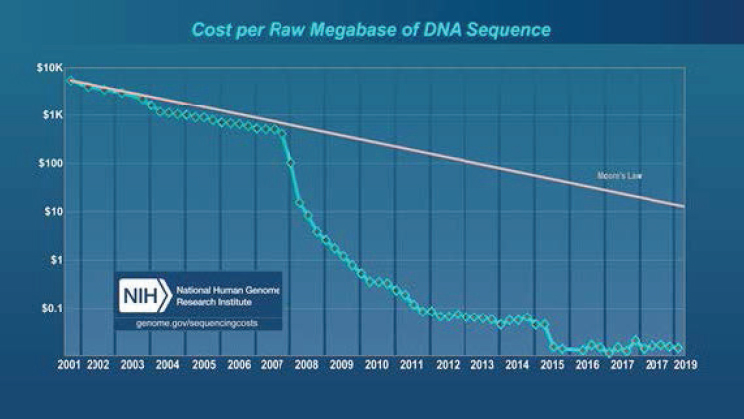
Many scientific breakthroughs associated with the bioeconomy (e.g., gene sequencing and gene editing) are sector-specific. They are “inventions in the method of invention” that create a situation in which biotechnology is a field subject to innovation in its processes (research) and a field whose conduct of research yields innovations for downstream use—that is, for consumers or other industries. The sector’s upstream research inventions have been complemented by advances in computing and data analytic technologies that have led to, for example, dramatic declines in the cost of gene sequencing (see Figure 3-1, which shows that costs are declining faster than the rate at which Moore’s Law predicted cost decreases in electronics) and shorter experimentation times in genomic research.
In budgets, however, personnel and other indirect costs typically loom many times larger than capital operating costs, suggesting that total upstream R&D costs may not be lower than they once were. The Biomedical Research and Development Price Index, which was developed by the Bureau of Economic Analysis (BEA) for the National Institutes of Health (NIH) to annually capture current personnel and materials costs, grows about 1 percent per year faster than economy-wide price measures, such as the Consumer Price Index or GDP price index.5
In part because the downstream payoffs to biotechnology are potentially large, the bioeconomy is characterized by large investments in basic and applied research that are funded by the federal government (much of this research is performed at universities or public research laboratories). Public outlays for “R&D in the life sciences” have historically been substantially larger than the outlays for other fields of science. An important function of the federal government not included in conventional R&D statistics is the cost of establishing and managing genomic and other data repositories (see below). The public availability of this information
___________________
5 See https://officeofbudget.od.nih.gov/gbipriceindexes.html for the Biomedical Research and Development Price Index, which begins in 1950 and is available through the most recent year. Note that this index is built from detailed components and captures quality change in its components in two ways (Holloway and Reeb, 1989). First, the materials costs are built from Consumer Price Indexes and producer price indexes that are designed to be quality-adjusted. Second, to the extent that wages by detailed personnel component (e.g., faculty rank and federal General Schedule and step classifications) reflect differences in employee quality (i.e., marginal productivity), they also contribute to the index’s control for quality change.
has aided the creation of new biobased products and processes for commercial gain while furthering scientific research.
Business R&D investments in the bioeconomy, particularly for the clinical trials stage of new drug development, loom large relative to R&D conducted by other industry sectors. Venture capitalists have recently geared up their investments in start-ups with an edge in synthetic biology. Although these investments are still small (and small in relation to all venture investments), this appears to be a fast-growing segment of the bioeconomy.
Two interrelated characteristics of the bioeconomy flow from the considerable size of its science base and the economic nature of its commercial applications. The first is that the applicability of a sector’s science base (measured in terms of cited research articles in patents) is “close” to its commercial innovations. That is, the sector falls in “Pasteur’s quadrant,” meaning that it can be categorized as “use-inspired basic research,” referring to the classification system for research developed by Donald Stokes (1997) (see Figure 3-2). In his work, Stokes divides research into three classes on the basis of whether the research has use considerations (purely applied research, such as that conducted by Thomas Edison) or is simply a quest for fundamental understanding (purely basic research, such as that conducted by Niels Bohr), or both (use-inspired basic research, such
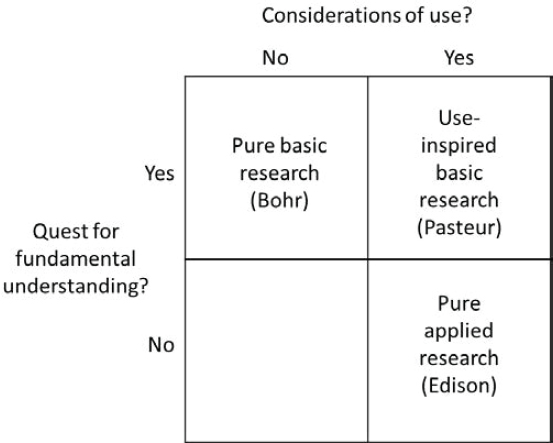
as that conducted by Louis Pasteur) (Stokes, 1997).6 This should not be surprising given the sector’s use of breakthrough research that provides new tools that further advance commercial gain.
Second, the outcomes of many investments in bioeconomy innovation are highly regulated, as their potential for manipulating human, animal, and plant genetic material is closely connected with human health and the condition of environmental ecosystems. As a result, the bioeconomy’s commercial innovation process is increasingly costly in relative terms. Firms throughout the larger economy are undergoing digital transformation in their business platforms and marketing processes, and those in sectors with containerized digital platforms7 can not only implement
___________________
6 The extent to which scientific advances support marketplace inventions is difficult to quantify, but this statement is generally consistent with theories that emphasize fruitful connections between certain types of patenting and prior scientific inquiry. Ahmadpoor and Jones (2017) devised a metric for the intellectual distance between patentable inventions and prior research to study the relationship between patents and scientific advances. The estimated distance varied by discipline, with multicellular living organisms and computer science having the shortest distance, and nanotechnology and biochemistry/molecular biology close behind (biotechnology was not identified separately).
7 A containerized digital platform is a flexible, portable platform that allows for separating out the application’s architecture into isolated environments that can be combined and organized without affecting the other elements of the application. For more information, see https://learn.g2.com/trends/containerization.
an innovation in back-end processes in nanoseconds but also conduct A/B tests on customers at little cost, regulations permitting.8 Thus, there may be a growing relative cost premium for economic competencies for many types of firms in the bioeconomy compared with nonbioeconomy firms. Economic competencies are a broad category of intangible assets that include firms’ go-to-market capabilities; see Annex 3-2 for further information on these assets.
These sector-specific aspects of the bioeconomy—its diffusion across industries, its potential for large societal benefits, its large science base and reliance on data-intensive research, the closeness of commercial innovation to a science base, and costs of commercial innovation that are fractions of large organizations’ R&D budgets—make it difficult to track the bioeconomy’s contribution to the economy and, as a result, assess its prospects for future innovation.
Official economic statistics are classified primarily by industry. This classification, as described above, is especially unhelpful for delineating much of the bioeconomy because its impact is selective within industry, and it operates across a wide array of industries. Furthermore, as noted earlier, official statistics cannot be used to translate the impact of the bioeconomy’s innovations on social welfare as a result of the shortcomings of the economic estimates reflected in official statistics.9 Finally, as spelled out in more detail below, the standard indicators used by science and innovation policy analysts do not include R&D in bioengineering and biomedical engineering in statistics on government R&D spending on life sciences or on business R&D in biotechnology; it is also likely that business investments in the building of private microbial databases are not included in biotechnology R&D.
Studies of the Bioeconomy: One Economy, Divergent Approaches
This report defines the U.S. bioeconomy as economic activity that is driven by research and innovation in the life sciences and biotechnology,
___________________
8 A/B testing is a way to compare two versions of a single variable, typically by testing a subject’s response to variant A against variant B, and determining which of the two variants is more effective. See Wikipedia, “A/B testing,” for more information (https://en.wikipedia.org/wiki/A/B_testing).
9 Although the price index was constructed by a researcher at BEA, the government agency that issues the national accounts for the United States, the work currently is not included in headline real GDP. Thus, one cannot look to official statistics on real output to “see” the welfare impacts of innovations in pharmaceuticals, although in time, BEA’s initiative to build a health care “satellite” account may prove useful in this regard. Satellite accounts are discussed later in this chapter.
and that is enabled by technological advances in engineering and in computing and information sciences (see Chapter 1). Although existing studies do not generally align with this definition, current approaches to valuing the bioeconomy tend to fall into two broad categories. Some focus on industrial activity, aiming to detect how biobased activity may be substituting for petroleum-based activity (or promoting sustainability more broadly). Identified activities typically include products for downstream industrial use (including crops). Accounting for the value created in downstream use and industry input linkages is typically an important component of these studies. The second category consists of approaches that focus on biomedical activity and entail studying how breakthroughs in the biological sciences and biotechnology feed through to innovations in the pharmaceutical, medical device, and health care industries (as a whole or in part). Studies with this focus tend to look broadly at the innovation ecosystem, inclusive of the significant research in the biological sciences conducted in government and university laboratories.
Why such different approaches? The innovation ecosystem would appear to be as important for analyzing the drivers of bioindustrial activity as it is for analyzing biomedical activity. Enabling science and technology may be featured less in the former because measured R&D spending in the relevant industries does not loom as large as it does in the biomedical industries. The go-to-market costs of biopharmaceuticals include very costly clinical trials, and these trials are counted in R&D because they involve scientific experimentation and discovery. For biotechnology companies working to develop new microbial products for industrial use, the costs of testing and obtaining approval for new commercial applications are not commonly included in R&D because while these steps do require testing and experimentation, they are not counted as part of the basic research that led to the product’s creation. It is also possible that emerging companies in the biotechnology space (including synthetic biology companies) escape the statistical net cast by R&D surveys because they are small and/or improperly sampled.10 Still another possibility is that some companies’ new-product discovery processes involve mainly modifying existing (or open-source) software tools to access microbial data. The creation and use of tools based on known methods, including the added
___________________
10 The R&D survey conducted by the U.S. Census Bureau on behalf of the U.S. National Science Foundation has traditionally collected data on firms with five or more employees. Beginning with the survey for 2017 (unlikely to be published until 2020), R&D data will be collected from businesses with one or more employees.
value due to data processing that results from using existing tools, falls outside the scope of R&D surveys.11
All of these possibilities suggest that a targeted and specialized framework for analyzing the bioeconomy’s innovation ecosystem is required—an approach that both looks broadly at investments in innovation (including investments in existing data analytic tools) and accounts for all bioeconomy-specific new product investments (e.g., improvements in the efficiency of regulatory testing). To encompass the full bioeconomy, this framework would capture data-driven innovations in health care that are intended to improve treatments (including drugs) on the basis of outcomes achieved relative to costs invested in designing the treatment. Finally, the framework would recognize that existing organizational structures do readily accommodate change, inclusive of data-driven approaches to revamping existing processes (from selection of patients for clinical trials to patient care itself). This implies recognizing that investments in new models are needed for organizations to execute data-driven plans, and that a period of time may elapse before the fruits of these changes will be seen in outcome data.12
MEASURING THE BIOECONOMY: APPROACHES FOR VALUATION AND IDENTIFICATION OF BIOECONOMY INTANGIBLE ASSETS
This section first summarizes existing approaches to studying innovation, focusing on those that attempt to place investments in knowledge, both scientific and commercial, at the center of the process. Second, in light of this discussion, the economic activities encompassed by the committee’s definition of the bioeconomy, which include knowledge production as well as the tangible final and intermediate products produced by the bioeconomy, are described. Third, existing approaches and studies addressing measurement of the industrial bioeconomy are reviewed. Fourth, a range of estimates for valuing the bioeconomy, which potentially
___________________
11 With regard to software and Internet applications, the R&D survey instructs respondents to include “only [those] activities with an element of uncertainty and that are intended to close knowledge gaps and meet scientific and technological needs” and to exclude “creation of new software based on known methods and applications.” There are no instructions regarding the processing of data.
12 This is in fact an argument made now for the case of artificial intelligence and its impact on general business productivity, but note that this topic is both frequently discussed in management consultancy newsletters and reports in the context of heath care organizations (e.g., Close et al., 2015) and widely acknowledged as a characteristic of innovation episodes (e.g., see the discussion in Brynjolfsson et al., 2018).
includes aspects of both the biomedical economy and intangible assets for the entire bioeconomy, are articulated.
Existing Approaches to Valuing the Bioeconomy
At the broadest level, the bioeconomy includes the economic activity stemming from advances in the life sciences. But while the broad scope of the bioeconomy is widely acknowledged, the bulk of academic and policy analysis has focused on biomedical activity and the impact of its innovations on human health (Hermans et al., 2007). By contrast, studies of bioindustrial activity attempt to capture the size and reach of biobased production activity (excluding biomedical activity). Whereas the previous subsections have reviewed general approaches to studying innovation, including measuring inputs to innovation, this subsection reviews approaches to measuring and valuing the agricultural and industrial bioeconomy (hereafter, referred to as industrial for the sake of brevity). Innovation outcomes in biopharma are discussed later in the chapter.
Broadly speaking, there are three approaches to measuring biobased production. Each begins by delineating the bioeconomy as a subsector of the total economy, and the most straightforward approach is to use the gross value added (GVA) of the delineated subsectors relative to total GDP (as raised earlier). A well-known study (Carlson, 2016) points out the limitations of this approach, suggesting that a delineation based on detailed products is more appropriate for the bioeconomy.
A second approach uses input-output (I-O) analysis to assess how the industry sectors included in the bioeconomy interact with other industry sectors in the broader economy.13 This analysis can be conducted at the detailed product level, where the production of a particular “commodity” is connected to other economic activities, including impacts on final demand and/or industry value added. A step in this analysis can be the estimation of GVA for a delineated set of products. Although this approach narrows the estimate for these products (GVA for manufactured products is less than half of the gross value of the products), much of the industrial bioeconomy consists of physical products or industrial materials that are distributed to customers via intermediaries (retailers, wholesalers, transporters) whose margins are included in the final price and ultimate value of economic activity generated by biobased production. This suggests that the bottom line of the GVA approach—measurement of GVA in bio-producing sectors—is a partial impact that does not account
___________________
13 I-O analysis is a form of macroeconomic analysis based on the interdependencies between economic sectors or industries.
fully for the interdependencies between industries, both backward and forward.
I-O analysis yields two levels of “multipliers” beyond the direct value of primary producer activity. These multipliers may be expressed relative to total final demand or relative to GVA of an industry. That is, the analysis calculates the effects of an extra unit of output in an industry on activity in other industries due to their interdependencies. As typically stated, the first multiplier, expressed relative to GVA of an industry, is calculated as the intermediate demand necessary to produce an additional dollar of value added for a particular type of product: it captures indirect effects via supplying industries to the industry producing the product (“backward linkages”) plus those involved in the chain that supplies the product to ultimate users (“forward linkage”). This is called a type I multiplier. The second multiplier considers induced effects of the household and other final spending that results from the sum of direct and indirect effects (a type II multiplier).14 Both multipliers rest on the assumption that inputs to an industry’s production of output follow a fixed proportional relationship; this assumption is typically viewed as not very stringent for short-run analysis.15
Popkin and Kobe (2010) studied the major sectors of the U.S. economy, calculating type I multipliers for 15 major industry sectors, and found that the type I multipliers for the manufacturing, information, and agriculture sectors were the largest, while those for finance, retail trade, and wholesale trade were the smallest. Professional services, education, and government were below the median. Many key products of the bioeconomy are in high-multiplier industries (often called “upstream” industries, such as feedstocks), whereas others are in the low-multiplier ones (R&D services), suggesting that the diffuse nature of the industrial bioeconomy lends itself to an I-O approach.
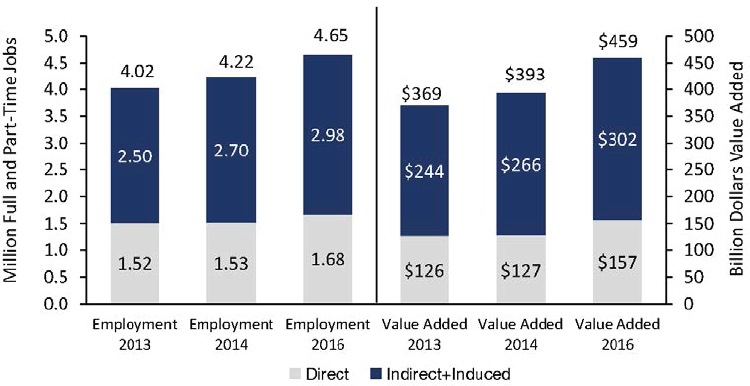
A recent study commissioned by the U.S. Department of Agriculture (USDA) (Daystar et al., 2018) entailed an I-O analysis of industries covered by USDA’s BioPreferred program. Although the components of that study included in this analysis do not align perfectly with the committee’s tech-driven bioeconomy definition (see Chapter 1), the study’s summary results reflect the potential size of the indirect and induced effects relative to the value added of important segments of the industrial bioeconomy.
___________________
14 For further information regarding I-O modeling, see Miller and Blair (2009).
15 Biobased production uses different inputs than petroleum-based production, however, and when these activities occur within the same industry, the I-O system’s data will need to be augmented to reflect the appropriate inputs to each type of production. Failing to do so is not a first-order concern for calculating impacts in value terms (i.e., in dollars of value added), but for certain questions, such as how much carbon has been saved from the shift to biobased production, the validity of the underlying I-O relationships is relevant.
All told, those results suggest that the bioeconomy has a rather large type II multiplier (see Figure 3-3). The ratio of the total effect on value added to “direct” value added in USDA’s BioPreferred industries was 2.92 in 2016. Referring to the stacked bar on the far right of Figure 3-3, the ratio of $459 to $157 is 2.92.
A third approach to valuing the U.S. bioeconomy is computable general equilibrium (CGE) analysis, which is grounded in formal economic theory.16 This approach models the functioning of an economic system as a whole and focuses on the equilibrating role of the price mechanism in multiple markets (labor, capital, product). Models are usually calibrated to suit the analysis of an aspect of economic activity (e.g., energy consumption and climate change), and rely on consensus values for “deep,” or fundamental, economic parameters (i.e., households’ discount rate or the efficiency of firms’ production processes). The models simulate economic outcomes under alternative assumptions and initial conditions. CGE models have proved fruitful in the analysis of climate change, where supplying a range of values for assumptions (e.g., for consumers’ price sensitivity to energy prices or for the substitutability of energy for other factors of production) is not unrealistic (see the use of such a model in the
___________________
16 “CGE models are simulations that combine the abstract general equilibrium structure formalized by Arrow and Debreu (1954) with realistic economic data to solve numerically for the levels of supply, demand and price that support equilibrium across a specified set of markets.” See www.rri.wvu.edu/CGECourse/Sue%20Wing.pdf and Arrow and Debreu (1954).
Fourth National Climate Assessment [USGCRP, 2018]). Some studies have analyzed the benefits to the environment of shifting to biobased industrial activity using stylized general equilibrium models (often in conjunction with results from an I-O analysis, as in Daystar et al., 2018), but these studies have tended to focus on traditionally defined sectors (e.g., all of agriculture, forestry, and wood products).
Selected studies that use these approaches are reviewed in Annex 3-1 as illustrative examples.
Identifying Intangible Assets
Existing approaches to measuring the bioeconomy need to account fully for investments in research, methods of invention, and data-driven commercial innovation. This involves recognizing that successfully developing and commercializing an innovation requires many ingredients other than scientific proof of concept. As described in Box 3-1, innovation requires market insights, data, and plans; product designs and market testing; branding; licenses; and human resources—all of which converge in business models and business processes. Spending on all of these components is included under the broad umbrella of intangible investment. Intangible investment has emerged as a key value driver in today’s knowledge economy and a key factor in competitive advantage for firms.17 A widely used framework for studying intangible investment is summarized in Annex 3-2.
The framework set out in Annex 3-2 is suitable for valuing intangible assets that are common to most companies in the U.S. economy, such as intellectual property, brand equity, software programs, and business process know-how, but two aspects of the framework require further development for in-depth analysis of the bioeconomy. The first is the fact that the public sector also creates and holds intangible assets, and it does so on behalf of society more broadly. Research on public intangibles is more limited than that on company intangibles, but the framework set out in Annex 3-2 can be adapted to the public sector.18 The second is that the adaptation of the framework in Annex 3-2 to both the bioeconomy and the public sector involves putting the spotlight on information assets, or data.
In the public context, it is necessary to account for publicly collected data that are curated and issued for public use. Such assets loom large in
___________________
17 For an accessible, recent review of this development in the context of the whole economy, see Haskel and Westlake (2017); for earlier reviews, see Corrado and Hulten (2010), NRC (2009), and OECD (2013). For developments at the firm level, see Lev (2001) and Lev and Gu (2016).
18 See Corrado et al. (2017) for a systematic review and adaptation for public-sector activities and expenditures.
many countries, and some public-use data spur economic development (as well as further research or cultural enrichment). For example, the U.S. Census Bureau’s 1991 release of the Topologically Integrated Geographic Encoding and Referencing dataset is commonly credited with bootstrapping the nation’s industries that develop, make, and use products based on geospatial data. Similarly, the public release of data from the National Aeronautics and Space Administration’s Landsat satellite mapping program had a documented positive impact on the productivity of gold exploration projects (Nagaraj, 2018).
Although there is no one-to-one correspondence between the users of public biological data and particular industries of the U.S. economy, it is generally agreed that public biological data, especially digital data containing genomic sequences (digital sequence information, or DSI), have spurred commercial biotechnology-based economic activity.
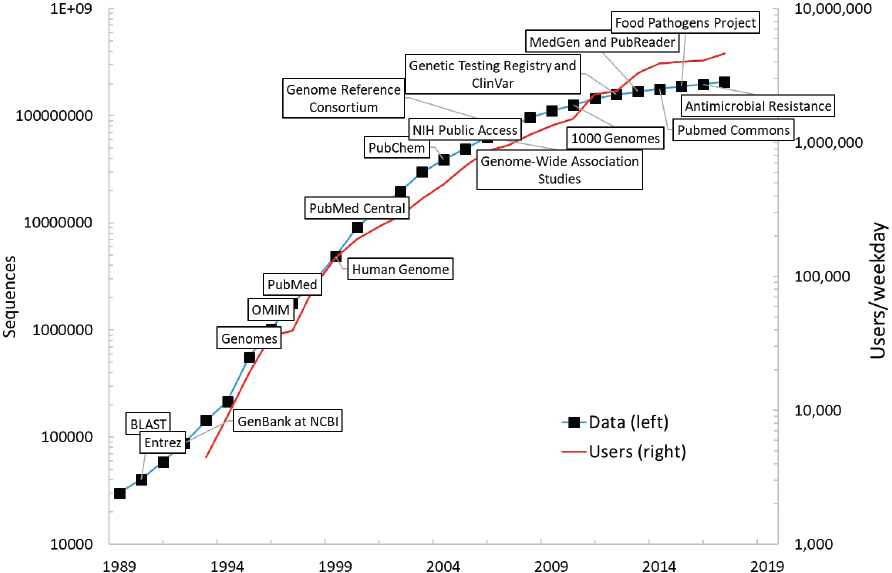
Consider the GenBank sequence database, an open-access, annotated collection of all publicly available nucleotide sequences and their protein translations. This database and certain software used to access it are produced and maintained by the National Center for Biotechnology Information (NCBI), a division of the National Library of Medicine (NLM).19 Since GenBank’s inception at NCBI in 1992, use of the database and the number of sequences (i.e., data) it contains have grown at a very rapid rate (see Figure 3-4). This suggests that public data inputs have significant value for biomedical and bioindustrial scientific analysis.20 If biological data assets are important inputs to further scientific and commercial advances, the beneficial impacts of open biological data will both spill over to productivity in the business economy (via new industrial and consumer biotechnology products) and generate benefits to human health via improved treatments for certain diseases (as discussed in detail in Chapter 6).
NIH reports that by 2016, the Human Genome Project had contributed to the discovery of more than 1,800 disease genes.21 Taking advantage of
___________________
19 NCBI is part of the International Nucleotide Sequence Database Collaboration, a joint effort to collect and disseminate genomic databases. The collaboration involves computerized databases in Japan and Europe (the DNA Data Bank of Japan and the European Nucleotide Archive in the United Kingdom); data submissions are exchanged daily among the collaborators.
20 NIH supports many open-data repositories, including ClinicalTrials.gov, the world’s largest publicly accessible database for exploring clinical research studies conducted in the United States and abroad. This database provides researchers and health care professionals—as well as the general public and patients and their family members—with easy access to information on clinical studies on a wide range of diseases and conditions. For a full list of open data at NLM, see https://www.nlm.nih.gov/NIHbmic/nih_data_sharing_repositories.html.
21 See https://report.nih.gov/NIHfactsheets/ViewFactSheet.aspx?csid=45.
the publication of the human genome, today’s researchers can find a gene suspected of causing an inherited disease in days rather than years. The costs of maintaining NCBI at current standards are rather small. NLM’s annual budget hovered at about $400 million from 2015 to 2018 and rose to just under $442 million in 2019. This budget includes library operations and some intramural R&D, with NCBI accounting for about one-third of NLM’s total budget in 2019, or $134 million.22 If expansion of and/or improvements to the protection and curation of open data at NCBI are deemed warranted, it is worth noting that the current rate of public investment in making these assets freely available is very small relative to the likely benefits. While the economic value of NCBI has not been investigated specifically, economists have documented the importance of public databases for the progress of knowledge in science and innovation. These authors include Furman and Stern (2011), who demonstrate that public libraries for biological materials enhance the rate of knowledge generation associated with deposited materials; Biasi and Moser (2018), who show that reducing the cost of access to science books during World War II boosted scientific output in regions in which libraries purchased such books; and Furman and colleagues (2018), who document that patent deposit libraries had a positive impact on regional innovation in those areas that received such libraries in the pre-Internet age.
Valuation of Intangible Assets
Knowledge creation underlies the value of intangible assets. From an economic point of view, the value of a resource such as a gene database developed and owned by a for-profit company derives from its commercial value, that is, how the knowledge it contains can be used to introduce new and profitable products or services. For public companies, the firm’s market capitalization will reflect this value to the extent that it is transparent (e.g., if the designs for new products are patented or if technology agreements between one company and another are public knowledge).23
___________________
22 See https://www.nlm.nih.gov/about/2020CJ_NLM.pdf.
23 Firm market capitalization captures market estimates of firm value, incorporating assessments of the values of tangible assets, such as plant and equipment; intangible assets, such as the expected fruits of R&D; and expectations about future macroeconomic, industry, and firm conditions. Recent research documents that the issuance of patents has a statistically significant and economically meaningful impact on firm value, as measured by market capitalization (Kogan et al., 2017). See also the Innovation-alpha Stock Price Indexes developed by M-CAM that outperform market indexes (e.g., S&P 500) using a quantitative, rule-based methodology that exploits the control and deployment of intellectual property, including patents, by public firms. See https://www.conference-board.org/data/bcicountry.cfm?cid=18 for further information.
The value for individual assets cannot readily be discerned this way, however; rather, the value of a company’s portfolio of intangible assets is reflected in market capitalizations. This value encompasses not only the quantity and quality of the company’s databases, patents, and other innovative property, but also its capabilities to exploit those assets for profit.24
Investments in certain intangible assets are included in GDP, and values for their corresponding stocks are estimated and published regularly as part of the U.S. national accounts. In other words, official economic statistics are available for the following types of intangibles:
- software and databases;
- R&D;
- mineral rights; and
- entertainment, artistic, and literary originals.
The official asset estimates are not based on market valuations but on a valuation method known as “replacement cost.” The replacement cost method has long been used to value tangible assets, and these same methods are applied to intangible assets. Once intangible assets have been identified—a major step in its own right—replacement cost estimates for their values are developed from time-series data on investments using the perpetual inventory method (PIM). The following economic data and estimates are needed to implement the PIM:
- Time series for investments in each intangible asset
- Investments may be the value of purchases, or they may be the costs of developing the asset “in-house” (or both).
- Investments in both current dollars and constant (or “real”) dollar terms are required.
- A depreciation rate for each intangible asset
- The idea is to capture the expected period of time for which the investment will yield a stream of returns (i.e., it is an economic rate of depreciation, not a rate of physical decay).
- Depreciation rates for some asset types may differ by industry, requiring multiple estimates for such asset types.
___________________
24 This is not to say that business valuation analysts do not independently value intangible assets; they do, but typically in the context of an exchange between owners—that is, a transaction—as in a merger/acquisition (also for estate and gift tax purposes or as part of litigation). This leads to a situation in which company financial reports show values for intangible assets exchanged as part of a merger or acquisition, whereas values for assets created within firms that have not undergone a merger or acquisition are generally omitted; exceptions include certain mineral rights and, at the discretion of firms, software produced internally for the company’s own use.
The PIM then cumulates real investments, period by period, after subtracting an estimate of economic depreciation during the period (the loss in the asset’s value due to aging). This calculation produces an estimate of the volume of the asset stock; the value of the stock at replacement cost is obtained by multiplying the volume estimate by today’s price.25
The advantage of the replacement cost approach that is used in national accounting is that it is comprehensive. Market valuations of public for-profit companies do not reflect the assets of privately held firms, which include start-ups, nor do they include the assets of private nonprofit organizations (e.g., private universities) or the nation’s federally funded laboratory system. These are serious omissions for the upstream research-dependent bioeconomy, but all such institutions are in scope for national accounts. The valuation methods used for assets in national accounts do not depend on whether assets are held by the for-profit, nonprofit, or public sectors, although differences in the sectors’ character, such as the longevity of services derived from the assets, are recognized: basic research in the life sciences funded and conducted by the public sector is deemed to yield assets with a longer service life than a commercial software package/tool.
The analysis of biological databases, especially DSI, requires a fresh look, beginning with defining the data types of interest and identifying where each type is being held, stored, and likely to be transformed for commercial use. In recent academic research using data pulled from LinkedIn, firm-level information on employees classified by skills held (e.g., data science) has been used to estimate the value of investments in artificial intelligence (AI) (Rock, 2018).26 The idea is that AI may be included in the currently available estimates for software (albeit perhaps not comprehensively), but to analyze how investment in this area may be mismeasured and/or growing relative to other types of software requires a more granular approach. Rock’s skills-based approach is potentially relevant for developing estimates of own-produced biological data knowledge as an intangible asset of the bioeconomy. If biological data knowledge is in fact the outcome of work done by employees with specialized technical skills (rather than by employees classified in a generic occupation, such as “software engineer”), this approach is promising.
___________________
25 Note that a simple accumulation and correction for economic depreciation assumes that there no natural disasters or noneconomic events that diminish the volume of net stocks; in practice, these “other changes in volume” are accounted for when such events (e.g., a hurricane) destruct capital. Note also that replacement cost differs from both the historical cost approach used in U.S. Generally Accepted Accounting Principles–consistent company financial accounts and the mark-to-market, or fair value, method that the International Financial Reporting Standards allows.
26 See also Brynjolfsson et al. (2018).
For the bioeconomy, skills may include proficiency in software such as the Basic Local Alignment Search Tool, ClustalW, DNA sequence analysis software, Mendel, PhyLOP, RTI International SUDAAN, SAS/Genetics, and Ward Systems Group GeneHunter.27 As with the skills-based estimates of investments in AI versus investments in software, employees with these skills may be engaged in life sciences R&D, the idea being that even if life sciences R&D includes investments in biological data knowledge (in part or in whole), its own underlying dynamics are obscured.
With regard to valuing public databases, the value of the sequence data shown in Figure 3-4 can be considered as included in the value of R&D stocks in the bioeconomy’s research fields. This is because the outcomes of the conduct of this R&D include not only new scientific findings (or new drugs), but also genomic data or other DSI made available to the public for future use via NCBI (as discussed earlier in the section on valuation of intangible assets). It is tempting to suggest that the relationship of biological databases to total R&D stocks is proportional (acknowledging that it may not be possible to specify an absolute value), but Figure 3-4 suggests that the number of NCBI users (an indicator of the user value of those stocks) is growing faster than the accumulation of those stocks themselves (which partly reflects outcomes of R&D). Perhaps, then, the pattern of use of the NCBI data could be exploited to estimate a depreciation rate for biological data stores, thereby providing an essential ingredient for their independent valuation. The same might be said of ClinicalTrials.gov if statistics on user-ship and age of data accessed were available.
When thinking about the value of data, Varian (2018) argues that data exhibit decreasing returns to scale, citing the example that an increase in the size of training data for AI algorithms yields diminishing returns in prediction accuracy. While this is an aspect of how the value of data declines (or depreciates) over time, consider the following: There are multiple dimensions of use for biological data—especially genomic data, or DSI—and the fruits of combining publicly available DSI with privately collected personal lifestyle data have yet to be fully realized (even if it could be said that the fruits of exploiting public DSI alone are diminishing). This observation suggests that diminishing gains to data may occur only as new dimensions/combinations in use diminish.28 The capability
___________________
27 These skills are listed on O*NET as skill requirements for a geneticist; see https://www.onetonline.org/link/tt/19-1029.03/43232605. Data on geneticists are obscured because the occupation is included in the higher-level category “Life Scientists, Other,” which includes a collection of miscellaneous occupations, such as “Life Science Taxonomist.” (O*NET is sponsored by the U.S. Department of Labor’s Employment and Training Administration and is the nation’s leading source of information on occupations.)
28Li and colleagues (2019) explore this observation for the influence of data assets on market valuations of digital platform companies.
to value long-lasting public DSI data is thus important for both businesses that use and augment these data and governments that support and fund the data’s ongoing development.
Implications of Unmeasured Intangibles for Valuing the Bioeconomy
Studies that measure biologically based economic activity use several economic approaches. Each begins by delineating the bioeconomy as a subsector of the total economy. Typically, the bioeconomy is defined in terms of industry subsectors, and its economic contribution can then be measured from the national accounts using a value for the subsector’s GVA relative to total GDP.
An industry’s value added includes that industry’s own production of investment goods, that is, its own conduct of R&D and generation of other intangible assets, including tools that enable data-driven capabilities. Some of these assets are not currently capitalized in the national accounts, suggesting that delineating the bioeconomy using official statistics for sector value added represents an approximation, indeed an understatement, unless this shortcoming is remedied.
A Path Toward Identifying and Valuing the Bioeconomy
There are no studies identifying and quantifying the bioeconomy using a definition consistent with that of this committee. In the following subsections, activities that fall within the committee’s definition of the bioeconomy are described, and measurement tools required for future analyses of the bioeconomy are discussed.
Delineating the Bioeconomy
The primary user-driven segments of the bioeconomy—agricultural, bioindustrial, and biomedical—are considered first as the major categories of activity encompassed by the landscape and definition explored in Chapter 2. It is important to note that the committee’s definition and explanation in the landscape discussion in Chapter 2 groups the activities within the bioeconomy into these three major scientific domains. However, when moving from a conceptual map based on scientific domains toward an economic mapping of the activities included in the bioeconomy, the groupings change to account for the limitations of the current classification system. For example, when considering the scientific domain of agriculture, the committee identified crops (genetically engineered or created via marker-assisted breeding programs) as being included in the
bioeconomy (criteria #1 and #2; see Chapter 2). The committee also identified as being included the use of plant biomass in a downstream bioprocessing and/or fermentation process utilizing recombinant DNA technology (criterion #4; see Chapter 2). However, in an economic mapping, the economic activity stimulated by plant biomass is grouped with the industrial activity of biobased chemical production. This is a function of how and where the economic activity is collected, categorized, and attributed.
A study whose circumscribed bioeconomy activities are wholly contained within the committee’s definition (Carlson, 2016, 2019) is reviewed in detail in Annex 3-1. Like the committee, Carlson focuses on agricultural and industrial revenues generated through the use of genetically modified (GM) biological organisms and systems. His accounting includes crops, biopharma and biologics, and biobased industrial products (e.g., biofuels, enzymes, and biochemicals). He acknowledges that North American Industry Classification System (NAICS) code categories are too broad to capture value added in these activities accurately. Indeed, a major contribution by Carlson (2016) is his suggestion to revise the system used to classify official statistics on economic activity by industry (see Box 3-2). As noted in Annex 3-1, Carlson focuses mainly on business-to-business activity, which leaves out the value added in products that are further processed and/or are delivered to consumers (e.g., biobased plastic bottles [although resins are included]), in contrast to the committee’s approach.
Moving from primary segment to the details that would enable data capture requires identifying the relevant codes within that category that cover the scope of the committee’s definition. For example, biomedical activity usually encompasses three relatively well-defined (yet detailed) industry sectors: pharmaceuticals, biotechnology R&D services, and electromedical equipment and medical instruments (Hermans et al., 2007). In NAICS, the system currently used to classify economic activity by industry,29 these industry sectors are represented by four categories of codes: Pharmaceutical and Medicine Manufacturing, NAICS 3254; Electromedical Instruments Manufacturing, NAICS 334510, 334516, and 334517; Surgical and Medical Instrument Manufacturing, NAICS 339112; and Research and Development Services in Biotechnology (except nanobiotechnology), NAICS 541714. According to the committee’s definition, NAICS 541715 should also be partially included, as it covers Research
___________________
29 NAICS organizes industry activity by sectors and subsectors using a hierarchical structure and six-digit code. The first two digits identify the sector, the third digit identifies the subsector, the fourth digit identifies the industry group, and the fifth identifies the NAICS industry. The first five digits are standardized across the United States, Canada, and Mexico. Each country can use a sixth digit to identify the specific national industry (which is therefore specific to the country and not standardized). For examples and more information, see https://www.census.gov/programs-surveys/economic-census/guidance/understanding-naics.html.
and Development Services in the Physical, Engineering, and Life Sciences (except Nanotechnology and Biotechnology). According to the North American Product Classification System (NAPCS)30 product list for NAICS 5417 (see Box 3-2), the latter would include bioengineering and biomedical R&D services, which covers the mechanical engineering of robotic systems for health care.31 Many studies of biotechnology consider activity in NAICS 541714 as in scope for their analysis, but this approach misses the other life sciences, biomedical engineering, and bioengineering R&D services activity included elsewhere in the overall R&D services industry.
Moving from the three primary segments (agriculture, bioindustrial, and biomedical), the committee needed to determine the subset of the primary segments for which economic activity data are captured. Thus, the committee identified the six segments within the broad category of goods and services, which includes materials, business services, and consumer products. At the level of these segments, the following six segments are taken as an approximation of the bioeconomy, as best as can be determined from the available data, and recognizing that they incompletely capture the bioeconomy as the committee has defined it:
- GM crops/products;
- biobased industrial materials (e.g., biobased chemicals and plastics, biofuels, agricultural feedstocks);
- biopharmaceuticals and biologics, other pharmaceuticals;
- biotechnology consumer products other than drugs (e.g., genetic testing services);
- biotechnology R&D business services, including laboratory testing (kits) and purchased equipment services (e.g., sequencing services); and
- design of biological data-driven patient health care solutions (i.e., precision medicine inputs), exclusive of patient care services per se and drugs counted elsewhere.
The bioeconomy also includes investments in specialized equipment and services, including
___________________
30 NAPCS is a coding system that categorizes products (good and services) independently of industry of origin. These codes can be linked back to the NAICS industry classification and are also consistent across Canada, Mexico, and the United States. For more information, see https://www.census.gov/programs-surveys/economic-census/guidance/understandingnapcs.html.
31 See https://www.census.gov/eos/www/napcs/finalized/web_5417_final_reformatted_edited_US060409.pdf.
- specialized equipment purchased for use in bioeconomy-related research, product development, and testing (e.g., mass spectrometers, sequencing machines);
- specialized instruments developed for research laboratories and medical care (selected medical devices, including medical robots); and
- long-lived services (intangible assets) purchased by bioeconomy firms for product development (e.g., specialized software and consulting services, including data analytic services).
In addition, the bioeconomy includes the production of intangible assets within bioeconomy organizations for their own use, such as
- own production of value added via the development of databases for further use in product development and testing (as in the example given in the earlier section on estimation of investments within organizations); and
- R&D and other generic intangible assets, including training of employees in specialized bioeconomy skills.
The activities listed above reflect the orientation of this committee’s definition of the bioeconomy toward activities stemming from advances in the life sciences as enabled by engineering, computing, and information sciences. The list of activities is highly diverse and ranges from GM crops to such activities as the production of medical robots and biological data as an intangible asset. The committee’s definition potentially encompasses innovative applications of precision medicine to nonscientific domains (patient care or health insurance), although these extensions are not included in this economic analysis. All told, a comprehensive and “living” approach to measurement is necessary (i.e., one that encompasses future activities affected by biobased technological advances).
A Satellite Account for the Bioeconomy and Its Assets
An accounting of the bioeconomy as a subsector of the economy requires a comprehensive set of measurements. A dedicated bioeconomy satellite account built as an adjunct to the U.S. national accounts would provide a necessary tool for economic analysis of the bioeconomy.
A satellite account is a system of economic data that portrays expenditures, production, and income generated by a defined set of activities. Satellite accounts typically design tables with specific users in mind (up to the limits of the data), especially when the extent of the detail on production and expenditures illuminates a collection of activities not aggregated elsewhere in economic data (see Box 3-3).
A satellite account system for the bioeconomy would, ideally, develop the appropriate interindustry relationships for biobased production, include a full accounting of intangible assets and bioeconomy databases, incorporate quality-adjusted price deflators for relevant products (e.g., biopharmaceuticals and biomedical equipment), and facilitate accounting for certain environmental benefits (e.g., as in Daystar et al., 2018). The sources of supply, domestic and foreign, for bioeconomy products and for inputs to bioeconomy domestic production should also be illuminated, along with financial flows relating to inward and outward transfers of the bioeconomy’s technology and information assets, necessitating the development of new data.
The design of the bioeconomy satellite account could possibly exploit available administrative data,32 as well as U.S. Census Bureau
___________________
32 “Administrative data” refers to data collected and maintained by government agencies and used to administer (or run) their programs or provide services to the public (e.g., Medicare data).
survey-based microdata, to ensure the necessary scope and coverage. Additionally, the horizon-scanning and forecasting efforts envisaged in Chapter 6 could provide further insight into designing the bioeconomy satellite account and ensure its utility for addressing specific policy and forecasting questions.
Valuing the Bioeconomy
In lieu of a satellite account, the committee approached valuing the bioeconomy and its intangible assets in the context of the committee’s definition as a pilot experiment: What can existing tools, data, and studies demonstrate about the bioeconomy and its reach? Consider, then, marrying the committee’s components discussed earlier with the I-O approach set out in Daystar et al. (2018). The Daystar et al. (2018) study provides value added for many relevant bioeconomy products, estimates that are not otherwise available using official data alone.
A Valuation Pilot Experiment and Framework
Can elements from Daystar et al. (2018) be supplemented with others to bridge at least most of the gap between the relevant products in that study and the more comprehensive set of goods and services covered by the committee’s definition? The answer to this question would appear to be yes, by using elements from Carlson (2019) where possible, by estimating gross output values for bioeconomy goods and services and converting them to GVA using the ratio of the latter to the former for the industry as a whole, and by drawing on a set of estimates for R&D and other intangible investments by detailed industry conforming to the detail set out by BEA in the U.S. national accounts. Box 3-4 summarizes the steps taken to generate the figures developed for the pilot experiment.
The specific segments of the bioeconomy included in the experiment’s estimates are listed in Table 3-2 and cover items that can readily be identified based on previous studies and simple extensions based on the committee’s definition (e.g., the addition of electromedical equipment). The conclusion of this pilot experiment is not meant to be definitive, and may err either on the short side to the extent that the delineation of activities associated with the committee’s tech-driven definition falls short or on the high side to the extent that too much of an identified activity is ascribed to the bioeconomy.
That said, and as may be seen from inspection of Table 3-2, publicly vetted estimates (or simple translations of gross output data) are available for most of the segments listed in the earlier subsection describing the path toward identifying the value of the bioeconomy. Where segments
involve biobased production, two value added estimates for the activities listed in columns 2 and 3 of the table are used: the first, shown in column 4, represents an estimate of the current value added in biobased production, and the second is an estimate of the potential for biobased production (using current technology). These estimates come from Daystar et al. (2018), where that study is listed as a source in column 3 of the table. For other estimates, modest assumptions were made based on the available literature (e.g., that biopharma now accounts for 25 percent of all pharmaceuticals, and that its potential is 80 percent, where the upper limit represents the capability possessed by the leading-edge global firm in 2014) (Otto et al.,
TABLE 3-2 Illustrative Bioeconomy Segments and Their Value Encompassed by the Committee’s Definition
| Segments | Classification (North American Industry Classification System [NAICS] code, where relevant) | Source of Estimate for Value Added1 | Value Added in 2016 (millions of dollars) |
||
|---|---|---|---|---|---|
| Current | Potential | ||||
| Private Industry Sector Segments | |||||
| 1. | Crop products | 11111-6, 11119, 111900pt | Committee calculations; Carlson (2019) | 36,740 | 46,141 |
| 2. | Biorefining (food) | 311210, 221, 224, 225; 311300 | Daystar et al. (2018) | 3,023 | 36,830 |
| 3. | Biofuels (ethanol) | 324110pt | See note2 | 8,361 | 12,553 |
| 4. | Biopharmaceuticals | 325412pt | See note3 | 31,118 | 99,575 |
| 5. | Biologics (enzymes) | 325414 | Daystar et al. (2018) | 16,918 | 16,918 |
| 6. | Other pharmaceuticals | 325412pt | See note3 | 93,354 | 24,894 |
| 7. | Biobased petrochemicals | 35211 | Carlson (2019) | 6,726 | 16,304 |
| 8. | Other enzymes | 32519pt | Daystar et al. (2018) | 11,918 | 11,918 |
| 9. | Other biobased chemicals | 325211, 32519, 32522, 325510, 325998, 325611, 325612, 325520, 325991, 325992, 325910, 325613 | Daystar et al. (2018) | 8,081 | 50,505 |
| 10. | Biobased plastic products | 326 | Daystar et al. (2018) | 997 | 68,436 |
| 11. | Electromedical instruments | 334510, 6, 7 | Gross output (GO) adjusted to gross value added (GVA) | 49,636 | 49,636 |
| 12. | Surgical and medical instruments | 339112 | GO adjusted to GVA | 28,153 | 28,153 |
| 13. | Bioeconomy R&D services | 541714, 541715pt | Annex 3-1 discussion | 43,090 | 43,090 |
| Intangible Investments Not Included in Value Added as Detailed Above | |||||
| 14. | Data services/software purchases | Private bioeconomy segments listed above | National accounts and INTAN-Invest | 5,615 | 7,880 |
| 14a. Memo: | Private health care organizations | INTAN-Invest | 15,194 | — | |
| Public and Nonprofit Sector Segments | |||||
| 15. | R&D | Life sciences, bioengineering, and biomedical engineering | National accounts, NCSES surveys | 44,546 | 44,546 |
| 16. | Software and data-related analytic services | Classification of functions of government, health | National accounts and SPINTAN project4 | 14,190 | 14,190 |
| Total5 | 343,730 | 571,569 | |||
NOTES:
1. Reports the source for the estimate of the share of national accounts value added in the “nearest” available detailed industry. The final value added estimate for each activity also includes the contribution of intangibles not in the national accounts developed from a detailed version of the estimates reported at www.intaninvest.net.
2. Estimate based on fraction of gasoline that is ethanol. Biomass electric power generation is not separately listed; available estimates suggest value added in this activity was $635 million in 2016.
3. Estimate based on Otto et al. (2014) and the National Center for Science and Engineering Statistics Business R&D and Innovation Survey data reviewed below in the section on the direction of the bioeconomy.
4. SPINTAN (Smart Public Intangibles) refers to a European Commission Framework–financed project whose research consortium included The Conference Board. See www.spintan.net. The estimates of public- and nonprofit-sector intangibles developed for the SPINTAN project are designed to complement those for the market sector found at www.intaninvest.net.
5. Excludes line 14a.
2014). Further study is needed to refine the estimates of potential biobased production in the delineated industries, especially pharmaceuticals (the Daystar et al. [2018] study does not include pharmaceuticals).
The actual and potential estimates of value added of existing industries serve a dual purpose. First, they are summed to value the bioeconomy. Second, the implied shares of value added of existing industries are assumed to approximate the bioeconomy’s share of the industry’s total investment in intangible assets (i.e., the potential column demonstrates the full value of all activities contained within the listed segments, demonstrating the potential for the bioeconomy to grow within a given segment). These shares are then used (1) to include own production of non-national accounts intangibles in value added; and (2) to calculate purchases of services related to software and biological data.
With regard to investments in intangible assets, the following was done. First, all value added estimates for segments shown in Table 3-2 were based on national accounts estimates of value added that include own production of software and R&D. Second, estimates of non-national accounts intangible assets for each bioeconomy segment listed in Table 3-2 were obtained using each segment’s share of value added in the industry-level data used to develop industry-level estimates of intangible investment; the industry-level intangible asset estimates were based on estimates that followed methods documented at www.intaninvest.net. Third, the value of purchased software assets and data analytic services was accounted for separately using the same shares. Finally, the conduct of bioeconomy R&D by the government or universities was included in the value of bioeconomy activity as a separate, delineated activity.
Regarding biological data, an assumption was made that a firm’s own production of databases is included in national accounts estimates of software; likewise for their purchases, to the extent a market transaction takes place. While this constitutes a lower bound, note that investments in data analytics by firms in the bioeconomy are reflected in their purchases of (1) computer design and related information technology consulting services and/or (2) management consulting services. These items are not included in the national accounts estimates of intangibles, but we have added available estimates of spending on these activities by bioeconomy firms. For the public sector, the value of the investments in software and computer design consulting (our best proxies for investments in data), as estimated for the function of government circumscribed as “health,” also is included.
Contribution of the Bioeconomy to U.S. Value Added
The sum of the direct impact of value added in bioeconomy industries shown in column 4 of Table 3-2 totals $402.5 billion, or 2.2 percent of GDP in 2016 (see Table 3-3). If biobased production were at its potential level, the value added figures shown in column 5 of Table 3-2 would be $571.6 billion, or 3.1 percent of GDP (note that only the private economy is affected by shifts toward biobased production within an industry). The subtotal for private value added in the bioeconomy was nearly 1.8 percent of GDP in 2016, and its estimated potential level was 2.7 percent of GDP.
To estimate indirect and induced effects, a multiplier of 2.5 was applied to private bioeconomy economic activity; this multiplier is substantially lower than the implicit multiplier in Daystar et al. (2018) as a result of the inclusion of R&D services, pharmaceuticals, selected equipment, and other intangibles. These latter segments are large relative to other private biobased activity, and a multiplier closer to that for overall manufacturing (2.41 from Popkin and Kobe [2010] as quoted above) is more appropriate. Then a multiplier of 1.7 was applied to government and higher-education activity (from Popkin and Kobe [2010]). Without further study, it is impossible to be more precise, an observation that reinforces the need for a bioeconomy satellite account that details the appropriate interindustry linkages for relevant economic activities.
After applying the multipliers described above, economic activity driven by the bioeconomy is estimated to have accounted for nearly 5.1 percent of GDP in 2016, and would have accounted for 7.4 percent with biobased production at its estimated potential level. We stress that this guideline for the size of the bioeconomy is offered only as suggestive of the current state of the literature in the form of a rough estimate. It is rough because the committee’s definition of the bioeconomy is meant to be “living,” and there are significant gaps in the available data. Advances in technology will affect circumscribed activities and the evolution of the potential of bioeconomy production (e.g., this potential could be larger by 38 percent if a modest estimate of the delivery of biodata-based precision medicine solutions at the point of care were included in bioeconomy activities).33
___________________
33 Health care services (excluding drugs, insurance, and administrative costs) directly accounted for 10 percent of U.S. GDP in 2016, 27 percent of which represented physician services. If this figure is used as a marker for the value of point-of-care services, it suggests that another 2.7 percent of U.S. GDP is potentially (directly) impacted by the bioeconomy.
TABLE 3-3 Summary of Illustrative Bioeconomy Valuation Experiment
| Major Sector | Value Added in 2016 (billions of dollars) |
||
|---|---|---|---|
| Current | Potential | ||
| Direct contribution: | |||
| 1. | Private industry | 343.7 | 512.8 |
| 2. | Public/nonprofits | 58.7 | 58.7 |
| 3. | Total | 402.5 | 571.6 |
| 4. | Percent of GDP | 2.2 | 3.1 |
| Including indirect and induced effects: | |||
| 5. | Private industry | 859.3 | 1,282.1 |
| 6. | Public/nonprofits | 99.9 | 99.9 |
| 7. | Total | 959.2 | 1,381.9 |
| Percent of GDP | 5.1 | 7.4 | |
SOURCES: Table 3-2 and Box 3-4 for bioeconomy valuation. Bureau Economic Analysis for U.S. GDP in 2016, which was $18,715 billion.
SOURCES: Table 3-2 and Box 3-4 for bioeconomy valuation. Bureau Economic Analysis for U.S. GDP in 2016, which was $18,715 billion.
Valuation of the Bioeconomy’s Intangible Assets
A takeaway from the earlier discussion of the valuation of intangible assets is that using a national accounts approach to estimate the value of an asset stock requires a time series of investments in the asset and a rate of depreciation for the asset. From the above, estimates of the private bioeconomy’s intangible investments are available for 1 year (2016) (estimates of biobased production in an industry relative to the industry’s total production over time are not readily available). The lack of readily available time-series information on biobased production shares is another example of the need for more complete data on the bioeconomy such as would be provided by a satellite account.34
Regarding biological data, even if analysis in line with the bioeconomy components listed in Table 3-2 were possible, the results would not necessarily be comprehensive. Analysis of biological data requires identifying the sectors and activities that hold large quantities of such data. The public sector is, of course, a large holder, as previously described, but the private health care sector also invests heavily in biological data
___________________
34 One could consider the bioeconomy’s intangible investments via funding for R&D performed by the public and nonprofit sectors (the last two components listed in Table 3-2), which do not rely on production shares. All told, estimates of these values alone would not be informative as to the bioeconomy’s stock of intangible assets.
(although not necessarily genomic data), and these investments would not be included if valuation of biological data were confined to the bioeconomy as delineated in Table 3-2. For data services and software alone, spending by the private health care sector is nearly three times what is currently spent by private industries included in the bioeconomy (compare line 14a with line 14 in Table 3-2). The analysis of biological data stores requires a fresh look, beginning with defining the data types of interest and identifying where each type is being held throughout the economy at large.
DIRECTION OF THE U.S. BIOECONOMY
This section reviews the current status and growth of the bioeconomy by examining indicators of activity in many of its sectors. Given the multiple challenges of measuring the bioeconomy, an approach that relies not on a single indicator but on a range of metrics that capture the varied aspects of the bioeconomy is warranted. Our analysis relies whenever possible on public data sources, ideally those published by federal agencies, such as the U.S. Census Bureau or the U.S. National Science Foundation (NSF), and international organizations, such as the Organisation for Economic Co-operation and Development. In some cases, we relied on data collected by private organizations. A complete analysis of the full range of data available for measuring all of the subsectors of the bioeconomy would be ideal, but this would require a dedicated staff of independent researchers. Also included in the bioeconomy, as described earlier in this chapter, are the social benefits of the bioeconomy’s contribution to human and environmental health. Measurement of these benefits, also a complex job, is not included in this chapter’s analysis.
National Investments in the Bioeconomy
NSF collects data on R&D funded and performed by U.S. government agencies, federally funded research and development centers (FFRDCs), state governments, academic institutions, nonprofit institutions, and businesses. This information is collected in separate surveys of federal government agencies, of state governments, of institutions of higher education (the Higher Education Research and Development [HERD] survey), and of businesses (the Business Research and Development Survey). A new survey of nonprofit institutions would be useful for studying developments in R&D funded and performed by these institutions in the near future.35
___________________
35 Also, the business survey has been redesigned and renamed the Annual Business Survey. The new survey, which is forthcoming as of this writing, will focus on for-profit, nonfarm U.S. businesses with one or more employees, beginning with the data year 2017.
Consistent with the vision expounded by Vannevar Bush in his 1945 Letter to President Roosevelt, “Science the Endless Frontier,” the U.S. government devotes the majority of its nonmilitary R&D investments to basic and applied scientific research, including research at universities. Business spending is devoted predominantly to product development (Arora et al., 2019; Bush, 1945). Summarizing R&D trends in the bioeconomy using federal data is challenging, as measures are broadly characterized by discipline and subfield. The most widely used subaggregate within total federal and university R&D spending is “life sciences,” which includes as major subcategories biological and medical sciences (bioengineering and biomedical engineering data are not measured). Data on business R&D spending are collected by industry. NSF’s survey also asks respondents to classify their spending according to “technology focus,” one such focus being biotechnology. This allows industry-level R&D spending and performance to be cross-classified by focus field.36 Unfortunately, the statistics on biotechnology are not regularly compiled for purposes of science policy analysis, nor are they reviewed in the biannual publication of the National Science Board, Science and Engineering Indicators (S&E).
Before reviewing these sources of information on R&D investments in the bioeconomy, the past decade of funding for the major performers of R&D (by size) in the United States in the business and higher-education sectors were considered. This was based on the most recent data available for the period 2006 to 2016. Over this period, as seen in Figure 3-5, business enterprise expenditures on R&D (BERD) became increasingly important to American innovation, but federal funding flagged. Higher-education expenditures on R&D (HERD) were slightly down, reflecting mainly the impact of a decline in federal funding. Taken together, total U.S. R&D, public and private (which includes some small components not shown in Figure 3-5), moved roughly sideways relative to GDP during this period.
Federal Investments in the Bioeconomy
Data on federal funding for research are available by major discipline and are presented as a share of GDP in Figure 3-6. Research in the life sciences commands greater resources than that in any other major discipline. Spending on life sciences research peaked during the NIH “doubling” of the early 2000s, reaching nearly 0.25 percent of GDP. That spending has declined to under 0.2 percent of GDP since. All told, total federal funding for R&D (which includes development funds not shown in Figure 3-6) has
___________________
36 In addition to biotechnology, the other cross-cutting technologies that are surveyed are software, energy, environment, and nanotechnology.
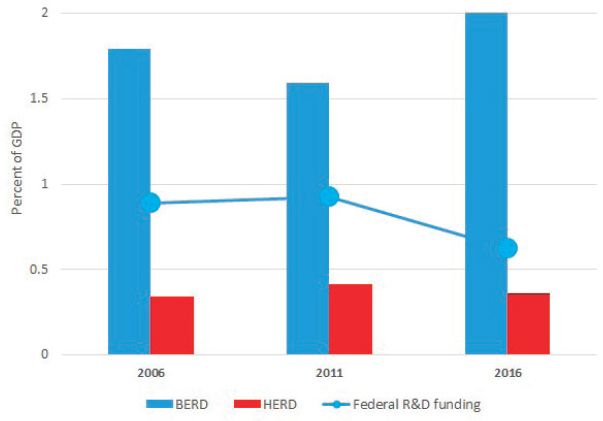
declined as a share of GDP since 1970, despite an increase in life sciences and multiple actions (e.g., the America Competes Acts in the 2000s) taken to raise U.S. competitiveness in the physical sciences and engineering.
Within the life sciences, research based in biology (other than environmental biology) doubled in real terms between 1999 and 2003 (see Figure 3-7). Although the amount of federal funds dedicated to biology research declined immediately thereafter, it has hovered at about $17 billion (in 2019 dollars, i.e., in real terms) in the dozen years since. NIH is the largest funder of R&D in the life sciences by a wide margin (see Figure 3-7), but funding for biological R&D is also a consequential share of R&D funding by other agencies (NSB and NSF, 2018).
Federal funding for bioengineering and biomedical engineering R&D is not typically grouped with the life science funding measures regularly analyzed in the biannual S&E. Rather, that funding is included in engineering R&D, with the consequence that typical federal spending indicators are not as comprehensive as is necessary to fully analyze federally
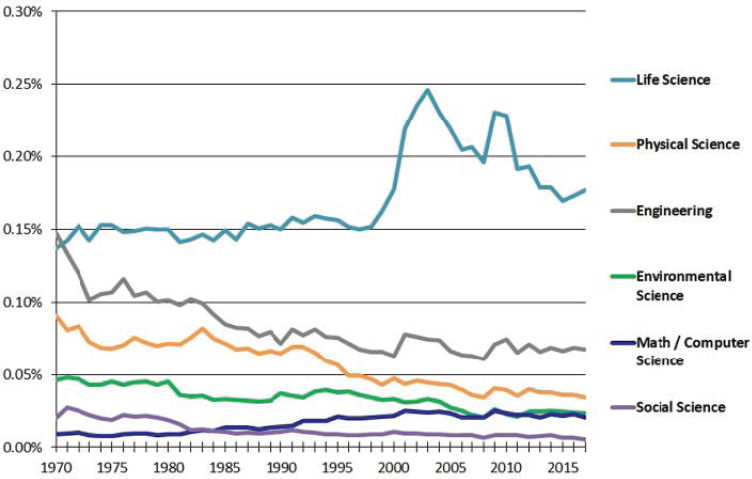
financed research in support of the bioeconomy. Certain detailed tables in the federal survey enable compilation of the appropriate statistics, and the desirability of doing this is seen by triangulating historical statistics reported in the HERD survey.37 The S&E reports time-series data for federally financed HERD in engineering subfields, including expenditures for bioengineering and biomedical engineering. Although these expenditures are very small relative to total federally funded life sciences R&D (about 3 percent in 2016 and 2017) and would not include similarly classified intramural research at federal agencies or FFRDCs, federal support for academic research in this area has grown rapidly (8.5 percent per year from 2007 to 2017).38 This category of federally funded R&D
___________________
37 The committee thanks the National Center for Science and Engineering Statistics staff for suggesting this triangulation.
38 Compare this with the following: federally financed academic life sciences R&D grew 2.2 percent annually from 2007 to 2017, federally financed academic biological and biomedical sciences R&D grew 2.8 percent annually, and nominal U.S. GDP grew 3.0 percent annually.
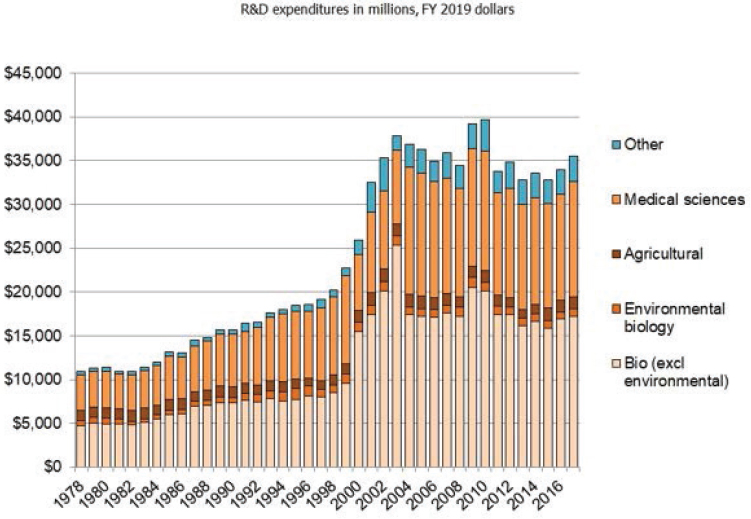
performance at higher-education institutions posted the fastest growth among all detailed S&E categories reported in the HERD survey over this 10-year period.
The trends in federal versus other sources of bioeconomy R&D expenditures at institutions of higher education are summarized in Figure 3-8. Other funding sources include own-institution funds, states, businesses, and nonprofit institutions, with own-institution funds making up a bit more than half of total nonfederal sources in recent years. The slight downtrend in overall federal funding relative to nominal GDP is more than compensated for by an increase in funds from other sources.
R&D Investments in the Bioeconomy by Private Business
U.S. R&D investments have been fairly stable relative to U.S. GDP. Within total spending, that by the private business sector has increased in recent years. Three broad groupings of private business R&D investments in the U.S. economy are shown in Figure 3-9: (1) national accounts’
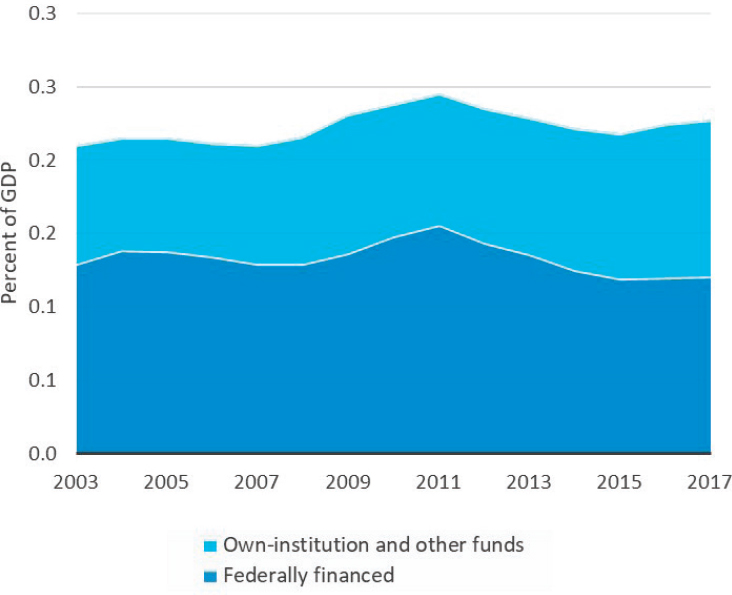
identifiable bioeconomy (including pharmaceuticals), (2) digital- and Internet-related (labeled “digital”), and (3) all other (labeled “other”). U.S. R&D in pharmaceuticals is shown separately (and labeled “pharma”).
Business R&D in biotechnology and bioengineering cannot be wholly identified in national accounts data; despite this gap, however (and the need to remedy it), the trends shown in Figure 3-9 are generally indicative of developments in business R&D investments in the U.S. economy over the past 50 years. R&D in all things digital has climbed steadily in relation to GDP over the 50 years shown. Software development is a driver of the recent strength in this area and reflects, at least in part, investments in cyber protection and AI. R&D in pharmaceuticals also rose relative to GDP over time, dipping after 2008 and partially recovering thereafter. Identifiable R&D in the bioeconomy other than pharma (the difference
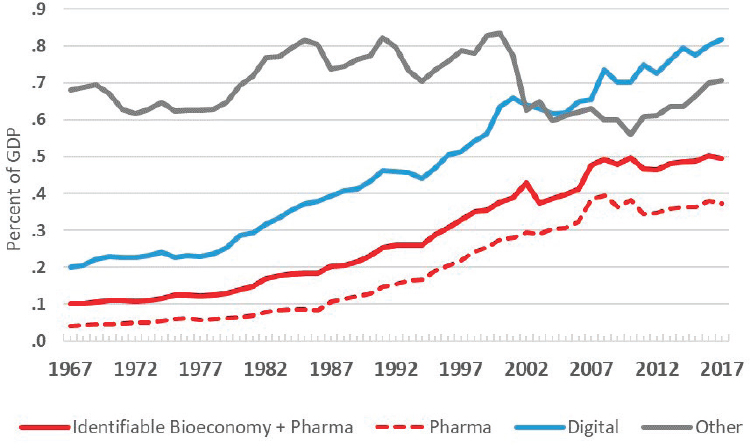
between the solid and red dashed lines in the figure) compensates for some of the weakness in pharma between 2008 and 2011. R&D in other industries turns sharply upward after 2008, reflecting a pickup in R&D investments in motor vehicles and a surge in “other nonmanufacturing” R&D expenditures in the professional and technical services industry (other than scientific R&D services). The latter development raises several questions, some of which are addressed in the remainder of this section.
Where Is the Bioeconomy? (Private Bioeconomy Activity Within Economic Sectors)
As described earlier in the section on measuring the bioeconomy, private economic activity that is supported by the bioeconomy covers bioindustrial materials, biopharmaceuticals, biobased consumer products,
agriculture, and bioeconomy-specialized equipment design and production. Private R&D expenditures supporting new product developments in these areas are difficult to identify in data collected and organized by industry, but as previously noted, NSF’s surveys of business R&D have (since the early 2000s) included a question that asks respondents to identify expenditures whose technological focus is biology. These crosscutting industry data on biotechnology R&D are not regularly compiled as time series for purposes of economic or science policy analysis. While such data would not capture R&D in medical equipment design, private expenditures on biotechnology R&D should be generally indicative of how biological sciences are driving some of the technological developments in the U.S. economy.
Figure 3-10 and Table 3-4 provide snapshots of U.S. biotechnology R&D expenditures compiled for this report. Figure 3-10 documents the increasing importance of biotechnology R&D relative to total business R&D and to total pharmaceutical R&D for 2005, 2011, and 2016. Between 2005 and 2016, the biotechnology fraction of R&D in pharmaceuticals increased, as did the overall ratio of biotechnology R&D to total R&D
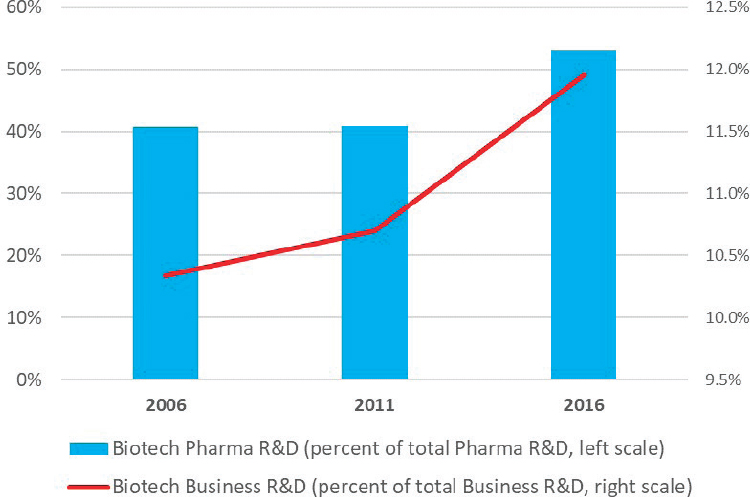
TABLE 3-4 U.S.-Based Companies, Represented by NAICS Codes, Conducting Biotechnology R&D, as a Function of Total Domestic R&D, Selected Segments, Selected Years (US$ millions)
| Segment (NAICS code) | 2016 | ||
|---|---|---|---|
| Biotechnology R&D | Domestic R&D (in segment) | Biotech R&D/Domestic R&D (by segment) (%) | |
| All industries (21–23, 31–33, 42–81) | 44,793 | 374,685 | 12.0 |
| Manufacturing industries (31–33) | 40,839 | 250,553 | 16.3 |
| Nonmanufacturing industries (21–23, 42–81) | 3,954 | 124,132 | 3.2 |
| Specific industry (NAICS code) | |||
| Food (311) | 474 | 4,828 | 9.8 |
| Basic chemicals (3251) | 397 | 2,545 | 15.6 |
| Pharmaceuticals and medicines (3254) | 34,251 | 64,628 | 53.0 |
| Other chemicals (other 325) | 629 | 6,402 | 9.8 |
| Plastics and rubber products (326) | 282 | 3,752 | 7.5 |
| Computer and electronic products (334) | 3,230 | 77,385 | 4.2 |
| Semiconductor & other elec. components (33344) | 1,245 | 31,381 | 4.0 |
| Professional, scientific, & technical services (54) | 3,284 | 37,595 | 8.7 |
| Scientific R&D services (5417) | 3,013 | 14,842 | 20.3 |
| Biotechnology R&D (541711) | 2,283 | 4,464 | 51.1 |
| Other scientific R&D (other 5417) | 730 | 10,378 | 7.0 |
| Health care services (621–623) | 423 | 848 | 49.9 |
NOTES: NAICS = 2012 North American Industry Classification System; the table shows company performance of R&D regardless of the source of funds (e.g., own funds, government funds). The R&D in this table is the industrial R&D performed within company facilities, funded by all sources. The funds are the company’s own; funds from outside organizations, such as other companies, research institutions, universities and colleges, nonprofit organizations, and state governments; and funds from the federal government.
SOURCES: National Science Foundation, National Center for Science and Engineering Statistics, and U.S. Census Bureau, Business R&D and Innovation Survey, 2016 and 2011, and Survey of Industrial Research and Development, 2005.
across all industries. The increase in biotechnology R&D over the years shown exceeds the increase in biotechnology pharma; the increase from 2006 to 2011 was buttressed by an increase in biotechnology R&D in the food products industry.
Table 3-4 shows industry detail behind the figures for 2016. Biotechnology R&D is concentrated in but not limited to the pharmaceutical and biotechnology R&D services industries. R&D with a biotechnology focus constituted more than 50 percent of total R&D in these two industries in 2016, but the biotechnology shares of R&D in the food, basic chemicals, other chemicals, other scientific R&D services, and heath care industries also are consequential.
It is important to note that, while biotechnology R&D conducted by the private sector is rising, the fraction of biotechnology R&D paid for by firms and paid for by others varies across business sector. These differences are highlighted in Table 3-5, which reports the fraction of U.S. biotechnology R&D conducted by firms that is paid for by the firms themselves compared with paid for by others. Overall, nearly 20 percent of funding for biotechnology R&D derives from sources other than the firm itself. Whereas most of the funding for biotechnology R&D in food and plastics is contributed by firms themselves, more than two-thirds of the funding in basic chemicals and just over three-fourths of payments to firms that provide specialized biotechnology R&D services derives from organizations other than the companies themselves, primarily the federal government.
Entrepreneurship and the Bioeconomy: Synthetic Biology as a Case Analysis
The data reviewed in the previous section suggest a robust rate of growth in R&D in bioengineering and biomedical engineering at institutions of higher education, but they are not dispositive regarding growth in business biotechnology R&D outside of pharmaceuticals. Nonetheless, in the broader picture, other sources suggest that a number of areas within the bioeconomy are experiencing investment and have the potential for accelerating its economic and social impacts. One of these areas is synthetic biology, for which analysis can be conducted using indicators that focus on entrepreneurship. A case analysis of synthetic biology follows.
Synthetic biology “collectively refers to concepts, approaches, and tools that enable the modification or creation of biological organisms” (NASEM, 2018, p. 1). The targeted manipulation of these components of life has been enabled by a series of advances in several scientific fields, including chemistry, engineering, and computer science, as well as biology. Taken together,
TABLE 3-5 Sources of Funding for Business Biotechnology R&D Expenditures, 2016
| Segment (NAICS code) | Fraction of Biotechnology R&D Paid for by Company (%) | Fraction of Biotechnology R&D Paid for by Others (%) |
|---|---|---|
| All industries | 82.5 | 17.5 |
| Manufacturing industries | 86.5 | 13.5 |
| Food (311) | 95.8 | 4.2 |
| Basic chemicals (3251) | 33.2 | 66.8 |
| Pharmaceuticals and medicines (3254) | 86.2 | 13.8 |
| Other chemicals (other 325) | 81.4 | 18.6 |
| Plastics and rubber products (326) | 100.0 | 0.0 |
| Computer and electronic products (334) | 87.8 | 12.2 |
| Professional, scientific, and technical services (54) | 30.9 | 69.1 |
| Scientific R&D services (5417) | 27.6 | 72.4 |
| Biotechnology R&D (541711) | 23.7 | 76.3 |
| Other scientific R&D (other 5417) | 39.9 | 60.1 |
| Health care services (621–623) | 93.6 | 6.4 |
NOTES: NAICS = North American Industry Classification System. Indented categories are subsets of the NAICS codes above them. For example, “Biotechnology R&D (541711)” and “Other scientific R&D (other 5417)” are both subsets of “Scientific R&D services (5417),” which is in turn a subset of “Professional, scientific, and technical services (54).”
SOURCES: National Science Foundation, National Center for Science and Engineering Statistics, and U.S. Census Bureau, Business R&D and Innovation Survey, 2016.
these advances have created a set of tools that can be used to analyze, model, and design organisms that have specific, valuable functions or address particular problems.
The goal of adapting the biological features of microbes, plants, and animals to serve human purposes is not new. Indeed, through the use of selective breeding, humans have been manipulating the genetic stock of the plant and animal world for millennia. The difference with synthetic biology is that these tools can now be deployed to affect, rapidly and vastly, enzymes, biological systems, and entire organisms.
Synthetic biology has fully emerged as a scientific field and is now offered as an area of study in biology along with biophysics, pharmacology, and systems biology at leading universities, including the University of California, Berkeley; Harvard University; and the Massachusetts Institute of Technology. One of the key features of synthetic biology is that its potential to engineer living organisms not only is an important driver of fundamental research but also (through the functions and synthesized products of these organisms) has direct relevance for immediate commercial application.
This positioning has enabled synthetic biology to become not just a rich field of scientific endeavor but a ripe area for entrepreneurship as well. In the report Tracking the Growth of Synthetic Biology (Wilson Center, 2013), the Wilson Center at Princeton University identifies 508 new facilities conducting research in synthetic biology between 2009 and 2013, 131 of which were new business entities. These facilities were conducting application-oriented work in a variety of areas, including medicines; specialty/fine chemicals; fuels and fuel additives; plastics, polymers, and rubbers; plant feedstocks; nutrients; waste management and pathogen detection/control; dispersants for use in oil spill cleanups; mining; and aquaculture. (Note that this period largely predated the discovery of and subsequent explosion in the application of clustered regularly interspaced short palindromic repeats gene-editing techniques.) Since then, multiple accelerators have emerged that specialize in synthetic biology, including IndieBio in San Francisco and Syndicated at Imperial College London.
SynBioBeta, an organization devoted to supporting research and commercialization in synthetic biology, organizes conferences; develops partnerships; circulates information; and creates ways for researchers, funders, and partners to interact and identify scientific, technical, and business opportunities. SynBioBeta also tracks the number of synthetic biology companies formed and the amount of funding they receive. In 2000, it identified 62 entrepreneurial ventures in synthetic biology, and it subsequently identified an increasing number of start-ups each year, including 579 such start-ups in 2018 (see Figure 3-11). According to SynBioBeta data, funding for synthetic biology companies had risen from less than $250 million in 2009 to $1 billion by 2015, and increased nearly fourfold thereafter to $3.8 billion in 2018 (see Figure 3-12). The two largest fundraisers in 2018 (see Figure 3-13) were Moderna Therapeutics, a Cambridge, Massachusetts–based firm that specializes in drug discovery research using messenger RNA, and Zymergen, an Emeryville, California–based firm that manufactures microbes for industrial use.
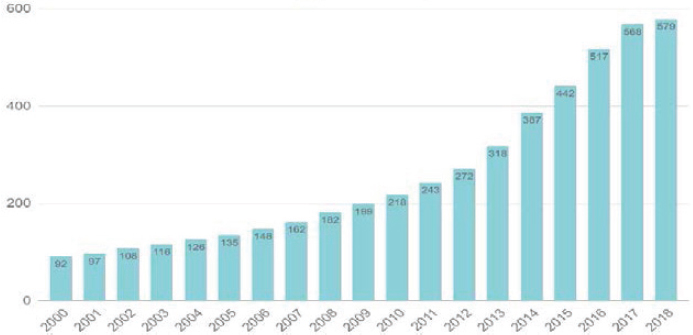
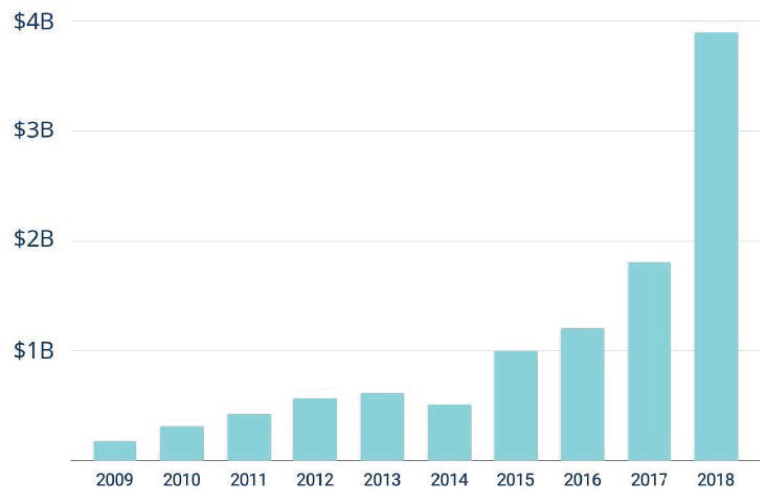
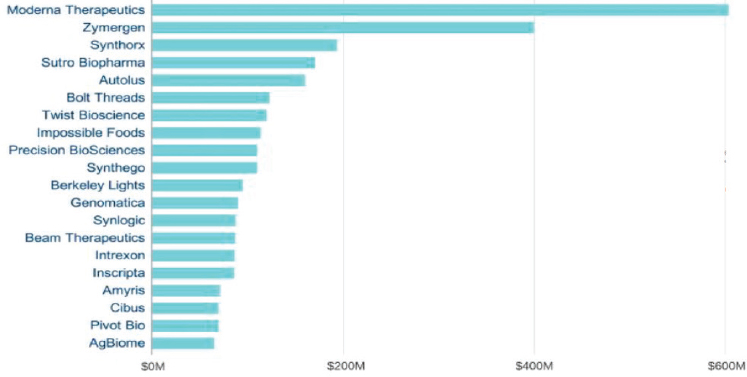
The United States appears to be the world’s leader in synthetic biology enterprises. This leadership is explored in greater detail later in the chapter. SynBioBeta estimates that there were more than 350 U.S.-based firms in this space in 2019. Like many other firms in the life sciences, these firms cluster in the regions around Boston and San Francisco, although there is also considerable geographic dispersion (see Figure 3-14). The Wilson Center (2013) report notes that facilities engaged in synthetic biology research or entrepreneurship existed in 40 of the 50 states as of 2013.
Private Bioeconomy Employment: Biotechnology Research and Development Services
Along with R&D expenditures and entrepreneurship, employment in the bioeconomy is a potentially valuable indicator of the extent and nature of its economic activity. These data are collected by industry and are often difficult to obtain. Employment data are both detailed and timely, however, and available by detailed geographies. Our analysis was focused on employment in the biotechnology R&D services industry as defined by the U.S. Bureau of Labor Statistics’ Current Employment Statistics survey. Importantly, this is potentially an indicator that is correlated with overall bioeconomy employment, but it represents only a subset of the total bioeconomy workforce.
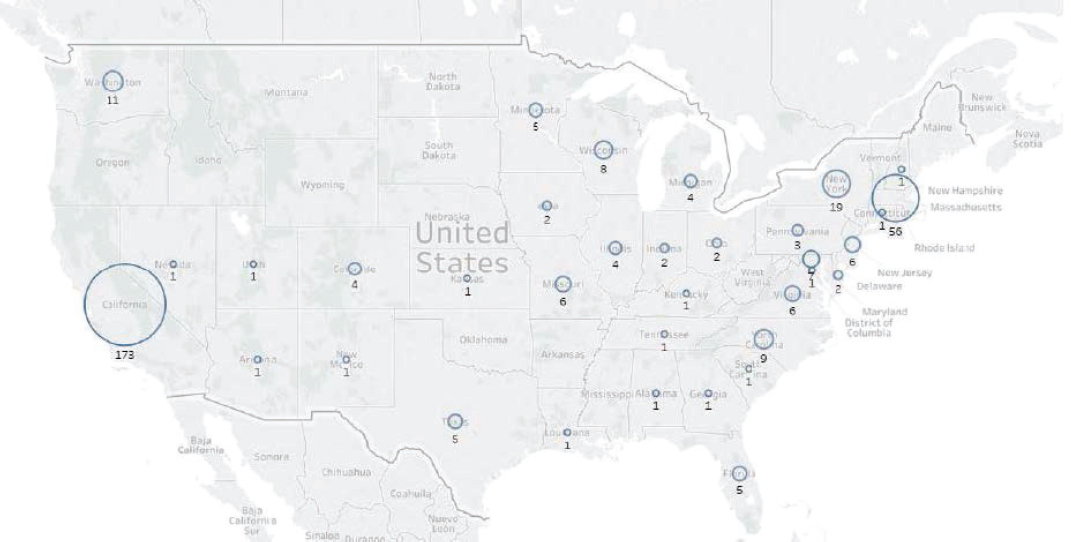
Figure 3-15 presents historical data on the number of nonfarm employees overall and the number employed in biotechnology R&D services. The number of these workers was relatively stable at approximately 100,000 during the 1990s, but it had risen to more than 140,000 by 2008 and, after a modest decline during the Great Recession, has been rising dramatically since 2013, from around 140,000 to more than 200,000 in 2018. Overall (nonfarm) labor has been rising since the Great Recession, but since 2013 it has not increased at nearly the same rate as employment in the biotechnology R&D services industry.
Despite the substantial increase in the biotechnology R&D services workforce, real wages among these workers, like those of all private employees, have risen only somewhat consistently since 2006 (see Figure 3-16). The earnings of biotechnology R&D services workers are, however, nearly double those of other privately employed workers, although there is substantial variation in wages across U.S. regions (see Table 3-6).
A key feature of employment in biotechnology R&D services is that it is geographically concentrated (Feldman et al., 2015). Nearly 20 percent of all these jobs are concentrated in the Boston Metropolitan Statistical Area (MSA), and more than 50 percent are concentrated in the five largest MSAs—Boston, San Francisco, New York, San Diego, and Philadelphia. Altogether, the top 15 MSAs account for nearly 75 percent of the
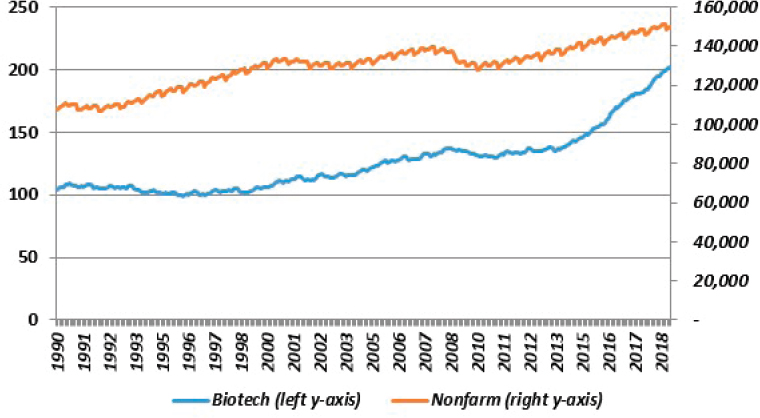
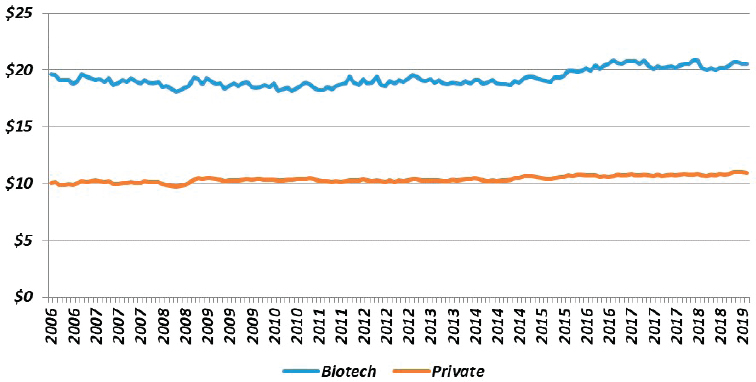
biotechnology R&D services workforce; the remaining 25 percent is dispersed around the country. These figures may not, however, be representative of other segments of the biotechnology workforce (e.g., agricultural bioengineering), which may be less geographically concentrated.
Indicators of Bioeconomy Innovation Outcomes
Patents
Innovation studies have long viewed patents as an indicator of innovation, and as a result, the strengths and limitations of this approach are well understood (Hall et al., 2001; Machlup, 1961; Mansfield, 1986; Pakes and Griliches, 1980; Scherer, 1983). Pakes and Griliches (1980, p. 378) note that “patents are a flawed measure (of innovative output) particularly since not all new innovations are patented and since patents differ greatly in their economic impact.” Furthermore, not all patents represent innovation.
Patents are typically leading indicators of innovation in industries in which they can be closely linked with particular scientific advances, such as new molecular entities, including the chemical and biopharmaceutical sectors (Henderson and Cockburn, 1996; Levin et al., 1987; Scherer, 1983). Scholars are generally cautious when interpreting measures based on
TABLE 3-6 Employment and Wages in Biotechnology R&D Services (Except Nanobiotechnology), U.S. National Totals and the 15 Metropolitan Statistical Areas Accounting for the Most Jobs (2017)
| Metropolitan Statistical Area | Annual Average Employment | Total Annual Wages ($) | Annual Wages per Employee ($) | Percentage of Jobs | Cumulative Percentage | |
|---|---|---|---|---|---|---|
| Jobs | Rank | |||||
| U.S. TOTAL | 179,666 | 29,815,414,623 | 165,949 | 100 | ||
| Boston-Cambridge-Newton, MA-NH | 33,496 | 1 | 6,504,403,104 | 194,187 | 18.6 | 18.6 |
| San Francisco-Oakland-Hayward, CA | 18,023 | 2 | 4,006,327,159 | 222,287 | 10.0 | 28.7 |
| New York-Newark-Jersey City, NY-NJ-PA | 17,830 | 3 | 4,709,751,836 | 264,144 | 9.9 | 38.6 |
| San Diego-Carlsbad, CA | 14,477 | 4 | 2,076,041,842 | 143,403 | 8.1 | 46.7 |
| Philadelphia-Camden-Wilmington, PA-NJ-DE-MD | 13,164 | 5 | 2,217,477,645 | 168,447 | 7.3 | 54.0 |
| Washington-Arlington-Alexandria, DC-VA-MD-WV | 8,129 | 6 | 911,988,678 | 112,185 | 4.5 | 58.5 |
| Baltimore-Columbia-Towson, MD | 7,517 | 7 | 846,006,948 | 112,551 | 4.2 | 62.7 |
| Seattle-Tacoma-Bellevue, WA | 6,981 | 8 | 812,726,542 | 116,421 | 3.9 | 66.6 |
| Durham-Chapel Hill, NC | 2,700 | 9 | 355,531,356 | 131,678 | 1.5 | 68.1 |
| Chicago-Naperville-Elgin, IL-IN-WI | 2,426 | 10 | 407,640,479 | 168,065 | 1.4 | 69.4 |
| San Jose-Sunnyvale-Santa Clara, CA | 2,387 | 11 | 371,108,430 | 155,471 | 1.3 | 70.8 |
| Raleigh, NC | 2,128 | 12 | 301,049,281 | 141,504 | 1.2 | 71.9 |
| Indianapolis-Carmel-Anderson, IN | 1,778 | 13 | 225,105,395 | 126,588 | 1.0 | 72.9 |
| Worcester, MA-CT | 1,698 | 14 | 253,118,792 | 149,091 | 0.9 | 73.9 |
| Dallas-Fort Worth-Arlington, TX | 1,382 | 15 | 133,516,283 | 96,640 | 0.8 | 74.6 |
SOURCE: Quarterly Census of Employment and Wages, Bureau of Labor Statistics. Private, NAICS 541714 Research and development in biotechnology (except nanobiotechnology), All Metropolitan Statistical Areas 2017 Annual Averages, All establishment sizes. See https://data.bls.gov/cew/apps/data_views/data_views.htm#tab=Tables (accessed October 21, 2019).
patent levels, however, and recognize that substantial gaming is possible in the patent system (Jaffe and Lerner, 2004).39
A further challenge of using patents as indicators of bioeconomy innovation is that the value and meaning of such patents have changed over time. Patents remain the main currency of the pharmaceutical industry, as they provide specific protection for molecules approved by the U.S. Food and Drug Administration (FDA) for use in medicines, but their interpretation is different in other sectors of the bioeconomy. For example, the U.S. Supreme Court’s 2013 decision in Association for Molecular Pathology v. Myriad40 invalidated the use of patents for certain types of genetic materials. As a result, some firms in this space retreated from patent-focused strategies, while others continued an approach in which patenting played a key role in securing intellectual property rights.
A comprehensive analysis of the size of the bioeconomy would identify a series of patent classes consistent with definitions of the bioeconomy and compute their patent output, focusing primarily on changes in patenting over time. Such comparative, longitudinal analyses are more informative than point-in-time (cross-sectional) analyses, as they minimize the difficulties of interpreting what each patent means by focusing on relative rather than absolute levels of patenting. Analysis of global leadership in bioeconomy sectors is discussed in the Chapter 4.
New Biobased Products and Production Processes
Although optimism about the future outputs of biotechnology R&D is substantial (see, e.g., NASEM, 2017), evidence of strong growth in biotechnology outcomes is mixed. While pharmaceutical R&D appears to have experienced productivity declines in recent decades, the number of Biological License Applications for new biological drugs has increased, as have registrations to the U.S. Environmental Protection Agency (EPA) of products with microbial commercial activity. The number of gene clusters tested in submissions of products for field releases to USDA’s Animal and Plant Inspection Service is also up (NASEM, 2017).
Findings of recent academic research on productivity in pharmaceuticals and biotechnology are mixed. Numerous authors suggest that pharmaceutical R&D is experiencing a productivity slowdown, despite advances in biotechnology and data-driven discovery efforts. For example, Pammolli and colleagues (2011) argue that productivity in pharmaceutical
___________________
39 This subject is addressed in many studies and applications (e.g., Marco and Miller, 2019; the Innovation-alpha Stock Price Indexes developed by M-CAM), and is the impetus behind changes in processes undertaken by the U.S. Patent and Trademark Office (e.g., Graham et al., 2018).
40 569 U.S. 576.
R&D has indeed been decreasing, and that the decrease is not simply a result of demand and competition but results, at least in part, from firms directing their R&D efforts toward complex therapeutic areas with a historically low likelihood of success. Gittelman (2016) suggests that a shift away from clinical research paradigms may have played a role in the slowdown. Cockburn (2006) is more optimistic about the data, noting that many pessimistic estimates account insufficiently for inflation in health care R&D costs and thus overestimate pharmaceutical R&D spending, resulting in an underestimate for productivity.
Other authors note that increases in the cost of pharmaceutical R&D are real, and that they reflect increasingly high costs of clinical testing, as well as rising costs of preclinical discovery (DiMasi et al., 2016). Specifically, they note that “aggregating across phases, we found an out-of-pocket clinical period cost per approved new drug estimate of $965 million and a capitalized clinical period cost per approved new drug estimate of $1,460 million. In constant dollars, these costs are 2.6 and 2.4 times higher than those we found in our previous study, respectively” (DiMasi et al., 2016, p. 25).
Overall, pharma performance measured in terms of new molecular entities and the productivity of global R&D spending in these terms has not been encouraging, despite decades of optimism as a result of scientific breakthroughs (see Figures 3-17 and 3-18).
Biotechnology-Based Pharma Versus Other Pharma (Except Diagnostics)
Firm sales and productivity in the bioeconomy are difficult economic concepts to measure, as economic data are typically focused on specific industries rather than on technological approaches within industry. However, insights can be gained about the bioeconomy by examining some detailed sales data collected by NSF from R&D-performing firms only. Figure 3-19 reports worldwide sales for U.S.-based firms in selected industries that engaged in or funded R&D. The data cover sales for firms in “pharmaceutical, medicinal, botanical, and biological products manufacturing (excluding diagnostics),” which are referred to here as “other” pharmaceuticals and plotted on the right-hand axis of the figure; sales of some other relevant groupings are shown on the left-hand axis. One notable feature of these data is that sales of other pharmaceuticals are an order of magnitude greater than those for the other groupings shown.
A second notable feature—one especially relevant to analyzing the bioeconomy—concerns the growth in sales of biotechnology-based pharma and biotechnology products (by R&D-performing firms). Data for this component begin in 2013, at $40 billion, and are more than double 4 years later (sales were $91 billion in 2016). This may augur hope relative
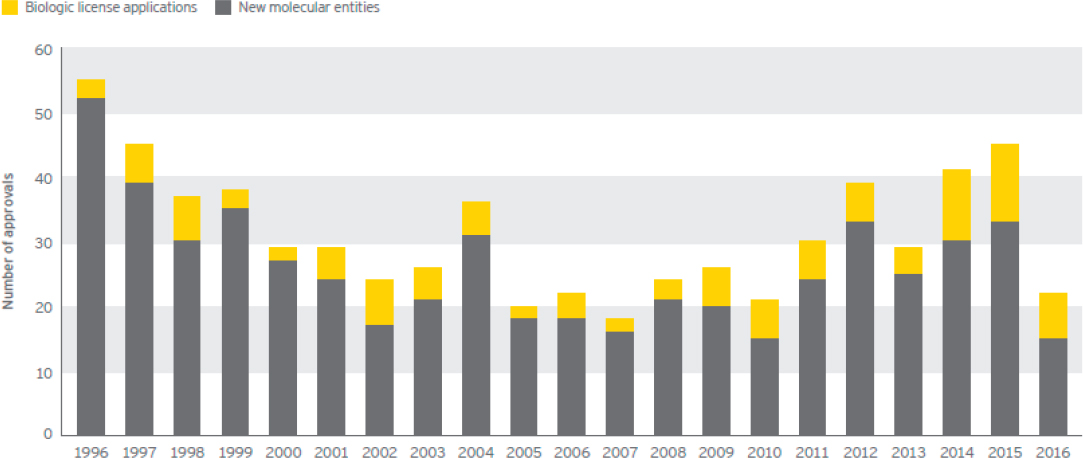
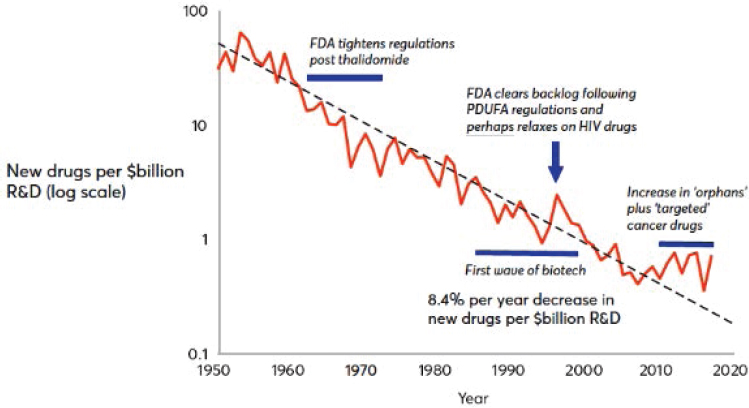
to the challenges of drug discovery highlighted in the previous section. By contrast, sales of biotechnology research services (R&D-performing firms only) in 2016 were lower than they were 5 years earlier. Figure 3-19 replicates the prior figure, focusing on domestic sales by U.S.-based firms rather than worldwide sales; the patterns in these data are similar to those in the worldwide sales data. Domestic sales are 75 percent of worldwide sales for other pharmaceuticals and 85 percent for biotechnology-based pharmaceuticals and biotechnology products (see Figure 3-20). It is important to note that, while the change in the extent of sales of biotechnology-based products is substantial, the sales of such products are only a small fraction of the level of sales of pharmaceutical products that are not biotechnology based.
Other Innovation Outcomes and Outputs
Microbial commercial activity notices
The Toxic Substances Control Act (TSCA) gives authority to EPA to review industrial platforms that employ biotechnology. EPA has published data on the applications it has received under TSCA up to June 2016. Figure 3-21 plots the number of Microbial Commercial Activity Notice submissions received by EPA by year of application for 1998–2015. The initial rate of these registrations was quite low, but they doubled in 2013 and 2014 relative to prior years and more than tripled in 2015 relative to 2013 or 2014, reaching 35 in 2015.
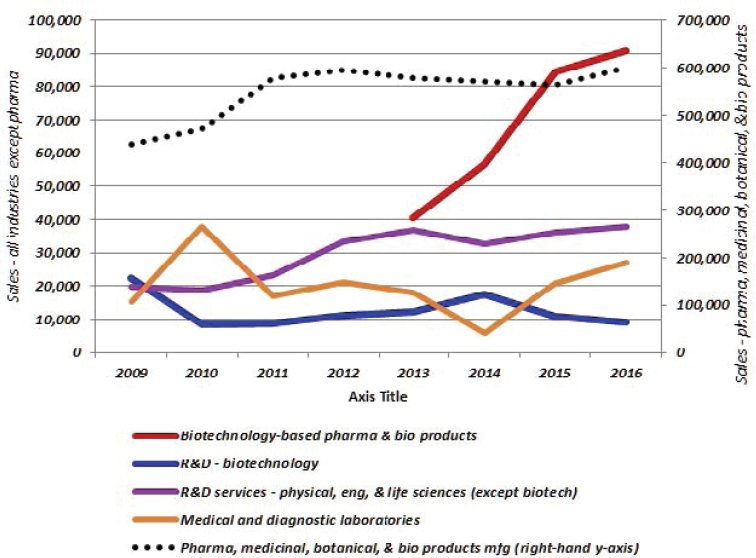
Agricultural outputs
There are a number of perspectives on which agricultural products should be included in a definition of the bioeconomy. Most European agencies take a broad view, including such sectors as food, beverages, tobacco, and wood products that either produce or rely on biologically produced materials. In this report, those agricultural products derived from R&D in the life sciences are considered to be included in the bioeconomy. These would include, among others, corn, cotton, forestry products, and sugar products that fall under any of the four criteria described in Chapter 2. A detailed analysis of the nature of these products and estimates of their contributions to economic value can be found in reports on the economic impact of biobased products, including Daystar et al. (2018) and Golden et al. (2015). While such a detailed analysis exceeds the scope of this committee, we nevertheless present data on a number of key agricultural outputs (i.e., those related to GM crops).
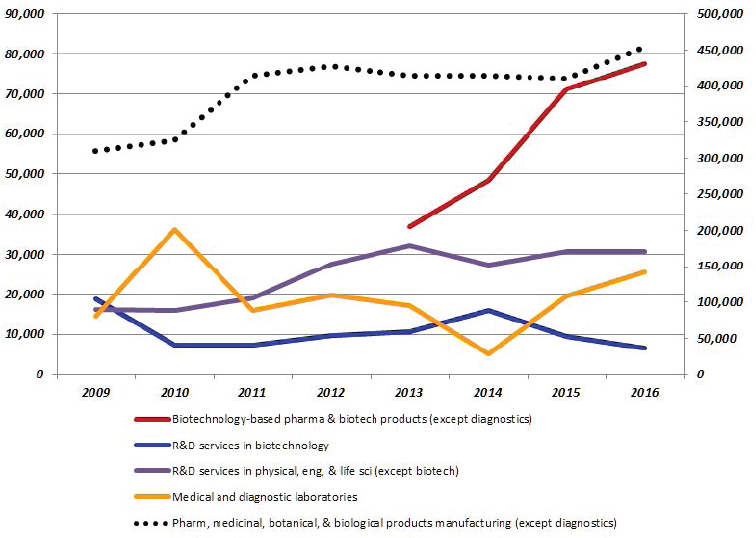
Crop varieties can be genetically modified to be herbicide tolerant (HT), allowing fields to be sprayed with herbicides that kill weeds without damaging the crops. They have also been genetically modified through the insertion of genes from the soil microbe Bt (Bacillus thuringiensis), which generate several proteins that are toxic to certain insect pests. Corn, cotton, and soybean seed varieties with HT traits, Bt traits, or both (known as stacked varieties) first became commercially available in the mid-1990s. Direct data on sales values of GM crops are not regularly collected in the United States.
By 2018, more than 90 percent of corn, cotton, and soybean acreage in the United States had been planted with varieties with the HT trait, while more than 90 percent of corn and cotton acreage had been planted with varieties with the Bt trait (see Figure 3-22). Data for GM sugarbeets, alfalfa, and canola are not collected as frequently, but as of 2013, 95 percent of U.S. canola acres, 99 percent of sugarbeet acres, and 13 percent of alfalfa acres were planted with GM HT seed varieties.
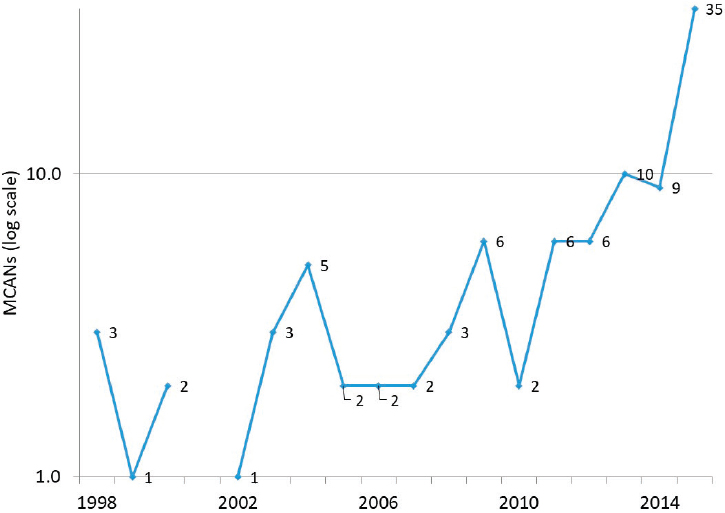
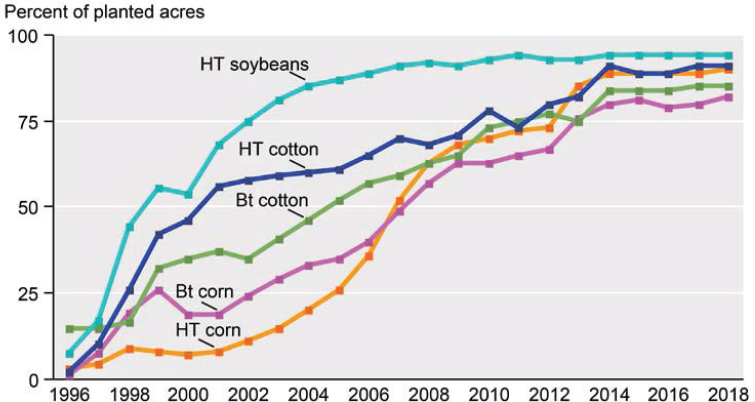
USDA’s Economic Research Service reports on the adoption of GM crops in the United States. Data for 2017 are presented in Table 3-7. Estimates for corn, soybeans, and cotton are for 2017, while those for alfalfa, sugarbeets, and canola are for 2013 (Fernandez-Cornejo et al., 2016). Data for crop sales come from USDA’s 2017 Census of Agriculture (USDA NASS, 2017). In total, GM crops accounted for nearly half of the total sales value of all U.S. crops in 2017. Crops for which GM varieties are available accounted for 56 percent of total 2017 crop sales. Assuming that crop revenues are proportional to acreage, these data imply that GM crops accounted for nearly 48 percent of all U.S. crop revenues with more than $92 billion in sales in 2017.
Biofuels
Biofuels represent an important alternative to fossil fuels. In the United States, the development of this sector has been encouraged by a series of policy initiatives. For example, the 2005 Energy Policy Act and 2007 Energy Independence and Security Act introduced a series of subsidies, tax credits, loans, direct grants, and standards intended to support R&D for biofuels, including ethanol, biodiesel, and cellulosic. By 2012, biofuels constituted more than 7 percent of total fuel consumption in the United States. Approximately 94 percent of the biofuel produced is ethanol (USDA ERS, n.d.). Figure 3-23 documents the rise in U.S. biofuel production between 2001 and 2017, during which time the production of biofuel increased from slightly less than 2 billion gallons to nearly 16 billion gallons.
TABLE 3-7 Sales, Acreage, and Value of Selected Genetically Modified (GM) Crops in the United States, 2017
| Crops | Sales ($ billions) | Percentage of U.S. Crop Sales | Percentage of Acreage Planted to GM Crops | Imputed Percentage of U.S. Crop Sales from GM Crops | Imputed Gross Revenues from Sales of GM Crops (2017 $billions) |
|---|---|---|---|---|---|
| All U.S. crops | 193.5 | ||||
| Crops with commercially available GM seed varieties | |||||
| Corn | 51.2 | 26.0 | 89.0 | 23.6 | 45.6 |
| Soybeans | 40.3 | 21.0 | 94.0 | 19.6 | 37.9 |
| Cotton | 6.7 | 3.0 | 91.0 | 3.1 | 6.1 |
| Alfalfa | 8.2 | 4.0 | 13.0 | 0.5 | 1.1 |
| Sugarbeets | 1.5 | 1.0 | 99.0 | 0.7 | 1.4 |
| Canola | 0.5 | 0.3 | 95.0 | 0.3 | 0.5 |
| Subtotal, GM crops | 56.0 | 47.8 | 92.6 | ||
SOURCES: Fernandez-Cornejo et al., 2016; USDA ERS, n.d., USDA NASS, 2017.
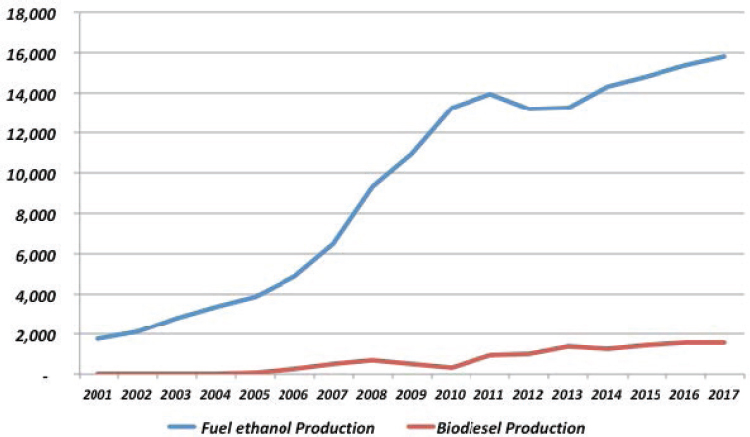
CONCLUSIONS
This chapter has reviewed the resources devoted by the United States to investments in the bioeconomy and examined how to measure the bioeconomy and assess its economic contributions to the larger U.S. economy. On the basis of this discussion, the committee arrived at the following conclusions.
Conclusion 3-1: The sector-specific aspects of the bioeconomy, its diffusion across industries, its potential for large societal benefits, its large science base and reliance on data-intensive research, the closeness of commercial innovation to a science base, and a high relative cost of commercial innovation make it difficult both to track the bioeconomy’s contribution to the larger U.S. economy and to assess its prospects for future innovation.
Conclusion 3-2: A targeted and specialized framework for analyzing the bioeconomy’s innovation ecosystem is needed—an approach that both looks broadly at investments in innovation (including investments in data and existing data analytic tools) and accounts
for all bioeconomy-specific new product investments (e.g., improvements in the efficiency of nondrug regulatory testing).
Conclusion 3-3: In some key areas, North American Industry Classification System code categories for economic sectors are currently too broad to capture activities within the bioeconomy accurately. In some cases (such as genetically modified crop production), practitioners have relied on secondary sources to augment aggregate sector data. Refining categorization of certain activities within broad categories of chemical manufacturing, research and development, and computer and electronic product manufacturing would facilitate future measurement of bioeconomy activities.
Conclusion 3-4: A satellite account system for the bioeconomy that includes the appropriate interindustry relationships for biobased production, a full articulation of the foreign versus domestic sources of supply for bioeconomy products, and a full accounting of the bioeconomy’s intangible assets and databases (including ownership) is needed. If optimally designed to meet this need, the account would also, to the extent possible, incorporate quality-adjusted price deflators for bioeconomy products (e.g., biopharmaceuticals and biomedical equipment).
By applying its analysis of the available data gathered for this study, the committee carried out a pilot experiment to assess the various approaches for measuring the value of the bioeconomy.
Conclusion 3-5: The results of the committee’s pilot valuation experiment are as follows: economic activity driven by the bioeconomy accounted for nearly 5.1 percent of the gross domestic product (GDP) in 2016 and could reach up to 7.4 percent if currently available biobased production processes were to completely displace nonbiological processes. This is a current guideline only because the panel’s definition of the bioeconomy is meant to be “living.”
Conclusion 3-6: The share of biobased materials and biotechnology-based products and production methods in the U.S. industrial sector has grown substantially in the past 15 years and is expected to continue to displace non-biobased materials and methods in the future. The continuation of biomedical breakthroughs, such as new drugs and targeted, yet broad, data-based medical solutions, will require continuing national investments in basic research and biological databases, as well as in the enablement of commercial innovation.
Annex 3-1
Studies of the Industrial Bioeconomy (Including Agriculture)
OVERVIEW OF THE LITERATURE
Several studies have taken a sector-based approach to defining and measuring the contribution of the industrial bioeconomy to a country’s or region’s overall economy. In these studies, economic activity within the bioeconomy is defined in terms of a country’s system of national accounts, using North American Industry Classification System (NAICS) codes, in the United States and Canada; the European Union’s (EU’s) Nomenclature générale des Activités économiques dans les Communautés Européennes (NACE) codes; or United Nations input-output tables. One goal of these studies is often to measure the size of the bioeconomy in terms of the section’s employment or gross value added relative to the larger economy. Another is to apply input-output modeling techniques to assess how sectors included in the bioeconomy interact with other sectors in the broader economy. However, a challenge is that the “bioeconomy cuts across sectors and therefore cannot be treated as a traditional sector in economics” (Wesseler and von Braun, 2017).
Expert researchers follow a two-step process. First, certain sectors are considered wholly within the bioeconomy (this approach may encode entire sectors within NAICS or NACE codes). Next, for remaining sectors, researchers assume either that all activities are considered outside the bioeconomy or that some are considered to have some subactivities within the bioeconomy, while others are designated as outside. For example, steel manufacturing would lie completely outside the bioeconomy, while electricity generation comprises biomass-generated electricity (within) and other generation (without).
A key problem is that NAICS and NACE codes often do not make a fine enough distinction within industries to separate components considered inside and outside of the bioeconomy definition. A common approach to addressing this limitation is to conduct industry surveys to determine which type of production within a sector may be “biobased.” For example, plastics manufacturers may be surveyed to determine how much of their employment and production is devoted to bioplastics. This subset of bioplastic production would then be included as part of the bioeconomy.
EU economic policies are increasingly focused on a “circular economy,” in which use of resources is maximized and waste is minimized, instead of a “linear economy,” in which “take,” “make,” and “dispose” are primary elements. A circular economy employs a regenerative approach, including design for longevity, reuse, repair, and recycling as foundational elements. Not surprisingly, the term “circular bioeconomy” has gained traction in the European Union, and policies are being developed to maximize the use of biobased resources regarded as wastes (such as agricultural and forestry residues), with the long-term objective of gradually replacing fossil-based with biobased production (Philp and Winickoff, 2018).
Studies vary greatly in what sectors and activities within sectors are considered part of the bioeconomy, with distinct differences in particular between studies on North America and those on EU countries and Japan. EU studies tend to use relatively broad definitions, including sectors in their entirety that produce or fundamentally rely on biologically produced materials. For example, not only are primary sectors (agriculture, forestry, fisheries) included, but also food, beverage, tobacco, and wood products manufacturing. For other sectors, such as chemical manufacturing, researchers frequently conduct surveys to divide sectoral activity into biobased and other categories. In the United States and Canada, there has been a greater emphasis on applications of biotechnology, biological research and development (R&D), and substitution of biobased for fossil fuel–based products in manufacturing. Primary sectors (agriculture, forestry, and fisheries) are treated largely as outside the bioeconomy. Major exceptions are genetically modified (GM) crops and crops or trees grown specifically for energy production.
Lier and colleagues (2018) conducted a survey of EU government ministries tasked with monitoring bioeconomy performance or developing bioeconomy strategies. The survey asked respondents which NACE code activities were completely, partly, or not included in the bioeconomy sector. European ministries included primary sectors along with food, paper, and wood product manufacturing entirely. Only one study (by Ehrenfeld and Kropfhäußer, 2017) followed the approach of North American analyses, examining biological science R&D as part of the bioeconomy.
In general, North American studies do not include entire NAICS sectors in their definitions of bioeconomy sectors. They often rely on survey-based data collection within traditional sectors, focusing on novel technology applications to traditional sectors (e.g., GM crops), substitution of biobased for fossil fuel–based production (e.g., bioplastics), and biological R&D. In response, Carlson (2016) proposes three key additions to the NAICS system to improve its utility in delineating the size of the biotechnology sector (see Box 3-3 in the main chapter text).
Another approach input-output modelers have taken is to impute the contribution of the bioeconomy to other sectors. Researchers assume that the contribution of the bioeconomy to value added in a sector is proportional to the share of biologically produced inputs in that sector’s production costs. So, for example, there would be virtually no bioeconomy value added derived from the steel sector, but a relatively large contribution from sectors using crop, fiber, and timber products. Efken and colleagues (2016) thus have a definition of the bioeconomy that extends to the retail grocery and restaurant sectors, arguing that “these industries only exist due to the fact that they process (picking and packing, preparing, offering) biological resources.” The imputation approach avoids the need to conduct surveys of industries within NAICS or NACE codes. Instead, it relies on basic data from national input-output tables, with sectoral data reported similarly across countries. Using such an all-encompassing definition, however, means that quite traditional primary sectors, processing sectors, and service sectors that repackage and serve biologically derived goods account for the bulk of employment and value added attributable to the bioeconomy. This definition is far removed from one that focuses on novel biological technologies or even biobased substitution for fossil fuel–based production.
The estimates of the bioeconomy reported in Chapter 3 rely heavily on the studies of Carlson (2016, 2019) and Daystar et al. (2018). Therefore, those studies are reviewed in detail below.
CARLSON (2016, 2019)
Carlson (2016, 2019) collected data on gross sales revenues from industrial biobased activities. While his approach has the advantage of relying on data that “are publicly available at no cost or obtainable with minimal registration from sources on the Internet,” some problems are entailed in comparing gross sales with the gross domestic product (GDP).41 That said, Carlson’s work, within its circumscribed boundary, is the most definitive to date.
___________________
41 Gross sales are not the same as value added. Value added is the difference between gross output (sales) and intermediate inputs and represents the value of labor and capital used in producing gross output. The sum of value added across all industries is equal to GDP for the economy. In the United States, total gross sales are 1.7 times GDP. Carlson (2016) acknowledges the limitations of using gross sales, noting this approach “may include some double counting.” In later work, Carlson (2019) attempts to correct this limitation; for example, corn used to produce biofuels is not double-counted. However, double-counting elsewhere in his estimates is still a problem. On the other hand, as noted in the main text of Chapter 3, studies that infer total economy effects via interindustry linkages produce larger impacts relative to isolating value added alone, and though imprecise, estimates based on gross output are closer to these broader-based estimates.
According to Carlson’s estimates, U.S. genetically modified organism revenues were 2 percent of U.S. GDP in 2017 (see Figure Annex 3-1-1), about the same as 5 years earlier but up substantially since 2000, when the sector accounted for just 0.6 percent of GDP (Carlson, 2016, Table S1, 2019). Industrial biotechnology was the fastest-growing subcomponent of these estimates prior to 2012, and despite an unchanged ratio to GDP since then, within industrial biotechnology, revenues from biopharma ingredients have gained ground in relative terms (see Figure Annex 3-1-2).
Emerging R&D services are small in Carlson’s estimates, about $2 billion. Official statistics from the U.S. Census Bureau for the biotechnology segment of the R&D services industry suggest that revenues in 2012 were much larger ($16.9 billion), but they were similar in that they reflect little evidence of growth.
In the U.S. Census Bureau statistics, revenues from R&D biotechnology services in 2012 were down slightly from the level reported in 2007 ($17.4 billion). This decline contrasts with R&D service revenues in other life sciences, which were $40.0 billion in 2012, up from $26.2 billion 5 years earlier. It is possible that genomics companies are in the latter category, or that a company such as Illumina, which sells sequencing machines as well as genomic services, is somewhere else entirely. The figures quoted are details from the 2012 economic census; detailed results from the 2017 economic census are not yet available. Annual product-level figures from the Census Bureau’s Services Annual Survey do not report data for R&D services, much less components by type of R&D service.
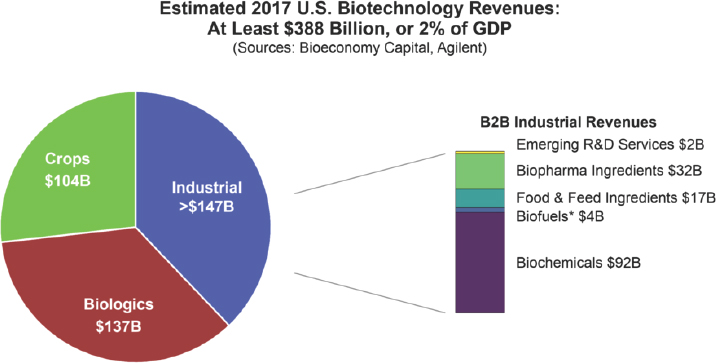
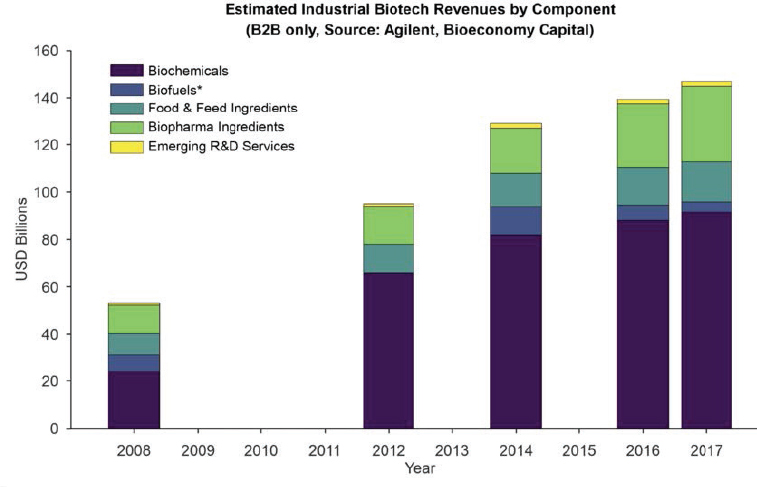
Sales by R&D-performing firms within the R&D services industry are reviewed in the main text of Chapter 3.42 The patterns in those data compare favorably with the comprehensive figures from the 2007 and 2012 economic censuses and with Carlson’s estimates, suggesting the utility of a broader regular collection of the more timely annual revenue data for bioeconomy firms in the services industries. The National Science Foundation’s (NSF’s) data on sales are of course smaller than the U.S. Census Bureau’s revenue data because not all firms in the R&D services industry conduct scientific R&D; the NSF data are 60 percent of U.S. Census Bureau revenues for biotechnology and 75 percent of revenues for the other life sciences segments in 2012. The downtrend in sales by R&D-performing firms in the biotechnology R&D services industry and increase in the other category of R&D services (which includes other physical sciences along with other life sciences) are evident in both surveys.43 Carlson’s
___________________
42 Data available for download at https://ncses.nsf.gov/pubs/nsf18313/#data-tables&.
43 Note also that the share of biotech revenues in 2012 by class of customer did not change materially between the two census years; that is, revenue from governments and nonprofits accounted for 10 percent of the total in each year, which suggests that the flagging performance of this segment is market driven.
estimates for “biopharma ingredients,” while at a lower level because of the absence of manufacturers’ markup, exhibit growth similar to that for sales by R&D-performing firms in biopharma. This result underscores the utility of Carlson’s recommendation to segment product revenue data for the pharmaceutical industry along biotechnology/bioproduct lines.
Industrial biotechnology revenues in the Carlson system reflect business-to-business transactions and therefore understate the impact of biotechnology, because consumer biobased products (e.g., replacements for plastic wraps, biobased ink pens, personal genetic histories) are not necessarily captured. Consumer biobased products are one of the drivers of the synthetic biology start-up business segment of the bioeconomy discussed in the main chapter text. No studies or industry estimates assign a revenue figure to the consumer-driven portion of this activity, despite ample evidence of the importance of doing so. Consumer-oriented genomics companies (e.g., 23andMe), along with biobased consumer food companies (e.g., Impossible Foods), are becoming household names today.
DAYSTAR ET AL. (2018)
The U.S. Department of Agriculture commissioned the Daystar et al. (2018) report, the fourth in a series of reports tracking the impact of the biobased product industry on the U.S. economy. The sectors included in this report are
- agriculture and forestry,
- biobased chemicals,
- bioplastic bottles and packaging,
- biorefining (food),
- enzymes,
- forest products, and
- textiles.
The report specifically excludes the energy, livestock, feed, and pharmaceutical sectors.
Daystar and colleagues (2018) conducted an extensive input-output modeling exercise to trace biobased spending through the broader U.S. economy, including calculating economic multiplier effects. The report also examines environmental benefits; the economic impacts of biobased exports; and areas in which the use or manufacturing of biobased products could be more effective, including identifying technical and economic obstacles and recommending how those obstacles could be overcome.
In their analysis of environmental benefits, the authors endeavor to quantify how the production and use of biobased products reduce
greenhouse gas (GHG) emissions via displacement of petroleum-based products. They estimate that the petroleum saved by a 100 percent shift to biobased products (in the industries considered) would amount to as much as 9.4 million barrels of oil, based on 2016 data. In terms of reductions in GHG emissions, they estimate the reduction attributable to the biobased products industry to be as much as 12.7 million metric tons of carbon dioxide equivalent in 2016.
The strength of this study is in its methodology and its detailed coverage of certain biobased chemicals, enzymes, and biorefining of food. These areas encompass a complex and detailed set of products and processes that are difficult to identify in readily available data. For example, an area unearthed in the report’s data is enzymes, specifically “other enzymes” identified as produced by NAICS 5 Digit Industry 32519—Other Basic Organic Chemical Manufacturing. This industry comprises establishments engaged primarily in manufacturing basic organic chemicals (except petrochemicals, industrial gases, and synthetic dyes and pigments) and includes enzyme proteins (i.e., basic synthetic chemicals), except those for pharmaceutical use.
In Daystar and colleagues’ (2018) report, total enzymes also include biologics (NAICS 325414). The report estimates that total value added by the two enzyme subsectors rose dramatically in 2016, and that the combined type II multiplier for these subsectors is very large at 4.4 (see the stacked bar to the far right in Figure Annex 3-1-3).
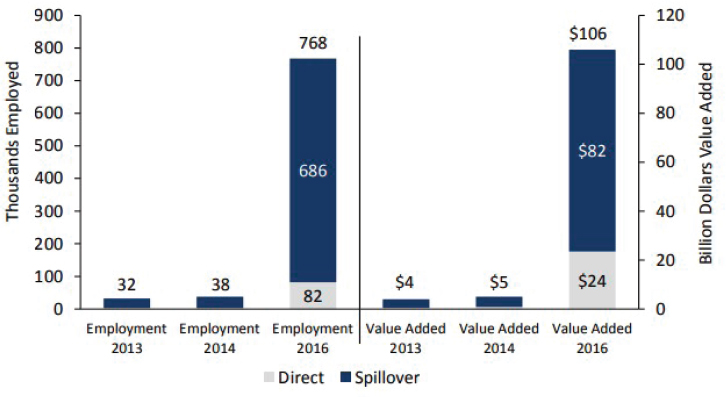
Annex 3-2
Identifying Intangible Assets
A widely used framework for studying intangible investment is summarized in Table Annex 3-2-1. Column 1 of the table lists the types of spending that are included as investments under this framework. This framework is used to study the productivity and growth impacts of innovation, typically in conjunction with the empirical neoclassical theory–based “growth-accounting” approach to measuring and studying the drivers of economic growth, including in macro-policy and international comparative settings.44 In the United States, business intangible investment overtook business tangible investment in the 1990s, suggesting that intangibles have been a driver of U.S. economic growth since that time (see Figure Annex 3-2-1). By this metric, major economies in Asia (China, Japan) and most European economies are behind the U.S. economy.45
There are, of course, other frameworks for studying innovation and growth (e.g., endogenous growth theory and Schumpeterian growth theory).46 These frameworks and the intangible capital approach rooted in neoclassical theory are, in fact, closely related and not mutually exclusive. Endogenous growth theory focuses on the impacts of scientific knowledge and suggests that the long-run growth rate of an economy reflects its propensity to invest in new ideas. Although the notion that taxes, research subsidies, researcher supply, and intellectual property (IP) rights can influence economic growth via their impacts on investments in R&D predates endogenous growth theory, the emergence of that theory firmly grounded these tools as supporting long-run macroeconomic growth. Schumpeterian approaches emphasize that innovation is associated with
___________________
44 See, e.g., Corrado et al. (2013, 2018), OECD (2013), and Thum-Thysen et al. (2017) for the European Commission, and discussions in the 2006, 2007, and 2008 issues of the Economic Report of the President of the United States. Note that the framework is aligned with national accounts estimates consistent with the System of National Accounts 2008 (EC et al., 2009) to the extent that gross fixed capital formation includes computer software (which is believed to capture private databases); research and development (R&D); mineral exploration; and entertainment, artistic, and literary originals (i.e., the first five items listed in column 2 of Table Annex 3-2-1).
45 The comparison is based on updated estimates of intangible investment in market sector industries for the European Union, Japan, and the United States as reported in Corrado et al. (2013) and OECD (2013); estimates for China cover all sectors of its economy (Hulten and Hao, 2012). For further information, see www.intaninvest.net.
46 Endogenous growth theory stems from the contribution of Romer (1990); Schumpeterian theory was set out in a formal economic model by Aghion and Howitt (1992).
TABLE ANNEX 3-2-1 Categories and Types of Intangible Investment
| Category | Types of Intangible Investment | Examples of Intangible Assets |
|---|---|---|
| Computerized information |
|
|
| Innovative property |
|
|
| Economic competencies |
|
|
SOURCES: Corrado and Hulten, 2010, based on Corrado et al., 2005.
“creative destruction,” in which the profit stream of a previous innovator is destroyed by the creation of a new innovator; this phenomenon suggests that policies aiming to balance IP protection against the profit-driven benefits of competition are warranted (and that there is much going on behind the macro-oriented approaches). The intangible framework tracks specific investments and mechanisms that drive commercial innovations based on breakthroughs in science (or other novelties), emphasizing the context-driven aspects of growth dividends to specific investments in specific industries.
With respect to valuing intangible assets, they are commonly regarded as company assets that are not physical.47 Knowledge creation underlies the value of intangible assets (i.e., the types of spending listed in column 2 of Table Annex 3-2-1 produce knowledge of commercial [or public] value, examples of which are shown in column 3). As indicated in the main chapter text, replacement cost estimates are developed from time-series data on real investment using the “perpetual inventory method.” That method cumulates real investments, period by period, after subtracting an estimate of economic depreciation during the period (the loss in the asset’s value due to aging, holding time used in production constant).
___________________
47 This is the view in financial accounting under U.S. Generally Accepted Accounting Principles; the definition there is simply “assets (not including financial assets) that lack physical substance.”
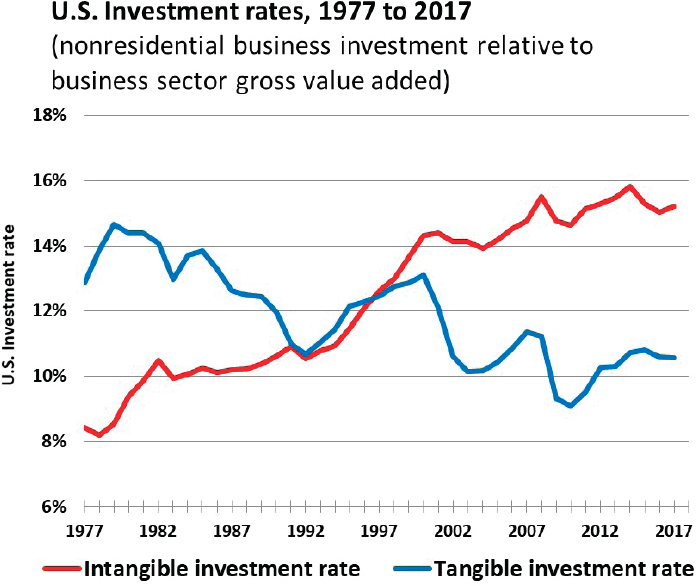
This calculation produces an estimate of the volume of the stock; the value of the stock at replacement cost is obtained by multiplying the volume estimate by today’s price.48 Note that in companion wealth accounts, the national accounts’ estimates of corporate assets at replacement cost are reconciled with the valuation of corporations in capital markets, connecting national accounting valuations to market valuations.49 Some of the earliest studies of intangibles were motivated by the observation
___________________
48 Note that a simple accumulation and correction for economic depreciation assumes that there are no natural disasters or noneconomic events that diminish the volume of net stocks; in practice, these “other changes in volume” are accounted for when such events (e.g., a hurricane) destroy capital. Note also that replacement cost differs from both the historical cost approach used in U.S. Generally Accepted Accounting Principles–consistent company financial accounts and the mark-to-market, or fair value, method that the International Financial Reporting Standards allows.
49 “Companion wealth accounts” refers to the Integrated Macroeconomic Accounts (IMAs) produced jointly by the Bureau of Economic Analysis and the Federal Reserve Board. The IMAs present a sequence of accounts that relate income, saving, investment in real and financial assets, and asset revaluations to changes in wealth.
that firms’ market valuations were systematically higher than both the value of the capital reported on corporate balance sheets and the tally of corporate assets at replacement cost in national accounts (e.g., Hall et al., 2001; Lev, 2001).
The replacement cost method for obtaining estimates of intangible assets depends on identifying consistent time series on investment in each asset and estimating a depreciation rate for the asset. Purchases of assets are relatively easy to track because a market transaction takes place; however, many intangible assets are developed within organizations. Estimates of this type of investment—called own-account investment—are based on the cost of the internal operation used to produce the asset. Regular surveys reveal the costs of the conduct of R&D within organizations. National accounts and the empirical literature on measuring intangibles (e.g., Corrado et al., 2009, 2013) exploit data on employee compensation by occupation (e.g., software engineers) to develop estimates of own-account investment in other intangible assets for industries or subsectors of the economy.50
Regarding depreciation rates, the notion that an asset’s value will decline over time as a result of wear and tear or technological obsolescence is easy to understand, but estimating the rate at which this process takes place for a specific asset or class of assets is highly data demanding, and such estimates are few in number. Studies that consider estimation of depreciation for intangibles have shown that rates of depreciation for these assets vary by country, by industry, by firms within an industry, and over time.51 And studies comparing rates of depreciation by asset type generally have found that R&D, design, and artistic assets are relatively long-lasting compared with software, organizational capital, and other economic competencies (training and brand).
In the context of a depreciation rate for an intangible asset, the idea is to capture the expected period of time for which the investment will yield returns. Based on a review of the literature and the conduct of new work (Li and Hall, 2019), the Bureau of Economic Analysis (BEA) concluded that it would hold the depreciation rate for business R&D for the national accounts fixed over time but allow it to vary by industry. On this basis, the rate of depreciation is estimated to be relatively rapid for R&D conducted by the computer equipment, computer system design, instruments, and software industries (22 to 40 percent per year). For pharmaceutical R&D, BEA uses a depreciation rate of 10 percent per year. For the scientific R&D industry (which includes a large share of biotech firms), BEA uses an R&D
___________________
50 The wage costs are converted to estimates of total costs based on statistics for market production of similar activities/products.
51 See the review and summary in Li and Hall (2018) (especially Table 1).
depreciation rate of 16 percent. A lower estimated rate of R&D depreciation in one industry compared with another is generally thought to be due to either a slower pace of technological change or a lesser degree of market competition (see Li and Hall [2019] for further discussion).
REFERENCES
AAAS (American Association for the Advancement of Science). 2019. Research by science and engineering discipline. https://www.aaas.org/programs/r-d-budget-and-policy/research-science-and-engineering-discipline (accessed December 20, 2019).
Aghion, P., and P. Howitt. 1992. A model of growth through creative destruction. Econometrica 60(2):323–351.
Ahmadpoor, M., and B. F. Jones. 2017. The dual frontier: Patented inventions and prior scientific advance. Science 357(6351):583–587.
Arboleda, H. 2001. Satellite accounts for agribusiness. Resource Paper Annex 5. Papers Presented at the Expert Consultation on Agricultural Statistics, 11–14 September. Bangkok, Thailand: UN FAO.
Arora, A., S. Belenzon, and A. Patacconi. 2019. The decline of science in corporate R&D. Strategic Management Journal 39(1):3–32.
Arrow, K. J., and G. Debreu. 1954. Existence of an equilibrium for a competitive economy. Econometrica 22(3):265–290.
Biasi, B., and P. Moser. 2018. Effects of copyrights on science—evidence from the U.S. book republication program. CEPR discussion papers 12651. doi: 10.3386/w24255.
Bresnahan, T. F., and M. Trajtenberg. 1995. General purpose technologies “Engines of growth”? Journal of Econometrics 65(1):83–108.
Brynjolfsson, E., D. Rock, and C. Syverson. 2018. The productivity J-curve: How intangibles complement general purpose technologies. NBER working paper w2518. https://www.nber.org/papers/w25148.pdf (accessed September 7, 2019).
Bush, V. 1945. Science, the endless frontier: A report to the President by Vannevar Bush, Director of the Office of Scientific Research and Development. Washington, DC: U.S. Government Printing Office.
Carlson, R. 2016. Estimating the biotech sector’s contribution to the U.S. economy. Nature Biotechnology 34(3):247–255.
Carlson, R. 2019. Presentation to the National Academy of Sciences Panel on Safeguarding the Bioeconomy, Washington, DC, January 28, 2019. http://nas-sites.org/dels/studies/bioeconomy/meeting-1 (accessed October 30, 2019).
Close, K., C. Meier, and M. Ringel. 2015. Making big data work: Biopharma. Boston, MA: Boston Consulting Group. https://www.bcg.com/en-us/publications/2015/big-dataadvanced-analytics-biopharmaceuticals-making-big-data-work-biopharma.aspx (accessed September 7, 2019).
Cockburn, I. M. 2006. Is the pharmaceutical industry in a productivity crisis? Innovation Policy and the Economy 7:1–32.
Corrado, C., and C. Hulten. 2010. How do you measure a “Technological Revolution”? American Economic Review 100(2):99–104.
Corrado, C., C. Hulten, and D. Sichel. 2005. Measuring capital and technology: An expanded framework. In Measuring capital in the new economy, Vol. 66, edited by C. Corrado, J. Haltiwanger, and D. Sichel. Chicago, IL: University of Chicago Press. Pp. 11–46. http://www.nber.org/chapters/c0202.pdf (accessed October 30, 2019).
Corrado, C., C. Hulten, and D. Sichel. 2009. Intangible capital and U.S. economic growth. The Review of Income and Wealth 55(3):661–685. https://doi.org/10.1111/j.14754991.2009.00343.x.
Corrado, C., J. Haskel, C. Jona-Lasinio, and M. Iommi. 2018. Intangible investment in the EU and US before and since the Great Recession and its contribution to productivity growth. Journal of Infrastructure, Policy and Development 2(1):205.
Corrado, C., J. Haskel, C. Joan-Lasinio, and M. Iommi. 2013. Innovation and intangible investment in Europe, Japan, and the United States. Oxford Review of Economic Policy 29(2):261–286.
Corrado, C., J. Haskel, and C. Jona-Lasinio. 2017. Public intangibles: The public sector and economic growth in the SNA. Review of Income and Wealth 63(Suppl 2):S355–S380.
Corrado, C., J. Haskel, C. Jona-Lasinio, and M. Iommi. 2018. Intangible investment in the EU and US before and since the Great Recession and its contribution to productivity growth. Journal of Infrastructure, Policy and Development 2(1):205.
Cumbers, J. 2019. Defining the bioeconomy. Presentation to the Committee on Safeguarding the Bioeconomy: Finding Strategies for Understanding, Evaluating, and Protecting the Bioeconomy While Sustaining Innovation and Growth. January 28, 2019. Washington, DC.
Daystar, J., R. B. Handfield, J. Golden, E. McConnell, and B. Morrison. 2018. An economic impact analysis of the U.S. biobased products industry. https://www.biopreferred.gov/BPResources/files/BiobasedProductsEconomicAnalysis2018.pdf (accessed September 7, 2019).
DiMasi, J. A., H. G. Grabowski, and R. W. Hansen. 2016. Innovation in the pharmaceutical industry: New estimates of R&D Costs. Journal of Health Economics 47:20–33. doi: 10.1016/j.jhealeco.2016.01.012.
EC (European Commission), International Monetary Fund, Organisation for Economic Cooperation and Development, United Nations, and World Bank. 2009. System of national accounts 2008. New York: United Nations.
Efken, J., W. Dirksmeyer, P. Kreins, and M. Mnecht, 2016. Measuring the importance of the bioeconomy in Germany: Concept and illustration. NJAS—Wageningen Journal of Life Sciences 77:9–17. https://doi.org/10.1016/j.njas.2016.03.008.
Ehrenfeld, W., and F. Kropfhäußer, 2017. Plant-based bioeconomy in Central Germany—a mapping of actors, industries and places. Technology Analysis & Strategic Management 29(5):514–527. doi: 10.1080/09537325.2016.1140135.
Feldman, M. P., D. F. Kogler, and D. L. Rigby. 2015. rKnowledge: The spatial diffusion and adoption of rDNA methods. Regional Studies 49(5):798–817.
Fernandez-Cornejo, J., S. Wechsler, and D. Milkove. 2016. The adoption of genetically engineered alfalfa, canola, and sugarbeets in the United States. Economic Information Bulletin EIB-163. Washington, DC: USDA ERS.
Furman, J. L., and S. Stern. 2011. Climbing atop the shoulders of giants: The impact of institutions on cumulative research. American Economic Review 101(5):1933–1963.
Furman, J., M. Nagler, and M. Watzinger. 2018. Disclosure and subsequent innovation: Evidence from the patent depository library program. NBER WP 24660. doi: 10.3386/w24660.
Gittelman, M. 2016. The revolution re-visited: Clinical and genetics research paradigms and the productivity paradox in drug discovery. Research Policy 45(8):1570–1585.
Golden, J. S., R. B. Handfield, J. Daystar, and T. E. McConnell. 2015. An economic impact analysis of the US biobased products industry: A report to the Congress of the United States of America. https://www.biopreferred.gov/BPResources/files/EconomicReport_6_12_2015.pdf (accessed September 7, 2019).
Graham, S. J., A. C. Marco, and R. Miller, 2018. The USPTO patent examination research dataset: A window on patent processing. Journal of Economics & Management Strategy 27(3):554–578.
Hall, B., A. Jaffe, and M. Trajtenberg. 2001. The NBER patent citations data file: Lessons, insights and methodological tools. National Bureau of Economic Research working paper #8498. Cambridge, MA: The MIT Press. doi: 10.3386/w8498.
Haskel, J., and S. Westlake. 2017. Capitalism without capital: The rise of the intangible economy. Princeton, NJ: Princeton University Press.
Henderson, R., and I. Cockburn. 1996. Scale, scope, and spillovers: Determinants of research productivity in the pharmaceutical industry. RAND Journal of Economics 27(1):32–59.
Hermans, R., A. Loffler, and S. Stern. 2007. The globalization of biotechnology: Science-driven clusters in a flat world. Washington, DC: The National Academies STEP Board and Northwestern University.
Holloway, T. M., and J. S. Reeb. 1989. A price index for biomedical research and development. Public Health Reports 104(1):11–13.
Hulten, C. R., and J. X. Hao. 2012. The role of intangible capital in the transformation and growth of the Chinese economy. National Bureau of Economic Research. Working Paper 18405.
Jaffe, A. B., and J. Lerner. 2004. Innovation and its discontents: How our broken patent system is endangering innovation and progress, and what to do about it. Princeton, NJ: Princeton University Press.
Jones, R., and J. R. Wilsdon. 2018. The biomedical bubble: Why U.K. research and innovation needs a greater diversity of priorities, politics, places and people. London, UK: NESTA.
Kogan, L., D. Papanikolaou, A. Seru, and N. Stoffman. 2017. Technological innovation, resource allocation, and growth. Quarterly Journal of Economics 132(2):665–712.
Lev, B. 2001. Intangibles: Management, measurement and reporting. Washington, DC: Brookings Institution Press.
Lev, B., and F. Gu. 2016. The end of accounting and the path forward for investors and managers. Wiley Finance Series. Hoboken, NJ: John Wiley & Sons.
Levin, R. C., A. K. Klevorick, R. R. Nelson, S. G. Winter, R. Gilbert, and Z. Griliches. 1987. Appropriating the returns from industrial research and development. Brookings Papers on Economic Activity 3:783–831.
Li, W. C. Y., M. Nirei, and K. Yamana. 2019. Value of data: There’s no such thing as a free lunch in the digital economy. RIETI discussion paper 19-E-022. https://www.bea.gov/research/papers/2018/value-data-theres-no-such-thing-free-lunch-digital-economy (accessed October 30, 2019).
Lier, M., M. Aarne, L. Kärkkäinen, K. T. Korhonen, A. Yli-Viikari, and T. Packalen. 2018. Synthesis on bioeconomy monitoring systems in the EU member states: Indicators for monitoring the progress of bioeconomy. https://jukuri.luke.fi/handle/10024/542249 (accessed August 30, 2019).
Machlup, F. 1961. Patents and inventive effort. Science 133(3463):1463–1466.
Mansfield, E. 1986. Patents and innovation: An empirical study. Management Science 32:173–181.
Marco, A. C., and R. D. Miller. 2019. Patent examination quality and litigation: Is there a link? International Journal of the Economics of Business 26(1):65–91.
Miller, R. E., and P. D. Blair. 2009. Input-output analysis: Foundations and extensions, 2nd edition. Cambridge, UK: Cambridge University Press.
Nagaraj, A. 2018. The private impact of public information: Landsat satellite maps and gold exploration. http://abhishekn.com/files/nagaraj_landsat_oct2018.pdf (accessed October 30, 2019).
NASEM (National Academies of Sciences, Engineering, and Medicine). 2017. Preparing for future products of biotechnology. Washington, DC: The National Academies Press. https://doi.org/10.17226/24605.
NASEM. 2018. Biodefense in the age of synthetic biology. Washington, DC: The National Academies Press. https://doi.org/10.17226/24890.
NASEM. 2019. Improving data collection and measurement of complex farms. Washington, DC: The National Academies Press. https://doi.org/10.17226/25260.
NRC (National Research Council). 2009. Intangible assets: Measuring and enhancing their contribution to corporate value and economic growth: Summary of a workshop. Washington, DC: The National Academies Press. https://doi.org/10.17226/12745.
NSB and NSF (National Science Board and National Science Foundation). 2018. 2018 Science & Engineering Indicators. https://www.nsf.gov/statistics/2018/nsb20181/assets/nsb20181.pdf (accessed September 11, 2019).
OECD (Organisation for Economic Co-operation and Development). 2013. Supporting investment in knowledge capital, growth and innovation. Paris, France: OECD Publishing. https://doi:.org/10.1787/9789264193307-en.
OECD/Eurostat. 2018. Oslo Manual 2018: Guidelines for collecting, reporting and using data on innovation, 4th edition. Paris, France: OECD Publishing. doi: 10.1787/9789264304604-en.
Otto, R., A. Santagostino, and U. Schrader. 2014. Rapid growth in biopharma: Challenges and opportunities. New York: McKinsey & Company.
Pakes, A., and Z. Griliches. 1980. Patents and R&D at the firm level: A first report. Economics Letters 5:377–381.
Pammolli, F., L. Magazzini, and M. Riccaboni. 2011. The productivity crisis in pharmaceutical R&D. Nature Reviews Drug Discovery 10:428–438. doi: 10.1038/nrd3405.
Philp, J., and D. Winickoff. 2018. Realising the circular bioeconomy. Paris, France: OECD Publishing. http://www.wcbef.com/assets/Uploads/Publications/Realising-the-CircularBioeconomy.pdf (accessed August 30, 2019).
Popkin, J., and K. Kobe. 2010. Manufacturing resurgence: A must have for U.S. prosperity. https://www.nist.gov/sites/default/files/documents/2017/04/28/id61990_ManufacturingResurgence.pdf (accessed September 7, 2019).
Rock, D. 2018. Engineering value: The returns to technological talent and investments in artificial intelligence. https://www.gsb.stanford.edu/sites/gsb/files/jmp_daniel-rock.pdf (accessed September 7, 2019).
Romer, P. 1990. Endogenous technological change. Journal of Political Economy 98(5):S71–S102.
Scannell, J. W., A. Blanckley, H. Boldon, and B. Warrington. 2012. Diagnosing the decline in pharmaceutical R&D efficiency. Nature Reviews Drug Discovery 11:1–10.
Scherer, F. M. 1983. The propensity to patent. International Journal of Industrial Organization 1:107–128.
Stokes, D. E. 1997. Pasteur’s quadrant: Basic science and technological innovation. Washington, DC: Brookings Institution Press.
Thum-Thysen, A., P. Voigt, B. Bilbao-Osorio, C. Maier, and D. Ognyanova. 2017. Unlocking investment in intangible assets. Brussels, Belgium: Publication Office of the European Union.
USDA ERS (U.S. Department of Agriculture Economic Research Service). n.d. Adoption of genetically engineered crops in the U.S. data product. https://www.ers.usda.gov/dataproducts/adoption-of-genetically-engineered-crops-in-the-us (accessed October 21, 2019).
USDA NASS (U.S. Department of Agriculture National Agricultural Statistical Service). 2017 Census of Agriculture. United States summary and state data, Volume 1. Geographic Area Series, Part 51, AC-17-A-51. Washington, DC: USDA.
USGCRP (U.S. Global Change Research Program). 2018. Impacts, risks, and adaptation in the United States: Fourth national climate assessment, Volume II: Report-in-brief, edited by D. R. Reidmiller, C. W. Avery, D. R. Easterling, K. E. Kunkel, K. L. M. Lewis, T. K. Maycock, and B. C. Stewart. Washington, DC: USGCRP. https://nca2018.globalchange.gov/downloads (accessed September 7, 2019).
Varian, H. 2018. Artificial intelligence, economics, and industrial organization. Working Paper #24839. https://www.nber.org/papers/w24839.pdf (accessed November 9, 2019).
Wesseler, J., and J. von Braun. 2017. Measuring the bioeconomy: Economics and policies. Annual Review of Resource Economics 9:275–298.
Wilson Center. 2013. Tracking the growth of synthetic biology: Findings for 2013. https://www.cbd.int/doc/emerging-issues/emergingissues-2013-07-WilsonCenter-Synbio_Maps_Findings-en.pdf (accessed September 7, 2019).


