
10
Discussion of State-Level Estimation
This session was organized by the planning committee to discuss the modeling of state-level hog inventory data. Gavin Corral (National Agricultural Statistics Service [NASS]) presented on data available for state-level modeling, followed by Luca Sartore (NASS) on extending the new NASS model to make state-level estimates, Gauri Datta (U.S. Census Bureau and University of Georgia) on Fay-Herriot models, and Eric Slud (University of Maryland and U.S. Census Bureau) on a shares approach to making state-level estimates. The session concluded with open discussion. Chris Wikle was the moderator.
DATA AVAILABILITY
Corral summarized the data available to support modeling at the state level. First, there are 30 states for which survey estimates for all inventory items are available for all quarters beginning in 2008. For the remaining 20 states, survey estimates are available annually in December. In addition, state recommendations are developed with state-level survey data adjusted by regional offices. For these data sources, variables available include sows farrowed and pig crop (available monthly) and breeding herd, inventory by weight group, first and second intentions, death loss, and total hogs.
Corral referred to the earlier discussion about monthly check-off data (see Chapter 9). U.S. pork producers and importers pay $0.40 per $100.00 of value when pigs are sold and when pigs or pork products are brought
into the United States. The National Pork Board uses the funds for specific program areas such as promotion, research, and education.
NASS has annual national import and export data. Some data are available annually on state-level in-shipments and out-shipments from the state veterinarian offices. Slaughter data are available monthly at the national level. Data on number of hogs slaughtered in a state are available monthly based on slaughterhouse location, but those data do not reflect where the hog was raised so are not comparable to NASS hog inventory data. They are also available by slaughterhouse location. Another potential source of state-level information is the web-scraping data described in Chapter 6.
EXTENDING THE NEW NASS MODEL TO STATE ESTIMATES
Sartore described his ideas for preparing state-level estimates. He suggested a hidden Markov model probably as a replacement for the current national-level model. Estimates would be prepared at the state level and aggregated to the national level. The model should respect the relationship between dynamics of state and national survival rates, he said, as well as incorporate in-shipment and out-shipment of hogs across borders. These movements need to be accounted for because inventory is defined as the number of animals in the state at the survey reference period. Clearly, he said, additional sources of data are needed. Finally, he pointed to the 2-hour time requirement for computation.
Sartore showed a node graph with one node for each of the 16 states for which survey estimates are prepared quarterly, plus a 17th node that represents all other states. The chart also shows lines connecting the nodes. There is a set of state-level data for each node. The lines indicate interstate variables: spatial distance, disease spreading, transportation. One question is how to extend this network to all 50 states surveyed in December. The model needs to incorporate spatial-temporal relationships to support a formal way to borrow information, he said. For example, one might consider estimating the survival rate for a state at time t as a weighted average of survival rates in neighboring states at time t. With this formulation, it is not yet clear either how to define “neighboring states” or how to determine the appropriate weighting. He gave a similar example of how to estimate a transition matrix for the percentage of exported (or non-exported) hogs in a state.
Sartore concluded by summarizing the computation issues. He is considering using an optimization based on gradient descent methods rather than simulations to reduce memory requirements. Additionally, a unified framework for simultaneously computing all estimates would be desirable, and he has to consider the 2-hour limitation on run time. Among the questions that remain are how to simplify the model and what can be done if transportation data are not available. Another key question is how to compute variance estimates in this complex process with multiple types of error: modeling error, sampling error, imputation, and judgment.
SMALL AREA ESTIMATION
Before moving on to the two presentations about small area estimation, Slud asked about the sample sizes in small and large states to get a better idea about the range of sampling errors. Although no one had good examples, Matthew Branan referred to sampling weights for Colorado and Iowa (see Chapter 3) that give some indication. Slud noted that the sampling weights of 1 are for the very large producers that dominate. They are self-representing and do not contribute to the variance estimate. Nell Sedransk clarified the sample sizes in Colorado, saying the medium- size group has dwindled postepidemic and is in the double digits, maybe as low as 30. The numbers in the large group have increased slightly, and the numbers in the very small group have increased a lot. As noted in Chapter 3, a huge percentage of hogs are held by very large operators, but a huge percentage of operations are very small. Sampling proportions are set to achieve set coefficients of variation and, consequently, both size and number of operators figure into those computations.
Slud observed information about the population and sample is consistent with the Census Bureau’s economic surveys. He noted small area estimation has primarily been used with household surveys that have very different properties from economic surveys.
Fay-Herriot Model
Datta, in a joint presentation with Slud, started by introducing the Fay-Herriot model, a popular model for producing small area estimates. In the case discussed at this workshop, the goal is to estimate ϴi, the hog production for state i, for i = 1 to m. A state-level estimate, Yi is known and prepared from the sample that is a direct estimate of ϴi. However, direct
estimates are often not reliable, especially for small states. To develop a reliable estimate for states, Fay and Herriot (1979) proposed an approach to borrow strength from other data sources. It uses two models. The sampling model describes the sample estimate as providing an unbiased estimate for state production, ϴi, with an additive noise term. The noise term has zero mean and is normally distributed, with variance equal to the sampling variance. There is no correlation between estimates for different states. The second model is called the linking model. It connects ϴi to covariates Xi via a linear regression relationship with the covariates. This model also has an additive independent identically distributed noise term.
The linking model will be best with good covariates, he said. Disease indicators might serve as useful covariates for the topics discussed in this workshop. Other covariates may include parts of the growth models, such as the relationship between pigs born and sows farrowed. Once parameters are estimated, the approach results in two estimates for ϴi, with one from the survey and one from the regression. The approach yields a third estimate for ϴi called the shrinkage estimator. The extent of shrinkage depends on the variance of the sampling error equation and the variance of the linking equation. If the variance of the survey estimate is small, as it might be for the largest hog-producing states, the shrinkage estimate will be close to the direct estimate. If the variance of the survey estimate is large, as it might be for smaller hog-producing states, the shrinkage estimate will be very close to the prediction of the regression linkage model.Fay-Herriot models can be treated and estimated either in a frequentist or Bayesian mode.
Datta described benchmarking work done for small area models. He noted a Bayesian solution to the benchmarking problem in some of his own work (Datta et al., 2011). With this approach, the small area model is used to get state-level estimates, which are summed and should agree with the national-level estimate. If they do not, then a benchmarking approach is used to change the estimate from the model slightly so that the new estimate satisfies the benchmark.
He noted that another approach uses two-step modeling: a small area model and then a time series or state-space model. The Fay-Herriot approach provides a way to combine these estimates. He noted that Pfeffermann and Tiller (2006) described benchmarking approaches that help to account for changes due to shocks, such as disease. The
model helps by providing a corrected set of estimates instead of showing a big divergence immediately after the shock.
Datta said that Ghosh and colleagues (1996) published a multivariate cross-sectional time series small area Fay-Herriot model. This model, for example, could estimate hogs and pigs for different weight groups including their dynamics. For some particular time points, there could be a multivariate response and multivariate covariates, he added. Some of the covariates may be subject to sampling error, which must be included in the model. If a frequentist approach is used, then a jackknife or bootstrap is used to measure the uncertainty. A fully Bayesian approach provides variance estimates.
He observed that some of these approaches also work with short time series, such as the 10 years of quarterly data discussed. Many survey and nonsurvey variables can be put together in a model to borrow strength over both time and small areas. That is a very established area of research in small area estimates, an example is Ghosh and colleagues (1996). Datta concluded that this work extends the Fay-Herriot model by adding a time component and fixed regression coefficient. Hierarchical-Bayesian modeling is generally used for these models. This version of the model would also need benchmarking, and there are other papers on Bayesian benchmarking by Ghosh.
Linda Young said that NASS uses the Fay-Herriot model for crop prediction models and has been quite happy with it. She asked how to include the biological growth processes in this model. What NASS likes about the current approach, she said, is that it models the weight classes and moves through time with those restrictions in place. She asked how that could be accommodated in a Fay-Herriot model.
Wikle said that the random effect in Datta’s model is time varying. It could also be spatial or multivariate. There is no reason why it cannot also be a dynamical process, he said. He pointed to Datta’s model where the coefficient on the covariates is assumed to follow a random walk. Many other options are possible, he said.
Shares Approach
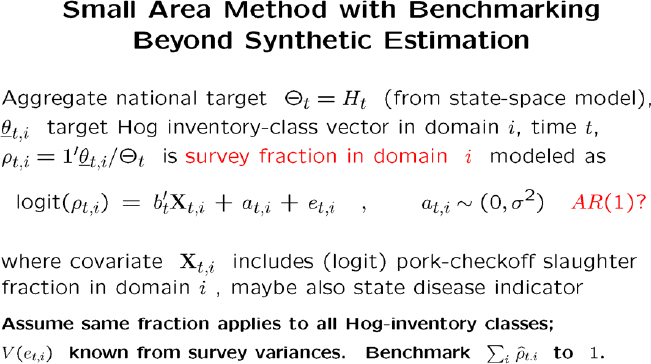
Slud used Figure 10-1 to introduce a shares model sometimes used in small area contexts when data are meager. The approach concentrates on developing national estimates for hog inventory classes, and it models the
SOURCE: Prepared by Eric Slud for presentation at the workshop.
proportion that would be attributed to each state as a share of that total. In Figure 10-1, domain i is the geographical state and domain t is time. The vector ρt,i is the fraction of total inventory across each inventory class at time t in state i.
The fraction of U.S. hog production in each state is estimated directly. This requires alternative estimates for the covariates Xt,i. There are already a few estimates for the ρ's. First is the fraction of the total in state i according to the survey data this is represented by ρt,i (left-hand side of the equation in Figure 10-1). Other estimates for ρ, the Xt,i on the right-hand side of the equation, are determined from covariate data, perhaps state recommendations from the field offices or the pork check-off data. These might be measured with error, in which case a measurement error model should be included. This is another way to borrow strength that has worked in other small area contexts using survey data.
This process also requires benchmarking. The sum of state shares must sum to 1. The estimates from these types of models would not satisfy that requirement. That is why a post adjustment called benchmarking is needed, he said, which could be done with either a frequentist or Bayesian approach. Finally, he referred to Rao and Molina (2015) as one of the best current references for small area estimation. The challenge is that all small area methods need good covariates to work well, he concluded.
PANELAND OPEN DISCUSSION
Ron Plain asked about data available at the state level. He asked whether large producers are reporting in the smaller 20 states (those states for which the sampled operators are only required to report in December). In other words, he asked, does I.A. Smithfield, a very large producer, have hogs in 1 of the 20 states that are not surveyed quarterly? If so, that information might be useful for modeling. Dan Kerestes said there are not enough instances of this occurring to be useful, noting that the states surveyed annually contribute less than 0.5 percent of the national pig crop.
Plain referred to Sartore’s discussion about estimating pig survival rates and death loss by state. He asked whether death loss is more correlated to size of operation than to the location of an operation. Death loss for a smaller operation might be more similar to other small operations elsewhere than to larger operations in the same state. Nell Sedransk said pig crop per sow farrowed varies more by operation size than it does by state. It also varies a bit seasonally. In the northern tier of states with harsh winters, there is more seasonality than in the southern tier states. There are differences that are regional. She said that she has seen the relationship of death loss to size of operation.
Plain asked whether NASS has found a way to incorporate situations such as a severe winter in the Lake States with litter size. Kerestes said that question was looked at about 5 years ago as part of an imputation study. The study found many hogs raised indoors, so weather did not have a big impact. The study indicated that records from operators from across the United States could be used in imputation without much difference in the quality of the imputation. Size of operation is different. Death loss is different for large operators. They have more economies of scale.
Kerestes discussed shocks such as flooding. He observed, for example, that most barns are built on higher ground, so during many floods, the barns are fine. Initial predictions after a hurricane in North Carolina in the early 2000s were a huge loss of hogs. In fact, the loss was less than 50,000 head. It is easy to overstate the impact of shocks, he warned, which is why NASS has to be careful with the data used. Sedransk noted that even if loss due to flooding is minor at the national level, it might be very important to a smaller state.
Kerestes commented that if the pork check-off data were accurate and timely, NASS would not need its surveys. NASS makes extensive use of administrative data because it saves money and reduces respondent burden. For example, he said that it mostly uses Agricultural Marketing Service price data and re-summarizes those data to meet its needs. He observed that many valuable points were made that afternoon, which will need to be considered after the workshop.
Slud commented on Sedransk’s idea of banding states. He said that Pfeffermann and Tiller (2006) made their small area estimations work in a time series context by grouping states. It is possible that the variability of the regional groupings will be reasonable for combining data and may result in survey data with greater accuracy, he suggested. He also commented on the pork check-off data within a small area model. The approach would not assume that the pork check-offs are exactly predictive of state totals, just that the pork check-off fractions by state are relevant. Again, because there are state differences in terms of out-shipments and in-shipments for feeding and finishing, perhaps appropriate grouping would be possible to make those shares more relevant.
Andrew Lawson pointed to the term at,i in Figure 10-1. As written, he said, this term is temporal. However, the model might also include spatial terms. That is a standard way to include space and time. When a model includes both space and time, he said, it is also important to include terms to explain space-time interactions, particularly if there are shocks. He added that NASS might consider Conditional Autoregressive (CAR) models for spatial-temporal approaches. CAR models can be fitted almost instantly with modern computers. As a result, NASS could have a model with space-time interactions that could be fitted very quickly.
Lee Schulz asked whether the process that transforms the survey data into state recommendations is consistent across states, model-based, and uses expert judgment. Kerestes replied 12 regional offices set the state-level recommendations. Within a regional office, one or two people establish the state recommendations. They consider the current survey indications, previous official estimates, and administrative data. They use a computer tool that displays the current, past, and auxiliary data in charts. The tool allows them, for example, to redo a chart with certain observations eliminated: for example, if there were a shock in the state during some period of time. They examine and evaluate the various data relation-
ships. Some of the regional offices have what they call mini-boards that assemble two or three other people from the regional office to discuss and review recommendations for all states in that region. Information is then sent to headquarters where Seth Riggins as head statistician reviews and evaluates it before further work is completed.
Katherine Ensor observed there seems to be a lot of uncertainty in that process. Kerestes said that he thinks that after 150 years, the process itself is pretty certain. Statistical procedures are standardized across the NASS regional field offices. The computer tool is standardized, although there is judgment in the process.
Datta said that the state recommendations can be a covariate in the model. Young replied that NASS uses state recommendations as input to many of its models.
Plain commented that NASS works very hard with the national estimates, truing them up to slaughter data. However, if he hears a state is down by 10 percent, he said he is inclined not to believe it because it may be that the previous year’s number was too high by 10 percent and the number was corrected. He said from his perspective, without a way to true a state number for revisions, he has limited confidence in the number. He asked if NASS has considered how to get state-level data right.
Kerestes agreed an estimate is only as good as the data that go into it. For example, if a large operator is a nonrespondent one quarter and the operator’s data must be estimated, there is a possibility that the resulting estimate may contain greater error. He said that they try to monitor relationships from year to year when they do revisions. When the Census of Agriculture becomes available, 5 years of past data are evaluated and possibly revised.
Kerestes remarked that when a change to state-level data is due to a change in a large producer’s practices, NASS cannot explain the changes to the public because of the confidentiality pledge given to the operator. He added that NASS listens when industry says that there is something wrong with their numbers. The agency evaluates the data and may even follow up with key producers to verify their data. In his view, the national number is the most important because it is used to establish trade parameters. Individual state numbers are very important to the people in those states. What NASS tries to do, however, is to capture shifts in the hog industry at the national level.
Slud asked whether information in the Census of Agriculture could be mined, for example, for information from operators about shipments of their hogs to other states or other information to make a more complete picture of the hog industry for modeling purposes. Kerestes said the Hog Survey and the census are conducted differently. The Hog Survey asks large operators to report for all the locations in which they operate because it is more efficient and they only need state-level detail. The census asks all farms, whether they own hogs or contract to raise hogs, to respond. The main reason is to get county-level data, the real strength of the census.
Slud asked about adding a question to the census about shipments. Young replied that the comment period for the 2022 census is still open, but the challenge is that to add a question, another question must be removed to keep the form to 24 pages in length. While not impossible, it would not be easy to add a question about transportation, she said.
Ensor asked how often hog operations come in and go out of business during a 5-year period and whether dramatic shifts in the overall structure of hog production occur from one 5-year period to the next. Young referred to previous discussion (see Chapter 4) that the industry has become much more concentrated. Kerestes added that the census illuminated what has happened to mid-sized producers, and NASS sees those changes in its quarterly surveys. If a large producer changes (e.g., is bought, sold, or goes bankrupt, or buys or sells another operation), NASS tries to incorporate that change immediately in the quarterly survey operations.
Ensor noted that the models are fit using data under the assumption that there have been no changes over time. It is important to account for these changes over time either in the modeling or in the estimation of parameters. Perhaps parameters should evolve over time, she suggested.


