
4
Setting Official Estimates: The Hog Board
Christopher Wikle (University of Missouri) moderated this session of the workshop. He introduced Seth Riggins (National Agricultural Statistics Service [NASS]) to summarize the hog data and the industry and to provide detail about how NASS uses multiple data sources to set official estimates. A discussion followed Riggins’s presentation.
AN INTRODUCTION TO THE DATA AND THE INDUSTRY
Riggins reiterated an earlier statement that one of the reasons the Hog and Pigs Report is important is that it is designated as a Federal Principal Economic Indicator by the U.S. Office of Management and Budget (OMB). For purposes of setting and evaluating estimates, the most important data items are the comparison of current quarter inventories (by category) with the previous quarter and with previous-year same-quarter inventories expressed as a percentage, the number of sows farrowed (giving birth) during the past quarter, the pig crop, and sow farrowing intentions for the next two quarters (by month).
Riggins provided the definitions used in the data effort. Market hogs are all hogs that are destined directly to slaughter after finishing (growing). Breeding hogs produce market hogs and future breeding gilts and boars, but they are also eventually slaughtered. Sows farrowed are female pigs that gave birth during the past 3 months. The pig crop is the number of pigs born alive during the past 3 months that are still alive or were sold or slaughtered before the survey reference date (December 1, March 1, June 1, or September 1). Pigs per litter is the pig crop divided by sows
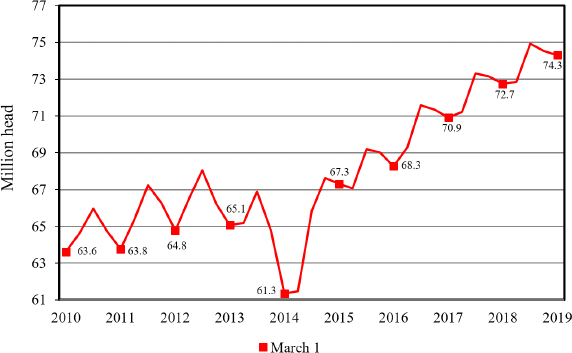
NOTE: Graph is not zero-based, accentuating the drop.
SOURCE: Prepared by Seth Riggins for presentation at the workshop.
farrowed to give a rate of production. Farrowing intentions are reported for the next two quarters separately. For example, in June, data are collected for intended farrowings for June through August; in September, for intended farrowings for September through November.
Riggins illustrated the quarterly number of hogs and pigs for the past 10 years (see Figure 4-1). The data show a fairly constant growth from 63.6 million hogs in March 2010 to 74.3 million hogs in March 2019. The dip in 2013 and 2014 was due to the Porcine Epidemic Diarrhea virus (PEDv).
Riggins also discussed changes in the industry since 1994 (see Table 4-1). In 1994, there were a large number of producers with smaller inventories. The data show fewer producers in 2017, but much of the inventory is concentrated in large operations.
THE ESTIMATION PROCESS
Riggins summarized the NASS estimation process, which involves Riggins himself as the headquarters hog statistician, regional field office statisticians, and the Agricultural Statistics Board (ASB). The process starts with revisions to past data and progresses through compiling the information and evaluating it, the pre-board, the Hog Board, and a briefing to the secretary of agriculture just prior to release.
TABLE 4-1 Changes in the Hog Industry since 1994
| Year | Number of Operations | Hog Inventory (million head) | Percentage of Inventory on 2000 Head Operations |
|---|---|---|---|
| 1994 (December) | 208,780 | 59.6 | 37 |
| 2002 (Census) | 78,895 | 60.4 | 75 |
| 2007 (Census) | 75,442 | 67.8 | 85 |
| 2012 (Census) | 63,246 | 66.0 | 90 |
| 2017 (Census) | 66,439 | 72.4 | 93 |
NOTE: Column heading Percentage of Inventory on 2000 Head Operations—means the percentage of total hog inventory held by operations that have 2,000 or more hogs and pigs.
SOURCE: Prepared by Seth Riggins for presentation at the workshop.
Revisions
Riggins explained that to start the process, the headquarters hog statistician, livestock branch chief, livestock section head, and a methods branch representative determine whether revisions are necessary for the previous three quarters (for the March, June, or September publications) or for up to seven previous quarters for the December publication. This review is primarily based on newly available commercial slaughter numbers and a balance sheet approach that looks at percent changes by inventory category. Revisions are determined at the national level, and the state-level estimates are revised to meet the new national targets. Occasionally, NASS receives data from large operations that can influence a state-level estimate, in which case it considers a state-level revision.
He noted that there are also revisions due to the Census of Agriculture, conducted every 5 years. Twenty quarters of national and state data are open for revisions, if necessary, based on results of the most current census. After that point, estimates are considered final and are never revised again.
Preparing and Evaluating Current Data
The regional field office statisticians run survey summaries each quarter once they collect, process, edit, and review the data, Riggins
explained. The data are then submitted to him as the headquarters statistician. He reviews the state-level estimates and prepares for a pre-board meeting (usually held the following day).
He said that the pre-board members compare preliminary national estimates with the state recommendations. The primary data relationships reviewed are the ratio of the current quarter to previous year for the same quarter expressed as a percent, the inventories of sows farrowed and pig crop in conjunction with the two small weight groups, and the previous-quarters’ pig crop inventories with the current 50–119 lbs., 120–179 + lbs., and 180 + lbs. weight groups. They examine national-level balance sheets for the current data and the balance sheets for the two most recent past quarters and the past year that have been updated to include updated slaughter data, death loss estimates, and imports and exports.
Riggins explained that the balance-sheet approach results in residuals that are carefully examined. For example, at the 3-month level, the previous quarter’s inventory estimates plus the pig crop, plus imports minus the death loss, minus exports, and minus slaughter are compared to the current quarter’s estimate. The difference is the residual.
One of the important things reviewed by the pre-board members is the percentage changes of the two small weight groups from the previous quarter moving to the larger two groups plus part of the 50–119 lbs. weight group to make sure the current inventory number includes the smaller pigs reported in the previous quarter. They next look at a comparison of the model-based numbers with the survey numbers for totals and by various inventory categories. They use this information to develop two or three pre-board scenarios to present to the ASB the following morning. One scenario is based on the model-based estimates. Another scenario might be to adjust the weight group inventories to cover the expected growth of small pigs reported in the previous quarter to larger weight categories.
The Agricultural Statistics Board
Riggins reported that the ASB is composed of the NASS statistics division director, national hog statistician, livestock branch chief, livestock section head, methods branch representative, survey administration representative, and two or three regional field office representatives. The purpose of the meeting is to set national targets for select inventory
categories. The survey administration representative provides an overview of the survey results, including response rates both within sampling strata and across states, as well as anything that might have affected the survey process.
He said the methods branch presents an overview of the summary statistics. During this presentation, coefficients of variation (CVs), percentage changes from the previous quarter/previous year published estimates, and previous quarter/previous year ratios of the top 20 and top 100 producers’ survey results are discussed. The methods branch has developed a set of ranges instead of a model or balance sheet. The methods branch representative uses the proposed revisions against current-to-previous ratio summaries, as well as previous quarter and previous year and 6-month ratios, to develop ranges. These ranges are plotted on a high–low graph to see the overlap with the point estimate and the standard error range. One method compares the matched record ratio.1
There is discussion about the weather, industry news, slaughter plants, regional field office comments, and comments about disease that may have come in during the survey process. During the past year, for example, African swine fever and its potential effect on the American hog producer was a topic of discussion. The board members discuss any comments received from extreme operators about national- or state-level changes, imports and exports, and anything unusual from the previous quarter or previous year. Imports and exports are fairly minor compared to overall hog levels, but they can have some influence, he pointed out. The board members also talk about hog prices and commercial slaughter. Typically, over the past year, Riggins said, discussions have been about expansion of hog production related to slaughter capacity on a daily and yearly basis and labor supply to run shifts at the packing plants.
Finally, Riggins said, the hog statistician presents the pre-board scenarios and balance sheets. After a discussion, each board member enters his or her target into a software package, and the hog statistician then pulls up a summary of everyone’s recommended targets. A roundtable discussion ensues about why board members chose their national targets, and a consensus on the national targets for total inventory, sows farrowed, pig crop, and pigs per litter is established.
___________________
1 Only respondents who participated in the current quarter, previous quarter, and past year are included in the ratio.
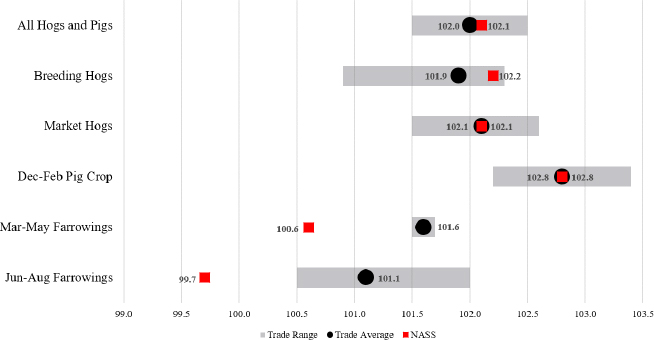
NOTE: Trade expectations are estimates published by non-U.S. Department of Agriculture entities in advance of NASS release of the official estimates.
SOURCE: Presented by Seth Riggins at the workshop, based on a slide used in the March 2019 briefing to the secretary of agriculture. See https://www.nass.usda.gov/Newsroom/Executive_Briefings/2019/03-28-2019.pdf.
After national targets are set, the headquarters statistician works with the regional field office representatives over the next few business days. They use a top-down approach to setting the national- and state-level estimates. First, national numbers for weight groups are set, then the state-level estimates are set to sum to the national targets. All states must still balance within the weight groups, and the sows farrowed, pig crop, and pigs per litter also have to balance within the state and at the national level.
Publication and Briefing the Secretary of Agriculture
Riggins explained that publication is usually 1 week after the ASB meets and always within 30 days of the reference date. The Hogs and Pigs Report is a confidential publication, so before public release the data cannot be discussed outside of the members entrusted with the data. A briefing to the secretary of agriculture is given in a “lockup”
shortly before release. (The lockup procedures were detailed in one of the appendixes provided to the committee and discussants participating in the workshop.)
The briefing informs the secretary of how the survey process went, anything unusual in the industry, import/export changes, revisions to previous quarters, and trade expectations. Trade expectations are discussed so the secretary knows that this report is going to have an influence on the market. However, NASS does not receive pre-report trade expectations until the day before the executive briefing, and it has no influence on setting the national targets. As an example, Riggins showed a slide used in the March 2019 briefing to the secretary (see Figure 4-2). The red squares are the NASS official estimates. The black dots are an average of the industry’s prereport expectation, and the gray bars are the range.
DISCUSSION
Ron Plain observed that the reference date for the survey data is the first day of the month. The data are released about the 28th day of the month, and approximately three-quarters of the 180 + lbs. weight group will have been slaughtered by the release date. He asked whether NASS looks at slaughter over the past 28 days and uses it to adjust the 180 + lbs. weight group inventory.
Riggins replied that at the time a state has to send in its estimates, only 2 weeks of preliminary daily slaughter data are available. At that point, slaughter is a weak indication compared to the survey data. While there are more data by the 28th of the month, there is no time to adjust the 180 + lbs. group. Moreover, he added, the slaughter data are still fairly preliminary. NASS takes the first 2 weeks of slaughter data into consideration but does not let those data influence how they look at survey estimates.
Lee Schulz referred to the trade expectations, noting a balance sheet approach is used. He asked about the possibility of NASS using the trade expectations data. Riggins replied that the preliminary slaughter data are informative, but much can happen in 2 weeks. The trade expectation data are only available a day before release, Riggins said, although Schulz commented the data may be prepared earlier. Dan Kerestes, who is an NASS member of the ASB, commented that trade can go any direction, as seen in Figure 4-2. He noted NASS must approach trade data with
caution. NASS tries to use as much slaughter information as possible, but there is a point in time where information must be cut off because time is limited. The Hog Board, in the course of a 2-hour meeting, discusses slaughter data, weather conditions, and disease, he added.
Kerestes said that after the ASB meeting, Riggins finalizes weight category inventories and state numbers, making sure all information is accounted for, makes biological sense within each state, and adds up to the national level. As much slaughter and trade data as possible are used, within the time constraint and efforts to be statistically accurate and unbiased, he said.
Linda Young observed an example of potential bias in Figure 4-2. She noted that March 1 is the reference date, and estimates reflect the inventory at that point in time. She asked Riggins to explain why the NASS estimates in the bottom two lines (March to May farrowings and June to August farrowings) were off so much compared to trade expectations. Riggins replied that on this particular March 1 (the survey reference date), information became available about the effect of African swine fever on the Chinese herd. There was some indication that the Chinese might buy more pork as a result, and the futures market for pork in 6 to 9 months went up quite a bit. He said he suspects that the industry forecasters assumed an increase in farrowing over what the operations actually reported on March 1.
Katherine Ensor asked about the context in which model results are used in this process. She questioned whether an improved model would have more weight in the board discussion for its final estimates. She also asked whether shocks would be overweighted if the model took them into account more fully. Young said she understood that if the model hits the final estimates better than the current process, the board will rely on the model more strongly. Everybody wants the most accurate possible numbers, she stressed, but right now, no modeling efforts do that.
Ensor commented that the decision process Riggins described, with experts coupled with statistical models, is a nice decision framework. She agreed 2 hours is not very long for a discussion of this nature and asked about the opportunity for a “pre-pre-board,” perhaps a week earlier, to get expert opinion to integrate into the modeling discussions. Young replied they could not have the relevant information that far in advance. The flow of information is the real problem with improving timeliness, she said.


