
5
Modeling Efforts
Lee Schulz (Iowa State University) moderated this workshop session, introducing Gavin Corral from the Research Division of the National Agricultural Statistics Service (NASS) to summarize the modeling efforts that NASS has undertaken over the past few years and to commenton their strengths and weaknesses.
Corral said that the goals of his presentation were to identify the fundamental elements of the Kalman filter model (KFM) for hog inventory, provide NASS criteria for model evaluation, and discuss model performance. He also discussed a second model, the sequential generalized linear model (SGLM), its performance, and a comparison between the two models. He concluded with a discussion of a third model that produces shock diagnostics.
PURPOSES OF A MODEL
As context, he said, the purpose of a hog inventory model is to produce estimates for the hog inventory categories described in earlier chapters. For purposes of evaluation, NASS compares the model estimates to the initial official estimate released by the Hog Board. It would like to have the difference between the two estimates within about 470,000 hogs, or approximately 1 day of slaughter. It also compares the model estimates to the final revised estimate, available 1 year later. During times of equilibrium, the initial and the final official estimates tend to be very close, and NASS usually uses the initial official estimate for comparison because it is available sooner. During times of shock, however, the initial
and final estimates diverge. NASS uses the final official estimate for comparison because it is more accurate.
NASS wants model-based estimates to be as efficient as possible, as measured by coefficients of variation (CVs). The models should respect the interrelationships between categories of hog inventory over time, referred to as satisfying biological constraints. NASS wants the number of hogs in the system at one point in time to make sense with the number of hogs slaughtered at another point in time. The survey results alone may fail to do this. There tends to be a downward bias to the survey results that may not reflect the hog growth lifecycle.
NASS seeks model-based estimates that provide accurate estimates of inventory during times of shock. While disease (i.e., Porcine Epidemic Diarrhea virus [PEDv]) was a key issue in 2013 to 2015, NASS would like to make accurate estimates during all shocks, whether disease, natural disasters, tariffs, or other causes. Sometimes changes in the industry before or after a shock also affect hog inventories, which are important to track.
Corral discussed the KFM and SGLM against four criteria. First, how well does each model capture inventories during times of equilibrium? Second, how well does it detect and adapt for shocks, such as the PEDv? Third, how well does it account for the biological considerations of the hog lifecycle? And, finally, how well does it satisfy the balance sheet constraints that incorporate slaughter data, imports, and exports?
KALMAN FILTER MODEL
Corral gave a quick overview of the KFM, detailed more fully in Busselberg (2013). The model is a state-space approach with a state equation to describe the state of the system and how it changes over time; in this case, the state includes a transition matrix that describes how national-level hog inventories change over time. The current state depends on the state in the past five quarters to capture cycle dynamics and annual trends. The measurement or observation equation describes how the measurements (e.g., survey data) relate to the state equation. The Kalman filter is used to update the time series estimates for the state (hog inventories) given the survey data. It has worked well during times of equilibrium.
This model has a number of constraints built into the state equations to reflect the biological considerations and balance sheet relationships. For example, there is a limit on the ratio of death loss (of pigs weaned) to pig crop, and the annual increase of pig crop must be greater than the annual increase in market weight groups. There is a weight group transition, with an assumption about the growth of pigs within weight classes. The annual increase in slaughter is equal to the annual increase in births for the two preceding quarters. The total number of market hogs in a quarter should equal the combined total slaughter numbers for the next two quarters. This is related to the 6-month time period for hogs going from weight group one to slaughter. There is a constraint that relates market hogs more than 180 lbs. to slaughter during the estimation quarter but after the reference quarter. Although the quarter is in progress, daily slaughter information is still available. At the time of the board meeting, 2 full weeks of daily slaughter information is available. Another constraint is that sows farrowed make up one-half of the previous quarter’s breeding herd. Finally, he noted, the KFM includes a constraint for a constant survival rate across all weight classes (not considered in the new model, as discussed in Chapter 7).
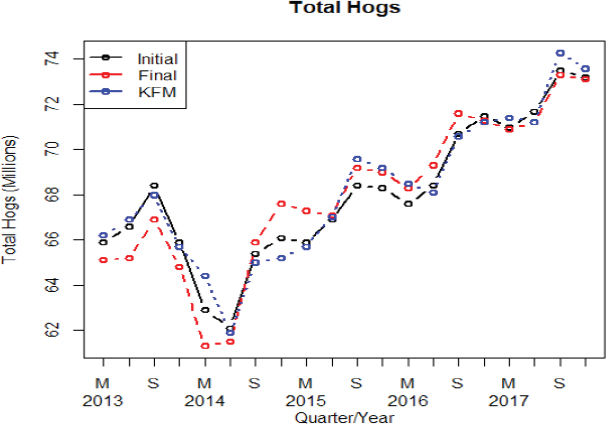
Corral illustrated KFM performance as measured against initial and final official NASS estimates for total hogs. Figure 5-1 shows a time plot from 2013 to 2017. Three estimates are shown: The initial estimate in black, the final estimate in red, and the KFM estimate in blue. In the epidemic years of 2013 to 2015, distance between the final and the initial estimates is seen. The KFM also missed the final estimate, Corral pointed out. It tracked the initial estimate fairly closely, had some trouble coming out of the shock, then started tracking reasonably well and relatively quickly.
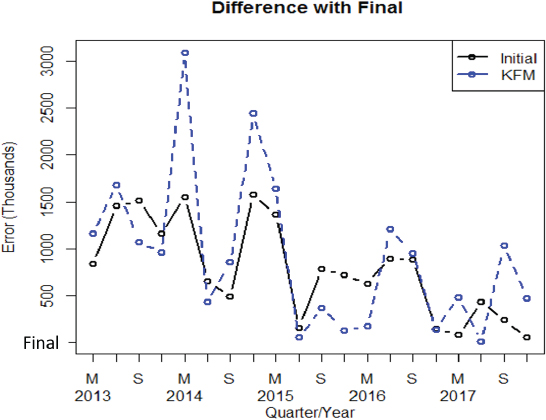
Figure 5-2 plots the differences between the final estimate for total hogs and the KFM (blue) and initial estimates (black). This plot illustrates the challenges the KFM had during the epidemic years. The differences spike in March 2014 and December 2015. The KFM then underestimated from late 2015 to March 2016. At the largest spike, the KFM was off by almost 3 million hogs.
The difference between the final and initial estimates has a general decreasing pattern, Corral noted, which illustrates that the KFM struggles to get close to the final estimates after times of shock.
Referring to Corral’s four criteria listed above, the KFM does a good job of capturing the picture during equilibrium. It does not detect and adjust for shocks, although it did fairly well coming out of the shock. It accounts for the hog lifecycle and for the balance-sheet requirements.
Andrew Lawson (Medical University of South Carolina) asked whether the KFM is fitted to all 21 quarters. Corral replied that the model was run 21 times to obtain Figures 5-1 and 5-2. Lawson asked whether NASS had considered fitting the model to all the data. Corral said it was discussed in the past. Linda Young reminded the audience that the data shown represent the model-based estimates that were sent to the pre-board for its consideration. It is being compared to the final revised estimate—the target, even though much was not yet known at the time the model was run. The question is whether the model will be effective in producing the board estimate.
SEQUENTIAL GENERAL LINEAR MODEL
Corral next described the SGLM, developed by Kedem and Pan in 2015. The choice of SGLM was based on giving more weight to current and immediate data to better capture changing dynamics. The model also enables a dynamic selection across a wide range of potential variables. They included additional variables from which to select, including economic variables such as pork price. Kedem and Pan used survey results, board estimates, and differences in revisions.
The SGLM works by testing a large number of potential covariates using spectral analysis and selecting among them for the final model. In the documentation, they specified a 4-year window. Depending on which item the model is estimating, there are usually four to eight different covariates.
Corral stressed that the SGLM makes an independent prediction of each inventory item. This results in a major challenge because the estimates do not follow biological constraints and do not satisfy balance-sheet requirements. The covariates for the model change each quarter.
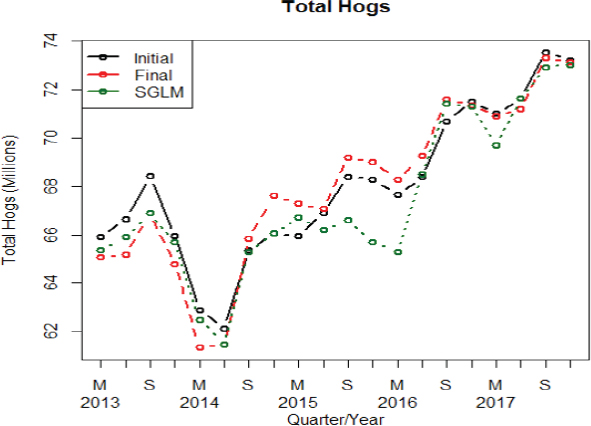
Figure 5-3 is a companion to Figure 5-1, which shows KLM results. Figure 5-3 shows the comparison of the SGLM results with initial and final NASS estimates. This plot shows the initial estimate in black,
SOURCE: Prepared by Gavin Corral for presentation at the workshop.
SOURCE: Prepared by Gavin Corral for presentation at the workshop.
SOURCE: Prepared by Gavin Corral for presentation at the workshop.
SOURCE: Prepared by Gavin Corral for presentation at the workshop.
final in red, and SGLM in green. Notable is that during epidemic years, the SGLM did a fairly good job of getting close to the final estimate. The problem arises when coming out of the shock, he said.
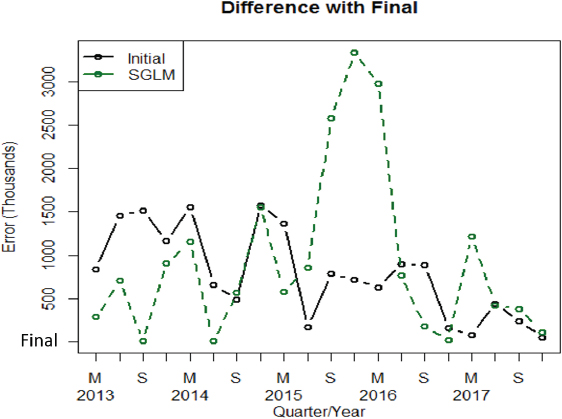
Figure 5-4 is a companion to Figure 5-2. It shows the difference between the final board estimate and the SGLM estimate, and between the final and the initial estimates. It confirms the fact that the model did well going into the epidemic, but was not good coming out of the epidemic.
In summary, referring to the four criteria, Corral noted that the SGLM, like the KFM, captures equilibrium well. It is good at adapting to shocks but not at adjusting during recovery. It does not account for biological constraints and does not satisfy balance-sheet requirements. This summary illustrates the strengths and weaknesses of the KFM and SGLM. Corral said NASS hopes that the model described in Chapter 7 makes progress toward meeting the four criteria that he set forth earlier in this chapter.
DETECTING DISRUPTIONS
Corral briefly described a third, new model to identify shocks developed by Wang and colleagues (2019). It is a Bayesian, hidden Markov model that captures the dependence structure in the data. The model uses a Dirichlet mixture model with an unknown number of distributions for the non-null hypothesis. The algorithm allows for an optimal false negative rate, while controlling the false discovery rate. As input, it uses a variety of variables, including sows farrowed, pig crop ratios, and differences in revisions. Corral runs the model quarterly and provides its indication of a shock (if any) to the Hog Board. The only challenge NASS has with this model is that it is not good at detecting a shock that begins in the current quarter.
Corral concluded by saying that the KFM model is the most useful tool for NASS right now and the one currently used. Its shortcomings arise during shock periods. The Wang et al. diagnostic tools are useful and provide needed information, but have a lag in detecting a shock.
DISCUSSION
Schulz asked whether the KFM constraints are dynamic or static. He noted in considering hogs moving between weight groups or going to market, there is potential for operators to speed or slow that process,
possibly depending on market hog prices, slaughter capacity, finishing capacity, or feed prices. All of those factors can potentially move the biologic process perhaps by as much as several weeks. He noted the relevance for disasters such as flooding, when hogs might be delayed in getting to market for a week or so. Corral replied that the constraints in the KFM are static. Since the beginning of the project, he added, the static constraints have been discussed by team members as they try to improve models.
Andrew Lawson asked for the definition of a shock. He said that some things are easier to detect than others, and some shocks are slow and start building, while others are very sharp. Some shocks may be predictable and some not. He noted shocks could vary in terms of their impact on biology because different diseases might vary in their predictability and their impact.
Corral responded that kind of thought process led to consideration of a web-scraping technique (discussed in Chapter 6) as a totally independent data source. If a shock exists and people are reporting it, web scraping should capture it.
Nell Sedransk defined a shock as any event that will have a substantial effect on hog inventories and hog inventory estimates (see also Chapter 3). With that definition, a shock can be many things. Diseases have different patterns than disasters. But all types of shocks mean the equilibrium model will fail in some way. The goal is to counter that failure and to provide hog inventory estimates that are valid and accurate to the board. She agreed that some shocks can start small, pointing to how PEDv began. The granularity of NASS data and reporting is quarterly. However, web scraping may yield indications of a shock at any time. She noted that the rigidity in the KFM derived from the heavy weighting of past data, which is why it lags in picking up changes. It also lags in some sense because hard constraints are placed on data, not on parameters.
Chris Wikle asked about the number of free parameters in the KFM and whether they are estimated in every run. Corral replied that parameters are estimated in every run, with perhaps six or seven parameters estimated in each run. Wikle asked about any problems with convergence during estimation, and Corral said he has not had that kind of problem. Wikle also asked about variation from quarter to quarter in estimated parameters. Sedransk noted that they have not conducted an examination
of the parameter estimates, but that her impression is that during equilibrium they are relatively stable.
Wikle expressed interest in point estimates and their uncertainties. Sedransk said that the problem is that the model is rigid and not as responsive to data inputs. Consequently, she noted, it is always biased toward the time series estimate, which in most cases is the equilibrium model. Wikle noted the phenomena might be due to the fact that the data are constrained as opposed to the parameters being constrained. In this biological world with integrated population models, those constraints would probably have not been on the data but would have been on the process.
Eric Slud asked about possible changes to the KFM, which is partly constrained by not accounting for covariance. For example, even without any new data sources, accounting for the most current revisions to past quarters’ data should result in an improvement, he suggested. With new data streams, covariates from other sources could also be used.
Katherine Ensor commented NASS basically has two state-space models with different formulations. What NASS calls a KFM is a state-space model with a Kalman filter as a tool, she said, and the SGLM was not constrained. NASS could potentially add constraints to the SGLM as a way to merge the two approaches, she suggested. Matthew Branan asked whether NASS has considered model-averaging approaches. In his view, KFM is very rigid and SGLM is too responsive to potential dips in inventory. Perhaps an average would work better, he suggested.
This page intentionally left blank.


