
2
Motivation and Challenges
In the first technical session, Nell Sedransk, director of the National Institute of Statistical Sciences, provided an overview of project goals and challenges. She described the responsibility of the National Agricultural Statistics Service (NASS) to produce quarterly national- and state-level estimates of hog and pig inventories by weight groups, the NASS approach to preparing estimates, the reasons for developing models, and challenges raised by shocks to the system such as disease. Katherine Ensor (Rice University) moderated the session. The presentation was followed by questions and answers from the audience.
OVERVIEW OF HOG MODELS
Sedransk noted her and subsequent presentations represent a NASS team effort. The findings and conclusions are those of the authors and should not be construed to represent any official U.S. Department of Agriculture (USDA) or U.S. government determination or policy.
She began by describing the clear requirements of the problem. NASS produces and publishes quarterly estimates of U.S. hog inventories by category, as well as estimates for selected states. Hog inventory is a Federal Principal Economic Indicator and, as such, has clear requirements for publication.1 Variables collected on the Quarterly Hog Inventory Survey (described in Chapter 3) and published quarterly span the process from breeding through marketing and include counts of sows farrowed (giving
___________________
1 The Office of Management and Budget’s Statistical Policy Directive No. 3 states “Economic indicators must be released promptly…. (This) reduces the chance of unauthorized, premature disclosure.”
birth), pig crop, market hogs by four weight groups, and breeding stock. A key derived variable is litter rate (pig crop divided by sows farrowed).
Sedransk noted that before about 2008, NASS did not have a model. At that time, the survey estimates and state-level recommendations provided by the NASS state offices were reviewed and evaluated by an expert group (now called the pre-board) within NASS, revised if necessary, and provided to the Hog Board, one of the Agricultural Statistics Boards (ASB). Using survey estimates, state-level recommendations, revised estimates from the expert group, and auxiliary information, the ASB made final determinations and set the official NASS estimates for U.S. totals and then the state-level estimates for selected states (for more information on the ASB, see Chapter 4). State estimates were constrained to add to the determined U.S. totals.
Since modeled results have become available, this process has adapted but is largely unchanged. Present-quarter survey data are a key input to the model. Model-based estimates are first provided to the pre-board along with survey estimates and state recommendations. Based on any revisions from the pre-board, the model may be rerun to obtain model-based estimates for presentation to the Hog Board. The timing of this sequence is such that run time for the model can be no more than 2 or 3 hours.
Sedransk described the value that could be added to the process by good models. First, a model would provide statistical estimates with standard errors. Estimates and standard errors would be based on survey data, as well as reflect the internal relationships in the data between and within quarters. It could reflect long-term trends and seasonal patterns, localized geographic events or differences, and composition of inventory based on biology (breeding, growth, death, market). Models may be predictive, and differences between the data and the prediction might help to identify change points. A model might help to allocate national numbers to state numbers.
MODEL COMPONENTS AND AVAILABLE DATA
Sedransk identified components of a hog inventory model that will be important to include, noting no one model will always be best. First, accounting for trends and seasonality is important. Hog inventory data have a strong seasonal component—peaking in autumn months and
decreasing in spring months. The seasonality is more pronounced in the northern regions than in the south with regional differences due to climate, weather, feed, and other factors. In addition, the data show a slow long-term upward trend that has been present for decades.
Constraints help to make the model estimates more consistent and relevant. Constraints that may be relevant include local (temporary) caps on slaughterhouse capacity or slaughterhouse access; biological factors (e.g., reflecting hog growth over time and the quarterly reporting of inventories by weight category); and so-called balance-sheet constraints. A balance-sheet constraint shows current inventory equal to previous inventory plus new inventory (growth into category, purchases, and imports) minus loss of inventory (death, slaughter, exports, or sale).
Publicly available data include the historical official NASS estimates for all inventory items at the national level and state level (for selected states) that have been published quarterly in the Hogs and Pigs Report.2 These data include initial (first published), revised between first and final, and the final estimate (published five quarters after the initial estimate). The final estimate is regarded by NASS as its most accurate. The historical survey-based hog estimates by category at the national and state level are available within NASS. These data items have been consistently reported using the same definitions since 2008. However, total hogs have been reported annually by NASS since 1866 and total market hogs have been reported since 1963. These long series can reveal long-term trends and the impact of previous epidemics.
NASS also has access to information from USDA’s Food Safety and Inspection Service—historical national-level hog slaughter numbers published monthly. These numbers are important because almost all pork in the market comes from hogs that go through inspected slaughterhouses. The count of hogs slaughtered reflects the most accurate count of hogs raised for market.
Sedransk noted that hog inventories are dominated by large operations whose supply of pork to market is a huge production process. The process thrives on uniformity. As a result, the pig and hog survival function in equilibrium is remarkably stable. In the absence of disease, hogs that weigh 100 lbs. are very likely to go to market at about 265 lbs. Hog growth from birth to weaning, pig crop to market weight, are well
___________________
2 For more information, see https://usda.library.cornell.edu/concern/publications/rj430453j?locale=en.
defined and stable, though there are some slight seasonal differences in the growth rates by region. The system is so stable it leads analysts to rely heavily on past data to evaluate reasonableness of survey results. This process works well in times of equilibrium, she said.
DISEQUILIBRIUM
Sedransk explained some of the challenges with modeling and accounting for shocks are that the impact depends on the event (disease may kill pigs of a specific age group, may result in smaller litters, or may result in culling to prevent the spread of disease), as well as an operation’s response that can be localized and dynamic. Natural disasters tend to have localized impacts, slaughterhouse capacity limitations may be regional, and market forces can be national, regional, or localized.
Sedransk showed a number of charts illustrating the impact of the Porcine Epidemic Diarrhea virus (PEDv) that began in 2013. The first set of charts (not pictured here) showed time series for U.S. Total Hogs, Iowa Total Hogs, and Colorado Total Hogs from March 2012 through November 2013 to illustrate the start of the epidemic. The second set (see Figure 2-1) showed the same time series but from March 2012 through November 2015 to illustrate both the epidemic and recovery. Looking at the data through November 2013, the U.S. Total and Iowa Totals showed virtually no impact of the disease. Sedransk noted that Iowa is dominated by very large operators, which also dominate the U.S. total. In contrast, Colorado showed a clear drop in inventories. The Colorado plot might have been useful as an early indication of PEDv. However, the decline in Colorado was not enough to show up in national totals because the U.S. Total is not responsive to what happens to small states or small operations. Figure 2-1 illustrates both the initiation of PEDv and the recovery. The U.S. level illustrates the decline and a relatively quick recovery. Like the U.S. Total, the decline in Iowa was profound, but the recovery was quite quick because of large operators’ ability to recover more quickly. In contrast, the downturn in Colorado persisted longer. This illustrates the differences among states, large and small operators, and the spatial component of the modeling challenge, she said.
She noted that emerging disequilibriums are challenging to detect. They likely have a spatial component; they can be localized and may or may not be reflected in national totals. They can be spatially dynamic.
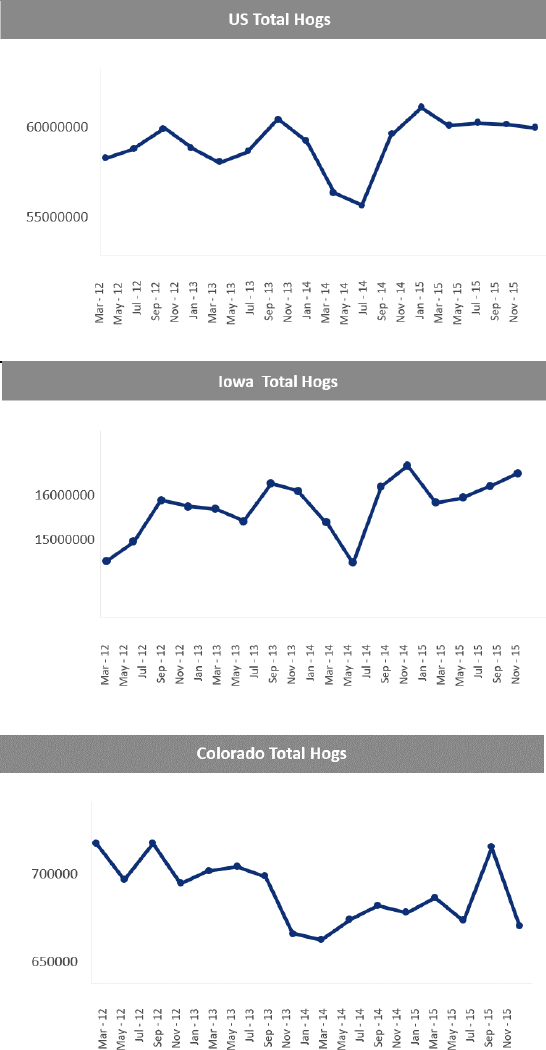
SOURCE: Prepared by Nell Sedransk for presentation at the workshop.
They may impact large and small operators differently. The approaches NASS has pursued to confirm or detect a shock include data diagnostics (using existing data) and web scraping.
MODEL DECISIONS
Sedransk observed that a number of approaches to modeling can work, and NASS needs to decide on one approach. One of the fundamental decisions is whether to pursue one comprehensive model or several models that may be linked, switched, or compounded. If there is an equilibrium model, diagnostics are needed to help identify departures from equilibrium. Another question is whether the model should be top down, starting at the national level and partitioning down to the state level, or bottom up, starting at the operator level or state level and aggregating up to the national level. Good data are key to a successful modeling effort, she stressed. Data are needed at the appropriate level of detail that reflect important aspects of the process. One question is how to incorporate new types of data, such as spatial imaging. Sedransk noted that imputation for nonresponse of large operators is important. If based solely on past data, the imputation may damp out the impact of a shock, making the shock more difficult to detect.
She noted some technical issues with modeling to account for shocks, such as how to make inferences for nonsampled operations. If an operation has an outbreak of disease, it is not necessarily true that all other operations in the state are at risk, but those closer to the affected farm are at greater risk. One question is how to account for this spatial component of disease spread. Another question has to do with estimating uncertainty for hybrid models with mixed components. Errors can be due to model fit, model specification, or sampling variability. She reminded the audience that computations must be done within 2 or 3 hours, a point expanded upon during the discussion.
DISCUSSION
Ensor started the discussion by asking about the computing-time constraint of 2 to 3 hours, given the amount of data to assimilate. Linda Young (NASS) replied the constraint relates to the role of the NASS Hogs and Pigs Report as a Federal Principal Economic Indicator. As such, one of the directives is that estimates are released to the public
according to a prespecified schedule. From the day sampling starts until publication of the official NASS estimates is less than 1 month. There is a time restriction on everything in this process. It takes more than 15 days to collect and summarize the data. Sedransk added that the data collection is quite large, with about 7,500 operations across the United States surveyed quarterly.
Gavin Corral (NASS) reported that he runs the current program to provide model-based estimates to the ASB. The timeline of getting the data happens very quickly. Usually the data come in on a Wednesday and he has 2 or 3 hours before the numbers are due to the pre-board. There is a lull time while the pre-board meets, then the model must be rerun for the ASB with updated input from the pre-board.
Ron Plain (University of Missouri, emeritus) asked who is involved at the state or regional level in developing state recommendations. Dan Kerestes (NASS) replied that data are collected, edited, and analyzed by NASS staff in the field offices. State recommendations and survey estimates are prepared by field office staff who are experienced in working with the hog data.
Ensor asked about automation of the data collection process. Kerestes said over the years, NASS has improved the data collection process. For example, individuals can now respond through the Internet versus mailing back questionnaires. Some large operators request personal interviews, and enumerators go to their farms and conduct interviews to collect the data. Some operators feel that it is more secure to give the information to someone they have been seeing for the past 10 to 15 years.
Matthew Branan (Animal and Plant Health Inspection Service) asked where the model sits in the overall process. Young replied that the model estimates are used in the process of setting estimates. The model is run to provide input to a pre-board analysis, where it is considered along with other information. Based on the results of the pre-board analysis, the data inputs to the model are updated and the model is run again to provide input to the ASB. Corral added that the model results are considered to represent one scenario to describe the current quarter’s data along with other scenarios. Kerestes added that the model estimates come in as another input to the ASB along with the recommendations from the field offices and the analysis by the pre-board.
Lee Schulz (Iowa State University) said as a consumer of the data, he appreciated the opportunity to meet the people involved. He asked whether data quality might contribute to the challenges related to detecting disequilibrium and asked about improving the accuracy of the data. Young replied she does not think data quality is the root of the problem. Part of the reason the data collection extends so long is the need to feel comfortable with estimates from key operators. Sometimes there are delays from one of the operators, and numbers must be adjusted as a consequence of that additional information.
Young pointed to Sedransk’s charts to indicate the problem, noting there was no early signal for PEDv in Iowa, the nation’s top hog-producing state. The signal for PEDv was in Colorado, which produces much less. It is difficult to detect shocks that start with small operators in small states. Kerestes noted that when hogs become ill, operators themselves may not know immediately if the disease will have a big impact. Every disease is different. It is not clear how quickly operators report incidents because they do not always understand the situation.
Eric Slud (University of Maryland and U.S. Census Bureau) suggested that it might be feasible to compute point estimates related to hog totals within the required 2 to 3 hours, with technical documentation and difficult-to-compute variance estimates released later. He asked whether this might be acceptable to NASS, adding that it has been done by the Census Bureau. Young replied that they would have to carefully consider that option.


