
7
Modeling Swine Population Dynamics
Luca Sartore (National Institute of Statistical Sciences and National Agricultural Statistics Service [NASS]) explained NASS’s most recent hog inventory model. It is an innovation that incorporates swine population dynamics. Ron Plain (University of Missouri–Columbia) served as moderator for the session. The presentation was followed by questions and answers from the audience.
CURRENT MODELING INNOVATIONS
Sartore explained that NASS is interested in a model that produces estimates at a finer temporal and spatial resolution than currently used models. In particular, although NASS publishes quarterly estimates, the new model, called Satorie, Wei, Abayomi, Riggins, Corral, Sendransk (SWARCS) after its developers, is designed to prepare monthly estimates for pig crop and sows farrowing to better account for swine population dynamics. Other variables use a quarterly model linked to the monthly model. NASS would also like the model to prepare both state- and national-level estimates, to be flexible enough to capture shocks, and to combine several sources of information (survey data, historical NASS published estimates, and state recommendations). The model must also produce estimates within 2 hours. Sartore described the monthly models at the national level, along with discussion of other ways under consideration for making the model flexible enough to capture shocks, such as using nonconstant survival rates.
When the survey data are available and aggregated, and auxiliary data are prepared, the model is run. The information (data as well as model estimates) is considered during the pre-board meeting. The pre-board determines alternative inputs to the model, and the model is rerun using those inputs. The result is provided to the Hog Board as one of the scenarios for consideration. As described in Chapter 4, the Hog Board determines the initial official NASS hog inventory estimates.
CALIBRATION
Calibration is used to correct for biases in survey data prior to input into the model. Sartore described the estimation of ratios to adjust for survey undercoverage. There is a time series of quarterly ratios defined as the ratio of the official U.S.-level board estimate for variable k at time t to the U.S.-level survey estimate for variable k at time t. One objective is to model and predict these ratios. The actual procedure is more complex, because a different ratio can be computed for each potential revision of the initial published estimate (1) to the final revision (5). NASS applies a neural network model that uses hidden layers to capture the optimal adjustment for a quarter. The monthly adjustment ratios are set equal to the relevant quarterly ratio.
This process results in estimated national totals. The state-level recommendations must also be adjusted to add to national totals. A Lagrange multiplier approach is used to produce an estimated ratio to apply to each state recommendation. The calibrated monthly and quarterly historical and current data are used as input to the model.
The new model has two distinct parts: hog production, tracking breeding through birth and weaning (a monthly model); and hogs to market, reflecting the growth of hogs through weight groups to slaughter (a quarterly model). According to Sartore, each litter results in about 10 weaned piglets. This number changes with time. The pig crop is made up of the piglets born during the month (quarter) that are still alive on the first day of the quarterly survey reference period. The pig crop in the hog production cycle enters the hogs to market cycle in the two smallest weight groups. Hogs grow through the weight groups until they are large enough to go to slaughter.
There are monthly models for the pig crop and sows farrowed (the only variables with monthly data). The log of each of those two variables
is assumed to follow an seasonal autoregressive integrated moving average (SARIMA) (2, 1, 2) × (2, 1, 2)12 model. The model also includes a contemporaneous time-varying linear relationship (no constant) between the monthly pig crop and monthly sows farrowed at time t with no error term; and a linear relationship (no constant) between monthly sows farrowed and the quarterly breeding herd inventory 2 months earlier plus an error term.
Parameters are estimated by minimizing the sum of squared residuals plus a penalty function involving the product of a positive parameter “delta” and the sum of the absolute values of the AR and MA parameters. Estimation uses an iterative EM algorithm. Initial values of parameters are set to zero, except for the farrowing rate, which is set to 1/6. The selection of parameter delta involves a LASSO regression and cross validation. The LASSO penalty shrinks the parameters of the time series models to zero, allowing an automatic model selection.
Sartore showed a plot of the SARIMA parameters as a function of delta, pointing out that when delta is 1, the estimated parameters are essentially zero; as delta becomes smaller the parameters estimates approach the least squares values. He observed that the graph illustrates that four parameters are significant. These four are selected for inclusion in the model and estimation is rerun.
Sartore provided the equations that relate the quarterly market hogs by weight group as a function of the monthly pig crop data plus an error term. For example, the smallest weight group is a linear combination of the pig crop for the most recent 3 months (t-1, t-2, and t-3), each multiplied by a different survival rate. Only a fraction of the pig crop in month t-3 enters the smallest weight category; the rest enter the next weight category. The next weight category is a linear combination of the monthly pig crop for months t-3, t-4, and t-5, again each multiplied by its own survival rate. Only a fraction of the pig crop in t-5 enters this weight group, the rest enter the next (second-largest) weight category. The piglets in the second-largest weight category are those born in months t-5 and t-6, each multiplied by a survival rate. A fraction of the pig crop in month t-6 goes into the largest weight category. The largest weight category is a linear combination of the pig crop at months t-6 and t-7. Only a fraction of the pig crop at time t-7 enters the largest weight category. The
parameters to be estimated are the survival rates and the transition parameters between weight groups.
Sartore showed a graph illustrating estimated survival rates over time. The estimated survival rates show some seasonality and a decrease during the years of the epidemic. These survival rates are fairly stable, tending to be around 0.95 before the epidemic, and a dip during the epidemic to about 0.88. Since the epidemic, survival rates have returned to about 0.92. The quarterly estimates of survival rate and weight group transitions are estimated by minimizing the sum of squared errors subject to two constraints: The survival rates are constrained to be close to 1 and to form a smooth function over time. Estimation uses the Broyden-Fletcher-Goldfarb-Shanno iterative algorithm with initial survival rates set to 1, transition rates for the first two weight categories set to 0.25, and for the last two weight categories set to 0.75.
Sartore said that the model is estimated in stages. The first stage involves combining the historic data, the latest survey indications, and the state recommendations. The second stage involves updating the information from stage 1 with estimates from the pre-board to account for additional information from experts.
Sartore compared the new model and the Kalman filter model (KFM). In particular, for all nine published estimates, the root mean square errors (RMSEs) and mean percent errors (MPEs) were produced between model estimates and both the initial and the final board estimates. The MPE provides a measure of the relative bias while the RMSE provides a measure of variation due to both variance and bias.
For both models, MPEs were similar (same direction, similar magnitude) for both initial and final board estimates. The MPEs were fairly small, less than 1 percent except for breeding herd inventory, for which the MPE was slightly greater in magnitude than negative 2 percent for the new model, and about negative 1 percent for the KFM. RMSEs from the initial estimates tended to be somewhat smaller for the new model than for the KFM, except for pig crop, sows farrowed, and breeding herd. RMSEs from final estimates were somewhat smaller than those of the KFM for all variables except breeding herd.
Sartore showed graphs illustrating the time series of initial board estimates, the final board estimates, and the two model-based estimates for pig crop and for total hogs. Figure 7-1 shows the plot for total hog
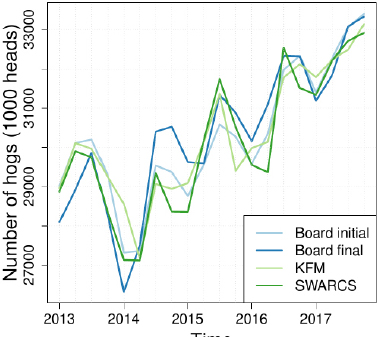
NOTE: KFM = Kalman filter model; SWARCS = Satorie, Wei, Abayomi, Riggins, Corral, Sendransk.
SOURCE: Prepared by Luca Sartore for presentation at the workshop.
estimates over time. Light blue represents the initial board estimate, dark blue represents the final board estimate, light green represents the KFM, and dark green represents the new model.
The figure illustrates that during the epidemic and recovery, the initial estimates, KFM estimates, and new estimates were fairly similar. Only the final board estimates revealed the full impact of the epidemic in December 2013 and fully illustrated the recovery during 2014 and 2015.
In summary, Sartore said the new model dynamically accounts for the hog lifecycle, incorporates a flexible description of equilibrium disruption, uses an external accounting relationship, and can adjust to shocks though perhaps not to the extent desired. He said that an issue remains with estimates for the breeding herd. In the future, he said, NASS would like to extend the model to provide state-level estimates; provide a time series model for survival rates instead of using a spline-based approach; account for data quality at the operation level; and incorporate web-scraping information for disease outbreak detection.
DISCUSSION
Matthew Branan (U.S. Department of Agriculture) observed that both models seem much closer to initial estimates than to final estimates. He asked whether Sartore has discussed with board members how they are
incorporating new information in those final estimates. Sartore replied that there has been some discussion. New information comes primarily from new slaughter data that are available regularly at a national level but are not yet available at the time the initial estimates are made.
Katherine Ensor asked about any out-of-sample performance metrics for the model, such as where the model is trained on one part of data and evaluated on another. She noted when using LASSO or similar methods, it is usually important to evaluate out-of-sample performance to avoid over-fitting. Sartore has not done out-of-sample comparisons but explained that he is using LASSO in a different way. With every model run, the parameters selected may be different. If it is a stable period, the same parameters are usually selected, but during times of shock, the parameters selected may be different. Ensor suggested changing the parameters, not just popping variables in and out of the model during a shock. Linda Young asked whether the model should have time-varying parameters. Ensor said that time-varying parameters should be evaluated because dynamics in the current model for pig crop and sows farrowed are captured by variables that go in and out, with new parameter estimates each time.
In answer to a question from Ensor, Sartore said monthly data are collected in the quarterly survey. For example, an operation that responds to the survey as of March 1, reports sows farrowed and piglets born in February, January, and December.
Christopher Wikle said an impressive aspect about state-space models is the clear distinction between data and process. He observed that the distinction is lost in this new work and questioned how uncertainty is propagating. He asked whether Sartore has made estimates of the coverage probability1 of his forecast, or the state estimates relative to known conditions. Wikle said that he did not see much difference between the KFM results versus the new model in the plots, saying without uncertainty bands, the difference may not be significant.
Sartore said he has not yet looked at the variance estimates from the models. Wikle suggested Sartore may be accounting for some uncertainty but not in a model-based way. Sartore said that he is accounting for variation by the curvature of the objective functions that he is optimizing. Wikle said that the problem with using optimization instead of a
___________________
1 The coverage probability is the proportion of the time that an interval contains the true value of interest.
model-based approach is there is no way to quantify the effect of uncertainty on estimates. Sartore said that recent research shows the variance can be approximated, but it might be worthwhile to look at the differences between an optimization approach and a model-based approach.
Young reminded the audience about Eric Slud’s earlier question about whether variance estimates could be published sometime after the official estimates are released. She and Dan Kerestes determined that if NASS has good point estimates, there would not be a problem in delaying the publication of variances if necessary. She said quantification of variances is one of the things NASS needs to do no matter what model is used. NASS has two key issues: developing variance estimates and developing state-level estimates. The NASS KFM previously produced state-level estimates, but they were not considered useful. Whether NASS can do better with the current model remains to be seen, she noted.
Wikle said that he finds the exercise of comparing models without a measure of uncertainty almost ill-posed. Young said that she appreciated his perspective, but added that industry looks at the point estimates, and they might look at an estimate for a day’s slaughter data for comparison.
Slud commented the argument about what users want is similar to arguments the Census Bureau hears. Users want the point estimates, and it is not always clear that they use the variance estimates. He asked for clarification about NASS strategy for variance estimation. He said looking at curvatures of objective functions is somewhat analogous to looking at the curvatures of likelihoods, so it would be like modeled parameter estimates. However, there are also survey variances that should be propagated. In ordinary combinations of those approaches, survey variances may be used for certain aggregated quantities and then a parametric bootstrap used to understand the role of the model. Sartore replied that the work on variances is not really done, but they have tried to combine the variance from the survey with those from the likelihood. This would be an approximation since there are so many parameters.
Slud said that the only way he knows to combine survey variances, such as those obtained from a bootstrap or jackknife, with model variances is to do parametric model bootstrap loops within survey-bootstrap loops. Sartore replied that it has to be done that way.
Ensor asked about the choice of LASSO to select ARIMA parameters. She said that the challenge is that it does not lead to a stable
process over time. Sartore replied that he initially did an analysis on a spectrum level, looking at autocorrelations and partial autocorrelations of the monthly estimates for the pig crop and sows farrowed. Ensor noted that those models include first and seasonal differences and asked about the importance of the seasonal difference. She observed that the seasonal difference is a strong operator, essentially accounting for a correlation of 1.0 between observations 12 months apart. Sartore replied that it was to account for the obvious annual seasonality. He observed that the KFM also uses first and seasonal differences, but for quarterly data.
Slud asked whether at the end of the model fitting, there is a well-defined model from which to microsimulate a dataset to use for testing model consistency. Sartore replied that it would be possible to do.
Michael Schweinberger (Rice University) asked whether NASS has considered splitting the estimation problem into two parts to get around the 2-hour time constraint. The first part would be the estimation stage during which all the historical data would be processed and parameters estimated. This could be done well before current data are available and well before the time crunch. The second part would involve updating equations to account for current data as part of a sequential approach. Sartore said although he had considered this approach, he has not tried to implement it because it only takes 15 minutes to run his model, without preparing uncertainty estimates. As he adds complexity to the model, however, he may need to consider a sequential approach. Schweinberger added a Bayesian approach would support quantification of the uncertainty about estimates by looking at the posterior distribution. He asked whether NASS has considered a sequential sampling approach with an initial sample of perhaps 100 operators. Once the data are in, a decision could be made as to how much additional information is needed and, if determined, another 100 operators could be surveyed. Young said that NASS has not considered sequential sampling.
Ensor noted that NASS maintains a history of operators, including non-respondents, as well as information about the quality of the data they provide. She wondered whether that history could be built into the modeling. Making estimates as the data come in, perhaps having a reasonable estimate with early responders that provide good data, may be
helpful. Young replied the agency would need to check on the feasibility of this approach. The field offices collect the data, prepare estimates, and send them to headquarters.
Plain asked a final question about the comparison of RMSEs between the two models and initial estimates for all published variables. He observed that for the pig crop, the old model seemed to perform better; however, for market hogs under 50 lbs., the new model seemed to perform better. This is interesting because there is a very high overlap between the hogs in those two categories, he observed. He questioned why one model would predict better than the other. Sartore responded he can improve the new model for pig crop and sows farrowed.
This page intentionally left blank.


