
5
Technologies for Reducing the Power Demand of MHDVs
5.1 INTRODUCTION
This chapter describes the disposition of the fuel energy processed by a heavy-duty engine and particularly that converted into mechanical work and delivered to the vehicle. It reviews the findings of studies on truck fuel consumption, focusing on the largest vehicle segment, Class 8. The net power output of a truck engine is consumed by numerous components. The power consumption of all such components is proportional to truck speed. In addition there are several other factors responsible for power consumption of a tractor-trailer, the most significant of which are aerodynamic loads, which depend on the cube of truck speed, truck frontal area, and friction of the air drag; and tire rolling resistance, due to flexing within the tires and road friction. Depending on truck speed, these two components consume 60 to 85 percent of this power. The power inventory includes numerous truck auxiliary devices plus major driveline components, typically those related to engine speed. When encountering positive grade or accelerating, power demand is proportional to vehicle weight and grade.
5.1.1 Base Case for Over-the-Road Tractor-Trailer, Circa 2013 Specifications
The nature of heavy truck power use can be better appreciated if it is summarized in a use inventory. This class of truck has a regulated gross vehicle weight (GVW) of 80,000 pounds on interstate highways. Table 5-1 shows an inventory developed by the U.S. Department of Energy’s 21st Century Truck Partnership (21CTP) for a typical Class 8 high-roof sleeper cab tractor-van trailer combination carrying a payload of 26,000 pounds and operated on an unspecified over-the-road drive cycle. (Duty cycles have a highly variable characterization throughout the varying elevation contours, speed limits, and road congestion in the United States.) The chosen payload was 57 percent of the allowable interstate capacity for this truck. The 21CTP has designed this inventory which appears more actual-duty representative compared to a traditional, useful, and long-used inventory described as a fully loaded, steady speed, and level road characterization (see NRC, 2010).
Notice this inventory reported a fuel economy figure, and a load-specific fuel consumption (LSFC) result. The LSFC is perhaps the most useful metric to evaluate heavy-truck consumption reduction because it embodies use of the freight payload weight. Efficient payload transport is the objective of the tractor-trailer industry.
Last, the 21CTP inventory developer coined a useful phrase, tractive power (TP), to describe the three vehicle power demand (VPD) energy consumers: aerodynamic drag, rolling resistance, and inertia/braking loss.
TABLE 5-1 Vehicle Power Demand Inventory for Over-the-Road Tractor-Van Trailer with Average Payload
| Operating vehicle weight: 60,000 lbs (27,220 kg) | Vehicle power demand (VPD): 146 kW |
|---|---|
| Average payload: 26,000 lbs (11,800 kg); short tons: 13 | Aerodynamic drag: 61 kW (Cd: 0.60) |
| Miles per gallon: 5.8 | Rolling resistance: 44 kW (Crr 0.007) |
| Loada specific fuel consumption: 13.3 gallons/1000 ton-miles | Inertia/braking: 16 kW |
| Fuel input: 343 kW | Auxiliary load: 15 kW |
| Engine loss (EL): 193 kW (BTE: 0.43) | Drivetrain loss: 10 kW |
| Idling fuel use (IF): 3.6 kW | Total fuel consumed (EL+IF+VPD): 343 kW |
| Engine output: 146 kW | |
a For payload only, calculations were done using “long tons” (long ton = 2,200 lbs).
SOURCE: 21CTP (2013).
5.1.2 Multiplicative Effect of Vehicle Power Demand Reduction on Engine Fuel Consumption
In conventional vehicles the road load power is supplied by an engine via a transmission and one or more drive axles characterized by an effective efficiency (ή). A corresponding simple engine power demand (Peng) model is given by the following (in this equation, the intended VPD components are those described TP consumers):
Peng = (VPD / ή) + (auxiliary load) / BTE
The significance of this relationship can be illustrated by considering the reduction in any of the VPD energy consumers. For example, consider the accomplishment of a 20 percent aerodynamics drag reduction (producing about a 10 percent fuel consumption reduction) in the case illustrated in Table 5-1. That reduction would be 10 percent × 61 kW = 6.1 kW. Applying the above equation, Peng (reduction) = 6.1 kW / 0.43 = 14.2 kW. So, VPD reduction has a powerful leverage in reducing actual engine fuel energy (power). Indeed, we have observed that two of the SuperTruck (ST) programs have reduced their engine size and maximum power rating.
While this relationship is valid, its numerical application requires the user to apply the achieved VPD reductions over the engine operating cycle speed-load points to achieve the cycle-average efficiency (ή-avg) in the equation.
5.1.3 Vehicle Power Demand Reduction Goals Established by 21CTP
Many trucking fleets have not only routinely evaluated and adopted truck components that were demonstrated to reduce fuel consumption within their particular return-on-investment (ROI) hurdle, but they have also paid increasing attention to operational fleet management system tools, which, they found, would better manage typical driving cycles, as well as monitor and control driver behavior (TMC, 2014). The 21CTP is a government-industry partnership with the goals of research and development, demonstrations, validation, and deployment of cost-effective, reliable, and durable technologies that reduce vehicle power demand with the goal of improving overall efficiency of heavy vehicles. The program represents some of the highest achieved efficiencies in research vehicles and in deployed technologies, and provides a guide to future achievable power demand reductions. The 21CTP Roadmap and Technical White Papers (2013) offer specific technology goals for vehicle power demands, which might be effectively achieved within a 10-year window, as follows.
Technology Goal 1: Develop and demonstrate advanced technology concepts that reduce the aerodynamic drag of a Class 8 highway tractor-trailer combination by 20 percent (from a drag coefficient [Cd] of 0.69 to 0.55). Evaluate a stretch goal of 30 percent reduction in aerodynamic drag (from Cd=0.69 to Cd=0.48). The baseline for this goal is the proposed Environmental Protection Agency (EPA)/National Highway Traffic Safety Administration (NHTSA) baseline of Cd=0.69 with 9.2 m2 frontal area for a conventional Class 8 tractor with high-roof sleeper.
Technology Goal 2: Develop and demonstrate low-rolling-resistance tires that can reduce vehicle rolling resistance and wheel weight for a Class 8 tractor-trailer. Demonstrate 35 percent reduction in rolling resistance
from Crr=8.2 kg/metric ton for drive wheels to a goal of Crr=5.33 kg/metric ton. The baseline for this goal is the EPA/NHTSA proposed baseline for a Class 8 tractor-trailer equipped with low-rolling-resistance dual tire drive wheel configurations having Crr=8.2 kg/metric ton.
Technology Goal 3: Develop and demonstrate technologies that reduce essential auxiliary loads by 50 percent (from current 20 horsepower to 10 horsepower) for Class 8 tractor-trailers. The baseline for this goal is a Class 8 highway tractor-trailer with sleeper operating 5-day over-the-highway operations at 36,000 kg (80,000 pounds) combined gross vehicle weight (CGVW).
Technology Goal 4: Develop and demonstrate lightweight material and manufacturing processes that lead to a 10 percent reduction in tare weight for a 15,500 kg (34,000 pounds) tractor-trailer combination. Establish a long-term stretch goal of reducing combined vehicle weight by 20 percent. The baseline for this goal is a Class 8 highway tractor-trailer with high-roof sleeper and dry van trailer capable of 36,000 kg CGVW.
Technology Goal 5: Increase heat load rejected by thermal management systems by 20 percent without increasing radiator size. Develop and demonstrate parasitic friction reduction technologies that reduce driveline losses by 50 percent, thereby improving Class 8 fuel efficiencies by 3 percent. The baseline for this goal is a Class 8 highway tractor-trailer with sleeper operating at steady-state 65 mph at 36,000 kg CGVW.
5.1.4 Technology Goal for Operational Efficiency and Intelligent Transportation Technologies Development and Deployment
21CTP has not devised a single specific goal in this multifaceted technology field. The following remarks were drawn from this same 21CTP report (21CTP, 2013, p. 124): “With [the 21CTP’s] analysis-backed sense of the magnitude of potential energy savings available from ITS technologies and systems, it is important that DOE and DOT work very closely in this domain so that the magnitude of energy savings attainable with Connected Vehicle systems does not go untapped. Research and development of these applications must be sufficiently funded to assure attainment of the maximum benefits in fuel savings and emissions reductions, in addition to safety and mobility. DOE (as well as EPA) sponsorship of activities in support of other Connected Vehicle research is strongly recommended, and regular communications between the DOE and DOT regarding ITS [Intelligent Transportation System] advancement should be maintained.”
5.1.5 21CTP Goal’s Relation to U.S. Phase II Rule on GHGs and Fuel Consumption
These 21CTP goals all identify viable technologies and potentially achievable reductions. The reductions and timetable requirements differ in the proposed rule but pose no significant contradictions. The proposed Phase II rule states, “The proposed vehicle and engine performance standards would cover model years 2021-2027, and apply to semi-trucks, large pickup trucks and vans, and all types and sizes of buses and work trucks. They would achieve up to 24 percent lower CO2 emissions and fuel consumption than an equivalent tractor in 2018, based on the fully phased-in standards for the tractor alone in a tractor-trailer vehicle” (EPA and NHTSA, 2015) Note the reported 24 percent reduction is for Class 8 tractor high-roof sleeper cabs and relative to the Phase I regulation. Taken together, Phase I and the proposed Phase II amount to a 42 percent reduction in fuel use and greenhouse gas (GHG) emissions from the described model year 2010 baseline tractor.
The International Council on Clean Transportation (ICCT) made an analysis of the anticipated technologies and their estimated production costs. Figure 5-1 reports that analysis for a composite 2027 tractor-trailer. It shows how a Class 8 high-roof sleeper-cab tractor-trailer combination could reduce its overall fuel consumption by approximately 33 percent under Phase II (ICCT’s analysis).1 This is an alternate and slightly more recent view of achievable consumption reductions compared to the 21CTP technology goals forecasts. The status of the research, development, and deployment achieved for each of the six vehicle power demand fuel consumption domains is found in the following sections.
___________________
1 Sharpe, B., ICCT. “5 numbers you need to know about the proposed U.S. truck efficiency rule.” Available at http://www.theicct.org/blogs/staff/5-numbers-you-need-know-about-proposed-us-truck-efficiency-rule (accessed December 19, 2019).
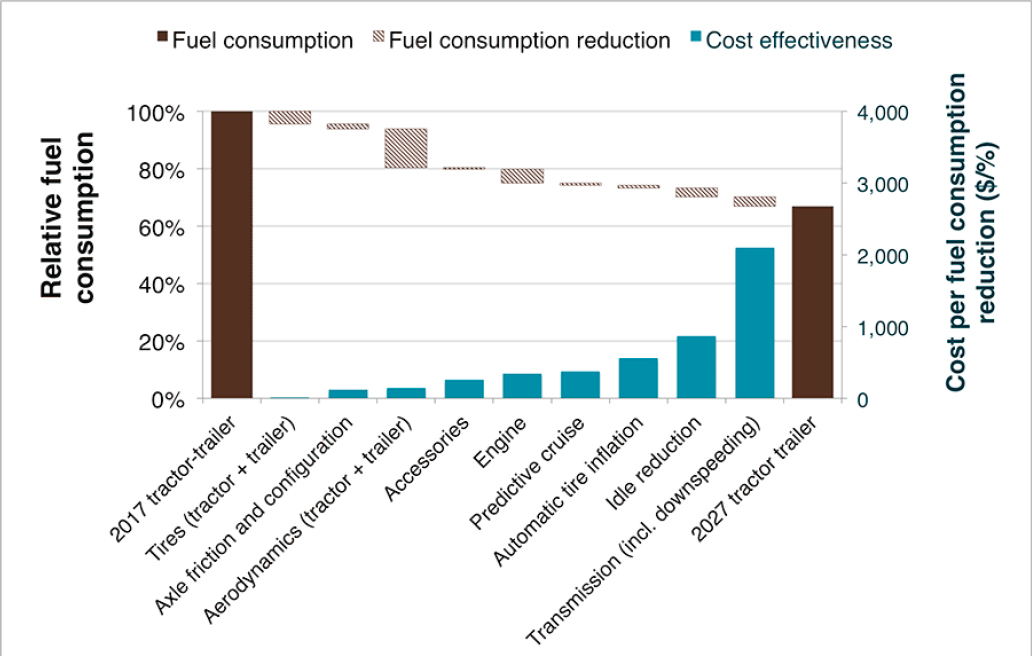
SOURCE: ICCT (2015), © ICCT, reproduced with permission.
Finding: The 21st Century Truck Partnership has taken a step forward in redefining a new baseline with the proposed average power use inventory in the 2013 roadmap and technical white papers. The continuing improvement in reducing fuel consumption from vehicle operations will benefit from evaluating with new baselines over a drive cycle(s) based on real-world operation. The new baselines would take into account such factors as load, grade, speed, torque, distance-based target schedules, and drive cycles over an extended period of time as well as rest periods required by law.
Recommendation 5-1: NHTSA and EPA should coordinate with the Department of Energy (DOE), the California Air Resources Board (CARB), and the trucking industry to develop an inclusive new baseline for vehicle power demands as described in the above finding, for a circa 2025 vehicle that includes an extended period of operation.
5.2 AERODYNAMIC DRAG REDUCTION
This section addresses aerodynamic development only for Class 8b combination tractor-van trailers. This class of trucks consumes 60 percent of medium- and heavy-duty vehicle fuel (see Table 5-2). Notice the application descriptions for the balance of the classes are predominantly city or regional, with substantially smaller annual consumption shares. However, in Chapter 6 of this report, the effects of reducing aerodynamic drag on Class 2b and 6 trucks are shown in simulation along with Class 8 vehicles.
To clarify the emphasis on Class 8b tractors (and trailers) as being the most pertinent trucks for aerodynamic development, refer to the perspective from a recent California Hybrid, Efficient and Advanced Truck Research Center study. That study “classifies CL7-8 over the road tractors as younger trucks, high annual VMT, mostly
TABLE 5-2 Medium- and Heavy-Duty Truck Classes, Applications, and Percent of Fuel Use
| Class | 2b | 3 | 4 | 5 | 6 | 7 | 8a | 8b |
|---|---|---|---|---|---|---|---|---|
| Application | Large Pickup Utility Van, Multipurpose, Minibus, Step Van | Utility Van, Multipurpose, Mini-Bus, Step Van | City Delivery, Parcel Delivery, Large Walk-in, Bucket, Landscaping | City Delivery, Parcel Delivery, Large Walk-in, Bucket | City Delivery, School Bus, Large Walk-in, Bucket | City Bus, Furniture, Refrigerated, Refuse, Fuel Tanker, Dump, Tow, Concrete, Fire Engine, Tractor-Trailer | Dump, Refuse, Concrete, Furniture, City Bus, Tow, Fire Engine (straight trucks) | Tractor-Trailer: Van, Refrigerated, Bulk Tanker, Flat Bed (combination trucks) |
| Fuel % | 11.6 | 3.1 | 1.1 | 0.5 | 12.7 | 4.1 | 7.4 | 59.4 |
SOURCE: NRC (2015).
higher average speed, and highway driving, typically with sleeper cabs … Over the Road trucks represent the majority of emissions and vehicle miles traveled … while only accounting for 10 percent of the population of these vehicles in the state” (CARB, 2014).
Nevertheless, since Class 2b and 3 vehicles are tested on a chassis dynamometer, a Cd must be measured to complete the loading demand. Class 2b and 3 aerodynamic designs are borrowed principally from light-duty vehicle practice (and substantially, that tooling).
The NHTSA and EPA Phase I fuel consumption and GHG rules (EPA and NHTSA, 2011), promulgated September 11, 2011, placed aerodynamic measurement requirements on combination tractor-trailer vehicles. Standards were set with metrics for measurement in grams/ton-mile for CO2 results, and gallons/1,000 ton-mile for fuel consumption. The fuel gallons/1,000 freight-ton-miles metric is also referred to as “freight efficiency.” Certification was achieved via exercise of the EPA’s Greenhouse Gas Emissions Model (GEM) simulation utilizing supplier data for the incumbent combination vehicle.
Aerodynamic performance data for the combination were required to be verified by coast-down testing to support the vehicle performance in the GEM. If enhanced aerodynamic performance was needed to achieve the Phase I standards, they would be incumbent on tractor design only. The EPA standards became effective in January 2014. The NHTSA standards became effective in January 2017.
5.2.1 Baseline Aerodynamic Drag (CdA)
In the Phase I rule, and continued in Phase II, NHTSA and EPA defined bins of aerodynamic performance with specific values of CdA to use in the GEM simulation. Each original equipment manufacturer (OEM) vehicle is assigned to a bin based on test and simulation results. Each bin has a range of CdA values to accommodate the specific vehicle aerodynamic performance, but then in the GEM simulation a single CdA is used for each bin. Since the discussion in industry and the regulations frequently refer to these bins, we include Table 5-3, which shows the example CdA range in each bin as well as the specific GEM value. Note that day cab tractors have a different and distinct set of bins than sleeper cabs.
Additional details on this feature of the rules are in the Regulatory Impact Analysis (RIA) or final rules for Phase I and Phase II. The Phase rule also requires special aerodynamic provisions for the prescribed closed van trailers. (In NHTSA’s technical support document [Reinhart, 2015], the baseline vehicle—a Class 8 tractor-trailer with high-roof sleeper cab—corresponds to bin II.2) The EPA trailer standards would begin to take effect in model year 2018 for certain trailers, while NHTSA’s standards would be in effect as of 2021. The baseline aerodynamic CdA values published in the Phase II standards are shown in Table 5-4 for reference.
___________________
2 The value for Cd is 0.639 and that of the effective frontal area is 10.14 m2, yielding a CdA of 6.48 m2.
TABLE 5-3 Aerodynamic Bins Used in GEM
| Class 7 | Class 8 | ||
|---|---|---|---|
| Day Cab High Roof |
Day Cab High Roof |
Sleeper Cab High Roof |
|
| Aerodynamic Test Results (CdA wad in m2) | |||
| Bin I | ≥7.2 | ≥7.2 | ≥6.9 |
| Bin II | 6.6-7.1 | 6.6-7.1 | 6.3-6.8 |
| Bin III | 6.0-6.5 | 6.0-6.5 | 5.7-6.2 |
| Bin IV | 5.5-5.9 | 5.5-5.9 | 5.2-5.6 |
| Bin V | 5.0-5.4 | 5.0-5.4 | 4.7-5.1 |
| Bin VI | 4.5-4.9 | 4.5-4.9 | 4.2-4.6 |
| Bin VII | ≤4.4 | ≤4.4 | ≤4.1 |
| Aerodynamic Input to GEM (CdA wad in m2) | |||
| Bin I | 7.45 | 7.45 | 7.15 |
| Bin II | 6.85 | 6.85 | 6.55 |
| Bin III | 6.25 | 6.25 | 5.95 |
| Bin IV | 5.70 | 5.70 | 5.40 |
| Bin V | 5.20 | 5.20 | 4.90 |
| Bin VI | 4.70 | 4.70 | 4.40 |
| Bin VII | 4.20 | 4.20 | 3.90 |
SOURCE: EPA and NHTSA (2016b).
TABLE 5-4 GEM Inputs for the Baseline Class 7 and 8 Tractor
| Class 7 | Class 8 | |||||||
|---|---|---|---|---|---|---|---|---|
| Day Cab | Day Cab | Sleeper Cab | ||||||
| Low Roof | Mid Roof | High Roof | Low Roof | Mid Roof | High Roof | Low Roof | Mid Roof | High Roof |
| Engine | ||||||||
| 2017 MY 11L Engine 350 HP | 2017 MY 11L Engine 350 HP | 2017 MY 11L Engine 350 HP | 2017 MY 15L Engine 455 HP | 2017 MY 15L Engine 455 HP | 2017 MY 15L Engine 455 HP | 2017 MY 15L Engine 455 HP | 2017 MY 15L Engine 455 HP | 2017 MY 15L Engine 455 HP |
| Aerodynamics (CdA in m2) | ||||||||
| 5.41 | 6.48 | 3.68 | 5.41 | 6.48 | 6.38 | 5.41 | 6.48 | 5.90 |
| Steer tires (Crr in kg/metric ton) | ||||||||
| 6.99 | 6.99 | 6.87 | 6.99 | 6.99 | 6.87 | 6.87 | 6.87 | 6.54 |
| Drive tires (Crr in kg/metric ton) | ||||||||
| 7.38 | 7.38 | 7.26 | 7.38 | 7.38 | 7.26 | 7.26 | 7.26 | 6.92 |
SOURCE: EPA and NHTSA (2016b, p. 73588).
Using the previously mentioned typical frontal area of 9.2 square meters (m2) and other data showing up to 10.5 m2 (Bhatnagar et al., 2011), the Cd range for Class 8 is 0.51-0.69 which, as expected, is roughly consistent with the literature, as in following examples:
- The Southwest Research Institute (SwRI) simulation work for the committee used a baseline CdA for the Kenworth T700 of 6.84, which was grounded in prior work for NHTSA (Reinhart, 2015, 2016). For NHTSA, SwRI used CdA of 6.26-6.48 for the baseline.
- In the recent North American Council for Freight Efficiency (NACFE) Confidence Report (NACFE, 2016a), “OEM representatives told the study team that current market penetration estimates from EPA suggest that nearly 70 percent of 2015 high-roof sleeper tractor production would fall into the proposed Bin 2, with a CdA between 7.2 and 6.6” (Sproull, 2015).
- In NHTSA and EPA’s RIA (EPA and NHTSA, 2016a, Figure 3-17), results of vehicle tests to support the rulemaking showed wind-averaged CdA of 5.4-6.0 for high-roof sleeper-cab trucks, indicating a moving baseline. Further accounting of the EPA work has been published by the Society of Automotive Engineers (SAE; Gururaja, 2016), which includes the effects of trailer skirts now in use.
- In comments to the proposed Phase II rule, PACCAR showed CdA data for high-roof sleeper tractors concentrated between 5.5 and 7.0.3
- Work conducted and published by National Research Council Canada with a 2014 model sleeper vehicle also showed a baseline CdA of about 6.2, reduced to about 5.0 with skirts and boat tail on the trailer (McAuliffe and Chuang, 2016).
The committee examined recent work such as in SuperTruck to assess the potential reductions in Cd, as well as considering NHTSA and EPA’s estimates for 2027 regulations. Fortunately, aerodynamic enhancements for both tractors and trailers had been pursued by the industry for years. Arguably, tractor enhancements on engine-forward models were first offered by Kenworth in 1985, as described in the Phase I report (NRC, 2010). Trailer aerodynamics achieved via add-on fairings to the leading top edge of vans had been offered for two decades, but with limited carrier uptake. Then beginning in 2004, EPA’s SmartWay initiative provided increased encouragement for carriers to achieve voluntary fuel savings (and associated CO2 reductions) via addition of aerodynamic (and other) features on combination tractor-trailers. This initiative particularly recognized the potential benefits of emerging trailer aerodynamic devices, developed principally by third-party manufacturers. A key to successful deployment of increasingly sophisticated aerodynamic features is that they should not interfere with normal carrier and shipper processes to any substantial amount, or could even improve processes.
The universe of trailers pulled principally by Class 8 tractors is dramatically diverse. Yet dry and refrigerated van trailers constitute just over 70 percent of all trailers (using 2013 trailer sales distribution as a surrogate for the total in-use trailers). The preponderance of fuel to be saved by aerodynamic improvements is in the van pulling combination tractor-trailer, as it is these trucks that have consistently above average road speed and mileage accumulation. This includes all lengths of van trailers.
For this committee’s work to estimate achievable aerodynamic efficiency and overall reduction in truck fuel consumption, it was necessary to glean the projected CdA of future vehicles from the literature. Some of those valuable estimates can be found in the 21st Century Truck Partnership activities and the SuperTruck projects. Also the examples in SmartWay give insights on the drag reduction of particular devices. The projected drag coefficients were then used in the committee’s simulation work (via SwRI) as described in Chapter 6. The validity of measured or modeled Cd is a highly important topic, as we want to ensure that reducing fuel consumption is actually realized in real-world freight movement in contrast to just being seen in a vehicle simulation. Progress is being made here, but a few shortcomings are noted in the following sections.
___________________
3 “Comments from PACCAR.” NHTSA-2014-0132-0223. Available at https://www.regulations.gov/document?D=NHTSA-2014-0132-0223 (accessed April 6, 2017).
5.2.2 SmartWay
EPA’s SmartWay initiative now involves over 3,000 U.S. carriers and other partners in the program. A program enhancement introduced in March 2014 is the EPA-designated “SmartWay Elite” trailer, which designates traditional 53-foot box dry van or refrigerated trailers equipped with a combination of SmartWay-verified low-rolling-resistance tires4 and SmartWay-verified aerodynamic devices (assuming a constant truck speed of 65 mph) to obtain a total of 10 percent or more fuel savings over traditional trailers (EPA, 2016b). EPA requires a carrier to adopt the 10 percent fuel savings combination to be eligible to receive their Elite designation. According to EPA, at least 9 percent of these fuel savings come from a combination of two or more SmartWay-verified aerodynamic devices (EPA, 2015a). The devices can be installed on the front, on the side, under, or on the rear of the trailer. Further detail on available packages is included at the end of this chapter in the Annex, “Description of Available SmartWay-Certified Trailer Packages.”
EPA SmartWay engineering has expended considerable effort to improve both the fidelity and user flexibility of the requisite verification procedures. EPA and the Department of Transportation (DOT) have summarized the test procedures and unit specifications, including revisions to the previous rule, in their Phase II Proposed GHG and Fuel Efficiency Rulemaking, Draft Regulatory Impact Analysis, Section 3.2 (EPA and NHTSA, 2015).
Finding. EPA through SmartWay and regulation development has significantly improved the fidelity of the required aerodynamics verification procedures. For example, their requisite CdA determination has displayed a standard error in the range of 0.5 to 2.1 percent. They also encourage manufacturers to utilize multiple testing processes to increase confidence of observed improvements.
Concern over the fidelity of standard test procedures relative to real-world conditions remains a constant in the industry. With increasing congestion on even interstate highways, the ambient turbulence intensity on roadways is significant and not accounted for in current tests. Additionally, the effects of other vehicles traveling in the same or opposite direction are not well represented in coast-down or track tests. It is likely that computational fluid dynamics (CFD) modeling could help determine the magnitude of these effects and whether they must somehow be accounted for in certifying devices or full vehicles. There are published works on modeling of platooning vehicles, meaning vehicles running in tandem in close proximity (Hammache et al., 2002; Mihelic et al., 2015), but this needs to be extended to unstructured groups of vehicles moving at different speeds as in the real world. Peterbilt reported (Smith et al., 2014) that on-highway testing of its SuperTruck in Texas, depending on the route, showed that other vehicles aerodynamically affected the SuperTruck between 37 and 53 percent of the miles traveled (NACFE, 2016b).
Finding: The issue of ambient turbulence and close-proximity vehicles likely creating new aerodynamic loading not managed by current standard testing seems to represent opportunity currently unmanaged, possibly resulting in unaccounted losses.
Recommendation 5-2: The magnitude of the ambient turbulence intensity and close-proximity vehicle passing turbulence scenario should be evaluated by EPA and NHTSA to quantify its significance.
___________________
4 The rolling resistance coefficient (kg force per metric ton) is calculated at a load of either 4,250 pounds and an inflation pressure of 100 pounds per square inch (psi) (drive or trailer tires) or 6,000 pounds and an inflation pressure of 110 psi (steer tires). See EPA (2016a).
5.2.3 Aerodynamics Information from SuperTruck
The DOE-developed SuperTruck projects5 have generated significant aerodynamic innovations and are analyzed in a recent National Research Council report (NRC, 2015). In addition, some expected results are discussed from yet-to-be-completed projects.6 Four project teams variously identifying similar aerodynamic component modifications, which are described in detail in the Annex to this chapter entitled “Summary of SuperTruck Projects.”
In most cases, the ST project work will first seek optimum performance of potential aerodynamic features. While not a requirement of the SuperTruck project dossiers, critical to successful production deployment will be compatible fit-up of ST trailers with “today’s standard” legacy trailers and more importantly, legacy tractors. These issues become necessary questions to answer as ST-like aerodynamic tractors and trailers enter the universe of about 1.2 million existing tractors and nearly 4 million van trailers. This “excess” of trailers is purposeful and necessary to facilitate trailer staging to on- and off-load trailers, while others are on road in transit. For the most part, the SmartWay configurations have been substantially nonintegrated and therefore have not posed the fit-up question raised here. But, the performance-aggressive SuperTruck goals have changed this dynamic.
The SuperTruck project teams variously identified and implemented similar aerodynamic component modifications: to the tractor (bumper, radiator louvers, chassis extenders, hood, roof, and wheel covers) and to the trailer (skirts, tail, bogie cover, wheel covers, and front gap fairing) (see Figure 5-2). Yet, most have shape uniqueness as illustrated in Figures 5-3 and 5-4. Apparent in both figures are large trailer tails and very close road clearance skirts and tractor fairings.
The Cummins-Peterbilt project team indicated that aerodynamics-specific upgrades contributed 28.7 percent to the freight efficiency (ton-miles/gallon) increment and corresponding 1.6 mpg increase on the long-haul drive cycle (Koeberlein and Cummins Inc., 2015). The Cd reduction for the system was reported as 46 percent, which would put this vehicle’s Cd at about 0.32-0.35 or CdA at approximately 3.6 (depending of course on the baseline selected).
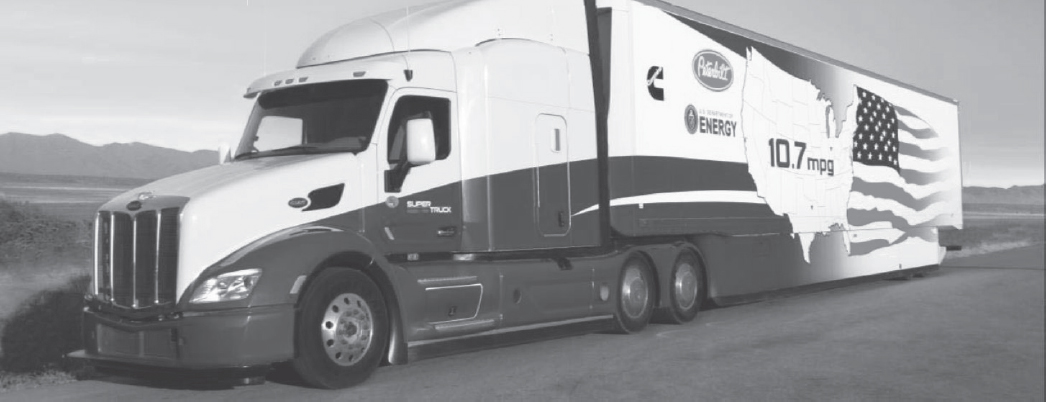
Daimler included a number of aerodynamic features in their final SuperTruck tractor’s cab, such as widening it to match the sleeper width and raking back both the grill and windshield. The shape of the hood has been extensively modified to optimize aerodynamic efficiency with the smaller engine (10.7 liter versus 14.6 liter) and angled cooling system.
The wind-averaged Cd of the final demonstrator tractor and trailer was reported as 54 percent lower than the baseline, as determined in a scale-model wind tunnel (this would mean a CdA of about 3.1). As an indication of the relative design maturities of tractor aerodynamics versus trailer aerodynamics, at the start of the project, trailer improvements delivered 72 percent of the total vehicle aerodynamic improvement while requiring only one-third of the aerodynamic engineering effort.
Another unique feature included on the tractor was a louvered radiator grill that closes when cooling demand is not detected, thus not interrupting the air flow over the tractor nose and contributing 6 percent to the Cd reduction (Rotz and Ziegler, 2014).
Navistar utilized an active ride height system to lower the front of the tractor as well as the rear of the trailer to achieve an overall profile closer to that of an airfoil (Zukouski, 2015). Navistar reported to the committee that they achieved a 50 percent reduction in Cd at 55 mph in their SuperTruck vehicle. Volvo reported a 30 percent drag reduction from their baseline.
___________________
5 SuperTruck is a major initiative of DOE’s 21st Century Truck Partnership and is supported by 3 other federal agencies in cooperation with 15 industrial partners. The latter include all six U.S. heavy-duty truck manufacturers and many heavy-duty engine and powertrain system manufacturers in order to accelerate technology development and provide focus for research and development (R&D) efforts. The four industry-led projects, spanning 2010 through 2016, were established to fund R&D and demonstration of full vehicle systems integrating a number of technologies into Class 8 heavy-duty, long-haul trucks. There are three major goals: (1) demonstrate a 50 percent increase in freight efficiency (measured in ton-miles per gallon) on a defined drive cycle with a 20 percent engine contribution; (2) demonstrate engine 50 percent brake thermal efficiency (BTE) at a level road load of 65,000 pounds at 65 mph; and (3) conduct technology development and scoping for a path to 55 percent BTE. SOURCE: Ken Howden, DOE, “21st Century Truck Partnership and SuperTruck Initiative.” Presentation to the committee, March 29, 2013.
6 The Volvo group and Navistar truck projects will not complete until June and October 2016, respectively, when final results are expected to be reported (Amar, 2015; Zukouski, 2015).

SOURCE: Peterbilt Motors Co. (2014).
SOURCE: Koeberlein and Cummins Inc. (2014).

SOURCE: Daimler.
The American Council for an Energy-Efficient Economy reported that the SuperTruck aerodynamic performance was similar to bin VI in the Phase II Rule, meaning a CdA of 4.5.
Other than SuperTruck, for completeness we note there are a number of additional advanced heavy-duty vehicle demonstrations that are described in the RIA (EPA and NHTSA, 2016) and in the NACFE Confidence Report on aerodynamic devices (NACFE, 2016c).
5.2.4 Expect Continuing Advancements in Aerodynamics and Computational Fluid Dynamics Methods
Discovery of new approaches to reducing aerodynamic drag continues as well as the development of more powerful CFD tools for analysis. As an example, a sail- or wing-like tractor-trailer shape was recently modeled and tested in a Department of Energy project that drastically changed the understanding of the impact of wind direction (Figure 5-5) (Salari, 2016). Whereas typical vehicle shapes have minimum drag at zero yaw angle, this particular shape generates forward force in side winds much as a sail at a proper angle (Figure 5-6). Now, there would be additional side forces on the tires (much as would be seen on a boat keel), but the potential for overall drag reduction seems clear.
Mihelic et al. (2015) have projected the minimum Cd for heavy trucks being about 0.3 (Mihelic, 2015), and Greenberg projected Cd could be taken below 0.3 (Greenberg, 2014). Note in the previous sections the SuperTruck Cd values were estimated to be in this same range. At present, these sources provided the most aggressive suggestions for reduction of drag coefficient. Future aerodynamic features are thoroughly, yet qualitatively, discussed by NACFE (2016a,b,c), with examples of
- Active aerodynamic flow surfaces,
- On-board aero sensing, and
- Reconfigurable truck-trailer shape (“geometry morphing”).
Continued progress and innovation are evident in medium- and heavy-duty vehicle (MHDV) aerodynamics, such as seen in the SuperTruck projects and other demonstrations in the private sector.
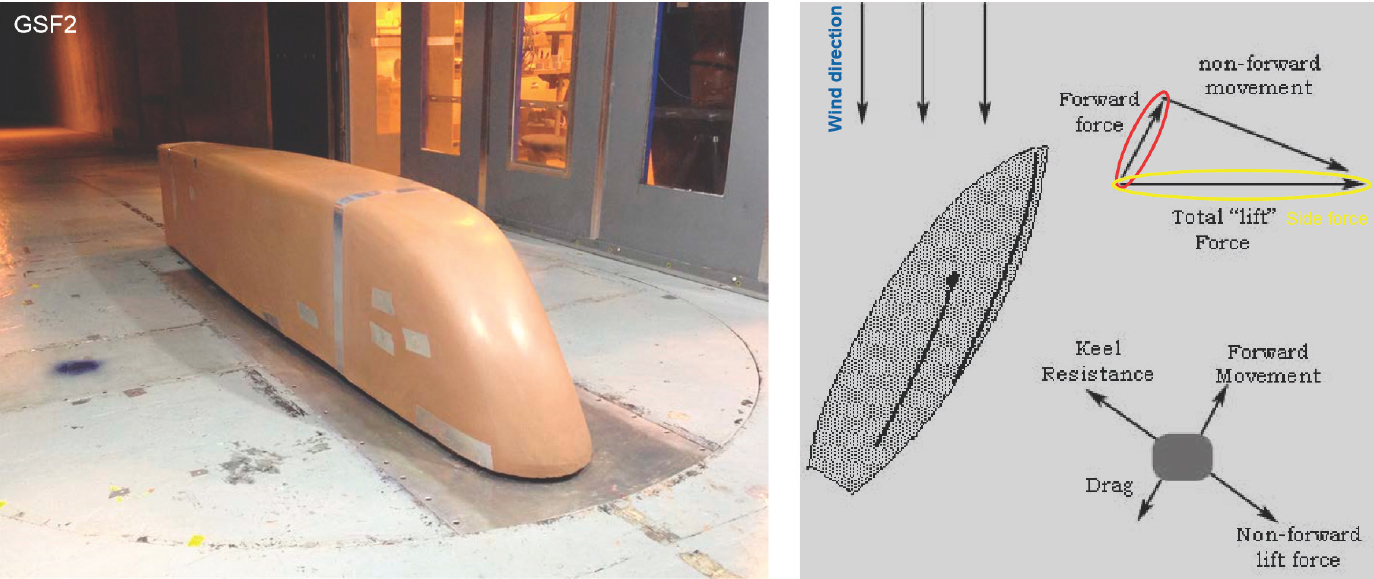
SOURCE: Salari (2016).
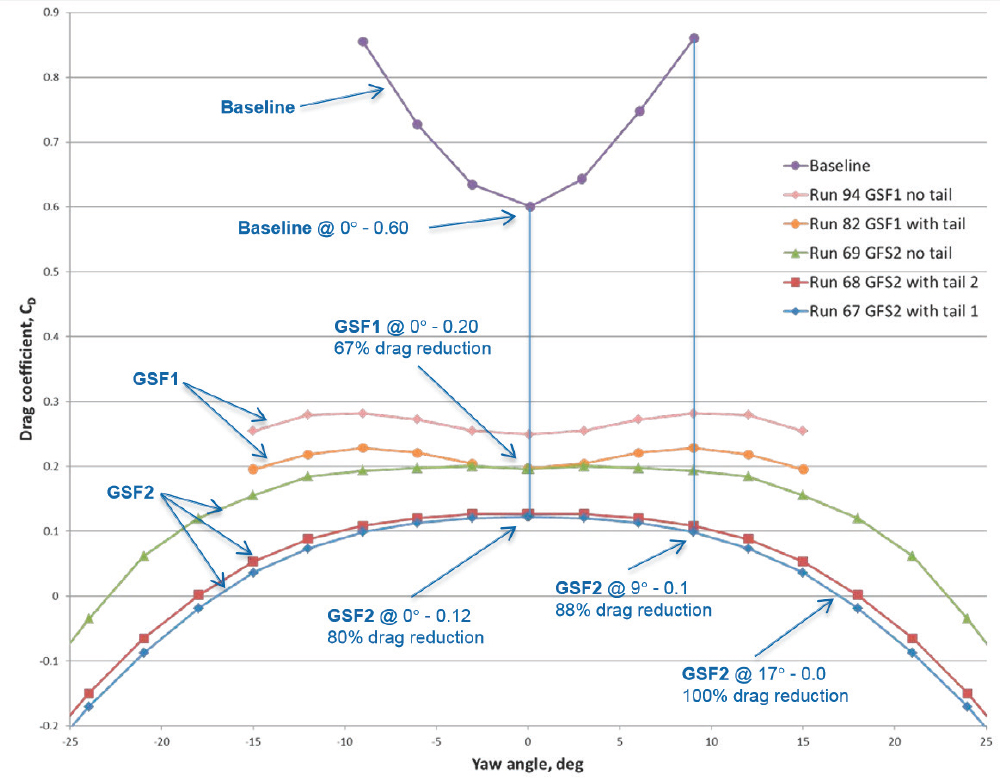
SOURCE: Salari (2016).
Finding: Integration conceptually results in better aerodynamic performance. This situation is especially observed and documented with the Cummins-Peterbilt and Daimler aerodynamics SuperTruck configurations. Visually, the aerodynamic-appearance differences may not seem so significant. The Cummins-Peterbilt project illustrated the fuel consumption effect of fitting a legacy trailer to their ST tractor, increasing fuel consumption by 14 percent. The Volvo project advised their intent to conclude with both an integrated ST and a purposeful nonintegrated ST, permitting legacy fit-up.
Finding: Integrated aerodynamics development has been shown to be an appropriate process to achieve optimum performance. However, to achieve relatively seamless adoption of higher-performing aero tractors and higher-performing trailers when fit up to their legacy mates, manufacturers will need to find performance-efficient nonintegrated designs to broadly achieve real-world fuel consumption gains.
Recommendation 5-3: Given the incentive for aerodynamic drag reduction, the rapid progress in CFD, and emerging innovations, the post-2027 potential for reducing Cd should be reevaluated in an interim review.
5.3 TIRES AND ROLLING RESISTANCE
5.3.1 Introduction and Overview
Since 2010, the National Research Council (NRC) has issued four reports that address tires and rolling resistance. In 2010, the findings and recommendations focused on the substantial reduction in rolling resistance since 1990 and indicated that potential for further reductions in rolling resistance would likely diminish over time. Next-generation wide-based singles (NGWBSs) were identified as a potential for further reductions in rolling resistance through reduced tire sidewall losses (NRC, 2010). The importance of tire pressure was discussed and the need for consistent laboratory procedures for measuring rolling resistance was outlined. In 2012, the NRC made findings and recommendations related to NGWBS tires at all tire positions, not just drive axles, and the need to overcome test result variations related to laboratory test equipment and sensor sensitivities, in order to achieve consistent test results among tire test facilities (NRC, 2012). In 2014 the issue of replacement tires in the aftermarket was highlighted and comparison of tire testing at laboratories was again discussed (NRC, 2014). In 2015, the compromises in tire design were highlighted to ensure safe operation of the vehicle in terms of traction, cornering, stability, and stopping distance. The government was encouraged to identify and address gaps in the commercial research for improvements (NRC, 2015).
The Phase II regulations (EPA and NHTSA, 2016) issued in August 2016 address all of these issues. Low-rolling-resistance tires are anticipated to be used on all tire positions, including the trailer. However, no mention is made of non-drive/tandem axles on the power unit. GEM has been improved to include an input for the loaded radius of the tires (to accurately model the vehicle speed) and the use of automatic tire inflation systems or tire pressure monitoring systems (TPMS).
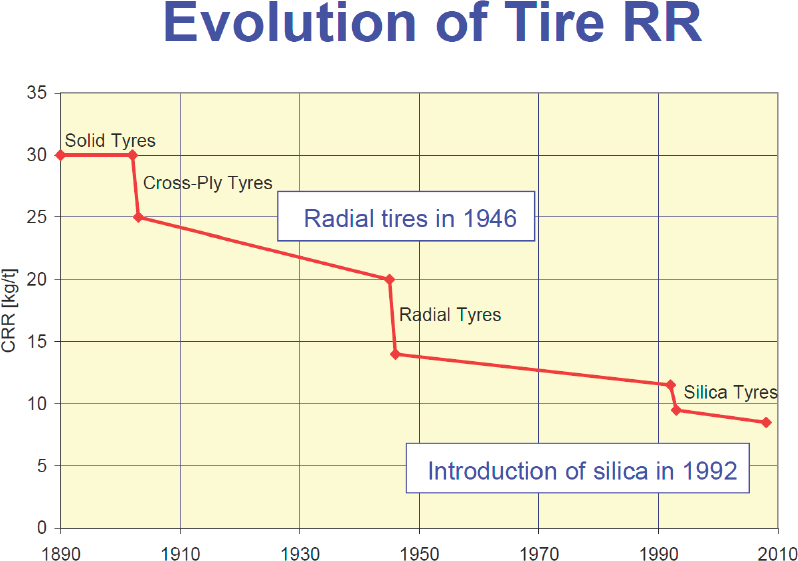
No reasonable alternative to pneumatic tires exists for carrying the load of commercial vehicles on highways. Therefore, tires will remain critical to carrying the weight of the commercial vehicle, providing comfort in conjunction with the suspension of the vehicle, traction for starting, traction for stability control, and traction for stopping the vehicle safely. This section will not attempt to provide a complete description of the design of tires and the physics behind rolling resistance. Substantial information is provided in the previous reports of the NRC (2010, 2012, 2014, 2015) related to the 21st Century Truck Partnership and on technologies for reducing the fuel consumption and greenhouse gas emissions of medium- and heavy-duty vehicles. This section will highlight several areas of concern and areas for potential development of tires and other methods for reducing the rolling resistance of commercial vehicles today and into the future. Box 5-1 lists a number of parameters that must be considered in the design of a tire. Progress to reduce the rolling resistance of tires has been steady since the introduction of internal combustion engines. Figure 5-7 shows that progress (Lew, 2013).
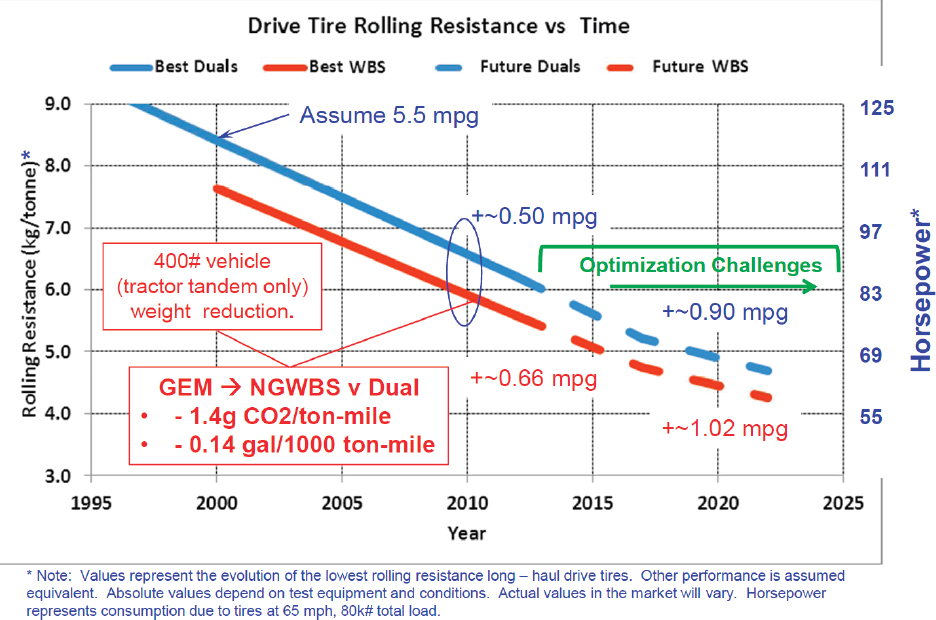
If one were to take a straight line from the value of 30 kilograms per ton (kg/t) in 1890 to the value of roughly 8 kg/t in 2010, and then extend it to 2030, the result would be an unrealistic value of about 1-2 kg/t. Therefore, it is reasonable to expect that we are approaching an asymptotic portion of the development curve. This inflection is shown in another curve, Figure 5-8.
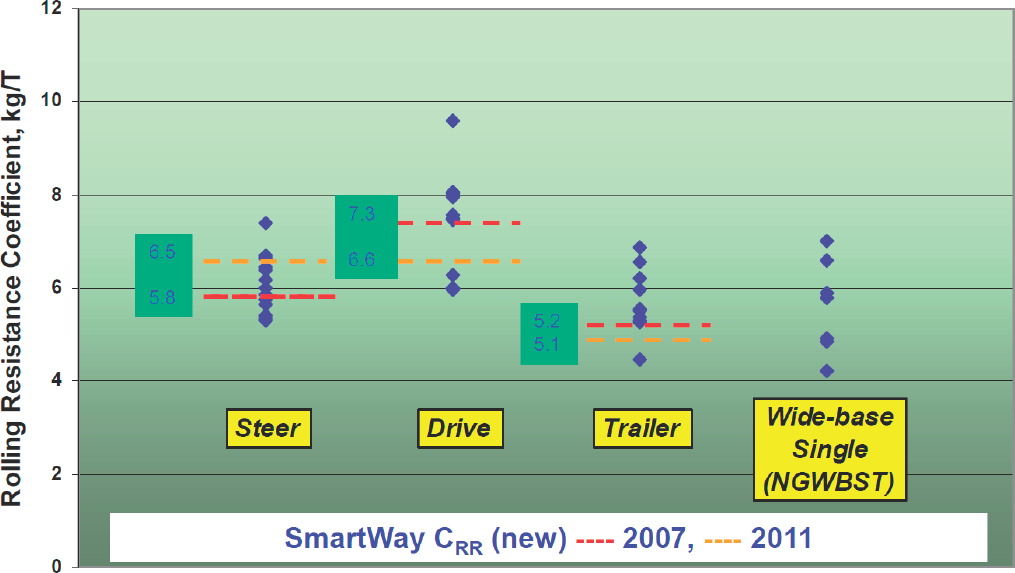
More current developments in the past 10 years are shown in Figure 5-9 (Lew, 2013).
The notice of proposed rulemaking (NPRM) for the Phase II regulations (EPA and NHTSA, 2015) was released in July 2015 and made projections for rolling resistance. These are detailed in Table 5-5, which appears in Trucking Efficiency Confidence Report: Low Rolling Resistance Tires, published by NACFE/Carbon War Room in 2015 (NACFE, 2015b). The EPA SmartWay has also published values using the International Organization for Standardization (ISO) 28250 method of measurement.7
The final Phase II regulation (EPA and NHTSA, 2016) expects all trailer tires to reach a coefficient of rolling resistance or Crr of 4.7. Twenty-five to 35 percent of steer axles are expected to reach 4.9. Up to 35 percent of drive tires are expected to reach 5.0.8 The values provided by OEMs for emissions certification were used to inform NHTSA and EPA and give them confidence in somewhat more aggressive numbers.
___________________
7 See http://www3.epa.gov/smartway/forpartners/documents/verified/420f12024.pdf. Accessed December 12, 2015.
8 See Table III-30 in Phase 2 Regulatory Impact Analysis and 2-30, 2-34 through 2-37 in Phase 2 Final Rule.
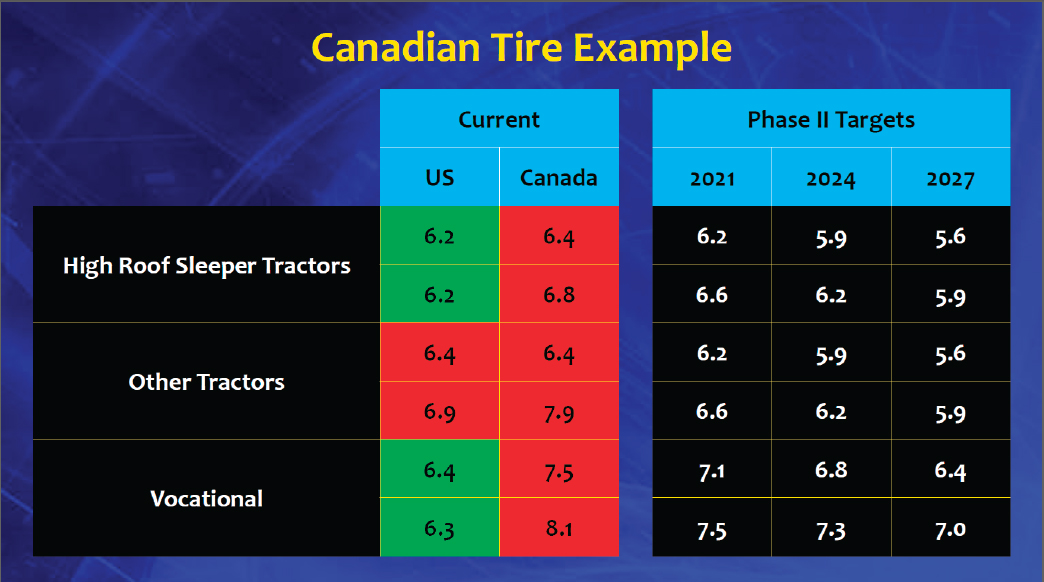
At the SAE Commercial Vehicle Congress in October 2015, both PACCAR and Daimler Trucks North America presented concerns with the proposed numbers as shown in Figure 5-10. PACCAR is making the point that vehicles in the North American Free Trade Agreement region must traverse roads safely across the North American continent. Requirements for safe operation in Canada are different than in the United States, with higher axle weights that may limit the use of next-generation wide-based single tires in that country (Figure 5-11).
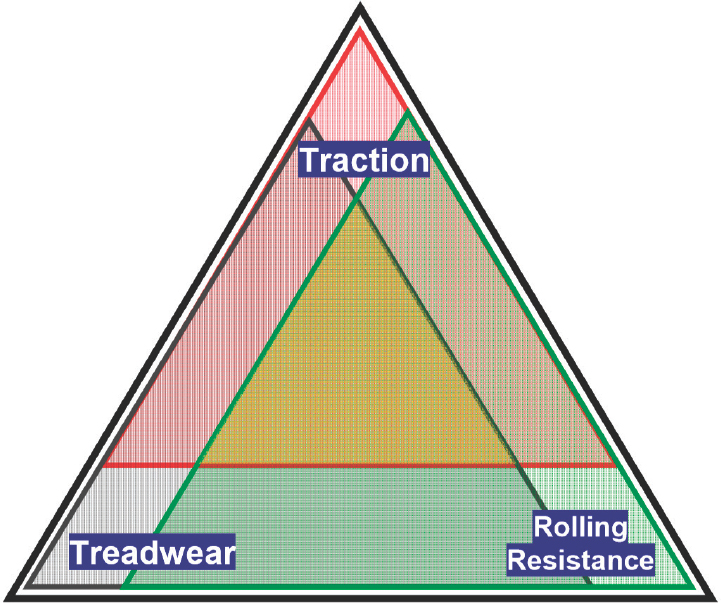
There must be some limit of rolling resistance that is needed to support the weight of the vehicle and safe operation under all driving situations. NHTSA studied this issue in 2009, primarily for passenger vehicles. Figure 5-12 highlights the trade-offs among rolling resistance, tread wear, and traction.
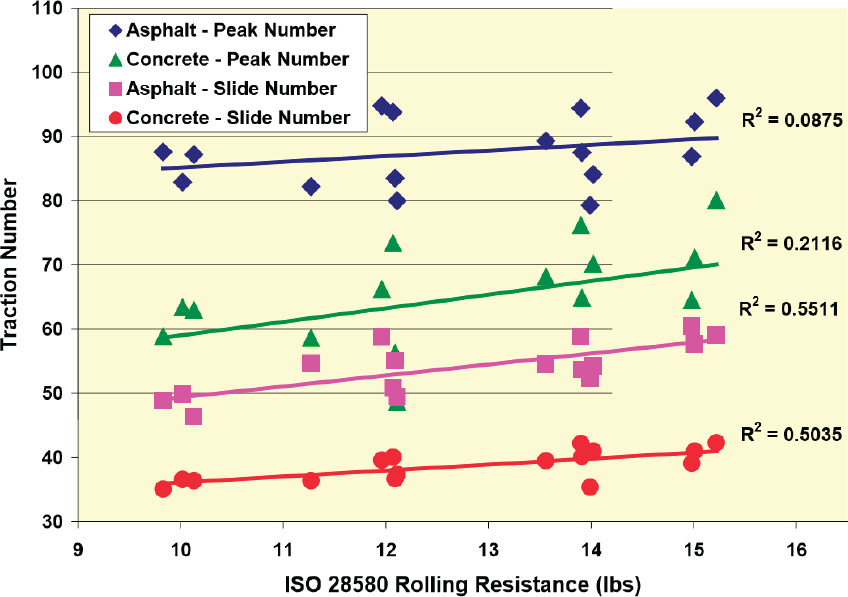
Figure 5-13 graphs the results of tests done on wet surfaces, showing a correlation between reduced rolling resistance and reduced traction. The report states, “The sliding values all have a strong and significant relationship between better rolling resistance and poorer wet traction.”
For the Phase II regulations, NHTSA (2015) ran a small test to determine the correlation between the coefficient of rolling resistance and the stopping distance of a combination vehicle. The conclusion from that report is quoted in the RIA: “The results of this research suggest that tire rolling resistance is not a reliable indicator of Class 8 tractor-trailer stopping distance” (EPA and NHTSA, 2016a, p. 9-8). Those tests were run with vehicles loaded between 57,700 and 80,000 pounds. The two studies suggest that heavier vehicles are less impacted by rolling resistance when the weights are much higher. An empty combination vehicle might weigh one-third to one-half the test loads used.
SOURCE: Lew (2013), Michelin North America, Inc.
SOURCE: Lew (2013), Michelin North America, Inc.
SOURCE: Lew (2013), Michelin North America, Inc.
TABLE 5-5 Projections for Rolling Resistance in Notice of Proposed Rulemaking for the Phase II Regulations.
| Tire Location | EPA SmartWay | GHG1’14 | GHG1’17 | GHG2’18 | GHG2’21 | GHG2’24 | GHG2’27 |
| Steer | 6.5 | 7.7 | 7.7 | 6.2 | 5.9 | 5.6 | |
| Drive | 6.6 | 7.7 | 7.7 | 6.6 | 6.2 | 5.9 | |
| Trailer | 5.1 | 5.1 | 5.1 | 4.7 | 4.7 |
SOURCE: NACFE (2015a).
Finding: The minimum safe value of Crr for a commercial vehicle with a defined weight, aerodynamic value of Cd, a defined number of wheels with tire patches of specific size, and traveling at a specific speed (such as the requirements of NHTSA regulations for stopping distance) is not currently available.
Recommendation 5-4: NHTSA with the help of the national laboratories and academics should determine the minimum value of the coefficient of rolling resistance or Crr needed to safely operate a vehicle in terms of stability, stopping distance, and traction, taking into account all variations of vehicles from straight trucks to long combination vehicles with additional weight. Both modeling and physical tests should be completed.
Finding: Limited testing on tires has been done to date to establish performance parameters for traction and safe stopping distance.
Recommendation 5-5: Prior to the promulgation of the next phase of regulations, additional work should be done by NHTSA with current commercial vehicle tires and loadings to determine the balance needed among tread wear, rolling resistance, and traction. Vehicles should be outfitted with all required safety systems, such as stability control. Typical tread depths and retreads should be investigated.
NOTE: Appears with permission of Daimler Trucks North America’s Product Compliance and Regulatory Affairs Department.
SOURCE: Kayes (2015), Daimler Trucks North America’s Product Compliance and Regulatory Affairs Department.
SOURCE: Sproull (2015), courtesy of PACCAR, all rights reserved.
SOURCE: NHTSA (2009).
SOURCE: NHTSA (2009).
5.3.2 Labeling
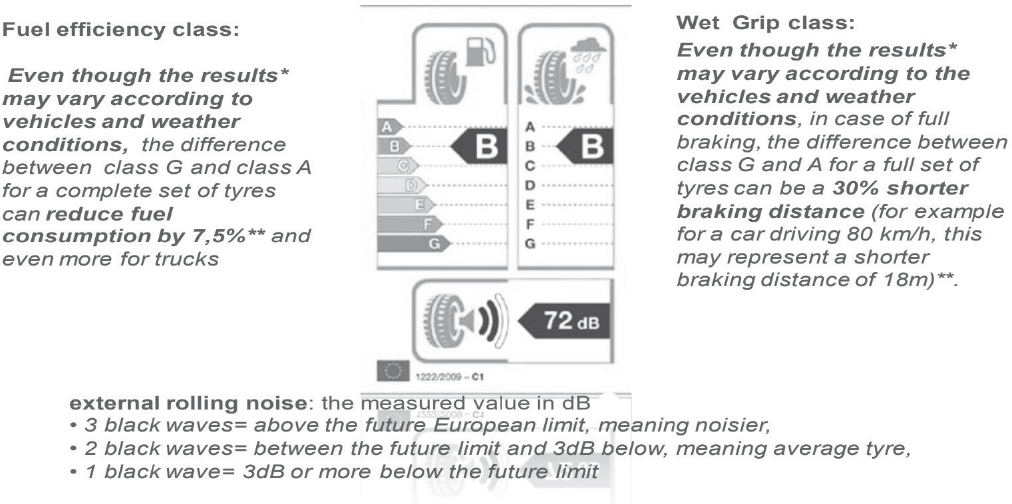
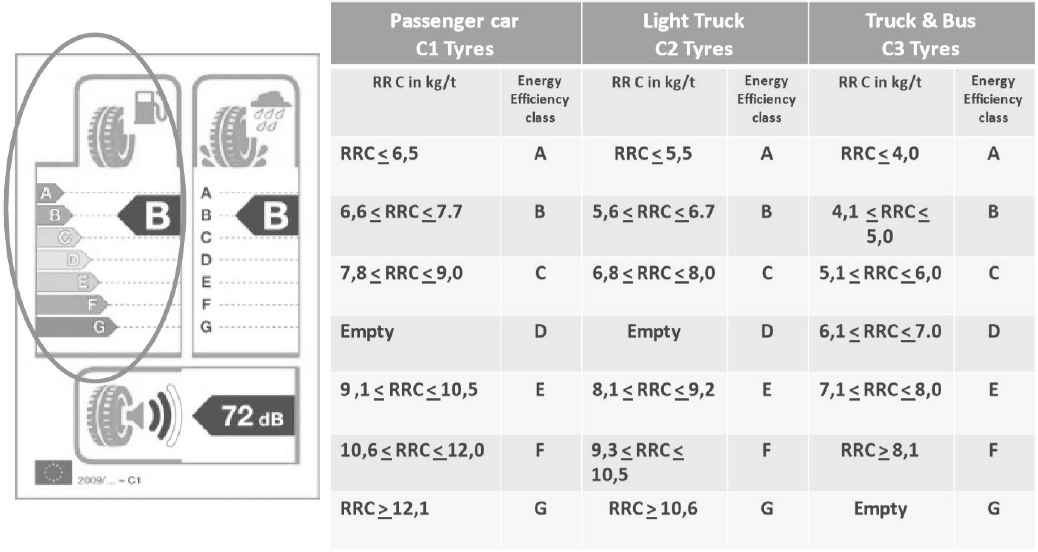
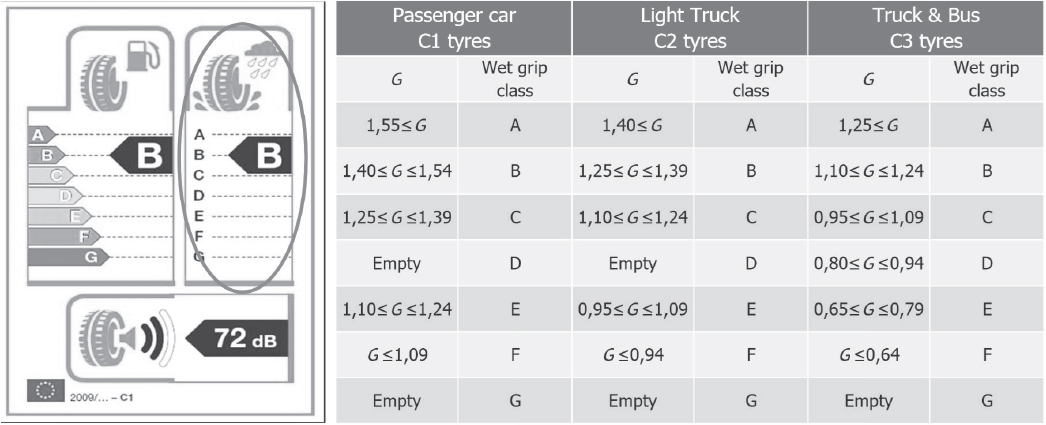
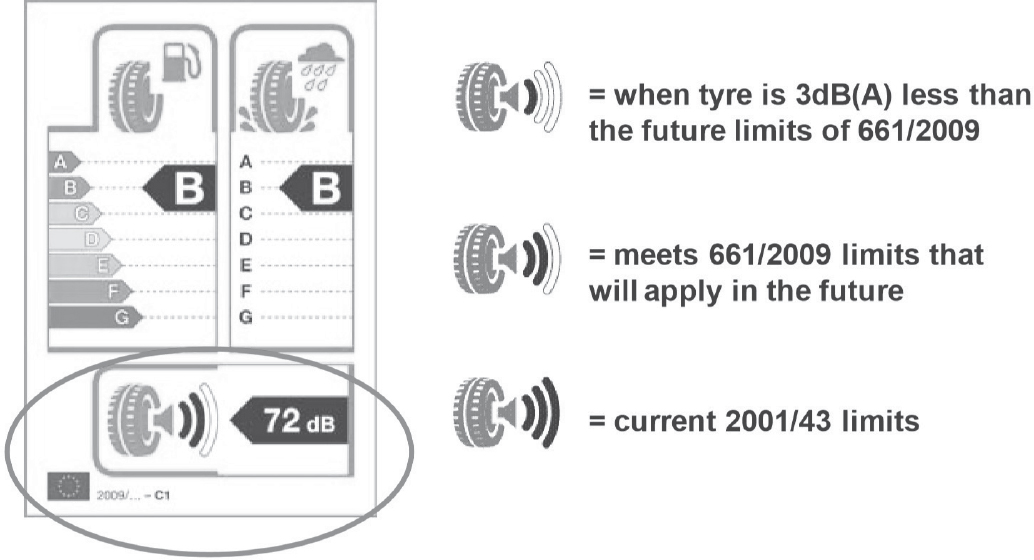
The European market has adopted a labeling standard for tires that includes both rolling resistance and traction. The EU Tyre Labelling Regulation 1222/2009 provides a label that includes fuel efficiency, wet grip, and noise.9Figure 5-14 is a picture of the label for a specific tire with a B class rating for fuel efficiency, a B class rating for wet grip, and a noise rating of 72 dB. Figure 5-15 shows the values for rolling resistance. Figure 5-16 shows the values for wet grip. Last, Figure 5-17 shows the noise levels.
At the Internationale Automobil-Ausstellung 2016, Continental introduced a tire with a triple A rating providing low noise, and the best rating for rolling resistance and wet grip.10 This is for both drive and steer axles. Therefore, low-rolling-resistance tires can be expected to be able to technologically reach lower levels than currently forecast. It becomes a matter of field experience to push for higher adoption rates.
The above labeling is based on laboratory tests on new tires. Real-world situations, with reduced tread and the possibility of retreads, will be different. Steidel et al. (2016) provide a modeling approach for estimating rolling resistance.
Finding: Access to values for rolling resistance is needed by users of tires to properly assess the ability of the tire to meet the performance requirements of the application. Currently, these numbers are available to OEMs for the GEM inputs and to the government for audit purposes, but not to users. European regulations require this information be made available to the public.
Recommendation 5-6: NHTSA should work with manufacturers to implement a method of making information on tire rolling resistance available to users.
SOURCE: ETRMA (2011).
___________________
9 See http://www.etrma.org/uploads/Modules/Documentsmanager/2011-11-30--industry-guideline-on-tyre-labelling-(vers3).pdf.
10 See http://www.continental-tires.com/transport/media-services/newsroom/20160921-efficient-tires.
SOURCE: ETRMA (2011).
SOURCE: ETRMA (2011).
SOURCE: ETRMA (2011).
5.3.3 Tire Pressure
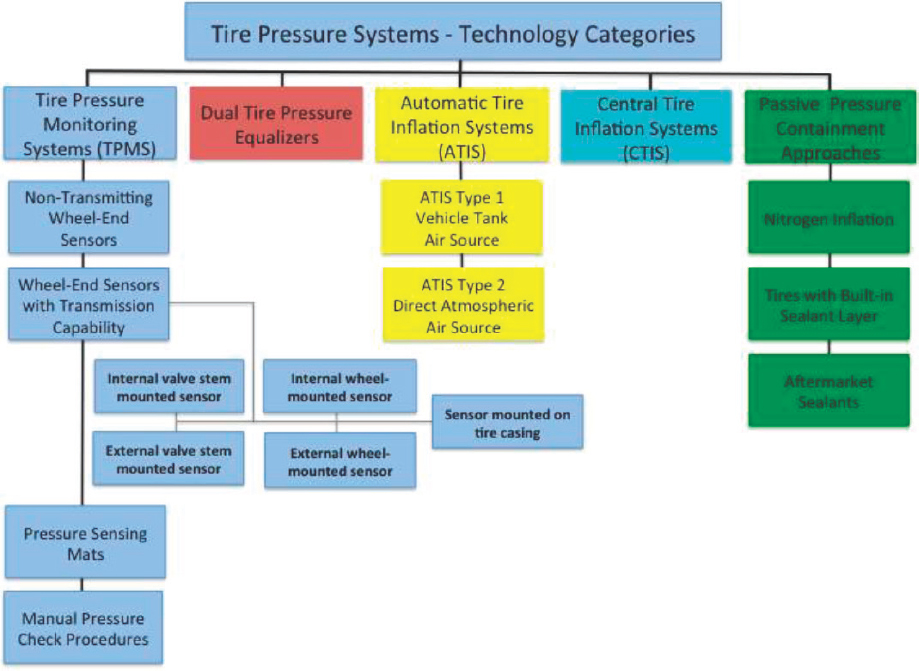
Tire pressure is well known to be an important factor in fuel consumption of trucks. Tires underinflated by 10 psi can decrease fuel economy by 0.5 to 1 percent (Sidders, 2017). Other reports have discussed the importance of tire pressure to optimize tire rolling resistance and traction. NACFE (2013b) and EPA’s SmartWay (2019) have issued reports on the subject. Figure 5-18 is taken from the NACFE report. It shows the various types of systems that are available.
The data in Exhibit 1.1 of the report (NACFE, 2013b) suggest that tire pressure systems, both monitoring and inflation, are growing in acceptance for trailer applications, which have non-drive axles.
Issues with sealing on drive axle tires have delayed the introduction of tractor-based inflation control systems that meet the industry requirements for safety, durability, and reliability. Tractor usage today is limited to military and heavy haul applications, often using the Central Tire Inflation System (an automatic tire inflation system [ATIS]) of Dana.11 Other companies are continuing to work on the issue of tire pressure systems for the drive axles of tractors, including Airgo12 and Aperia Technologies. In March 2016, Aperia Technologies announced they were installed on the vehicles of 100 fleets following introduction in 2014. The device can be installed to existing vehicles in 10 minutes per wheel end. They have partnered with a tire manufacturer, Michelin, to make the system available.13
The Phase II proposed rule (EPA and NHTSA, 2015) from 2015 asked for information regarding possible credit for tire pressure monitoring systems. The concern from EPA’s perspective was that there is no guarantee a driver or fleet will ensure the tire is inflated properly after a monitoring system finds an issue. Considering the Federal Motor Carrier Safety Administration has various means for auditing the operations of fleets, and the Federal Highway Administration can monitor weights, it would seem possible for the nation to find a way to ensure that issues with
___________________
11 See http://www.dana.com/commercial-vehicle/products/tire-pressure-management#searchRootId=e2131c3b-468f-443d-87ae-0bca7e2ef08e/facets= (accessed December 19, 2016).
12 See http://www.airgo.ca/tire_inflation.html (accessed December 19, 2016).
13 See http://www.michelintruck.com/services-and-programs/auto-inflate/ (accessed December 19, 2016).
SOURCE: NACFE (2013b).
tire pressure that are highlighted by a monitoring system are addressed in a reasonable time frame. The industry has other safety and emissions devices that rely on the driver to take action. These include the trailer anti-lock braking system (ABS) malfunction indicator, the tractor ABS malfunction indicator, and the malfunction indicator lamp for the engine emissions system. In addition, methods of reducing vehicle speed and engine horsepower are used to encourage driver action. Transmission controls also have methods of controlling the vehicle to encourage driver intervention. Such techniques could be used to ensure action is taken to properly inflate tires when using a tire pressure monitoring system. Numerous people responded to the request. Based on the comments received, NHTSA and EPA were persuaded to make changes in the final rule, allowing for a credit in GEM of 1.0 percent for TPMS and 1.2 percent for ATIS. The RIA for the Final Rule (EPA and NHTSA, 2016a) projects adoption rates for 2021 as 20 percent TPMS and 20 percent ATIS, increasing in 2024 to 50 percent TPMS and 25 percent ATIS, and further increasing in 2027 to 70 percent TPMS and 30 percent ATIS.
Goodyear has been testing a pressure maintenance device based on a peristaltic pump. In October 2014, an 18-month field test on commercial trucks was announced with funding from the Department of Energy. The original project, System for Automatically Maintaining Pressure in a Commercial Truck Tire, was last reported on at the 2014 DOE Annual Merit Review (Benedict, 2014). The extended field test appears to be work beyond the original effort. This effort has the potential to provide a reliable, low-cost air pressure maintenance device in the time frames envisioned by the current NPRM and subsequent rulemaking.
The importance of maintaining tire pressure to achieve reductions in fuel usage has spawned new business opportunities. A major truck stop operator, Love’s, has introduced a service at its fuel islands to also check and, if necessary, inflate tires while the vehicle is being fueled. TirePass is the name given to this service.14 In
___________________
14 Love’s. “TirePass” Available at <http://www.loves.com/HomeLinks/TruckTireCare/TIREPASS.aspx> (accessed September 22, 2016).
February 2015, Michelin announced its new Tire Care service.15 This combines regular monitoring at the vehicle with back office data analysis to help fleets control tire costs. Continental has begun factory installation of tire pressure monitoring equipment with its iTire.16 With the requirements for tire inflation systems on trailers and the development of tire monitoring and inflation systems for tractors, the committee expects additional business models will be created in the next decade.
Finding: The Phase II regulation recognizes the benefits of maintaining pressure and provides requirements and incentives for use on all wheel positions.
Recommendation 5-7: EPA and NHTSA should review their projections for adoption rates, provide programs for large-scale testing of tire inflation technologies on tractors, and research means for interagency cooperation that would allow credit for tire pressure monitoring equipment.
Recommendation 5-8: EPA and NHTSA should consider warnings and vehicle operational adjustments that encourage proper inflation, similar to the approaches used for tractor ABS, trailer ABS, and diesel exhaust fluid. These include visible and audible warnings, as well as reduction in engine horsepower and vehicle speed.
Recommendation 5-9: EPA and NHTSA should consider the effectiveness of new business models for tire inflation and tire pressure monitoring that will be created in the next decade to determine the options available for regulation post-2027.
5.3.4 Next-Generation Wide-Based Single Tires
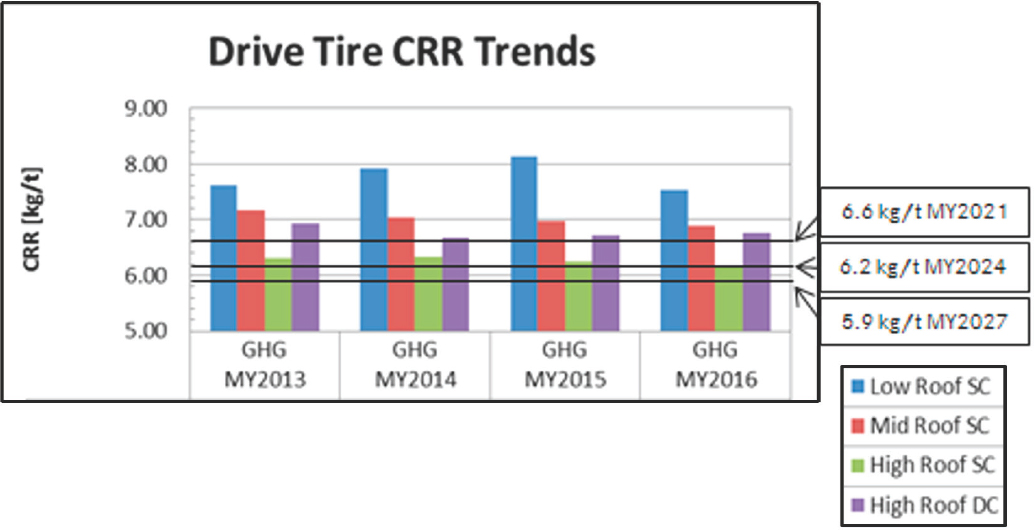
Previous reports have discussed the take-up rate of NGWBS tires and the challenges for wider adoption. The cost of the tire itself, compared to two tires in a dual configuration, was greater in 2010, on a par in 2015 and projected to be several percentage points less in the future.17 Thus, cost of the rubber is not the issue for a higher adoption rate for these tires. The complete cost of the axle and wheel end, ancillary equipment (such as tire pressure monitoring to detect deflation), number of allowed retreads, quality of cores for retreading, and logistics issues continue to slow the penetration. The chart in Figure 5-19 shows that fleets are adopting low-rolling-resistance tires, but NGWBS tire penetration is declining.
Chapter 7 of the NACFE report details the study group’s information on wide-based tires (Figure 5-19). Little factual information is provided as fleets and tire manufacturers continue to carefully control the dissemination of such information as costs, replacement rates, number of times a tire can be and is retread, and percentage of available tires that can be retread.
Finding: Little factual and statistical information is available regarding wide-based single tires and wheel ends for performance or cost.
Recommendation 5-10: EPA and NHTSA should work with European counterparts and complete reliable tests in the United States to validate the costs and benefits of wide-based single tires.
5.3.5 Alternative Methods to Reduce Rolling Resistance
Tire Configuration. Rolling resistance can be reduced by minimizing the amount of rubber on the road other than by using next-generation wide-based single tires. Alternative configurations of axles that can carry the
___________________
15 Michelin® Tire Care™ Added to Michelin® Commercial Service Network Offer, February 15, 2015, and http://www.michelintruck.com/services-and-programs/tire-care/ (accessed December 15, 2015).
16 See http://www.continental-tires.com/transport/media-services/newsroom/20160921-itire (accessed December 19, 2019).
17 Stan Lew, personal communication to Paul Menig, October 9, 2015.
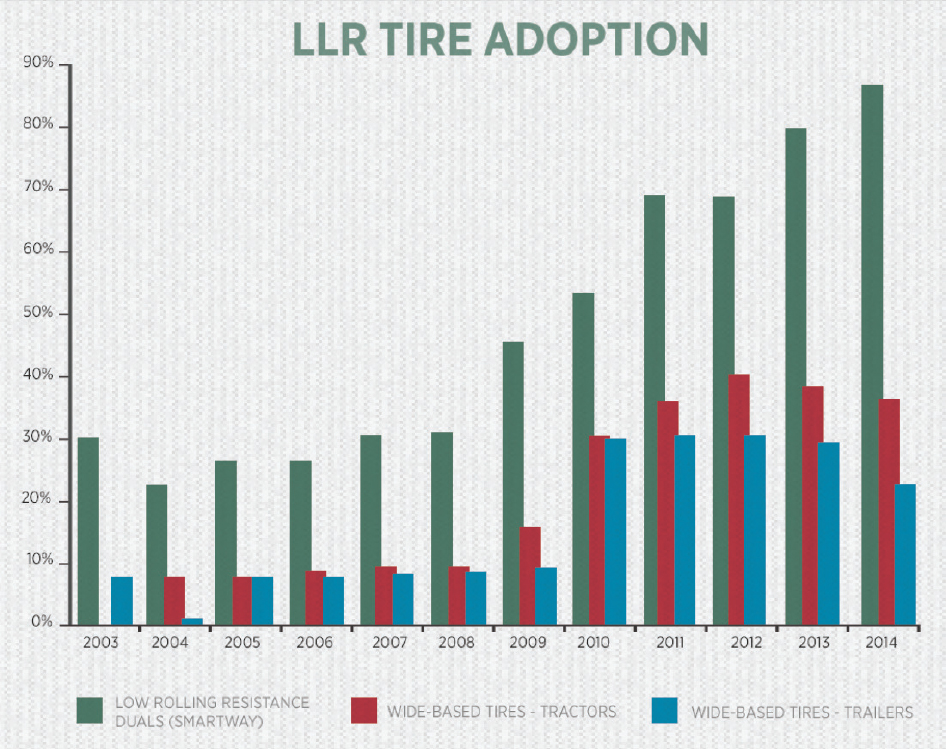
SOURCE: NACFE (2015b).
legal weight, and lift axles that are raised when the weight is less than the maximum are two such ways. Other sections of this report cover the issue of longer combination vehicles which have the potential to reduce the rolling resistance by eliminating several axles and wheel ends, as well as a power unit. NACFE published a report on 6×2 axle configurations in 2014. The NPRM addresses this technology, expecting an adoption rate that was commented upon in the record. Steerable axles will reduce the scrubbing of tires in turns, effectively reducing the rolling resistance. While this has generally been applied to low-speed maneuvering of specialty vehicles, it can be applied to vehicles at speeds to reduce rolling (scuffing) resistance in highway turns. Knorr-Bremse and Kässbohrer have taken a step to reduce the cost of steerable axles by using the brakes to accomplish the steering. Self-steering axles are used in many jurisdictions.
Additional Axles to Allow More Weight per Vehicle Adds to Rolling Resistance. Other sections of this report discuss how different tire and axle configurations can improve the productivity of commercial vehicles. Some configurations suggest adding an additional axle to a trailer to allow greater loads. This will increase the vehicle load which will increase the rolling resistance of the combination vehicle. However, the improvement in load-specific fuel consumption will outweigh the increase in rolling resistance (Woodrooffe, 2014).
Spats for Aerodynamics. These devices are primarily meant to improve the air flow around the wheel end, covering up the wheel. These have been shown to improve the aerodynamics of the vehicle. SAE testing done by suppliers suggests a fuel economy improvement of 1 to 2 percent when used on tractor rear wheels and trailer wheels combined. Design of such devices needs to account for the need to check the wheels for loose lug nuts and
to check tire inflation. They are mentioned here only to provide a complete picture of tire and wheel end options for improving fuel consumption. See the section “Aerodynamic Drag Reduction” for additional information.
Pavement. The other half of the tire-road interface is often overlooked. Yet, there are opportunities to improve rolling resistance with the materials and surface texture of the pavement. Rigid concrete roads offer measurable reduction in rolling resistance compared with flexible asphalt pavement due to a reduction in hysteresis loss provided by more ridged pavement structures (Courier & Press, 2015).
5.3.6 Other Tire Issues
Labeling. Labeling of tires provides critical information to help fleets replace original equipment with similar tires. This includes size, speed, allowed weight, and date of manufacture. The speed rating of the tires and the governed speed of the vehicle through the engine controls need to be properly matched. OEMs had some problems with this in 2015 and had to recall vehicles to correct. European tire labeling requirements are governed by EC/1222/2009 (EC, 2009), EC/1235/2011 (EC, 2011), and the United Nations Economic Commission for Europe (2014) for all tires produced after June 30, 2012. These labels address fuel consumption, noise, and traction. There have been discussions regarding a similar type of labeling for tires in the United States. The Uniform Tire Quality Grading provides information on tread wear, traction, and temperature (Caterpillar, 2015).
Safety. As previously discussed, tires must provide traction for starting, stopping, and cornering. NHTSA performed testing recently and found no statistical correlation between Crr and stopping distance. While this result may not be intuitive, it supports the understanding that tire manufacturers are able to achieve low rolling resistance without compromising traction.
Retread tires are an effective means of extending tire casing life. The amount of energy required to produce a retreaded tire is considerably less than that needed to produce a new tire. A relatively recent study (Woodrooffe et al., 2008) found that retread tires were not over-represented in tread separation (so-called alligators) and that the principal cause of tire separation is related to under-inflated tires.
Blowout for NGWBS tires has been an issue for some. At least some vehicle OEMs required the addition of a tire pressure monitoring system when equipping a new vehicle with these tires. Heat is a critical factor in the durability and performance of a tire. As previously discussed, aerodynamic improvements have the potential to increase the heat at the wheel ends, creating issues for durability and safety.
Tire Damage. Tires can only maintain their rolling resistance when undamaged. The Technology and Maintenance Council of the American Trucking Associations (TMC, 1994) has an extensive guide on the maintenance of tires and damage, entitled “Radial Tire Conditions Analysis Guide: A Comprehensive Review of Tread Wear and Tire Conditions.”
Aftermarket Tires. New tire production for new commercial vehicles produced by OEMs is on the order of 5 million units. More than 15 million units are for replacement of tires on existing vehicles; 15.7 million units a year are retread for use on existing vehicles.18 Therefore, new production for new vehicles represents only 25 percent of new tire production and 14 percent of all tire placements including new, aftermarket, and retread. Penetration of low-rolling-resistance tires into the existing fleet of commercial vehicles could be increased with incentives or regulations (see Chapter 2).
5.3.7 Future Developments
A limited number of items are known to the committee to be in development related to both tires and alternative methods for reducing the rolling resistance of commercial vehicles.
Airless Tires. Several manufacturers have begun to develop and test airless tires, including for commercial vehicles.19 Bridgestone, Michelin, and Hankook have all reported activities publicly.20 Applications for passenger
___________________
18 Modern Tire Dealer, January 2014, “Facts Issue 2014.” Available at http://www.moderntiredealer.com/uploads/stats/2014-facts-sans-ads.pdf (accessed June 12, 2017).
19 “Airless Tires.” http://www.bridgestonetire.com/tread-and-trend/tire-talk/airless-concept-tires (accessed September 6, 2015).
20 Michelin Tweel Technologies, http://www.michelintweel.com (accessed September 6, 2015).
cars and small, off-road vehicles are currently being sold and prototyped (Collins, 2017). Indications suggest that these tires will have benefits but not reduce the rolling resistance overall (Collins, 2017). Other benefits will be reduction in heat generation in the tire, as there is less flexure in the sidewalls (Collins, 2017). As vehicles get more aerodynamic and employ fairings that reduce air cooling to the tire and wheel, this could become an important benefit for future tires.
Alternative Materials. Rubber (from the Hevea brasiliensis tree) and synthetic rubber remain a major material in the construction of tires, along with steel belts and glue. Supply of rubber has been an issue in the past. Therefore, research continues into alternative sources of rubber for tires. This includes rubber from the guayule plant and a special species of dandelions.21 Continental is in field tests with the Taraxagum tire.22 Major research is being carried out by the manufacturers and by academic institutions, such as the Ohio State University PENRA program,23 which was created to integrate and accelerate the incubation, demonstration, market entry, and growth of a domestic natural rubber industry. PENRA focuses on the creation of the science and technology and the private partnerships needed to support the introduction and scale-up of natural rubber alternatives. Europe has a program called DRIVE4EU that is similarly engaged.24 DRIVE4EU—Dandelion Rubber and Inulin Valorization and Exploitation for Europe—is a demonstration project, aimed at the development of the production chain of natural rubber and inulin from Russian dandelions. The objective of the project is to set up a new European chain for the production and processing of natural rubber. Cooper Tires is involved in a $6.9 million research program by the U.S. Department of Agriculture and DOE to develop a domestic natural rubber source. These developments are aimed at securing the supply of rubber and, potentially, controlling the cost of supply. Bridgestone announced on February 24, 2017, that it has succeeded in creating synthetic isoprene rubber. There is a potential for this new material to surpass the performance of natural rubber. The press release mentions evaluations suggesting it has better fuel efficiency. More research is needed to establish developments that will lead to tires with reduced rolling resistance or better construction to prevent losses from flexure, either in the sidewalls or in the treads.25
Retreading of Next-Generation Wide-Based Singles. NGWBS have a small advantage in rolling resistance compared to dual tires. Dual tires continue to improve but are not expected to ever equal NGWBS tires due to the latter’s lower wall flexure and smaller tread patch making contact with the ground. Dual tires on commercial vehicles are routinely retreaded three or more times. NGWBS tires have only been able to achieve one or two retreads. Research continues to allow these tires to be retread as many times as duals. This is needed to overcome a barrier to their adoption in the industry (Erb, 2015; Britt, 2015).
Self-healing Rubber. Recently, researchers at the Leibniz Institute for Polymer Research in Germany have found a way to have rubber heal itself while the vehicle is not being driven (Bohme, no date). This involves new materials and new processing. Instead of the well-known vulcanization process, a different process is used to add carbon and nitrogen. Given the long process of taking something from the research laboratory to production in the commercial vehicle world, the committee does not expect this to be in production in the time frames considered. Furthermore, while this addresses an important issue for tires, it is not expected to provide benefit in terms of low rolling resistance. It may help with issues related to failure of next-generation wide-based singles and improve the acceptance of them.
Aerodynamic Improvements Causing Additional Heat. Heat is the biggest concern for tire durability. Many of the aerodynamic improvements already in production and expected in the future will reduce the cooling air flow around the tire and wheel end. Cooling of the engine takes precedence in design over aerodynamic improvements
___________________
21 “Cooper Tire Begins Testing Tires Made with Guayule Component.” http://coopertire.com/News/Corporate-News-Releases/CooperTire-Begins-Testing-Tires-Made-with-Guayule.aspx (accessed October 14, 2015); Natural Rubber from Dandelions. Available at http://www.fraunhofer.de/en/press/research-news/2015/June/natural-rubber-from-dandelions.html (accessed September 6, 2015).
22 “Continental Trials First Car Tires with Taraxagum Dandelion-Rubber Tread.” http://www.continentaltire.com/content/continental-trials-first-car-tires-taraxagum-dandelion-rubber-tread (accessed September 6, 2015).
23 PENRA, the Program of Excellence in Natural Rubber Alternatives. See https://u.osu.edu/penra/ (accessed October 14, 2015).
24 See http://www.drive4eu.eu (accessed December 19, 2019).
25 Automotive World. February 24, 2017. “Bridgestone succeeds in creating synthetic isoprene rubber through precise molecular structure control – development of next-generation rubber with performance surpassing that of natural rubber.” Available at http://www.automotiveworld.com/news-releases/bridgestone-succeeds-creating-synthetic-isoprene-rubber-precise-molecular-structure-control-development-nextgeneration-rubber-performance-surpassing-natural-rubber/ (accessed March 7, 2017).
at the front of the vehicle. Care must be taken to ensure that aerodynamic improvements provide adequate cooling to the tires and brakes.
5.4 MASS REDUCTION
5.4.1 General Weight Characteristics of Medium and Heavy Vehicles
The typical Class 8 sleeper tractor weighs about 20,000 pounds and the popular 53-foot dry van trailer weighs roughly 14,000 pounds. The overall weight distribution is shown in Figure 5-20 below, and further details were presented in the Phase I report (NRC, 2010) and other recent reports (NACFE, 2015a).
With a maximum allowed weight in most states of 80,000 pounds, the maximum payload is about 46,000 pounds. The majority of trucks on the road do not operate at the weight limit, but the trend is toward denser freight loads, which increases overall freight efficiency.
5.4.2 Impacts of Vehicle Mass on Freight Efficiency
The effects of mass and mass reduction on fuel consumption and load-specific fuel consumption were explained in the NRC Phase One report (NRC, 2010) and recently reviewed in the NRC report on the 21st Century Truck Partnership (NRC, 2015). Truck weight impacts fuel consumption (e.g., gallons per mile) primarily through tire rolling resistance and unrecovered energy used when accelerating or grade climbing. The energy needed to overcome these resistances is essentially linearly dependent on truck weight. Truck weight effects are more conspicuous and dominate fuel consumption over duty cycles with frequent stops and accelerations, or on roads with notable grade. Revisiting the example from the Phase I report, in powering an 80,000-pound vehicle, maintaining 50 mph on a mere 3 percent grade triples the engine power demand compared to a level road (e.g., 150 hp on level road to 450 hp on the 3 percent grade) (Caterpillar, 2006). In the National Academy of Sciences (NAS) Phase I
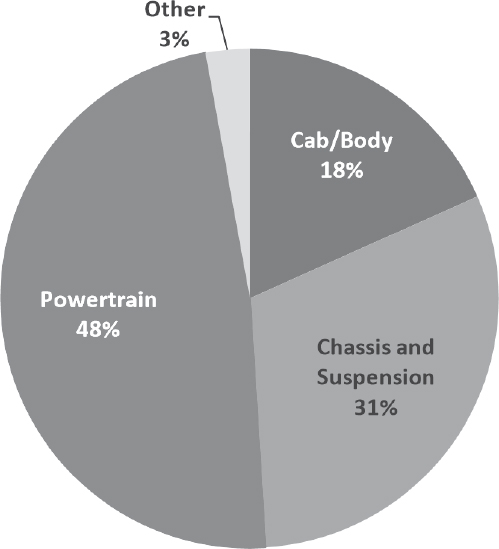
SOURCE: DOE (2013).
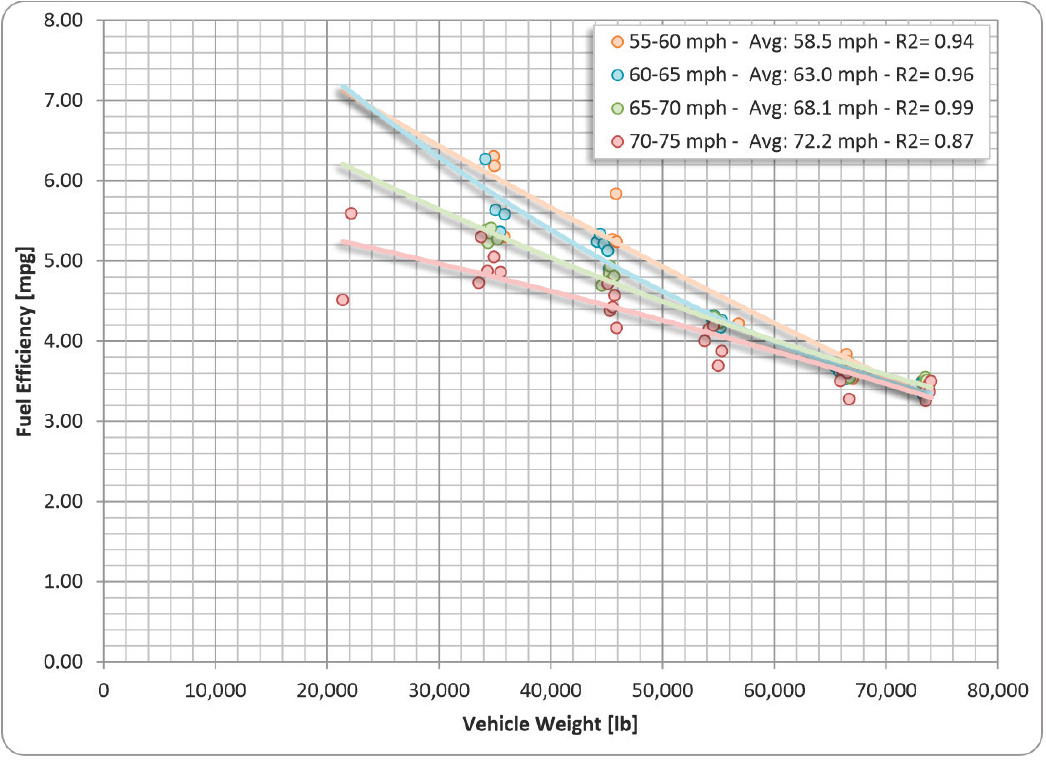
study, based on reviewed test data and models (ANL, 2009; NRC, 2010), the impact of weight reduction was found to range from approximately 0.5 percent per 1,000 pounds reduction, to approximately 2 percent per 1,000 pounds reduction. Shortly after the NAS Phase I study concluded, results of on-road monitoring of a small fleet of Class 8 trucks were published in final form by Oak Ridge National Laboratory (ORNL, 2011) that provided a look at payload effects in the real world. An example is shown in Figure 5-21, where it is seen that on average for an upslope terrain the effect of mass reduction on fuel consumption (gallons per mile) would be only about 1 percent per 1,000 pounds, and the impact on mass-specific fuel consumption even less.
A study by Ricardo Inc. (2009) for the Aluminum Association produced a similar generalization for Class 8 trucks: 0.7 to 0.9 percent reduction in fuel consumption per 1,000 pounds weight removed.
Reducing the unloaded (tare) weight of the truck and trailer always benefits the metric of gallons per ton-mile, and usually directly reduces fuel consumption in gallons per mile. In cases where the vehicle is weight limited (meaning at its maximum allowable weight), the mass reduction can be translated to additional payload for higher freight efficiency (fewer gallons per ton-mile). Vehicles with maximum GVW loads may still operate at reduced loads on the same trip after off-loading at stops, to the extreme example of tankers running empty on a return trip. During reduced-load vehicle miles traveled, the fuel consumption (gallons per mile) will conspicuously improve with reduced weight. For vehicles that are at maximum volume capacity—“cubed out”—weight savings will always provide the more conspicuous reduction in fuel use. As the density of freight shipments, meaning the mass carried by each truck, has been increasing over the past decade, the importance of reducing the vehicle tare
SOURCE: ORNL (2011).
weight is more for allowing additional payload for higher freight efficiency (reduced gallons per ton-mile). At the fleet level, this can lead to fewer trucks and truck trips needed to deliver the same overall freight mass, a huge incentive for lightweighting (NACFE, 2015a).
Weight reduction technologies are also needed to maintain current freight efficiency levels because of legal requirements, notably the selective catalytic reduction (SCR) exhaust aftertreatment systems, which added approximately 400 pounds in 2010 (21CTP, 2013). There are similar trade-offs to be considered with weight added by aerodynamic devices, hybrid powertrain components, driver amenities, and auxiliary power units. Overall, Class 8 trucks have become about 1,000 pounds heavier in the past decade (NACFE, 2015a). Weight increases in tractor and trailer caused loss of payload of about 2,000 pounds between 2005 and 2011.
Will higher-efficiency powertrains and lower aerodynamic drag, expected for MHDVs of 2025 and beyond, alter the impacts of weight reduction? The committee contracted with SwRI to examine vehicle fuel consumption with advanced powertrains through simulation, and this allows assessing the effects of mass for a future vehicle. Multiple vehicle classes and drive cycles were examined as further described in Chapter 6.
The results from the vehicle simulations are summarized in Table 5-6 (EDF, no date). The previously identified trends appear to hold true, that a 0.5 to 1.0 percent decrease in fuel consumption is likely for every 1,000 pounds removed from Class 8 vehicles, with a greater effect seen in a few cases. For diesel-powered Class 6 box trucks, there is a greater impact of weight reduction, generally exceeding 1.0 percent per 1,000 pounds reduced, and for the simulations of Class 5 diesel trucks the weight reduction effect was found to be over 2.0 percent per 1,000 pounds. The Class 2b and 3 pickup exhibited a weight sensitivity of about 2.5 percent per 1,000 pounds. Representative results from simulations showing weight effects are shown in Figures 5-22, 5-23, and 5-24 below.
5.4.3 Weight Impact in Hybrid Powertrain Vehicles
Since hybrid powertrains capture part of the vehicle kinetic energy during decelerations, analysts have considered the impacts of mass reduction as potentially different than in non-hybrid powertrains. Limited references found in the NRC Phase One study (NRC, 2010, Table 5-16) showed a case where mass effects on hybrids were
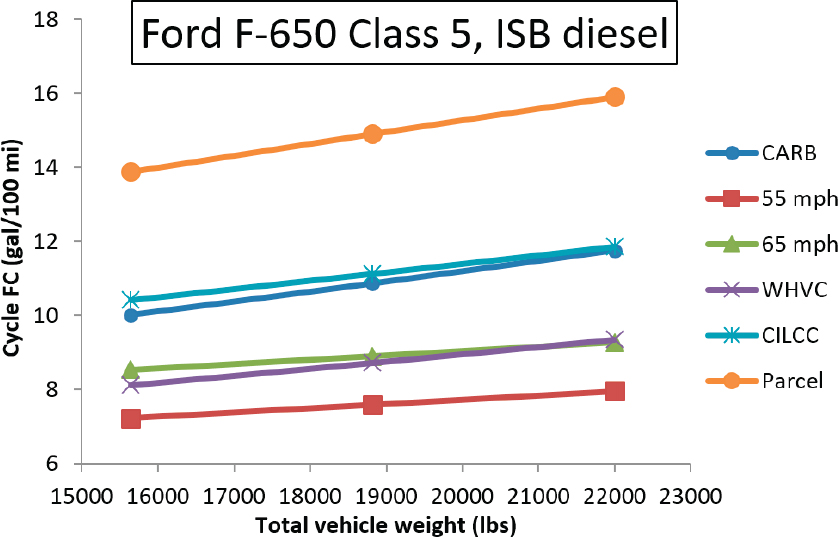
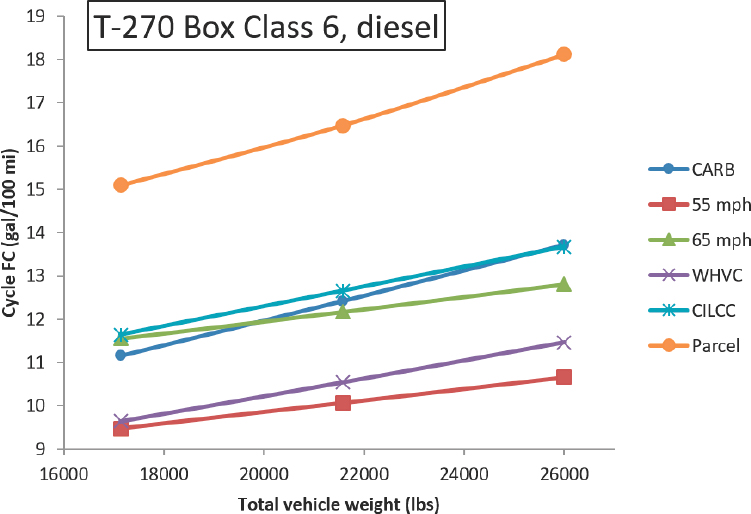
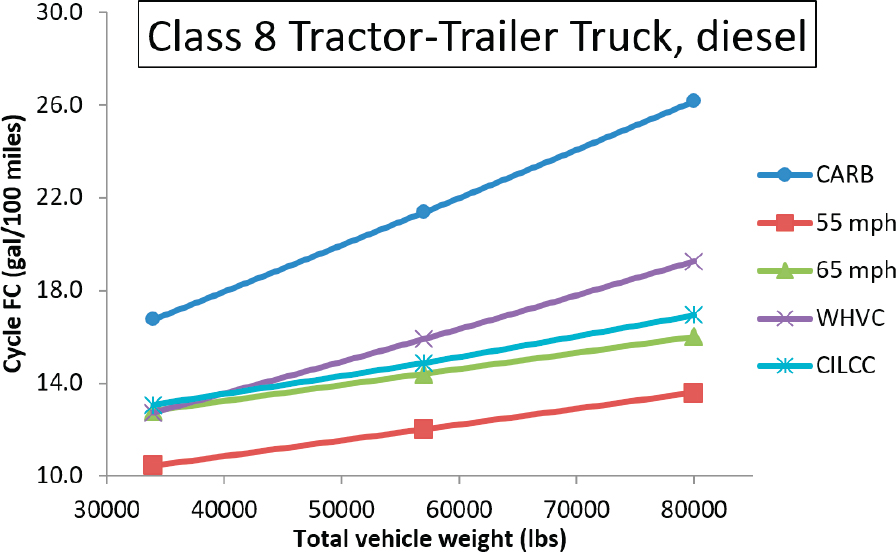
TABLE 5-6 Fuel Economy Effect of Tare Weight Reduction by Truck Class
| Truck Class | GVWR Range | Average Tare Weight (lbs) | Fuel Economy Improvement for Each 1,000 lbs of Tare Weight Reduction |
|---|---|---|---|
| 4 | 14,001-16,000 | 10,343 | 5.6% |
| 5 | 16,001-19,500 | 10,413 | 4.7% |
| 6 | 19,501-26,000 | 13,942 | 3.9% |
| 7 | 26,001-33,000 | 18,094 | 2.8% |
| 8A | 33,001-60,000 | 23,525 | 1.9% |
| 8B | 60,000+ | 28,979 | 1.1% |
SOURCE: Environmental Defense Fund.
The NRC Phase One study reported a potential 1.25 percent fuel consumption reduction through the 2020 time frame (NRC, 2010, Table 5-18) for Class 8 trucks, which translates to approximately a net 2,000 pound weight reduction. Higher impacts were expected in lighter classes of MHDVs. Examples of recent lightweighting studies and demonstrations are shown in Table 5-7.
All four of the SuperTruck teams included weight reduction in their strategies for achieving the program goal of 50 percent increase in freight efficiency, ranging from two to five percentage points, or 4 to 10 percent improvement over the baseline.
In 2011 DOE’s Vehicle Technologies Office convened a workshop to define goals and R&D requirements for lightweight materials (and propulsion materials) with the inclusion of heavy vehicles. Heavily attended by industry, targets for 2025 and 2050 were set for weight reduction of tractor and trailer components as shown in Table 5-8 (DOE, 2013). Examining the weight reduction goals for 2025, the 16 percent goal for the tractor equates to about 3,200 pounds, and the 9 percent goal for trailers translates to about 1,200 pounds, for a total of approximately 4,400 pounds. These quantities are on the same order as found in Table 5-7. In ICCT’s review (ICCT, 2015) of the cost effectiveness of technologies for truck fuel efficiency, they noted the report by the European Aluminum Association that gave estimates of weight-reduction potential of over 6,000 pounds (EAA, 2014).
Finding: For Class 8 tractor-trailer combination trucks, a total weight reduction of at least 4,000 pounds appears achievable, which would produce approximately 3 to 4 percent reduction in fuel consumption compared to trucks without lightweighting features, depending on duty cycle. This impact is roughly the same as a 5 to 10 percent reduction in Cd or a 10 to 20 percent reduction in Crr. Due to numerous systems that add weight, the net effect on fuel consumption will likely appear less. All recent advanced truck technology programs have included weight reduction as part of their technical strategy. The impact of weight reduction in smaller truck classes is higher than Class 8. Vocational vehicle weight reductions were documented in the Phase II rule as shown below in Table 5-9.
greater than 2 percent per 1,000 pounds. Several more-recent simulation studies were reviewed for the Phase II study. For Class 2B pickup trucks, Argonne National Laboratory (ANL) found that the effects of mass reduction were essentially the same for hybrid and conventional powertrains, about 2 percent for a 200 kg mass reduction (ANL, 2009). In a set of simulation studies for NESCAUM, SwRI compared hybrid and conventional Class 8 trucks and found that, for both types of powertrains, weight reduction gave very nearly the same reduction in fuel consumption. Heavy-duty (HD) vehicle simulations performed by the ORNL analyzed the benefits of hybrid Class 8 powertrains over a range of payloads, showing a slight nonlinearity (optimum payload) for fuel consumption benefits (Gao et al., 2015).
TABLE 5-7 Summary of Recent Lightweighting Studies Including Approach and Estimated Resulting Weight Reduction
| Weight Reduction Approach | Estimated Weight Reduction | Comments | Source |
|---|---|---|---|
| Cummins Peterbilt SuperTruck, multiple approaches: Aluminum fifth wheel and driveshaft, lighter axles and wheels, silicon carbide infused aluminum brake drums, magnesium cross members, lightweight air suspension, no lead-acid batteries | Net 1,305 lbs, total 5,500 lbs | Weight increases associated with waster-heat reduction on engine, aerodynamic aids, etc. | NAS review of 21CTP |
| Daimler SuperTruck, multiple methods: Aluminum frame and cross members, lightweight air suspension | Net 2,800 lbs | Initial weight reduction on prototype vehicle was 1,550 lbs | NAS review of 21CTP |
| Volvo SuperTruck, selected examples | Downsized engine, 11L instead of 13L, 400 lbs Aluminum frame, 800 lbs | NAS review of 21CTP | |
| Navistar SuperTruck, multiple, see next column |
Total tractor weight reduction: 3,250 lbs Trailer weight reduction: 3,700 lbs
|
NAS review of 21CTP R. Zukouski presentation November 2014, Washington, DC | |
| Walmart report on Freightliner 125BBCa and 113BBC Engine downsize, wide single tires/wheels, details next column. | Total weight reduction 2010 (125BBC) to 2013 (113BBC)=1,396 lbs Includes engine downsize, DD15 vs DD13, dual vs wide base, CastLite drums vs steellite, steel rear axle carrier vs aluminum, and lighter frame rails, additional 485 lbs reduction identified in other components |
E. Fretheim presentation to NAS committee, April 28, 2014 |
| Weight Reduction Approach | Estimated Weight Reduction | Comments | Source |
|---|---|---|---|
| Walmart WAVE Truck Trailer, carbon fiber composite materials and lightweight assembly methods | Weight reduction of 4,000 lbs on 53 ft trailer (10,000 lbs instead of 14,000 lbs) | http://corporate.walmart.com/_news_/news-archive/2014/03/26/walmart-debuts-futuristic-truck (accessed December 19, 2019) E. Fretheim, presentation to NAS committee, April 28, 2014. http://www.latimes.com/business/lafi-walmart-truck-20150920-story.html (accessed December 19, 2019) |
|
| Multiple methods for tractor and trailer | Mild lightweighting: 2,000 lbs Aggressive lightweighting: 4,000 lbs |
See reference for detailed component weight savings | North American Council on Freight Efficiency Confidence Report on Lightweighting, August 25, 2015. http://www.nacfe.org/downloads/confidence-report-lightweighting/ (accessed December 19, 2019) |
a Bumper to back of cab.
5.4.4 Cost Effectiveness of Weight Reduction
Although there is a tendency to think of materials substitution as the primary weight reduction path, there are a number of operational, or “right-sizing,” approaches that are sometimes lower cost than the baseline vehicle:
- Smaller truck cab,
- Downsized engine,
- Reduced fuel tank capacity,
- 6×2 tandem axle, and
- Innovative payload packaging.
Studies of cost effectiveness of weight reduction have often found lightweighting to be one of the less attractive options, perhaps because the materials substitution options are the most considered. Meszler and colleagues; 2015 review of technology cost effectiveness reviewed the prior studies and produced a range of costs for lightweighting shown in Figure 5-25.
In the NACFE study of weight reduction, they found that, per pound of weight reduction, “On average, bulk carriers will pay $6.00–$11.00, reefer or certain dry van dedicated routes $2.00–$5.00, and general dry van freight $0–$2.00.” Interestingly in the EPA/NHTSA RIA, weight reduction is generally dismissed for future standard setting.
TABLE 5-8 Weight Reduction Targets from DOE Workshop 2011
| 2020 | 2025 | 2030 | 2040 | 2050 | |
|---|---|---|---|---|---|
| Class 8 tractor Component group | |||||
| Wheels and tires | 10% | 20% | 20% | 25% | 25% |
| Chassis/frame | 3% | 10% | 10% | 20% | 20% |
| Drivetrain & suspension | 3% | 5% | 10% | 15% | 20% |
| Misc. accessories/systems | 5% | 15% | 25% | 30% | 35% |
| Truck body structure | 15% | 35% | 45% | 55% | 60% |
| Powertrain | 5% | 10% | 15% | 15% | 20% |
| Total Class 8 HDV | 7% | 16% | 22% | 27% | 31% |
| Trailer (53 ft) Component group | |||||
| Wheels and tires | 10% | 20% | 20% | 25% | 25% |
| Chassis/frame | 3% | 10% | 10% | 20% | 20% |
| Suspension | 3% | 5% | 10% | 15% | 20% |
| Box/other | 5% | 10% | 15% | 20% | 25% |
| Total trailer | 3% | 9% | 13% | 19% | 23% |
| Truck and trailer combined totals | 5.0% | 13.2% | 18.0% | 23.6% | 27.4% |
SOURCE: DOE (2013).
The agencies propose setting the 2021 through 2027 model year tractor standards without using weight reduction as a technology to demonstrate the feasibility. The agencies view weight reduction as a technology with a high cost that offers a small benefit in the tractor sector. For example, our estimate of a 400-pound weight reduction would cost $2,050 (2012$) in MY2021, but offer a 0.3 percent reduction in fuel consumption and CO2 emissions (EPA and NHTSA, 2016a, p. 2-88).
Finding: The cost of weight reduction is highly variable and dependent on the technical approach, and can range from a negative cost to over $10 per pound.
Recommendation 5-11: Future MHDV fuel consumption standards should include expectations for weight reduction adoption with likely potential of 3 to 4 percent reduction in fuel consumption at market-acceptable ROI.
5.5 AXLE AND DRIVETRAIN LOSSES
As with transmissions, there continue to be minor improvements in the efficiency, lubrication, and weight of axles. The primary developments are in the areas of faster gearing to match the lower engine speeds, increased torque capability as a result of the lower engine speeds and flatter torque curves, lubrication improvements to minimize losses, and innovative ways to eliminate gearing when not needed. NACFE (2013a) completed a study of 6×2 axle configurations in 2013. Table 5-10 summarizes the fuel savings possible, with some caveats. For instance, the report indicates the savings achieved by Con-way (NACFE, 2013a, p. 27) is an estimate that removes the effect of different configurations of transmissions and tires used in the test vehicles. It appears reasonable to project a fuel savings of 2 percent for this axle configuration.
Driveline weight continues to be improved slightly with reports of savings of 30 pounds in some newer designs. Carbon fiber prototypes of drivelines have been created. Aluminum, tubular drivelines have also been introduced with weight savings of 40 percent compared to typical two-piece steel driveshafts.
TABLE 5-9 Weight Reduction Technologies Evaluated for the Phase II Rule
| Component | Material | Vocational Vehicle Class | ||
|---|---|---|---|---|
| Class 2b-5 | Class 6-7 | Class 8 | ||
| Axle Hubs – Non-Drive | Aluminum | 40 | 40 | |
| Axle Hubs – Non-Drive | High Strength Steel | 5 | 5 | |
| Axle – Non-Drive | Aluminum | 60 | 60 | |
| Axle – Non-Drive | High Strength Steel | 15 | 15 | |
| Brake Drums – Non-Drive | Aluminum | 60 | 60 | |
| Brake Drums – Non-Drive | High Strength Steel | 42 | 42 | |
| Axle Hubs – Drive | Aluminum | 40 | 80 | |
| Axle Hubs – Drive | High Strength Steel | 10 | 20 | |
| Brake Drums – Drive | Aluminum | 70 | 140 | |
| Brake Drums – Drive | High Strength Steel | 37 | 74 | |
| Suspension Brackets, Hangers | Aluminum | 67 | 100 | |
| Suspension Brackets, Hangers | High Strength Steel | 20 | 30 | |
| Crossmember – Cab | Aluminum | 15 | 15 | 15 |
| Crossmember – Cab | High Strength Steel | 5 | 5 | 5 |
| Crossmember – Non-Suspension | Aluminum | 15 | 15 | 15 |
| Crossmember – Non-Suspension | High Strength Steel | 5 | 5 | 5 |
| Crossmember – Suspension | Aluminum | 15 | 25 | 25 |
| Crossmember – Suspension | High Strength Steel | 6 | 6 | 6 |
| Driveshaft | Aluminum | 12 | 40 | 50 |
| Driveshaft | High Strength Steel | 5 | 10 | 12 |
| Frame Rails | Aluminum | 120 | 300 | 440 |
| Frame Rails | High Strength Steel | 40 | 40 | 87 |
| Wheels – Dual | Aluminum | 150 | 150 | 250 |
| Wheels – Dual | High Strength Steel | 48 | 48 | 80 |
| Wheels – Wide Base Single | Aluminum | 294 | 294 | 588 |
| Wheels – Wide Base Single | High Strength Steel | 168 | 168 | 336 |
| Permanent 6x2 Axle Configuration | Multi | N/A | N/A | 300 |
SOURCE: EPA and NHTSA (2016).
Driveline angles are an important factor in the overall efficiency of the driveline. Vehicle OEMs routinely install the engine at a slight angle in order to minimize the losses in the universal joints of the driveline that take up the difference in angle from the engine flywheel to the input to the drive axle.
5.6 AUXILIARY LOADS
Both auxiliary and accessory loads are consumers of fuel energy delivered by engine power, and through various paths. We consider here only diesel engines, the favored selection for Class 6 through 8 trucks.
In the simplest description, accessory loads are those specific to engine subsystems performing certain functions required to produce power at the engine’s crankshaft/flywheel. Consequently, they are not debited to “engine brake horsepower.” Needed are a fuel pump supplying fuel to the cylinder, an oil pump supplying lubricating
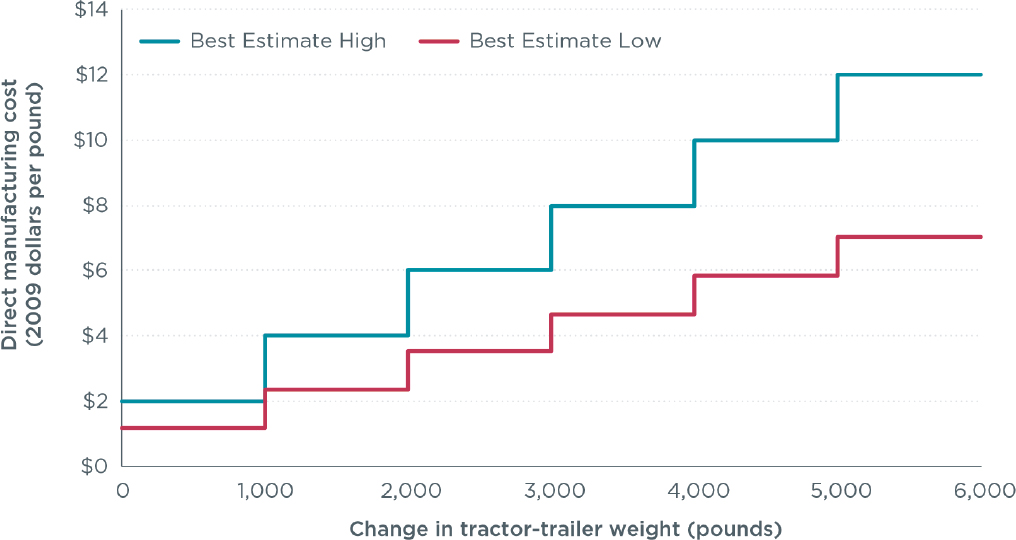
SOURCE: Meszler et al. (2015).
TABLE 5-10 Cost and Weight Reduction of Various Axle and Drivetrain Changes
| Item | Cost | Weight Impact |
|---|---|---|
| 125BBC vs 113BBC | 0 | 280 lbs |
| DD15 vs DD13 | -$1,610 | -390 lbs |
| Duals vs wide base | -$349 | -376 lbs |
| CastLite drums vs steellite | +$136 | -40 lbs |
| Steel rear axle carrier vs aluminum | +$255 | -130 lbs |
| 11/32 frame vs 9/32 | -$106 | -180 lbs |
| Total savings | -$1,674 | -1,396 lbs |
SOURCE: NACFE (2013a).
oil to various sliding engine surfaces, and a water pump to help coolant regulate engine temperature, and more recently exhaust-gas recirculation temperature. Notice that accessory power reduction directly increases engine brake thermal efficiency (BTE), as does internal engine friction reduction.
An alternator might be considered both an accessory and auxiliary. As an accessory, electricity is provided to the engine electronics system managing fuel and other engine sensor/actuator control and perhaps an electric fuel pump. The alternator, as auxiliary, provides the vehicle electricity for lighting, heating/ventilating, powertrain electronics, battery charge, and myriad other functions.
Auxiliaries satisfy vehicle functions, so are included as “vehicle power demands.” They regularly evolve, often to satisfy occupant comfort-hotel loads (heating, ventilation, and air conditioning [HVAC], computers, entertainment systems, and on-board appliances like refrigerators, microwaves, coffee pots), but increasingly communications. Because auxiliaries consume energy from the engine’s “brake horsepower,” when auxiliary load is reduced, the fuel consumption is reduced by “auxiliary consumption ÷ duty-cycle-average BTE.” This is true
for every vehicle power demand reduction. Effectively, this might multiply the fuel consumption reduction by 2.5 (when average BTE is 0.40).
”Auxiliaries” traditionally has been taken to include the brake air compressor, power-steering pump, cooling fan drive, engine starting, and fuel heating. Beginning in 2007, active management of diesel catalytic aftertreatment also entered the scene, requiring electrical and mechanical auxiliary power. The list could continue with addition of vocational functions—notable is the circa 40 hp needed to power trailer refrigeration units—that have gained both efficiency improvements from their manufacturers and a thorough study of technology options by CARB (2014). Hybrid systems substantially widen the range beyond traditional requirements.
The auxiliary reduction goal of 21CTP for 2021 is as follows:
Develop and demonstrate technologies that reduce essential26 auxiliary loads by 50 percent for Class 8 tractor-trailers. The goal baseline has numerically been specified as 20 HP (15kW) (21CTP, 2013).
Interestingly, 21CTP has not included cooling fan power in the auxiliaries list. This may be a purposeful omission since during line-haul operation fan-on time was estimated as only 5 percent (NRC, 2010). This is achieved with fans which are typically equipped with thermostatically controlled drives. Such drives are basically the default standard in the Class 8 truck industry. Nevertheless, fan systems are typically designed to pull circa 50 horsepower (hp) when duty-cycle demand requires (maximum engine horsepower, ambient temperature, vehicle speed, and ascending grade).
The auxiliaries are numerous, yet together consume a maximum of 20 hp. Therefore, each is a small consumer of energy. And more significantly, line-haul duty cycles do not stress the auxiliaries to maximum. Data in the NRC Phase One Report (2010, Tables 5-11 and 5-12) suggest that line-haul conditions use only about 50 percent of the maximum auxiliary power. Reducing small auxiliary loads still requires significant design, development, and quality assurance effort. That effort has not been absent in engine manufacturing companies because engine fuel consumption has always been a competitive factor to attract truck customers. And prior to SCR, more stringent NOx regulation was routinely accompanied by a substantial challenge to maintaining good fuel consumption. But now priority for that effort has been increasing as emphasis moves from regulatory attention to GHG reductions.
5.6.1 More Electric Truck
DOE (2006) and industry collaborated in an effort to reduce certain auxiliary and accessory loads in about 2000. The More Electric Truck27 uses electrically driven auxiliaries powered by a 30 kilowatt (kW) generator located inside the flywheel housing, which also serves as the starter motor. The auxiliaries converted to electrical power on the research demonstration vehicle were the HVAC, brake air compressor, and accessories: oil and water pumps. This system was prototyped and demonstrated on a Class 8 truck. Evidently, the prototype was never moved in entirety into a production application. A description of the project status following completion of the tractor-trailer demonstration can be found in DOE (2006).
5.6.2 Cummins Medium- and Heavy-Duty Accessory Hybridization Cooperative Research and Development Agreement
This joint DOE project, also known as VSS133, was initiated in 2013 (Deter, 2014). A cooperative between Cummins and ORNL, the project seeks solutions to these two issues:
- Accessories (and auxiliaries) have optimal running conditions based on load requirement. The ability to separate accessories from the engine speed allows the opportunity to run at ideal conditions without engine speed dependencies.
___________________
26 The Partnership has not clearly defined “essential.”
27 The More Electric Truck program was a collaboration between industry partners and the U.S. Department of Energy’s Office of Vehicle Technology’s FreedomCAR program. See http://www1.eere.energy.gov/vehiclesandfuels/pdfs/success/more_electric_truck.pdf (accessed December 19, 2019).
TABLE 5-11 Auxiliaries and Accessories Addressed by Energy-Efficient Truck Initiatives of Cummins, Daimler, Volvo, and Navistar
| Auxiliary or Accessory | Description of Component or System | |||
|---|---|---|---|---|
| Cummins | Daimler | Volvo | Navistar | |
| Cab & electric sleeper | ||||
| Auxiliary | HVAC | Variable-speed fan | Unidentified | 3-speed fan clutch |
| Clutched compressor | 48 V AC compressor | |||
| Power steering pump | Alternator/generator | |||
| Accessory | Lube pump | Variable water pump | Variable coolant pump | Variable water pump |
| Fuel pump | Variable oil pump | |||
SOURCE: June 2015 engine DOE Annual Merit Reviews from each project.
- HD line-haul trucks often idle for long periods in traffic and overnight for hotel loads. This typically requires the engine to idle for little reason other than driver comfort and system readiness, which uses excessive fuel and causes more emissions.
A thorough description of this project’s status can be found in the third review of the 21CTP program by NRC (2015).
5.6.3 SuperTruck Projects’ Development Work on Auxiliaries and Accessories
The four projects identified auxiliary systems or components where development could reduce consumption. These are identified in Table 5-11. As typical for equally funded, joint agency-industry R&D projects, little detail is required to be reported for smaller projects within the complete project. Yet it is valuable to the intended project objectives to have had close engineering scrutiny of these components.
Finding: There has been a modicum of agency funding to improving the vehicle power demand of auxiliaries. Yet, even where DOE-sponsored/shared projects have been pursued, reduction successes have not been well quantified.
Recommendation 5-12: When there are auxiliary power reductions achieved from agency-funded projects, NHTSA and DOE should appropriately document and publicly distribute these accomplishments.
5.7 ANNEX: DESCRIPTION OF AVAILABLE SMARTWAY-CERTIFIED TRAILER PACKAGES
There are 10 aerodynamic trailer packages, as of October 2015, produced by five companies that are Elite verified. Only one trailer manufacturer produces such a combination. All other devices and packages are produced by trailer component manufacturers. SmartWay has introduced a “basket” of three test procedures providing manufacturers choice for aerodynamics verification beginning in February 2015.28 The protocols are a full truck track test, a wind-tunnel test, and a coast-down test. All of these protocols have been built on relatively long-standing SAE procedures.
___________________
28 Dennis Johnson and Sam Walter, U.S. Environmental Protection Agency, June 25, 2015, “SmartWay Technology Programs, USEPA Technology Assessment Center,” personal communication with committee member Charles Salter.
- Track Test. An EPA-approved full truck track test remains the default procedure for SmartWay approvals and general industry verifications (EPA, 2016b). EPA’s “2014 SmartWay Track Test” test procedure provides data on the incremental fuel consumption of the test vehicle. The 2014 SmartWay track test includes a number of updates. Prior to 2014, SmartWay verification track testing was based on industry methods commonly referred to as SAE J1321 procedures adopted in 1986. For the new 2014 SmartWay track test, EPA updated the protocol to incorporate the more recent (2012) version of the SAE J1321 procedure, overlaid with new SmartWay testing enhancements, such as tractor-trailer set-up specifications. These new enhancements will improve truck comparisons by limiting some sources of variability. One main addition is to require more than one complete track test in order to achieve SmartWay verification. This is an industry-recommended practice and will give fleets additional confidence that the aerodynamic technologies verified with this procedure will perform comparably in similar conditions on the road.
- Wind Tunnel. Wind-tunnel testing provides data on the incremental coefficient of drag (Cd) and incremental wind-averaged drag coefficient (Cdwa).29 Interestingly, the 10 Elite packages have all been verified by EPA-accepted wind-tunnel testing. EPA requires the use of the Cdwa results, as they contain a better real-world drag estimate by providing effects of crosswinds similar to real truck environments. Most wind-tunnel facilities have correlation factors to forecast fuel consumption from the Cd results. EPA provides guidelines for wind-tunnel selection and operation (EPA, 2015b).
- Coast-down. EPA also approves a full truck coast-down procedure for trailer aerodynamics performance verification, having collaborated in test procedure updates with the SAE Task Force on the SAE J1263 (with J2263) procedures. Coast-down, too, provides Cd figures after replicate tests and specified data analysis, including extraction of the aerodynamic (Cd) load from the total of the unpowered road loads imposed by the procedure. Incremental Cd for the experimental component (trailer, for example) is acquired by comparing the results to a baseline vehicle. Furthermore, these data are required for the truck performance verification analysis in the GEM protocol. EPA and NHTSA have enhanced this procedure in their proposed Phase II GHG and fuel consumption rules. It now must include a high-low iteration method, described in the proposal. The process determines mechanical losses in a low-speed portion of the coast-down, then subtracts those from a high-speed portion which will finally result in determining the CdA (product of the Cd and frontal area A). The CdA becomes a GEM input parameter. EPA has shown the CdA standard error to be in a range of about 0.5 to 2.1 percent, in small test samples (EPA and NHTSA, 2015).
Finally, SmartWay encourages component design variable analysis using CFD. However, this method alone cannot be used for the component/system validation.
5.8 ANNEX: SUMMARY OF SUPERTRUCK PROJECTS
The cooperative R&D agreements established four project teams variously identifying similar aerodynamic component modifications: to the tractor (bumper, radiator louvers, chassis extenders, hood, roof, and wheel covers) and to the trailer (skirts, tail, bogie cover, wheel covers, and front gap fairing) (see Figure 5-26). Yet, most have shape uniqueness as illustrated in Figures 5-27 and 5-28. Apparent in both figures are large trailer tails and very close road clearance skirts and tractor fairings. It is not clear if complete results dossiers will be publicly available.
5.8.1 Cummins-Peterbilt Project
The baseline tractor-trailer at the target 65,000 pounds GVW, performed in freight efficiency terms at 101 ton-miles per gallon, corresponding with the more useful LSFC of 9.9 gallons per 1,000 ton-miles, and the more familiar fuel economy figure of 6.45 mpg, over the long-haul duty cycle. This project has reported final performance results of a 76 percent increase in freight efficiency (50 percent goal), arriving at 178 ton-miles per gallon
___________________
29 Wind-averaged Cd: a weighted calculation of drag based on a range of yaw angle (typically ± 12 degrees, and wind speed). See https://www.sae.org/publications/technical-papers/content/870001/ (accessed December 19, 2019).
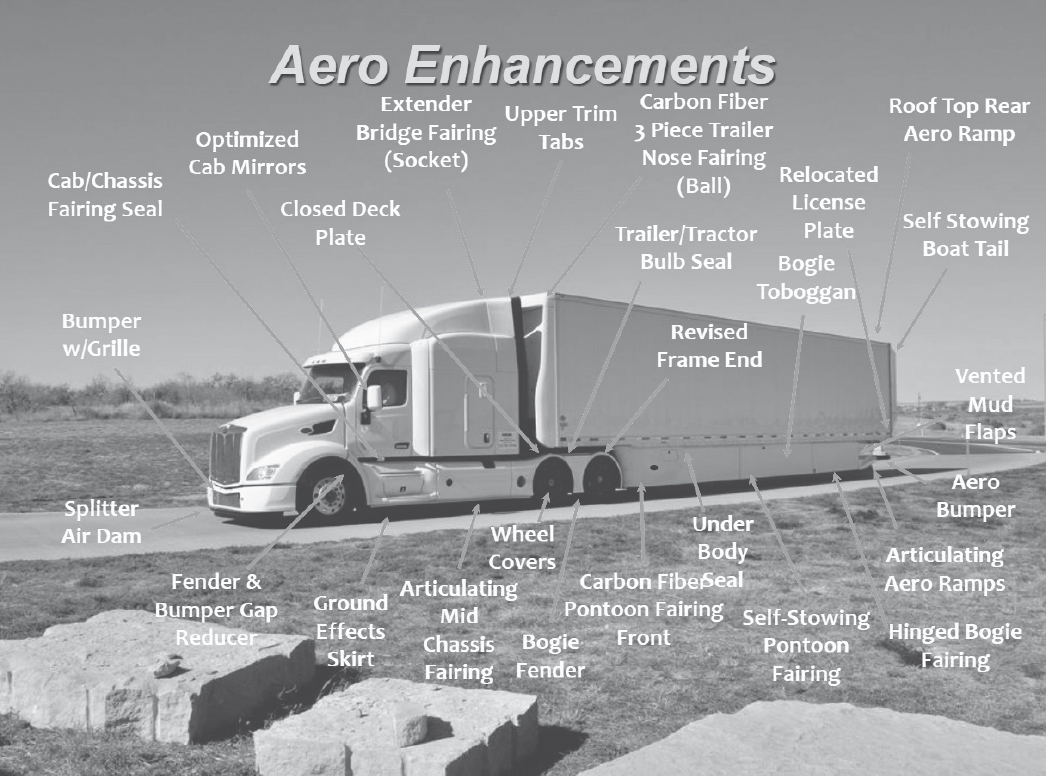
SOURCE: Peterbilt Motors Inc. (2014).
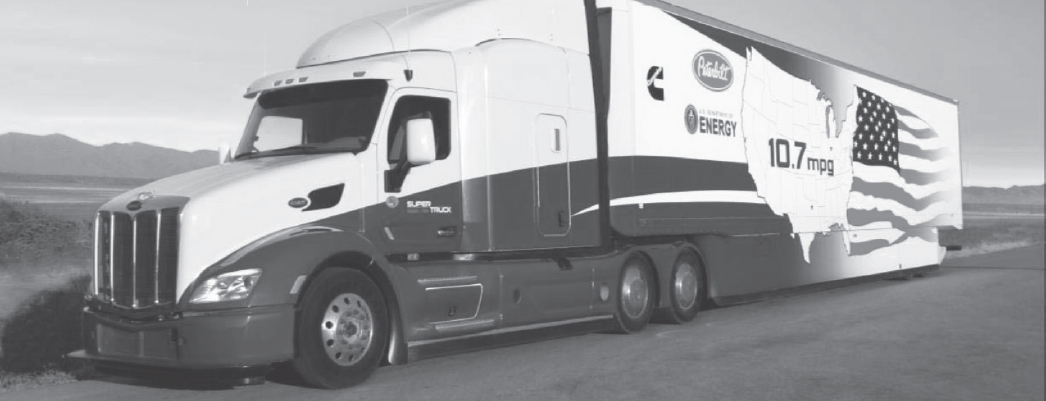
SOURCE: Koeberlein (2015).
on their selected long-haul drive cycle. The corresponding LSFC was improved by 43 percent to 5.64 gallons per 1,000 ton-miles, and a fuel economy figure of 10.7 mpg,30 over the long-haul duty cycle.
Aerodynamics-specific performance data indicated a contribution of 28.7 percent to the freight efficiency (ton-miles per gallon) increment, and corresponding 1.6 mpg increase on the long-haul drive cycle (Koeberlein, 2015). The Cd reduction for the system was reported as 46 percent, which would put this vehicle’s Cd at about 0.32-0.35.
Additional final combination SuperTruck results over the long-haul cycle reported the full vehicle load-specific fuel consumption (gallons per 1,000 ton-miles) at 5.72, but increasing to 6.52 when the standard (baseline) trailer with skirt was substituted (Peterbilt, 2014). This 14 percent fuel consumption increase with a legacy-aero trailer is significant. The Cummins-Peterbilt project self-imposed the ability for their SuperTruck tractor to achieve compatibility with standard, legacy trailers. Figures 5-26 and 5-27 display the Cummins-Peterbilt final Supertruck and its various aerodynamic improvements.
Two design accommodations to manage real-world issues encountered by drivers was to make the trailer skirt pneumatically retractable for access to loading docks and for crossing crowned areas such as railroad tracks. An access panel covering the trailer tandem was modified so that it could open 180 degrees for tire inspection.
5.8.2 Daimler Project
The “signature” freight efficiency increase achieved over the chosen Texas long-haul cycle route was 119.5 percent (to 206 ton-miles per gallon), with a corresponding 54.5 percent reduction in LSFC (to 4.85 gallons per 1,000 ton-miles). These figures plus the corresponding remarkable fuel economy was 12.2 mpg, all tested at 65,000 pounds GVW in their Texas long-haul cycle.31
Daimler included a number of aerodynamic features in their final SuperTruck tractor’s cab such as widening it to match the sleeper width, and raking back both the grill and windshield (see Figure 5-28). The shape of the hood has been extensively modified to optimize aerodynamic efficiency with the smaller engine (10.7L versus 14.6L) and angled cooling system.
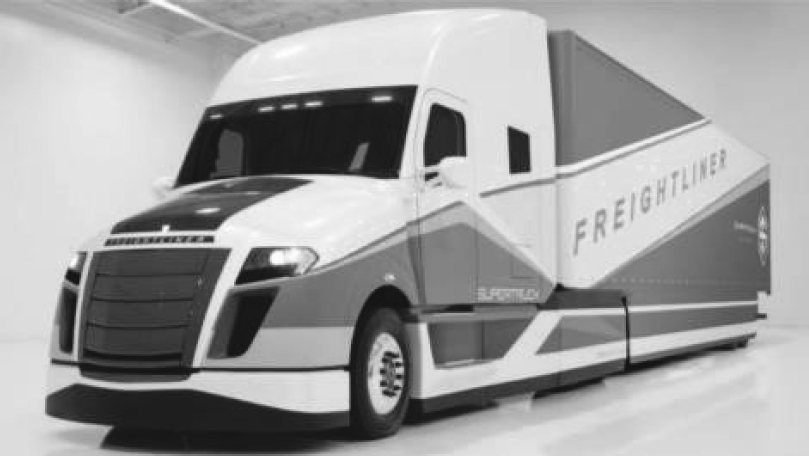
SOURCE: Rotz (2015).
___________________
30 The headline trip result of 10.7 mpg was achieved during a later test, where the average wind was 6 mph, with no gusts. See NRC (2015).
The wind-averaged Cd of the final demonstrator tractor and trailer is 54 percent lower than the baseline, as determined in a scale model wind tunnel (this would mean a Cd of about 0.3). Telling of the relative tractor versus trailer aerodynamic design maturities, at the start of the project, trailer improvements delivered 72 percent of the total vehicle aerodynamic improvement, but requiring only one-third of the aerodynamic engineering effort. Another unique feature included on the tractor was a louvered radiator grill that closes when cooling demand is not detected, thus not interrupting the air flow over the tractor nose and contributing 6 percent to the Cd reduction (Rotz and Zeigler, 2014).
5.8.3 Volvo Group Project
Volvo Trucks North America’s SuperTruck project successfully demonstrated fuel efficiency of greater than 12 miles per gallon, 88 percent greater freight efficiency, and 70 percent better fuel efficiency than the baseline 2009 Volvo model VNL 670.32 Lightweighting was a key approach for Volvo. They used a down-sized D11 model engine, which also helped with improving hood slope for aerodynamics (see Figure 5-29). Carbon fiber was used for the roof and side fairings (Park, 2016). Recycled carbon fiber was used in places to save cost. An aluminum frame was used to cut weight by nearly 50 percent (Park, 2016). The supertruck is about 3,200 pounds lighter (Park, 2016).
The Volvo SuperTruck program enabled several technologies that were put into production in its latest product offering. This includes turbocompounding to recover wasted energy, a wave piston design for improved fuel efficiency of the engine of 2.2 percent. The common-rail fuel injection system was optimized, providing an injector with enhanced flow rate, spray angle, and pressure characteristics, higher injection pressures, and finer control of the injection event. The D11 engine has a flatter torque curve from 900 to 1,300 RPM.
Another key to the Volvo truck was taking a complete systems approach to the combination vehicle that optimized the tractor, trailer, and the powertrain to work together. An example of the integration is the Volvo iSee 12-speed transmission, which learns the road’s topography to enable better shifting and intelligent cruise control including coasting in neutral with the engine at idle speed. Cameras with less aerodynamic drag replaced the conventional mirrors. Solar panels are built into the roof to aid battery charging and HVAC operation. A 10 kW alternator is capable of using wasted kinetic energy during braking (Marsh, 2016). This effort will expedite commercial product availability.
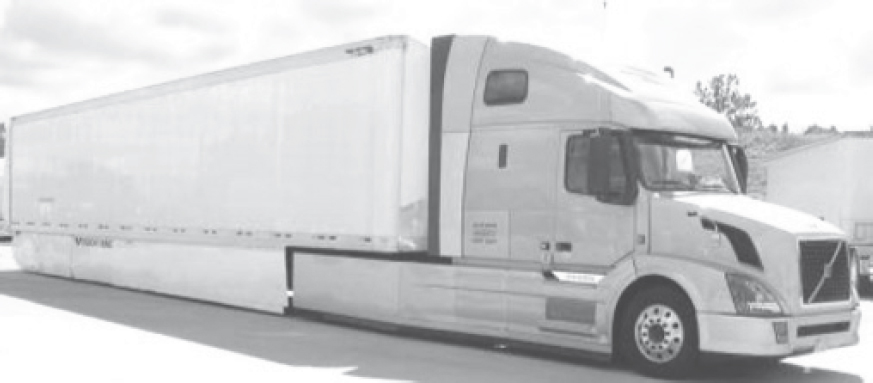
SOURCE: Amar and Gibble (2016).
___________________
32 See https://www.volvotrucks.us/innovation/supertruck/ (accessed December 19, 2019).
5.8.4 Navistar Inc. Project
Navistar completed their SuperTruck project in 2016, achieving
- 104 percent overall improvement in freight efficiency compared to 2009 baseline,
- 50.3 percent brake thermal efficiency for the engine, and
- 13 miles per gallon.
According to Navistar,33 the key features of their CataLIST truck are
- Advanced integration of the Navistar® N13 Engine utilizing proprietary intelligent controls and high-efficiency combustion;
- Reduction in aerodynamic drag through replacement of cab- and hood-mounted mirrors with a series of cameras and interior-mounted monitors, which also yield equal or better indirect vision for the driver;
- A new light-emitting diode (LED) headlamp system that reduces lamp size for a more aerodynamic shape and cuts electrical power requirements by greater than 80 percent, while improving luminous output and light color for improved night-time direct driver vision and reduced driver fatigue;
- An all-new shape with a sloped windshield and wedged cab for improved aerodynamics, and innovative use of lighter-weight carbon-fiber panels in the upper body, roof headers, back panel, and dash panel;
- A hybrid front suspension and lightwei.ght rear suspension that leverages lightweight alloys with composite materials, reducing weight and enabling an electronic ride height management system, which provides dynamic ride height and pitch control for improved aerodynamics;
- An electronic ride height management system, which provides dynamic ride height and pitch control for improved aerodynamics; and
- Aerodynamic improvements that reduce the trailer’s drag coefficient by more than 30 percent.
Considerable wind-tunnel testing has produced both significant trailer and tractor results. The trailer in Figure 5-30 delivered up to 19 percent freight efficiency improvement. Features included a boat tail, segmented trailer skirts, bogie fairing with diffuser-extends trailer skirts, and wheel covers on trailer and tractor bogies. Tractor design features have delivered up to a 12 percent improvement in freight efficiency. The design features include treatments to the bumper, hood, cab fairing, and extended chassis fairings.
Navistar considered three methods to treat the gap between cab and trailer: bellows, inflatable, and ball/socket concepts. Navistar acknowledges that the highest-benefit concepts also carry the highest risk of failure (Zukouski, 2014). Navistar worked to improve aerodynamic performance with an electronically controlled ride height feature. At speeds above 50 mph, the front and rear suspension are dropped 1.5 to 2 inches to create a slightly more teardrop, aerodynamic profile. Figure 5-30 shows the concept as reported by Navistar investigators for the DOE SuperTruck project (Zukouski, 2015).
___________________
33 See https://news.navistar.com/2016-09-28-Navistars-SuperTruck-Exceeds-Department-Of-Energys-Freight-Efficiency-Goal (accessed December 19, 2019).
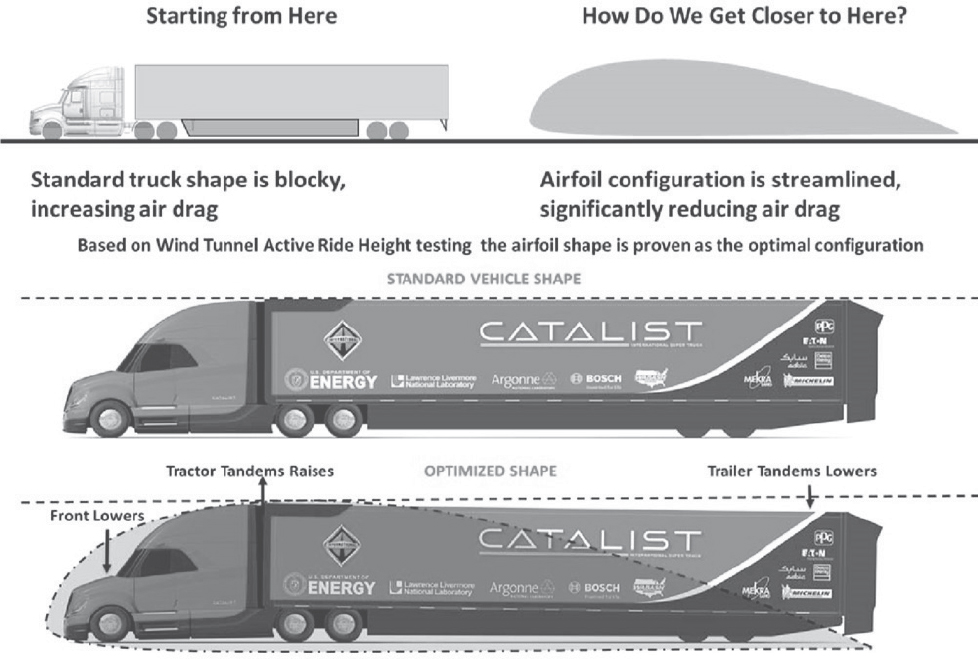
SOURCE: Zukouski (2015).
5.9 REFERENCES
21CTP (21st Century Truck Partnership). 2013. 21st Century Truck Partnership, Roadmap and Technical White Papers. Department of Energy. Available at http://energy.gov/sites/prod/files/2014/02/f8/21ctp_roadmap_white_papers_2013.pdf (accessed December 19, 2019).
Amar, P. (Volvo). 2015. Volvo Technology of America SuperTruck Program, DOE Project ID VSS081. June.
Amar, P., and J. Gibble. 2016. SuperTruck Powertrain Technologies for Efficiency Improvement, DOE Contract DE-EE0004232. June.
ANL (Argonne National Laboratory). 2009. Evaluation of Fuel Consumption Potential of Medium and Heavy Duty Vehicles through Modeling and Simulation. Lemont, IL: ANL.
Benedict, R. (The Goodyear Tire & Rubber Company). 2014. A System for Automatically Maintaining Pressure in a Commercial Truck Tire: Project ID# VSS085. Presentation to the Annual Merit Review, Washington, DC, June 19.
Bhatnagar, B., M. Dinesh, and C. Mohan. 2011. A Study of Reynolds Number Effects on Production Class 8 Tractor-Trailer Combinations. Chicago: Daimler. June 28.
Bohme, F. No date. Self-healing Materials. http://www.ipfdd.de/en/departments/institute-of-macromolecular-chemistry/polymer-structures/self-healing-materials/ (accessed December 19, 2019).
Britt, M.G. 2015. SAE Government Industry Meeting 2015. Oral Presentation, Fleet Perspective on Fuel-Saving Tires. Presented at the SAE Government Industry Meeting 2015. American Trucking Associations Technical Advisory Group.
Burger, L. 2014. Tire Makers Race to Turn Dandelions into Rubber. Available at http://www.reuters.com/article/2014/08/20/us-dandelion-rubber-idUSKBN0GK0LN20140820 (accessed September 6, 2015).
CARB (California Air Resources Board). 2014. Transport Refrigerators Technology Assessment. Presentation in Sacramento, CA, September 3.
Caterpillar. 2006. Understanding Tractor-Trailer Performance. Brochure. Available at http://ohe.cat.com/cda/files/867819/7/LEGT6380.pdf.
Caterpillar. 2015. CDX Online eTextbook. Availabe at http://www.cdxetextbook.com/steersusp/wheelsTires/construct/tireratings.html (accessed December 13, 2015).
Collins, T. 2017. Michelin unveils concept tyres that you NEVER have to pump up and they are impervious to flats: Airless design comes wrapped in ‘rechargeable’ 3D-printed treads. https://www.dailymail.co.uk/sciencetech/article-4610728/Michelin-unveils-airless-Vision-concept-tyres.html (accessed July 30, 2017).
Courier & Press. 2015. Special coating applied to curve on Crittenden Co.’s Rosebud Hill. http://archive.courierpress.com/news/special-coating-applied-to-curve-on-crittenden-cos-rosebud-hill-ep-1253426326-324773071.html (accessed December 19, 2019).
Deter, D. 2014. “Cummins MD & HD Accessory Hybridization CRADA.” VSS133. Presentation at: 2014 U.S. DOE Hydrogen Program and Vehicle Technologies Program Annual Merit Review and Peer Evaluation Meeting. June 16-20.
DOE (Department of Energy). 2006. More Electric Truck, 21CTP-0003. December. Available at http://www1.eere.energy.gov/vehiclesandfuels/pdfs/program/21ctp_roadmap_appendix_2007.pdf (accessed December 19, 2019).
DOE. 2013. Workshop Report: Trucks and Heavy-Duty Vehicles Technical Requirements and Gaps for Lightweight and Propulsion Materials. U.S. Department of Energy, Energy Efficiency and Renewable Energy, Vehicle Technologies Office. DOE/EE-0867.
EAA (European Aluminium Association). 2014. Financial Benefit Analysis for an Investment in an Aluminium Vehicle. http://www.alueurope.eu/financial-benefits-simulator/ (accessed September 22, 2016).
EC (European Commission). 2009. Regulation (EC) no 1222/2009 of the European Parliament and of the Council of 25 November 2009 on the labelling of tyres with respect to fuel efficiency and other essential parameters. Official Journal of the European Union L342:46-58. November 25.
EC. 2011. Commission Regulation (EU) No 1235/2011 of 29 November 2011 amending Regulation (EC) No 1222/2009 of the European Parliament and of the Council with regard to the wet grip grading of tyres, the measurement of rolling resistance and the verification procedure. Official Journal of the European Union L317:17-23. November 29.
EDF (Environmental Defense Fund). No date. GHG Management for Medium Duty Truck Fleets. New York: EDF.
EPA (Environmental Protection Agency). 2015a. EPA Designated SmartWay Elite Trailers. Available at http://www3.epa.gov/smartway/forpartners/documents/aerodynamic/420f15008.pdf (accessed October 17, 2015).
EPA. 2015b. EPA Aerodynamic Wind Tunnel Testing for SmartWay Verification. Available at http://www3.epa.gov/smartway/forpartners/documents/aerodynamic/420f15012.pdf (accessed October 19, 2015).
EPA. 2016a. SmartWay Verified Low Rolling Resistance Tires Performance Requirements. EPA 420-F-12-024. Available at https://www.epa.gov/sites/production/files/2016-02/documents/420f12024.pdf (accessed December 19, 2019).
EPA. 2016b. Track Testing for SmartWay Verification. Available at https://www.epa.gov/sites/production/files/2016-02/documents/420f15011.pdf (accessed December 19, 2019).
EPA. 2019. Maintaining Proper Tire Inflation Pressure: A Glance at Clean Freight Strategies. Available at https://www.epa.gov/sites/production/files/2019-09/documents/420f19028.pdf (accessed December 19, 2019).
EPA and DOT. 2015. Greenhouse Gas Emissions and Fuel Efficiency Standards for Medium- and Heavy-Duty Engines and Vehicles—Phase 2: Draft Regulatory Impact Analysis. EPA-420-D-15-900. Washington, DC: EPA. June.
EPA and DOT. 2016. Greenhouse Gas Emissions and Fuel Efficiency Standards for Medium- and Heavy-Duty Engines and Vehicles—Phase 2: Regulatory Impact Analysis. EPA-420-R-16-900. Washington, DC: EPA and DOT. August.
EPA and NHTSA (National Highway Traffic Safety Administration). 2011. Greenhouse Gas Emissions Standards and Fuel Efficiency Standards for Medium- and Heavy-Duty Engines and Vehicles; Final Rule. September 15, 2011. Federal Register 76:57106-57513.
EPA and NHTSA. 2015. Greenhouse gas emissions and fuel efficiency standards for medium- and heavy-duty engines and vehicles—Phase 2. Federal Register 80:40137-40765. July 13.
EPA and NHTSA. 2016a. Regulatory Impact Analysis, Final Rule for Greenhouse Gas Emissions and Fuel Efficiency Standards for Medium- and Heavy-Duty Engines and Vehicles, Phase II. Washington, DC: NHTSA.
EPA and NHTSA. 2016b. Greenhouse gas emissions and fuel efficiency standards for medium- and heavy-duty engines and vehicles—Phase 2. Federal Register 81:73478-74274. October 25.
Erb, A. 2015. The Place of Low Rolling Resistance Tires in EPA’s Greenhouse Gas Reduction Strategy. U.S. Environmental Protection Agency. 2015 SAE Government/Industry Meeting, Washington, D.C., January 23.
ETRMA (European Tyre and Rubber Manufacturers’ Association). 2011. Tyre Labelling. http://www.etrma.org/tyres/tyre-labelling (accessed July 30, 2017).
Gao, Z., D.E. Smith, C.S. Daw, K.D. Edwards, B.C. Kaul, N. Domingo, and J.E. Parks II. 2015. The evaluation of developing vehicle technologies on the fuel economy of long-haul trucks. Energy Conversion Management 106:766-781.
Greenberg, M. (U.S. Environmental Protection Agency). 2014. A Look at Tractor Trailer Aerodynamics and Fuel Efficiency. Presentation to the ACEEE/ICCT Workshop on Emerging Technologies for Heavy-Duty Vehicle Fuel Efficiency, Washington, DC, July 22.
Gururaja, P. 2016. Wind-Averaged Drag Determination for Heavy-Duty Vehicles Using On-Road Constant-Speed Torque Tests. SAE Technical Paper 2016-01-8153. doi: 10.4271/2016-01-8153.
Hammache, M., M. Michaelian, and F. Browand. 2002. Aerodynamic Forces on Truck Models, Including Two Trucks in Tandem: California PATH Research Report. UCB-ITS-PRR-2001-27. Berkeley, CA: University of California, Berkeley.
ICCT. 2015. Parsing Phase 2 Tractor-Trailers Proposed Regulation. Washington, DC: ICCT. July. Available at http://www.theicct.org/blogs/staff/parsing-phase-2-tractor-trailers-proposed-regulation (accessed December 19, 2019).
Kayes, D. (Daimler Trucks North America). 2015. Executive Panel: Greenhouse Gas Legislation. Presentation at the SAE 2015 Commercial Vehicle Engineering Congress in Rosemont, IL, October 7.
Koeberlein, D., and Cummins Inc. 2014. Cummins SuperTruck Program: Technology and System Level Demonstration of Highly Efficient and Clean, Diesel Powered Class 8 Trucks. Presentation at the 2014 DOE Hydrogen and Fuel Cells Program and Vehicle Technologies Office Annual Merit Review and Peer Evaluation Meeting, Washington, DC, June 20.
Koeberlein, D. (Cummins). 2015. Cummins Engine Co. SuperTruck Program. DOE Project ID ACE057. June.
Lew, S. 2013. Test Methods for Truck Tire Rolling Resistance and Reducing Fuel Consumption of M-D and H-D Vehicles. Michelin North America, Inc. Presentation to NRC Committee on Assessment of Technologies and Approaches for Reducing the Fuel Consumption of Medium- and Heavy-Duty Vehicles, Phase 2, Irvine, California, November 21.
Marsh, A. 2016. For Volvo, SuperTruck Project was ‘Knowledge Accelerator.’ https://www.fleetowner.com/technology/volvo-supertruck-project-was-knowledge-accelerator (accessed July 30, 2017).
McAuliffe, B., and D. Chuang. 2016. Track-based aerodynamic testing of a heavy-duty vehicle: Coast-down measurements. SAE International Journal of Commercial Vehicles 9(2):381-396. doi: 10.4271/2016-01-8152.
Meszler, D., N. Lutsey, and O. Delgado. 2015. Cost Effectiveness of Advanced Efficiency Technologies for Long-Haul Tractor-Trailers in the 2020-2030 Time Frame: White Paper. Washington, DC: ICCT. April.
Mihelic, R. (Mihelic Vehicle Consulting LLC). 2015. Heavy Truck Aerodynamics Beyond 2025. Presentation at the SAE 2015 Commercial Vehicle Engineering Congress, Rosemont, IL, October 6.
Mihelic, R., J. Smith, and M. Ellis. 2015. Aerodynamic comparison of tractor-trailer platooning and A-train configuration. SAE International Journal of Commercial Vehicles 8(2):740-746. doi: 10.4271/2015-01-2897.
NACFE (North American Council for Freight Efficiency). 2013a. Confidence Findings on the Potential of 6x2 Axles. Available at https://nacfe.org/report-library/confidence-reports/ (accessed March 8, 2016).
NACFE. 2013b. Confidence Report: Tire Pressure Systems. Available at http://truckingefficiency.org/tires/tire-pressure-inflation-trailer (accessed September 6, 2015).
NACFE. 2015a. Confidence Report on Lightweighting, Available at http://www.truckingefficiency.org/tractor-aerodynamics/weight-reduction-tractors (accessed September 6, 2015).
NACFE. 2015b. Confidence Report: Low Rolling Resistance Tires. Available at http://truckingefficiency.org/tires/low-rolling-resistance-duals (accessed September 6, 2015).
NACFE. 2016a. Confidence Report: Tractor Aerodynamics. Washington, DC: NACFE. May 4.
NACFE. 2016b. Confidence Report: Two-Truck Platooning. Washington, DC: NACFE.
NACFE. 2016c. Confidence Report: Trailer Aerodynamic Devices. Washington, DC: NACFE. February.
NHTSA (National Highway Traffic Safety Administration). 2009. NHTSA Tire Fuel Efficiency Consumer Information Program Development: Phase 2—Effects of Tire Rolling Resistance Levels on Traction, Treadwear, and Vehicle Fuel Economy. DOT HS 811 154. Washington, DC: DOT. August.
NHTSA. 2015. Effects of Tire Rolling Resistance on Class 8 Tractor-Trailer Stopping Distance. DOT HS 812 176. Washington, DC: NHTSA. June.
NRC (National Research Council). 2010. Technologies and Approaches to Reducing the Fuel Consumption of Medium- and Heavy-Duty Vehicles. Washington, DC: The National Academies Press.
NRC. 2012. Review of the 21st Century Truck Partnership, Second Report. Washington, DC: The National Academies Press.
NRC. 2014. Reducing the Fuel Consumption and Greenhouse Gas Emissions of Medium- and Heavy-Duty Vehicles, Phase Two First Report. Washington, DC: The National Academies Press.
NRC. 2015. Review of the 21st Century Truck Partnership, Third Report. Washington, DC: The National Academies Press.
ORNL (Oak Ridge National Laboratory). 2011. Effect of Weight and Roadway Grade on the Fuel Economy of Class-8 Freight Trucks. ORNL/TM-2011/471. October.
ORNL (Oak Ridge National Laboratory). 2017. 2016 Vehicle Technologies Market Report. Available at https://tedb.ornl.gov/wp-content/uploads/2019/04/2016_Vehicle_Technologies_Market_Report.pdf.
Park, J. 2016. Volvo’s SuperTruck Demonstrates the Art of the Possible. Available at https://www.truckinginfo.com/157083/volvos-supertruck-demonstrates-the-art-of-the-possible (accessed July 30, 2017).
Peterbilt Motors Co. 2014. DOE SuperTruck Program, Technology and System Level Demonstration of Highly Efficient and Clean, Diesel Powered Class 8 Trucks, Project ID AARAVT081, August.
Reinhart, T.E. 2015. Commercial Medium- and Heavy-Duty Truck Fuel Efficiency Technology Study—Report #1. DOT HS 812 146. Washington, DC: NHTSA. June.
Reinhart, T.E. 2016. Commercial Medium- and Heavy-Duty Truck Fuel Efficiency Technology Study—Report #2. DOT HS 812 194. Washington, DC: NHTSA. February.
Ricardo Inc.. 2009. Impact of Vehicle Weight Reduction on Fuel Economy for Various Vehicle Architectures. Arlington, VA: The Aluminum Association.
Rotz, D. (Daimler Truck NA). 2015. SuperTruck Program: Vehicle Program Review, DOE Project ID ARRVAT080. June.
Rotz, D., and M. Ziegler (Daimler Truck North America). 2014. SuperTruck Program: Vehicle Program Review. DOE Project ID ARRVAT080. Presentation to the Annual Merit Review, Washington, DC, June 19.
Salari, K. (Lawrence Livermore National Laboratory). 2016. DOE’s Effort to Improve Heavy Vehicle Fuel Efficiency through Improved Aerodynamics. Presentation at DOE Annual Merit Review, Washington, DC, June 6-10.
Sidders, J. (Dana Commercial Vehicles). 2017. “Optimized Tire-Pressure Management.” http://danacv.com/downloads/TirePressureManagement_WhitePaper.pdf (accessed August 28, 2019).
Smith, J., R. Mihelic, B. Gifford, and M. Ellis. 2014. Aerodynamic impact of tractor-trailer in drafting configuration. SAE International Journal of Commercial Vehicles 7(2):619-625.
Sproull, L. (PACCAR Inc.). 2015. Executive Panel: Greenhouse Gas Legislation. Presentation at the SAE 2015 Commercial Vehicle Engineering Congress in Rosemont, IL, October 7.
Steidel, S., T. Halfmann, M. Baecker, and A. Gallrein. 2016. Prediction of Rolling Resistance and Tread Wear of Tires in Realistic Commercial Vehicle Application Scenarios. SAE Paper 2016-01-8027.
TMC (The Maintenance Council). 1994. Radial Tire Conditions Analysis Guide: A Comprehensive Review of Tread Wear and Tire Conditions. Alexandria, VA: TMC.
TMC. 2014. Fuel Efficiency and Vehicle Emissions Regulations: Now and for the Foreseeable Future. S11 Tech Session, March 11. Available at http://www.tech-i-m.com/insight/s11-tech-session-march-11-2014-fuel-efficiency-and-vehicle-emissions-regulations-now-and-for-the-foreseeable-future/ (accessed March 27, 2015).
United Nations Economic Commission for Europe. 2014. Addendum 116: Regulation No. 117, Revision 3, Uniform Provisions Concerning the Approval of Tyres with Regard to Rolling Sound Emissions and/or to Adhesion on Wet Surfaces and/or to Rolling Resistance. New York: United Nations. February.
Woodrooffe, J.F., O. Page, D. Blower, and P.E. Green. 2008. Commercial Medium Tire Debris Study. Report No. UMTRI-2008-34. Washington, DC: NHTSA.
Woodrooffe, J. 2014. “Reducing Truck Fuel Use and Emissions: Tires, Aerodynamics, Engine Efficiency, and Size and Weight Regulations.” Ann Arbor: University of Michigan Transportation Research Institute. http://hdl.handle.net/2027.42/109749 (accessed December 19, 2019).
Zukouski, R. (Navistar). 2015. Navistar SuperTruck—Development and Demonstration of a Fuel-Efficient Class 8 Tractor & Trailer Vehicle. DOE Contract DE-EE0003303. June.


