
6
Projected Benefits of Technologies on Fuel Consumption
The projected CO2 and fuel consumption benefits of technologies were analyzed in two steps:
- The benefits of engine (and natural gas) technology were studied via simulation in the absence of vehicle technology improvements, using a baseline approximately 2016 vehicle.
- Next the advanced engines were coupled with advanced vehicle characteristics (aero, mass, and tires) for simulation to estimate a best achievable CO2 and fuel consumption.
6.1 IMPACT OF ENGINE TECHNOLOGIES ON VEHICLE FUEL CONSUMPTION
Engine technologies and fuels are described in some detail in other sections of this report. The committee made projections of the likely achievable efficiencies of several classes of engine (additional discussion in Chapter 4) and contracted with Southwest Research Institute (SwRI) to construct performance maps of these plausible engines. The maps were then used in vehicle simulations to estimate the whole vehicle fuel consumption and CO2 emissions compared to baseline engines for each vehicle category. The analysis process and the complete results, including sample engine maps, are provided in Appendix D.
The simulations included the following vehicle-engine combinations which are detailed in Table 6-1. Multiple drive cycles were used in the simulations, including several similar to the Environmental Protection Agency (EPA) and National Highway Traffic Safety Administration (NHTSA) cycles used in the Phase I rule. For the Phase II rule, EPA and NHTSA modified their 55 and 65 mph steady cruise cycles to include a variable grade ± 2 percent.
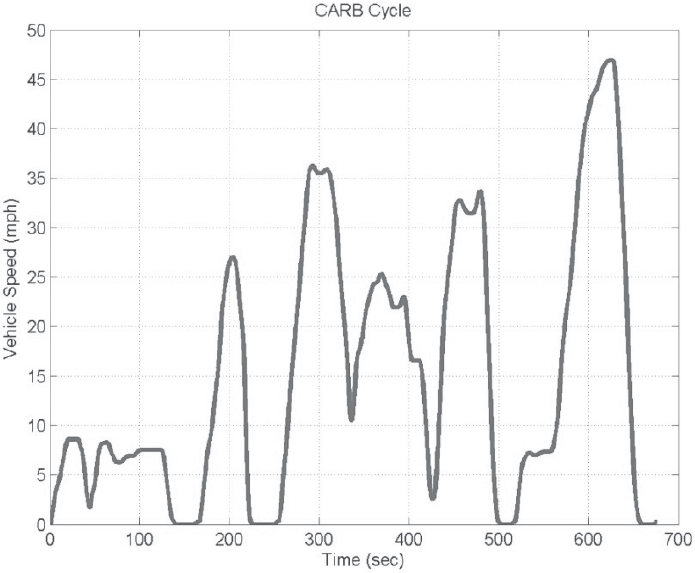
In the vehicle simulation analyses conducted by SwRI for this committee, only the Northeast States Center for a Clean Air Future cycle includes grade. Descriptions of the drive cycles can be found in the NHTSA report DOT HS 812 146 (Reinhart, 2015) and in Appendix D of the present report. As an example, the so-called California Air Resources Board (CARB) cycle is shown in Figure 6-1, which is one of the Greenhouse Gas Emissions Model (GEM) cycles used in certification. The CARB cycle was used for all vehicles except the pickup truck.
Fuel energy consumption and CO2 emissions are shown for the selected classes of vehicles in the various figures below. Each vehicle-engine combination was simulated at three weights, including two typical payloads
SOURCE: Reinhart (2015).
and a zero-payload case. Fuel energy consumption and CO2 emissions are calculated for the selected classes of vehicles in Table 6-1 as follows.
6.1.1 References to Vehicle and Engine Fuel Consumption and CO2 Targets from the EPA-NHTSA Phase I Rules and Phase II Rules for 2027
The analytical results in this section can be placed in context by approximate comparison to the fuel consumption and CO2 standards of the Phase I Rule (EPA and NHTSA, 2011) and the Phase II Rule (EPA and NHTSA, 2016c), released in August 2016. More complete discussion of the Phase II rules can be found in the EPA and NHTSA report (2016a). The change between 2017 and 2027 is of interest to compare to the findings of the SwRI analysis for the committee.
For combination trucks, the current standards are shown below in Table 6-2 and the Phase II standards are copied here from the Final Rule document as Table 6-3.
As a reference point, the difference between 2027 and 2017 CO2 standards for the Class 8 sleeper cab (high roof) is a 10.7 percent reduction in CO2. The 2027 standard reflects a 27 percent reduction compared to the baseline vehicle (87.8 g CO2/mile) in the GEM simulation (Table 6-4).
The 2027 standards for the vocational vehicles1 are provided in Table 6-5 for CO2, followed by the NHTSA fuel consumption standards in Table 6-6.
The baseline vocational vehicle performance defined in the Phase II rule is provided below in Table 6-7 for compression-ignition engines and in Table 6-8 for spark-ignition engines.
___________________
1 The term vocational vehicle “includes any vehicle that is equipped for a particular industry, trade or occupation such as construction, heavy hauling, mining, logging, oil fields, refuse and includes vehicles such as school buses, motorcoaches and RVs.” See Code of Federal Regulations, Title 49, Section 523.2.
TABLE 6-1 Vehicle Engine Combinations, Class, and Simulation Specifications for Committee-Commissioned SwRI Study
| Vehicle-Engine Combinations and Class | Simulation Specifications |
|---|---|
T700 Tractor-Trailer (Class 8)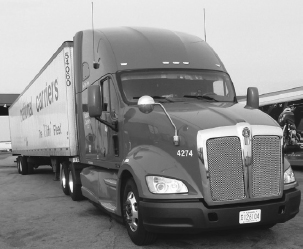 |
|
Kenworth T270 Box Truck (Class 6)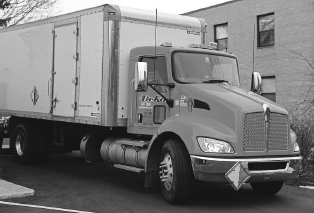 |
|
Ford F-650 Tow Truck (Class 5)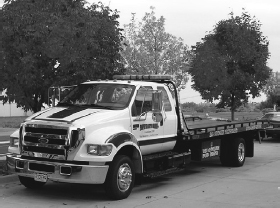 |
|
Ram 2500 Pickup Truck (Class 2b)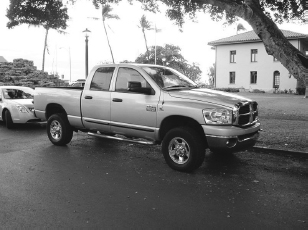 |
|
TABLE 6-2 Phase I Standards for Combination Trucks
| Category | EPA CO2 Emissions g/ton-mile | NHTSA Fuel Consumption gal/1,000 ton-mile | ||||
|---|---|---|---|---|---|---|
| Low Roof | Mid Roof | High Roof | Low Roof | Mid Roof | High Roof | |
| Day cab Class 7 | 104 | 115 | 120 | 10.2 | 11.3 | 11.8 |
| Day cab Class 8 | 80 | 86 | 89 | 7.8 | 8.4 | 8.7 |
| Sleeper cab Class 8 | 66 | 73 | 72 | 6.5 | 7.2 | 7.1 |
SOURCE: EPA and NHTSA (2011).
TABLE 6-3 Phase II Standards through 2027
| Day Cab | Sleeper Cab | Heavy-Haul | ||
|---|---|---|---|---|
| Class 7 | Class 8 | Class 8 | Class 8 | |
| 2021 Model Year CO2 Grams per Ton-Mile | ||||
| Low roof | 105.5 | 80.5 | 72.3 | 52.4 |
| Mid roof | 113.2 | 85.4 | 78 | |
| High roof | 113.5 | 85.6 | 75.7 | |
| 2021 Model Year Gallons of Fuel per 1,000 Ton-Mile | ||||
| Day Cab | Sleeper Cab | Heavy-Haul | ||
| Class 7 | Class 8 | Class 8 | Class 8 | |
| Low roof | 10.36346 | 7.90766 | 7.10216 | 5.14735 |
| Mid roof | 11.11984 | 8.389 | 7.66208 | |
| High roof | 11.14931 | 8.40864 | 7.43615 | |
| 2024 Model Year CO2 Grams per Ton-Mile | ||||
| Day Cab | Sleeper Cab | Heavy-Haul | ||
| Class 7 | Class 8 | Class 8 | Class 8 | |
| Low roof | 99.8 | 76.2 | 68 | 50.2 |
| Mid roof | 107.1 | 80.9 | 73.5 | |
| High roof | 106.6 | 80.4 | 70.7 | |
| 2024 Model Year and Later Gallons of Fuel per 1,000 Ton-Mile | ||||
| Day Cab | Sleeper Cab | Heavy-Haul | ||
| Class 7 | Class 8 | Class 8 | Class 8 | |
| Low roof | 9.80354 | 7.48527 | 6.67976 | 4.93124 |
| Mid roof | 10.52063 | 7.94695 | 7.22004 | |
| High roof | 10.47151 | 7.89784 | 6.94499 | |
| 2027 Model Year CO2 Grams per Ton-Mile | ||||
| Day Cab | Sleeper Cab | Heavy-Haul | ||
| Class 7 | Class 8 | Class 8 | Class 8 | |
| Low roof | 96.2 | 73.4 | 64.1 | 48.3 |
| Mid roof | 103.4 | 78 | 69.6 | |
| High roof | 100 | 75.7 | 64.3 | |
| 2027 Model Year and Later Gallons of Fuel per 1,000 Ton-Mile | ||||
| Day Cab | Sleeper Cab | Heavy-Haul | ||
| Class 7 | Class 8 | Class 8 | Class 8 | |
| Low roof | 9.4499 | 7.21022 | 6.29666 | 4.7446 |
| Mid roof | 10.15717 | 7.66208 | 6.83694 | |
| High roof | 9.82318 | 7.43615 | 6.31631 | |
SOURCE: EPA and NHTSA (2016c).
TABLE 6-4 Class 7 and 8 Tractor 2017 Baseline Vehicle CO2 Emissions and Fuel Consumption in the Phase II Standards
| Class 7 | Class 8 | ||||||||
|---|---|---|---|---|---|---|---|---|---|
| Day Cab | Day Cab | Sleeper | |||||||
| Low Roof | Mid Roof | High Roof | Low Roof | Mid Roof | High Roof | Low Roof | Mid Roof | High Roof | |
| CO2 (g/ton-mile) | 119.1 | 127.2 | 129.7 | 91.3 | 96.6 | 98.2 | 84 | 90.2 | 87.8 |
| Fuel Consumption (gal/1000 ton-mile) | 11.69941 | 12.49509 | 12.74067 | 9.96587 | 9.48919 | 9.64637 | 8.25147 | 8.86051 | 8.62475 |
SOURCE: EPA and NHTSA (2016a).
TABLE 6-5 EPA CO2 Standards for Model Year (MY) 2027 Class 2b through 8 Vocational Vehicles
| EPA Standard for Vehicle with Compression-Ignition (CI) Engine Effective MY 2027 (g CO2/ton-mile) | |||
|---|---|---|---|
| Duty cycle | Light Heavy-Duty Class 2b-5 | Medium Heavy-Duty Class 6-7 | Heavy Heavy-Duty Class 8 |
| Urban | 367 | 258 | 269 |
| Multipurpose | 330 | 235 | 230 |
| Regional | 291 | 218 | 189 |
| EPA standard for Vehicle with Spark-Ignition (SI) Engine Effective MY 2027 (g CO2/ton-mile) | |||
| Duty cycle | Light Heavy-Duty Class 2b-5 | Medium Heavy-Duty Class 6-7 | |
| Urban | 413 | 297 | |
| Multipurpose | 372 | 268 | |
| Regional | 319 | 247 | |
SOURCE: EPA and NHTSA (2016a).
TABLE 6-6 NHTSA Fuel Consumption Standards for MY 2027 Class 2b through 8 Vocational Vehicles
| NHTSA Standard for Vehicle with CI Engine Effective MY 2027 (fuel consumption gallon per 1,000 ton-mile) | |||
|---|---|---|---|
| Duty cycle | Light Heavy-Duty Class 2b-5 | Medium Heavy-Duty Class 6-7 | Heavy Heavy-Duty Class 8 |
| Urban | 36.0511 | 25.3438 | 26.4244 |
| Multipurpose | 32.4165 | 23.0845 | 22.5933 |
| Regional | 28.5855 | 21.4145 | 18.5658 |
| NHTSA Standard for Vehicle with SI Engine Effective MY 2027 (fuel consumption gallon per 1,000 ton-mile) | |||
| Duty cycle | Light Heavy-Duty Class 2b-5 | Medium Heavy-Duty Class 6-7 (and Class 8 Gasoline) | |
| Urban | 46.4724 | 33.4196 | |
| Multipurpose | 41.8589 | 30.1564 | |
| Regional | 35.8951 | 27.7934 | |
SOURCE: EPA and NHTSA (2016a).
TABLE 6-7 Baseline Vocational Vehicle Performance with CI Engines in the Phase II Standards
| Baseline Emissions Performance in g CO2/ton-mile | |||
|---|---|---|---|
| Duty cycle | Light Heavy-Duty Class 2b-5 | Medium Heavy-Duty Class 6-7 | Heavy Heavy-Duty Class 8 |
| Urban | 482 | 332 | 338 |
| Multipurpose | 420 | 294 | 287 |
| Regional | 334 | 249 | 220 |
| Baseline Fuel Efficiency Performance in gallon per 1,000 ton-mile | |||
| Duty cycle | Light Heavy-Duty Class 2b-5 | Medium Heavy-Duty Class 6-7 | Heavy Heavy-Duty Class 8 |
| Urban | 47.3477 | 32.6130 | 33.2024 |
| Multipurpose | 41.2574 | 28.8802 | 28.1925 |
| Regional | 32.8094 | 24.4597 | 21.6110 |
SOURCE: EPA and NHTSA (2016c, p. 73,706).
TABLE 6-8 Baseline Vocational Vehicle Performance with SI Engines in the Phase II Standards
| Baseline Emissions Performance in g CO2/ton-mile | ||
|---|---|---|
| Duty cycle | Light Heavy-Duty Class 2b-5 | Medium Heavy-Duty Class 6-7 (and Class 8 Gasoline)a |
| Urban | 502 | 354 |
| Multipurpose | 441 | 314 |
| Regional | 357 | 275 |
| Baseline Fuel Efficiency Performance in gallon per 1,000 ton-mile | ||
| Duty cycle | Light Heavy-Duty Class 2b-5 | Medium Heavy-Duty Class 6-7 |
| Urban | 56.4870 | 39.8335 |
| Multipurpose | 49.6230 | 35.3325 |
| Regional | 40.1710 | 30.9441 |
aVocational vehicles with gross vehicle weight rating (GVWR) over 33,000 pounds powered by alternate fueled engines must certify to the vehicle standard corresponding with the applicable engine standard.
SOURCE: EPA and NHTSA (2016c, p. 73,707).
6.1.2 Description of Vehicles Simulated and Results
The committee’s work included simulations of four vehicle types from the lightest vehicles covered in the Phase II rule, Class 2b, up to the largest, Class 8. Specifically, these vehicles included a Dodge Ram 2500/3500 pickup truck (Class 2b/3), a Ford F-650 tow truck (Class 5), a Kenworth T270 box delivery truck (Class 6), and a Kenworth T700 long-haul tractor-trailer truck (Class 8). The results of the simulation provide estimates both of vehicle fuel consumption—gallons consumed and fuel mass consumed—and of greenhouse gas (GHG) emissions. (See Appendix D for additional description.) The results also included GHG emissions. The following four subsections discuss the results of these simulations in different drive cycles (described in Appendix D) for the four vehicles noted above, each with a variety of engines.
6.1.2.1 Class 8 Tractor Trailer
The vehicle characteristics for the simulations performed by SwRI for the committee are summarized below in Tables 6-9 and 6-10, and also see the NHTSA study report (Reinhart, 2015) for additional details.
The derivation of advanced engine features and maps is summarized in Table 6-11.
The vehicle simulation results for the baseline CO2 and fuel consumption performance for the T700, over the CARB cycle, are shown below in Table 6-12.
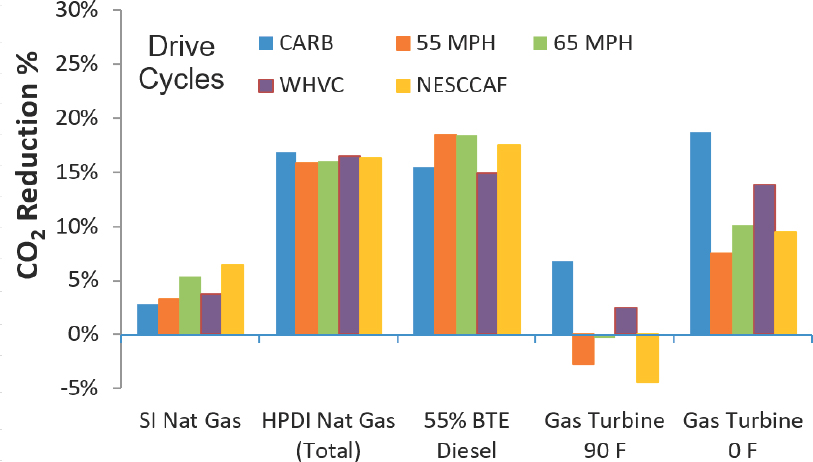
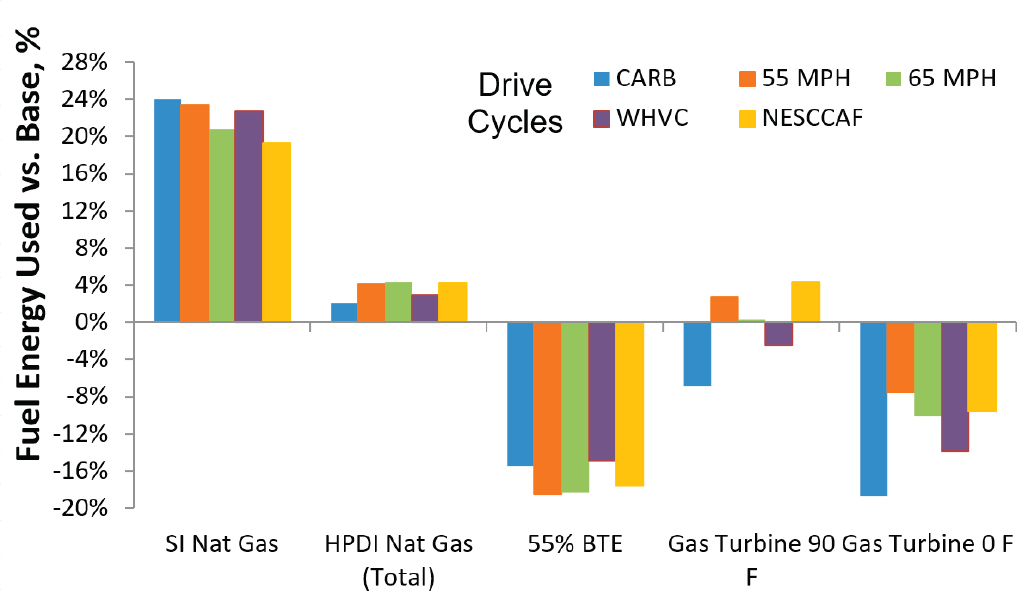
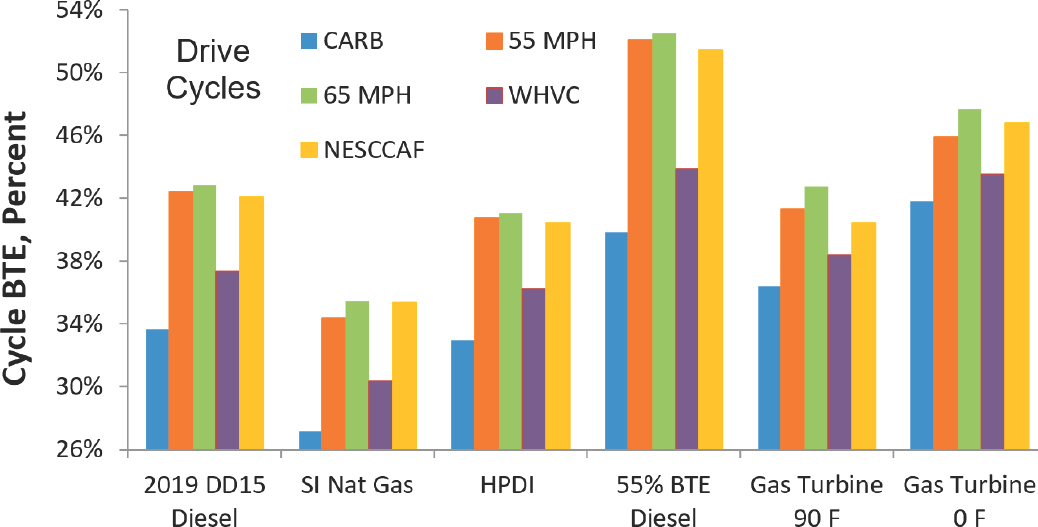
For the Class 8 T700 vehicle, compared to a 2019 baseline diesel engine, the 55 percent peak diesel and natural gas engines all show a reduction in CO2 emissions compared to a diesel baseline (Figure 6-2), but the relative inefficiency of both natural gas options compared to the simulated advanced 55 percent diesel is evident in Figure 6-3. The gas turbine engine, which generally exhibits inherently low NOx emissions, was included here in consideration of a future reduction in NOx emissions standards. As explained in Chapter 4, in the section “Alternative Configuration Engines,” this type of engine has a relatively high sensitivity to ambient temperature. The projected peak efficiency was just under 50 percent at 59 degrees Fahrenheit (°F). Results are shown at 50 percent payload for this vehicle. The sensitivity of fuel consumption to weight is provided later in this section.
For completeness, the committee refers to a study published by Carder (2014)—issued after its own first report of NRC Phase Two (NRC, 2014)—where comparisons were made in full vehicle dynamometer tests between diesel (2011 model), HPDI, and SI natural gas (NG) engines in several types of vehicles. For goods movement vehicles, they found the CO2 emissions and global warming potential emissions for the natural gas engines to be about 10 percent lower than the 2011 diesel engine with selective catalytic reduction.
For this vehicle, the drive cycle does not significantly impact the overall trends. The benefits of a low-carbon fuel are very evident for CO2 emissions, with the caveat that well-to-tank emissions of methane are not found to offset this tailpipe benefit (see Section 4.9.5.1 of this report). At low ambient temperatures, the simulated gas turbine is projected to have advantage over the baseline diesel, but not so much compared to other advanced engines. For full consistent comparison, one would need to have a diesel engine map for an engine with emission controls for much lower NOx output.
TABLE 6-9 Kenworth T700 Vehicle Characteristics Used for This Simulation
| Parameter | Value |
|---|---|
| Aerodynamic drag (Cd) with trailer | 0.639 |
| CdA | 6.841 m2 |
| Tire rolling resistance (Crr) | 0.005608 (average all axles) |
| Transmission | 10 speed AMT |
| Base accessory power demand | 6650 W |
| Mass | see Table 6-10 below |
NOTE: A, effective frontal area of vehicle; AMT, automated mechanical transmission; W, watts.
TABLE 6-10 Mass and Payload Characteristics of Class 8 Vehicle Used in the Simulation
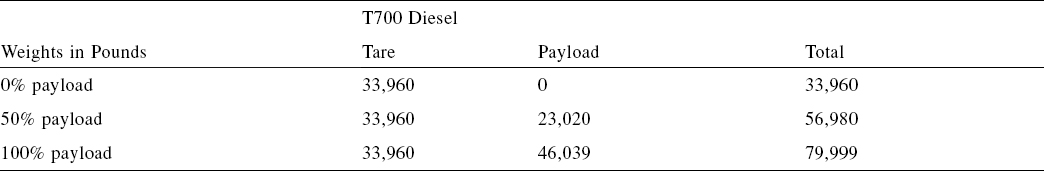
NOTE: In comparing the simulation results in this report to the Phase I or II standards and GEM simulation, note that the payload used by NHTSA and EPA is higher than 50 percent used here.
SOURCE: Reinhart (2015).
TABLE 6-11 Technologies Used for the Class 8 Tractor-Trailer Simulation
| Technology | Hardware Content | Comments |
|---|---|---|
| 2019 baseline DD15 | Based on the 2013 production DD15 without turbocompound and with an asymmetric turbo. Includes reduced combustion duration. | Complies with the 2017-2019 GHG requirement, but with no margin |
| 15 liter SI natural gas | A stoichiometric spark-ignited natural gas variant of a 15 liter diesel, with performance and efficiency characteristics derived from experimental data in the smaller ISL-9G engine. Data from the 12 liter ISX-12G were not used, because of its lower BTE. | Represents the expected performance of a SI natural gas engine with EGR. Cummins was developing a version of their 15 liter engine along these lines, but it was put on hold when oil prices dropped. |
| HPDI diesel pilot ignited natural gas engine | Experimentally derived fuel map from the 2010 Westport HPDI engine, which is based on the Cummins ISX 15 liter diesel. This is a lean-burn, diesel pilot ignited natural gas engine. | Reflects 2010 level performance. Could be improved with additional development, but Westport has dropped the HPDI product line because of limited sales volume. |
| 55% BTE diesel | Based on technology combination 3f from Reinhart (2015). Includes down-speeding, a partial friction mean effective pressure (FMEP) reduction, and waste-heat recovery. This map was then scaled to achieve a peak BTE of 55%. | Represents a very high efficiency potential future diesel powertrain. The shape of the fuel map is speculative, because the technologies required to achieve it are not defined. |
| Gas turbine | Based on an efficiency map provided by Brayton Energy. | Represents a very high efficiency potential future gas turbine powertrain. Requires a 50:1 speed reduction geartrain ahead of the conventional truck transmission. |
SOURCE: Reinhart (2015).
TABLE 6-12 T700 Baseline CARB Drive Cycle CO2 and Fuel Consumption
| Payload | g CO2/ton-mile | Fuel Consumption gallon/1,000 ton-mile |
|---|---|---|
| 50%, 23,020 lbs | 189.2 | 18.6 |
| 100%, 46,039 lbs | 116.2 | 11.4 |
SOURCE: Reinhart (2015).
As a reference point, the difference between 2027 and 2017 CO2 standards for the Class 8 sleeper cab (high roof) is a 10.7 percent reduction in CO2. The 2027 standard reflects a 27 percent reduction compared to the baseline vehicle (87.8 g CO2/mile) in the GEM simulation.
It is evident that, if realized commercially, the 55 percent diesel would produce reductions well toward this CO2 reduction, even without improvements in other parts of the vehicle. For general comparisons, a 50 percent peak efficiency diesel engine would have proportionally lesser improvement. These results, along with the strong progress in diesel engines described in Chapter 4, warrant continued development in this class of engine.
The overall impacts of integrating an advanced engine in vehicles featuring anticipated reductions in mass, aerodynamic drag, and rolling resistance are described later in this chapter.
Finding: Highly developed advanced diesel engines appear capable of achieving 15 to 17 percent reduction in CO2 emissions compared to the 2019 state of technology diesels in base vehicles. Achieving this level of reduction with natural gas engines would require considerable improvement in their efficiency, such as with HPDI technology. The impacts of unconventional engines such as gas turbines are inconclusive at this time.
Finding: The effect of improved diesel engines on CO2 and fuel consumption is significant and warrants continued development of this family of power plant.
Recommendation 6-1: The Class 8 CO2 and fuel consumption standard in the Phase II rule should be revisited in a mid-phase review because the engine, vehicle, and fuel technologies appear to be capable of greater reductions than the standards taking effect in 2027.
6.1.2.2 Class 6 Delivery Truck
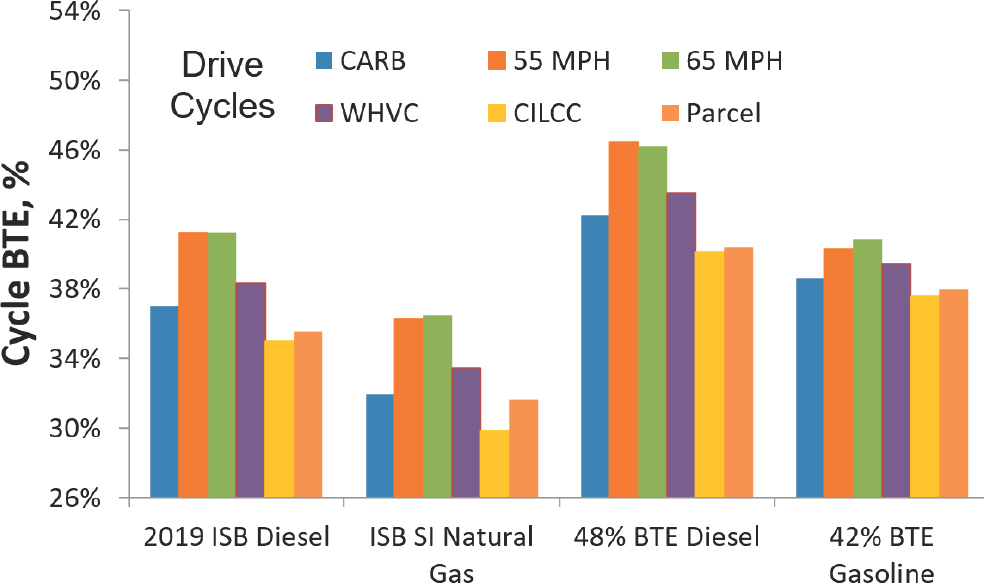
For this vehicle, an advanced medium-duty diesel without waste-heat recovery is compared to natural gas and an advanced turbocharged gasoline SI engine. The baseline is a simulated 2019 ISB 6.7 liter diesel engine. The vehicle characteristics are shown in Tables 6-13 and 6-14. Medium-duty engine technologies are shown in Table 6-15.
More detail on the vehicle and engine configurations that were simulated is available in DOT HS 812 146 (Reinhart, 2015).
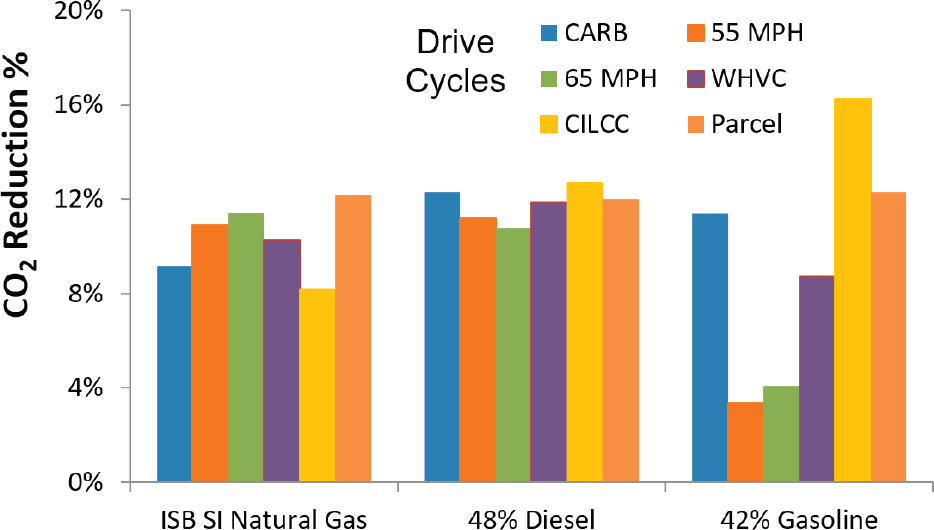
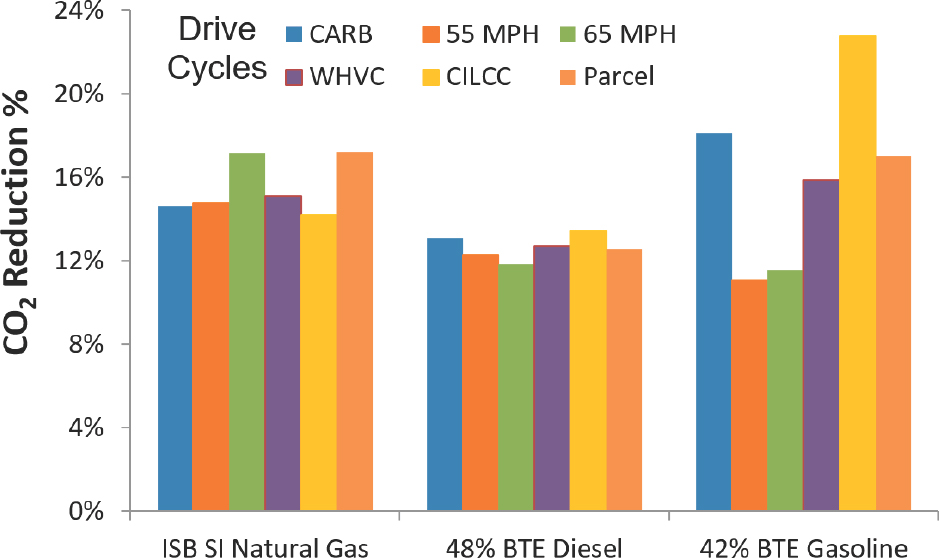
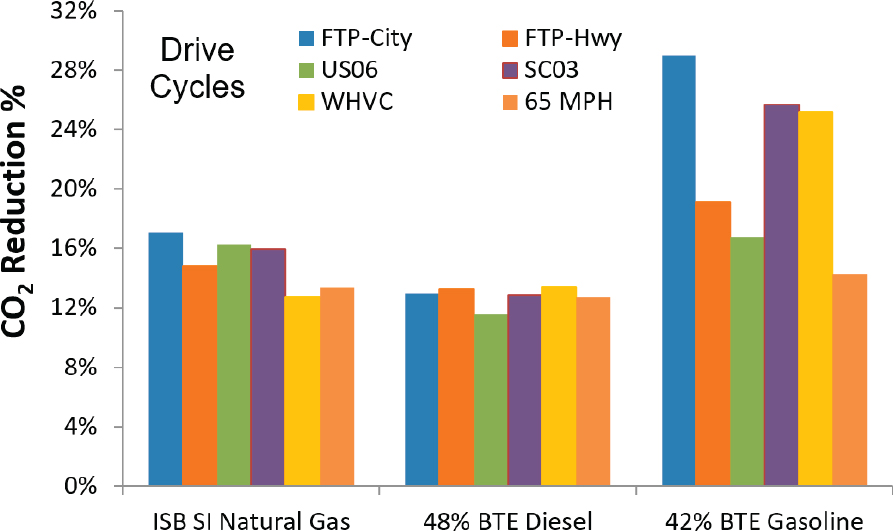
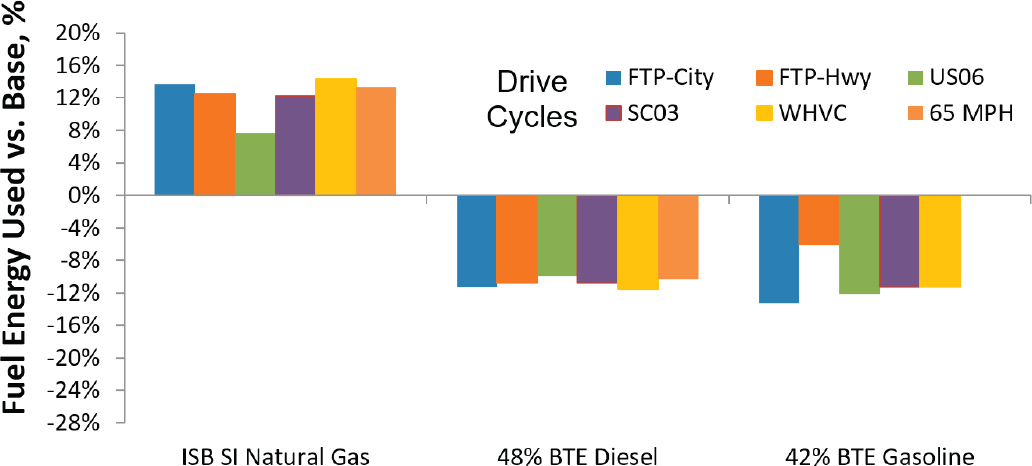
The baseline T270 vehicle with the 2019 diesel engine showed the following results in CO2 and fuel consumption in the SwRI simulation (Table 6-16). Figure 6-4 illustrates the simulated emissions for advanced powertrains in the T270 vehicle. The low-carbon benefits of natural gas are seen again even though the modeled engine is less efficient than the others in this group (i.e., greater fuel energy used; see Figure 6-5). The advanced SI engine with gasoline fuel shows comparable CO2 reduction to the advanced diesel over some drive cycles, and roughly 8 percent reduction compared to a 2019 baseline diesel that complies with prevailing standards with a small margin. As described in the discussion on engines (see the section “Compression-Ignition-Dominated Engines” in Chapter 4), the cost of the emissions control in an SI engine is likely to be less than the diesel, suggesting a possible shift in market preference. In the committee’s simulation, this gasoline engine vehicle has a CO2 output
TABLE 6-13 Characteristics of T270 Box Truck (Class 6)
| T270 | |
|---|---|
| Engine | 6.7 liter I-6 diesel |
| Transmission | Allison 2000 torque converter automatic with lockup |
| Mechanical Accessory Power | 5,750 W |
| Cd | 0.514 |
| CdA | 5.033 m2 |
| Tire Rolling Coefficient | 0.010967 average |
| Mass l | See Table 6-14 |
SOURCE: Reinhart (2015).
TABLE 6-14 Mass Characteristics of T270 Box Truck (Class 6) Payload
| Weights in Pounds | T700 Diesel | T270 Gasoline | ||||
|---|---|---|---|---|---|---|
| Tare | Payload | Total | Tare | Payload | Total | |
| 0% payload | 17,141 | 0 | 17,141 | 16,640 | 0 | 16,640 |
| 50% payload | 17,141 | 4,430 | 21,571 | 16,640 | 4,430 | 21,070 |
| 100% payload | 17,141 | 8,860 | 26,001 | 16,640 | 8,860 | 25,500 |
SOURCE: Reinhart (2015).
TABLE 6-15 Engine Technologies Used in Medium-Duty Trucks
| Technology | Hardware Content | Comments |
|---|---|---|
| 2019 baseline ISB diesel | Derived from the 2013 production engine, including a reduction in FMEP and a reduction in combustion duration. | Complies with 2017-2019 GHG requirements, but with little margin. |
| ISB SI natural gas | A stoichiometric SI natural gas variant of the ISB diesel, with performance and efficiency characteristics derived from experimental data in the larger ISL-9G engine. | Represents the expected performance of the natural gas version of the ISB expected in 2016 or 2017. |
| 48% BTE diesel | Created by taking the fuel map of the best medium-duty diesel from the NHTSA project, and scaling it so that the peak BTE reached 48%. This map is derived from Package 9, described in Reinhart (2015). | Represents a very high efficiency medium-duty diesel without waste-heat recovery. This engine has approximately the BTE of the SuperTruck program engines (not including WHR). |
| 42% BTE gasoline | Created by taking the fuel map of the most efficient 3.5 liter turbocharged engine from the NHTSA project (with EGR, variable valve actuation [VVA], and down-speeding), and scaling it so that peak BTE reached 42%. This map is derived from the 3.5 V-6 Package 17, described in Reinhart (2015). | Represents a very high efficiency gasoline engine. Achieving this level of efficiency would probably require full authority VVA/variable valve timing (VVT), and several other efficiency features in reduction of friction and heat losses. See Section 4.3. |
NOTE: These engines were used in the simulations of both the Class 6 delivery truck and the Class 5 tow truck.
of about 300 g/ton-mile in the 65 mph cycle at 100 percent payload (8,860 pounds).2 Perhaps owing to a difference in vehicle tare (i.e., empty) weight—16,640 pounds in the committee’s analysis versus 13,950 pounds3 in the Regulatory Impact Analysis (RIA) (Section 3.5.1)—this value is higher than the Phase I standard of 225 g CO2/ton-mile for SI-powered delivery trucks.
6.1.2.3 Ford F-650 Tow Truck (Class 5)
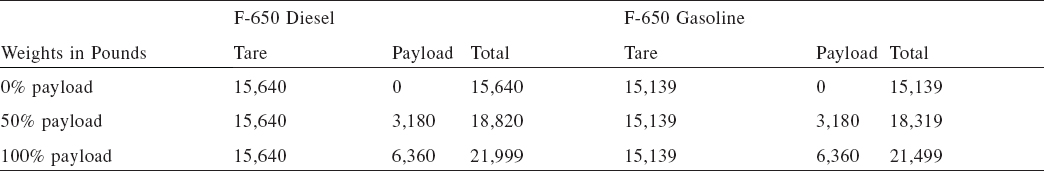
For this vehicle, an advanced medium-duty diesel without waste-heat recovery is compared to natural gas and an advanced turbocharged gasoline SI engine. The baseline is a simulated 2019 ISB 6.7 liter diesel engine. The vehicle characteristics are shown in Tables 6-17 and 6-18.
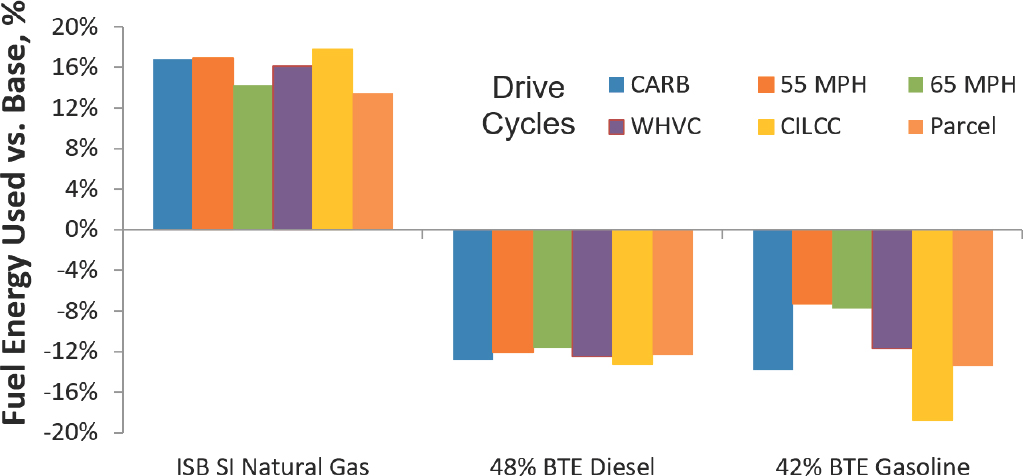
The comparison of fuel consumption at zero payload for the different engines simulated for this vehicle is shown in Figure 6-6. The most striking result again is how competitive the advanced gasoline SI engine is in emissions as compared to the baseline and advanced diesel on CO2 (see Figure 6-7). The primary reasons for this appear to be the following:
- The SI engine has a much smaller displacement than the base diesel and, hence, has lower weight. Since its maximum torque is lower, the transmission also weighs less than the baseline. In general, SI engines have lower peak cylinder pressures than CI engines, which can also be a factor in their structural robustness and weight.
- The SI engine has a broader speed range for reasonable level of torque delivery, making the transmission-engine speed matching more optimal (the diesel has a narrow usable speed range), and the component efficiencies slightly higher.
- The idle fuel consumption characteristics with automatic transmission tend to favor the SI engine.
___________________
2 The gross vehicle weight (GVW) is 25,500 pounds (Table 6-14).
3 Making the tare weight lower has the effect of “returning” weight to payload. This addition of weight to the payload results in a lower load-specific fuel consumption (LSFC). (When calculating LSFC the payload appears in the denominator.)
TABLE 6-16 Baseline T270 Box Truck (Class 6) Load-Specific CO2 and Fuel Consumption with 2019 Baseline Diesel
| Payload | g CO2/ton-mile | Fuel Consumption gallon/1,000 ton-mile |
|---|---|---|
| 50%, 4,430 lbs | 559 | 54.9 |
| 100%, 8,860 lbs | 315 | 30.9 |
In their modeling and analysis effort for NHTSA, SwRI (Reinhart, 2016) observed that a modern turbocharged SI engine approached or equaled the CO2 reduction levels of diesel engines in some duty cycles. The report further describes an economic comparison of diesel and SI engines considering the cost premium of the diesel initial purchase (approximately $10,000 in some cases) as well as the recent trends in higher diesel fuel prices than gasoline. As described in the discussion on engines (see the section “Compression-Ignition-Dominated Engines” in Chapter 4), the overall cost of purchase and operation of the emissions control in an SI engine is likely to be less than the diesel, suggesting a possible shift in market preference. These factors favor a shift toward SI engines in vocational vehicles, potentially in larger Class 7 sizes as long as the annual mileage does not place fuel consumption as the heavily dominant criterion. Further study of this type of engine in medium- and perhaps heavy-duty vehicles appears warranted to clarify or validate these apparent advantages (see also Recommendation 6-2).
Finding: For vocational vehicles, advanced diesel engines are forecast to achieve 12 percent CO2 reduction compared to the 2019 diesel baseline. Natural gas–powered engines in these vehicles were found to be of similar effectiveness according to the simulation results. In some duty cycles, advanced gasoline engines are on par with the simulated advanced diesels. These levels of reduction are comparable to the percent reductions for the entire vehicle for the proposed 2027 rules.
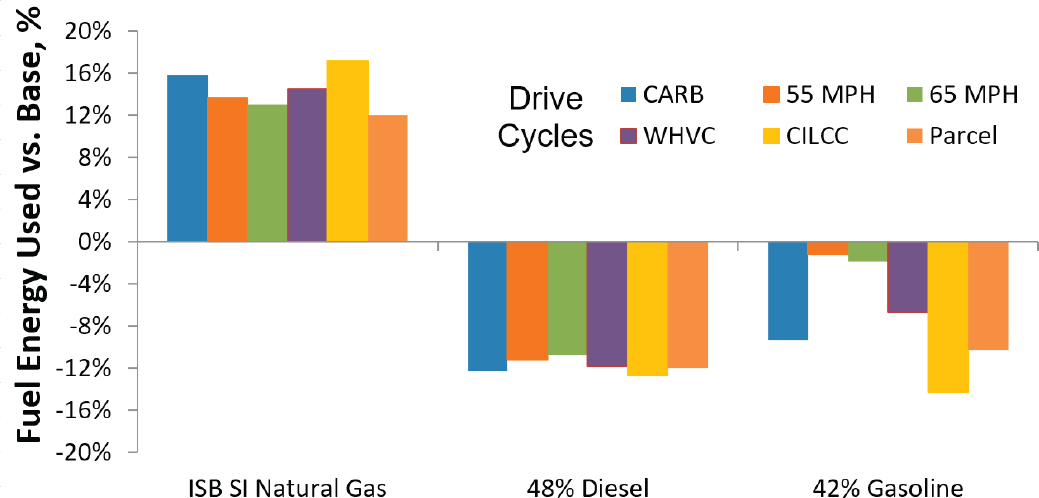
TABLE 6-17 Characteristics of F-650 Tow Truck (Class 5)
| F-650 | |
|---|---|
| Engine | 6.7 liter I-6 diesel |
| Transmission | TBD |
| Mechanical accessory power | 5750 W |
| Cd | 0.619 |
| CdA | 3.151 m2 |
| Tire rolling coefficient | 0.010068 average |
| Mass characteristics | See Table 6-18 |
SOURCE: Reinhart (2015).
Recommendation 6-2: Government and industry should continue the development of higher-efficiency SI gasoline and natural gas engines for vocational vehicles and should continue to ensure substantial CO2 and fuel consumption reductions are realized, because (1) higher efficiency appears feasible and (2) market forces may cause a shift toward the SI engines.
6.1.2.4 Class 2b Pickup Truck
The Class 2b and 3 pickups and vans use about 15 percent of the total fuel in the medium- and heavy-duty vehicle (MHDV) sector and include those vehicles of gross vehicle weight rating from 8,501 to 14,000 pounds that are not regulated under the light-duty vehicle regulations. The Class 2b pickup truck simulation was based on a Dodge Ram 2500, with the basic characteristics shown in Table 6-19 and mass payload characteristics shown in Table 6-20.
Additional details may be found in EPA and NHTSA (2016b). The sources of the engine maps used are shown in Table 6-21.
TABLE 6-19 Characteristics of Ram 2500 (Class 2b)
| T270 | |
|---|---|
| Engine | 6.7 liter I-6 diesel and 3.5 liter turbocharged SI gasoline |
| Transmission | 6-speed automatic, torque converter |
| Mechanical accessory power | 4450 W |
| Mass (curb weight) | 6,876 lbs diesel, 6,376 lbs gasoline |
| Gross Combined Weight (GCW) | 25,000 lbs |
| Cd | 0.400 |
| CdA | 1.505 m2 |
| Tire rolling coefficient | 0.0078 average |
| Mass characteristics | See Table 6-20 |
SOURCE: Reinhart (2015).
TABLE 6-20 Dodge Ram Class 2b Pickup Truck Mass Payload Characteristics
| Weights in Pounds | RAM diesel | RAM gasoline | ||||
|---|---|---|---|---|---|---|
| Tare | Payload | Total | Tare | Payload | Total | |
| 0% payload | 6,876 | 0 | 6,876 | 6,376 | 0 | 6,376 |
| ALVW | 6,876 | 1,562 | 8,438 | 6,376 | 1,562 | 7,938 |
| 100% GCW | 6,876 | 18,124 | 25,000 | 6,376 | 18,124 | 24,500 |
SOURCE: Reinhart (2015).
TABLE 6-21 Engines Used in the Simulation of the Dodge Ram 2500 Pickup
| Technology | Hardware Content | Comments |
|---|---|---|
| 2019 baseline ISB Diesel | Derived from the 2013 production engine, including a reduction in FMEP and a reduction in combustion duration | Complies with 2017-2019 GHG requirements, but with little margin |
| ISB SI natural gas | A stoichiometric SI natural gas variant of the ISB diesel, with performance and efficiency characteristics derived from experimental data taken using the larger ISL-9G engine | Represents the expected performance of the natural gas version of the ISB that is due to launch in 2016 or 2017. |
| 48% BTE diesel | Created by taking the fuel map of the best medium-duty diesel from the NHTSA project, and scaling it so that the peak BTE reached 48%. This map is derived from Package 14, described in Reinhart (2015) | Represents a very high efficiency future medium-duty diesel without WHR. This engine has approximately the BTE of the SuperTruck program engines (not including WHR) |
| 42% BTE gasoline | Created by taking the fuel map of the most efficient 3.5 liter turbocharged engine from the NHTSA project (with EGR, VVA, and down-speeding), and scaling it so that peak BTE reached 42%. This map is derived from the 3.5 V-6 Package 17, described in Reinhart (2015) | Represents a very high efficiency gasoline engine in the 2025 time frame. Achieving this level of efficiency would require full authority VVA/VVT, and improvements in all aspects of friction and air handling. |
SOURCE: Reinhart (2015).
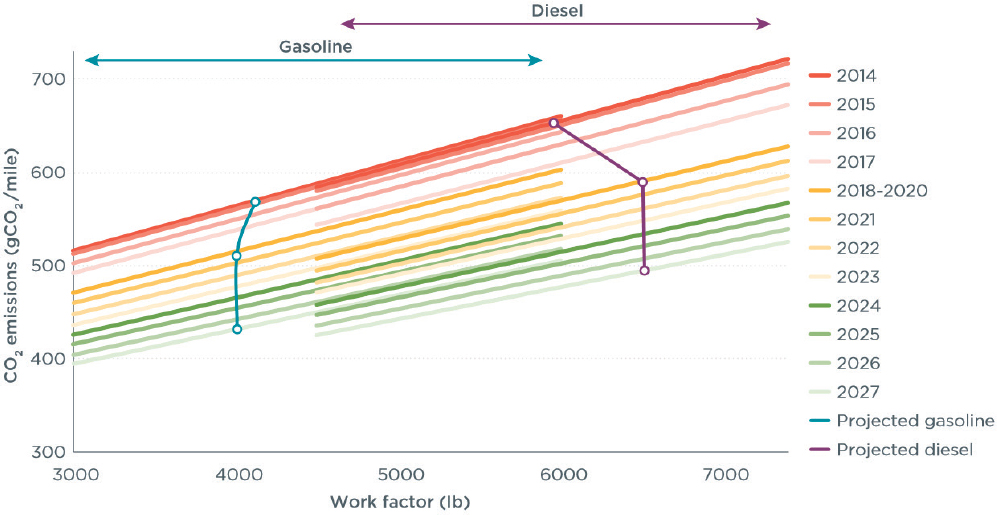
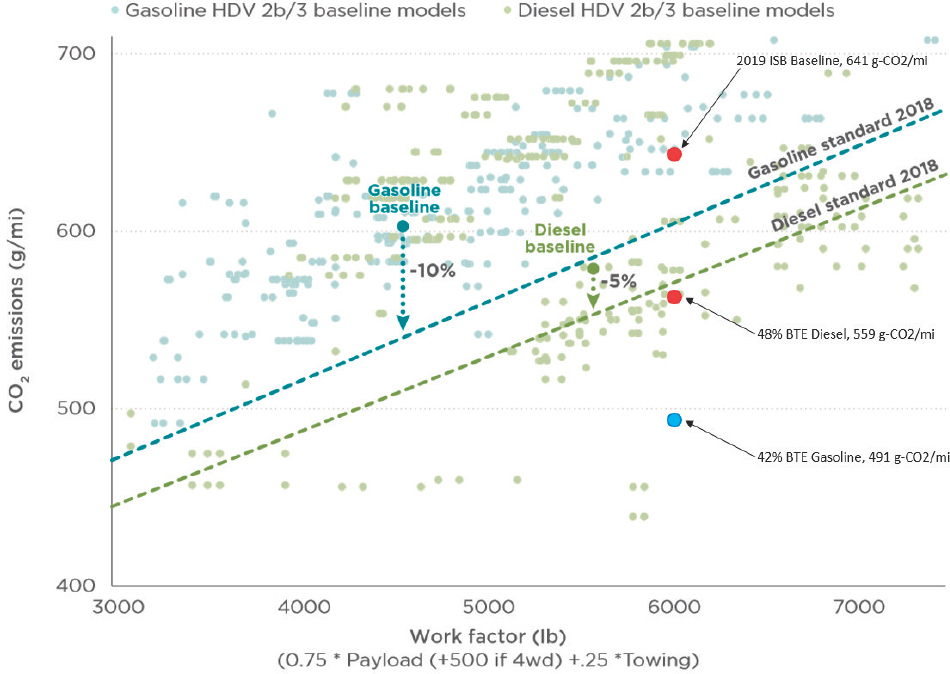
NHTSA and EPA have different standards for gasoline- and diesel-powered pickups and vans versus Class 4 and above, using a “work factor”4 instead of simple payload in standards (EPA RIA; Lutsey, 2015), as well as basing regulations on sales-weighted fuel consumption. This makes the analysis presented here, with a diesel baseline, somewhat less clear if attempting to make direct comparison to the regulations. The International Council on Clean Transportation (ICCT) added clarity to NHTSA and EPA’s rules with a chart (Figure 6-8) that gives a percentage improvement in gasoline- or diesel-powered vehicles in context with the proposed regulations.
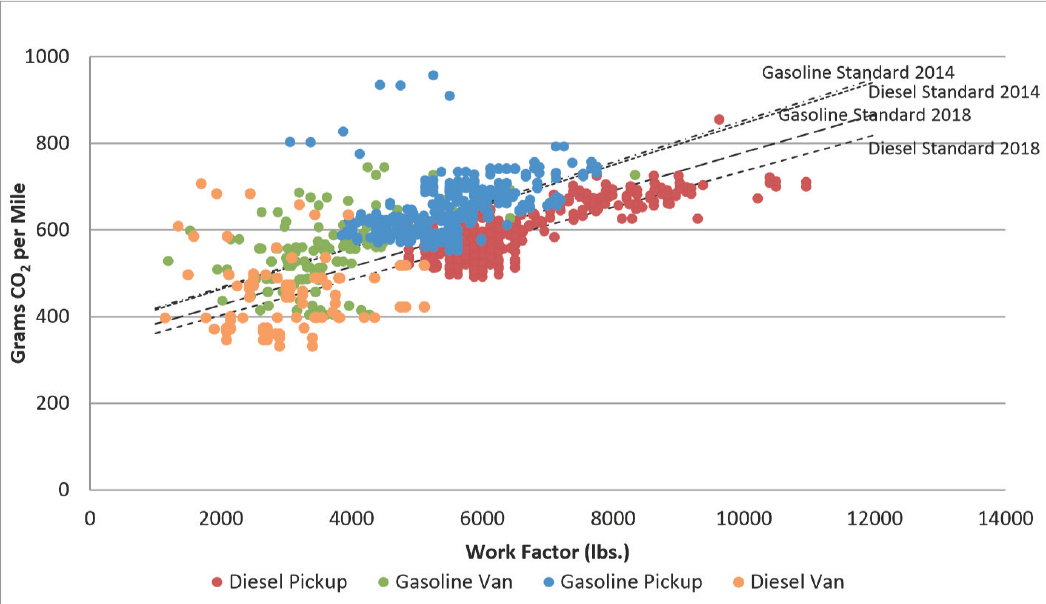
ICCT reports that NHTSA and EPA’s projected compliance would result in the gasoline and diesel heavy-duty pickup and van fleets each seeing a CO2 reduction of 24 percent from 2014 (the first year of standards) through 2027. Compared to the 2018-2020 standard, the reduction for Phase II would be 16 to 17 percent. The American Council for an Energy-Efficient Economy (Langer, 2015) prepared a current status of pickup and van CO2 emissions compared to the standards through 2018 shown in Figure 6-9. Even for the initial 2014 standards, gasoline-engine vehicles appeared challenged, which was echoed by the original equipment manufacturers (OEMs) in meetings with the committee.5 The debate about stringency of the pickup and van regulations was further highlighted by ICCT in their review of this specific class of vehicles (Lutsey, 2015), with questions of how much of the emerging light-duty (LD) vehicle technology for Corporate Average Fuel Economy 2025 standards would be applicable to HD pickups, and how much of that LD technology was already being used in the Class 2b and 3 vehicles.
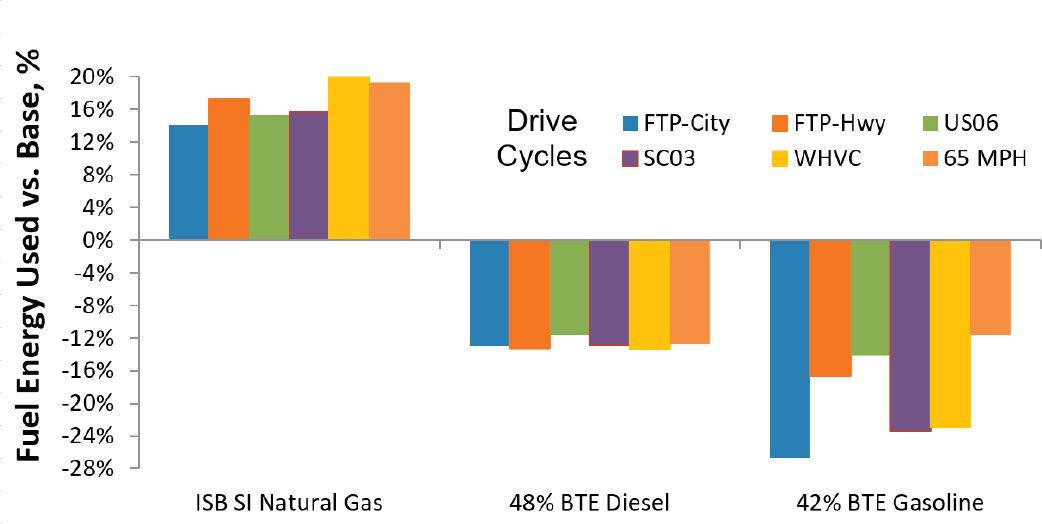
As with the other vehicles, the following figures show fuel energy use (Figure 6-10) and CO2 production (Figure 6-11) for the various engines compared to the baseline I-6 diesel engine.
At zero payload, all engines show a notable reduction in CO2 (Figure 6-10) and fuel consumption (Figure 6-11), with the advanced SI engine showing the greatest reductions. This again is due to the lighter weight of the SI engine plus transmissions, as well as torque-speed characteristics. In Figure 6-12, at gross combined weight both
___________________
4 EPA established CO2 standards in the form of a set of target standard curves, based on a “work factor” that combines a vehicle’s payload, towing capacity, and whether or not it has four-wheel drive (instead of a simple vehicle mass or gross vehicle weight rating [GVWR]):
Work Factor = [0.75 × (Payload Capacity + xwd)] + [0.25 × Towing Capacity]
Payload Capacity = GVWR (lb) – Curb Weight (lb)
Cross wheel drive (xwd) = 500 lb if the vehicle is equipped with four-wheel drive, otherwise equals 0 lb
Towing Capacity = GCWR (lb) – GVWR (lb)
5 Mark Allen and Barbara Kiss, GM, “GM Heavy-Duty Presentation,” presentation to the committee, Sacramento, California, July 31, 2013.
SOURCE: Lutsey (2015).
SOURCE: Langer (2015).
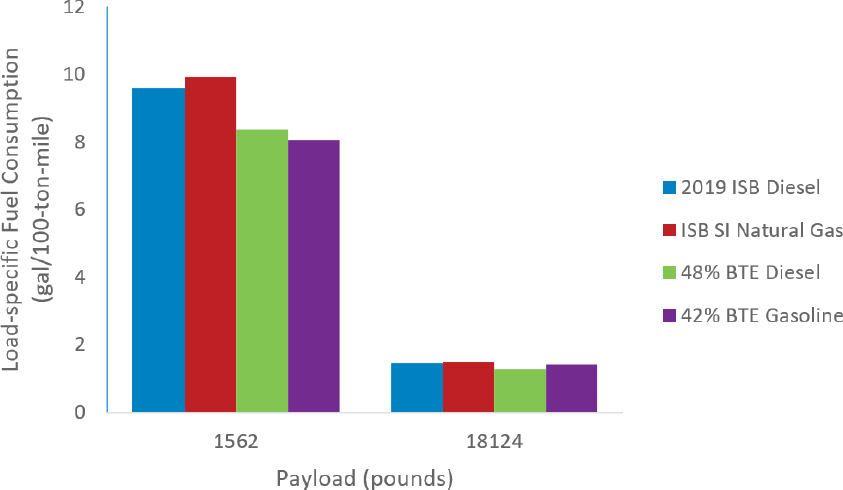
the advanced diesel and the high-efficiency SI engine show greater vehicle efficiency than the baseline diesel engine. The sensitivity of fuel consumption to payload in the Dodge Ram is illustrated in Figure 6-13 for different powertrains.
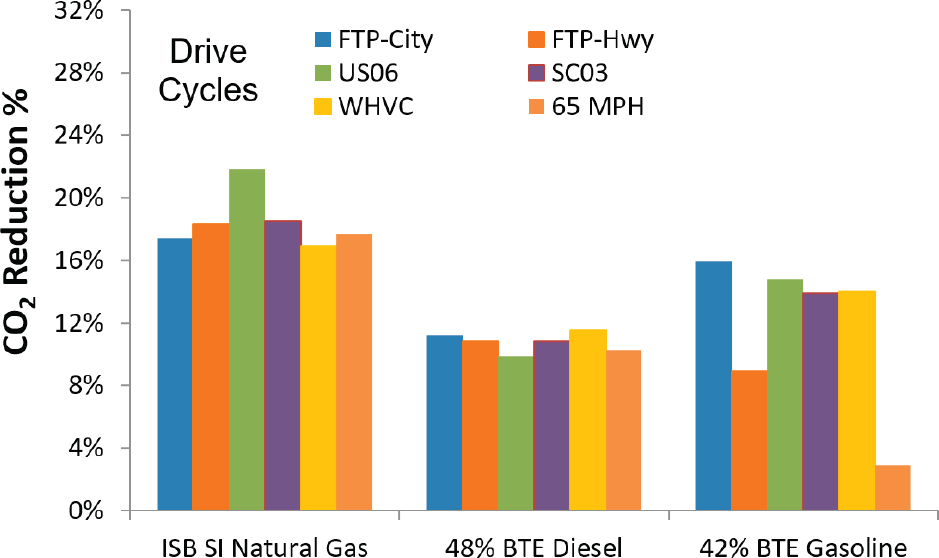
Shown in Figure 6-14, the CO2 reduction is greatest for the natural gas vehicle, although both the advanced SI and diesel engines show a 9 to 12 percent improvement relative to the baseline.
Just examining the diesel-powered Dodge Ram 2500 results, these simulations indicate that engine improvements alone would probably not achieve the approximately 17 percent CO2 reduction in the proposed rules for 2027. Significant vehicle-level improvements would appear necessary with even the stretch diesel (48 percent) engine, with the caveat that the cycles and weighting are not an exact comparison. This is discussed further below.
To facilitate comparisons at the vehicle level on an absolute CO2 emission basis, in Figure 6-15 the committee overlaid the simulated Dodge Ram 2500 with its advanced engines on the ICCT graph of CO2 versus work factor. The weighted-average city-highway cycle results were used for the committee-simulated Dodge Ram. The data points are from EPA certification data using 2010 as a baseline, as reported by ICCT.
In this comparison, only the advanced gasoline engine appears close to the CO2 levels in the Phase II proposal of 2015 (see Figure 6-8). This vehicle as simulated does not incorporate features such as stop-start. The efficiency characteristics of the advanced SI engine have been discussed also in Chapter 4 and in the section on vocational vehicles earlier in this chapter. Based on emerging experimental and modeling results, the expected future efficiency of SI engines appears well beyond the Phase II regulatory requirements depending on the extent that advanced technologies for passenger vehicle engines are adapted to MHDV gasoline engines. This adaptation is already in progress as noted in NHTSA and EPA’s review and response to docket comments (EPA and NHTSA, 2016b, p. 1327).
Finding: For large pickups, advanced diesel and SI engines may achieve a moderate 12 to 15 percent CO2 reduction compared to a baseline 2019 diesel at high payloads, with natural gas engines even more effective if their efficiency can be approved as noted. The values of CO2 per ton-mile of the advanced SI engine were on par with the advanced diesel in this analysis. When compared at lighter payloads and when using the work factor metric,
the advanced gasoline engine stands out at approximately 24 percent GHG reduction. However, engine improvements alone do not appear adequate for Class 2b and 3 pickups to meet 2027 requirements.
6.2 IMPACT OF MASS OR PAYLOAD ON FUEL CONSUMPTION BENEFITS OF DIFFERENT ENGINES
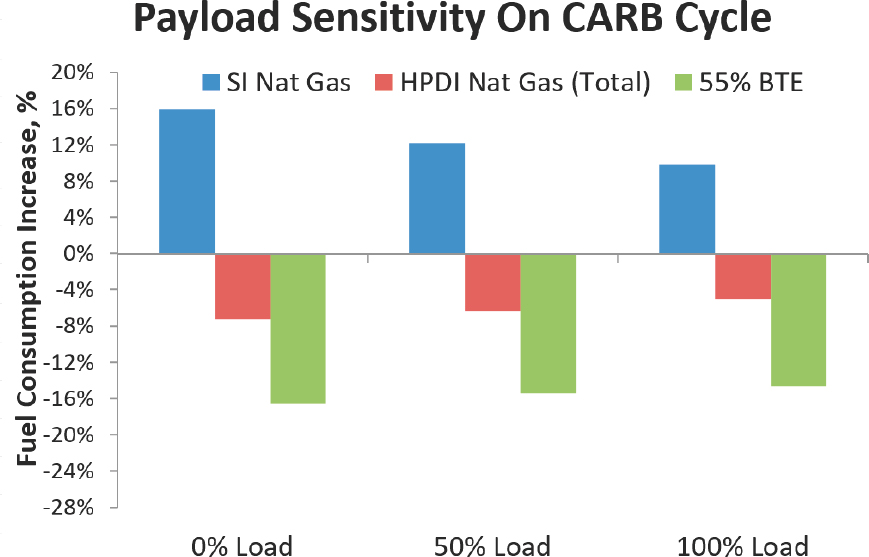
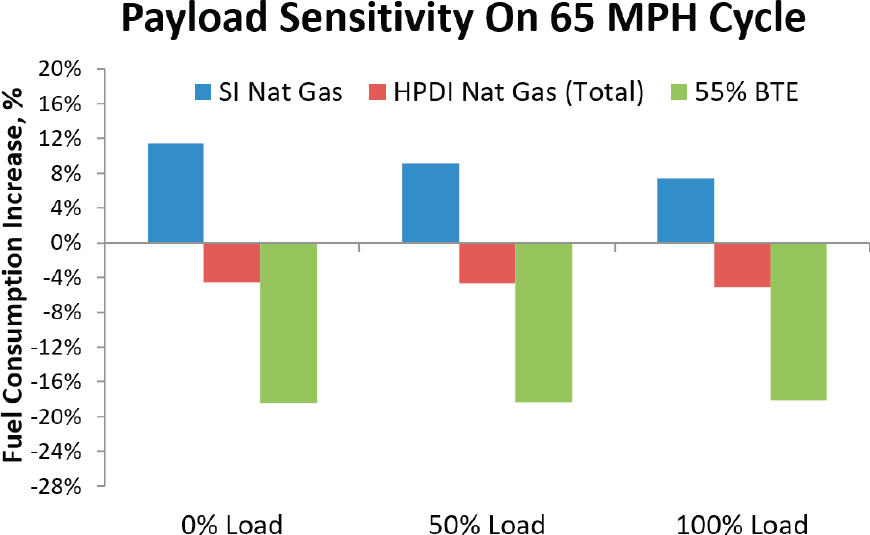
The impact of payload on the mass-specific fuel consumption was reviewed with an expectation that the SI engine vehicles might exhibit a distinctive loss of efficiency at lighter loads and low-speed drive cycles due to more use of throttling in those conditions. The reader may wish to revisit the discussion of mass reduction in Chapter 4. In Figures 6-16 and 6-17, the comparison of diesel and NG engines in the Class 8 truck shows the payload sensitivities are somewhat as expected—that the SI natural gas engine exhibits less efficiency at lighter loads on both transient and steady-speed drive cycles. The HPDI, on the other hand, behaves more like the advanced diesel with relative insensitivity to load.
The expectation might be that this characteristic of throttled versus unthrottled engines would hold true for most vehicle classes—that the SI engines sustain an efficiency penalty at lighter loads (we also note they may suffer efficiency loss at very high loads if fuel enrichment is required). Our analyses showed similarly higher sensitivity to payload in the SI NG engine in the T700, but the trend did not hold for the T270 truck where the advanced gasoline engine showed the least sensitivity to payload (Figure 6-18). This places importance in the regulatory process to select an appropriate payload (or multiple payloads, or even payload sensitivity/derivative) to capture real-world effects in the certification process. If all engines had relatively flat efficiency across many payloads, this would be a moot point.
6.3 DISCUSSION OF ENGINE EFFICIENCIES OVER DRIVE CYCLES
SwRI used their engine maps and vehicle simulations to calculate the cycle average engine efficiency, allowing an approximate comparison to the EPA/NHTSA engine standards for fuel consumption and GHG emissions. For general comparison, we provide here the Phase I and proposed Phase II standards for engine efficiency (Table 6-22). The comparisons are approximate, of course, for a number of reasons, such as test and drive cycles not being matched.
The engine results are presented in Figure 6-19 as BTE instead of CO2/hp-h to provide a clearer indication of the degree of engine technology stretch in this study, not confounded by fuel carbon content or less familiar CO2 values. This also facilitates comparison to aggressive research and development efforts such as in SuperTruck Phase II. The NHTSA/EPA proposed Phase II standards for engines called for a reduction in CO2 of about 4 percent between 2017 and 2027, and the final rule reduction is about 6 percent. If industry were to be successful with achieving near a 55 percent peak efficiency diesel engine—roughly the goal noted above for Phase II of Super-
TABLE 6-22 Comparison of Phase I and Phase II Engine Standards
| Vehicle Type | Engine Class | Standard (g CO2/bhp-h) | Percent CO2 Reduction | |||||
|---|---|---|---|---|---|---|---|---|
| Baseline (2010) | Phase I (2017) | Phase II (2027) | Phase I Only | Phase II Only | Phase I+II | |||
| Spark ignition | 660 | 627 | 627 | -5% | 0% | -5% | ||
| Compression ignition | Vocational | Light | 630 | 576 | 553 | -9% | -4% | -12% |
| Medium | 630 | 576 | 553 | -9% | -4% | -12% | ||
| Heavy | 584 | 555 | 533 | -5% | -4% | -9% | ||
| Tractor | Medium | 518 | 487 | 466 | -6% | -4% | -10% | |
| Heavy | 490 | 460 | 441 | -6% | -4% | -10% | ||
NOTE: Spark-ignited engines and compression-ignition vocational engines are tested under the heavy-duty Federal Test Procedure cycle while compression-ignition tractor engines are tested under the Supplemental Emissions Test.
SOURCE: Committee generated from EPA Engine Standards Data.
Truck—the potential improvement at the engine level appears to be roughly 17 percent beyond the 2019 baseline engine used in the present study. This finding is approximately echoed by Cummins (Eckerle, 2015), as well as ICCT (Lutsey, 2015). EPA’s CO2 standard for 2017 engines, converted to BTE, is about 41 percent and the 2027 standard (432 g/hp-h for heavy-heavy) is approximately 43.7 percent, somewhat short of the committee’s expected performance of a feasible diesel engine.
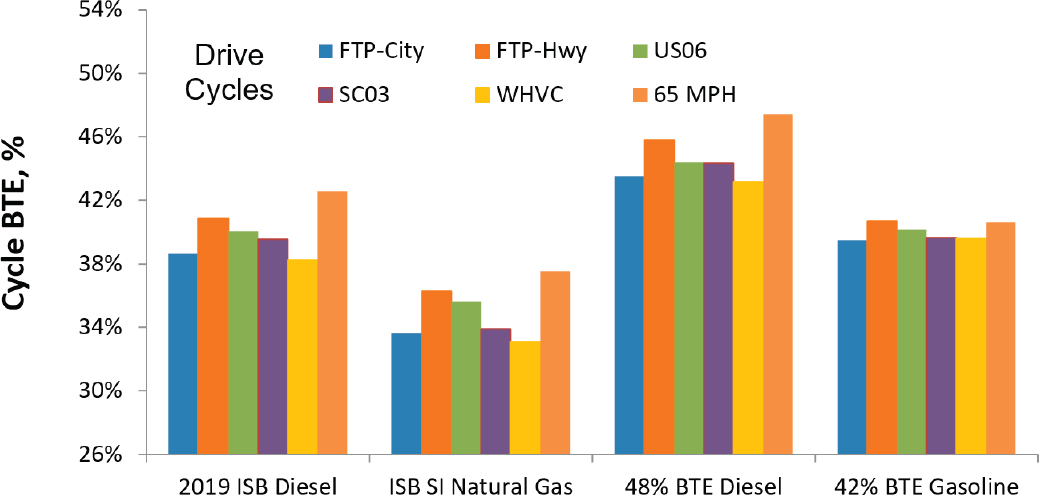
For the medium-duty vocational vehicles, the committee’s projected feasible efficiencies for advanced diesel as well as the gasoline-based engines appear more optimistic than that of NHTSA and EPA (Figure 6-20).
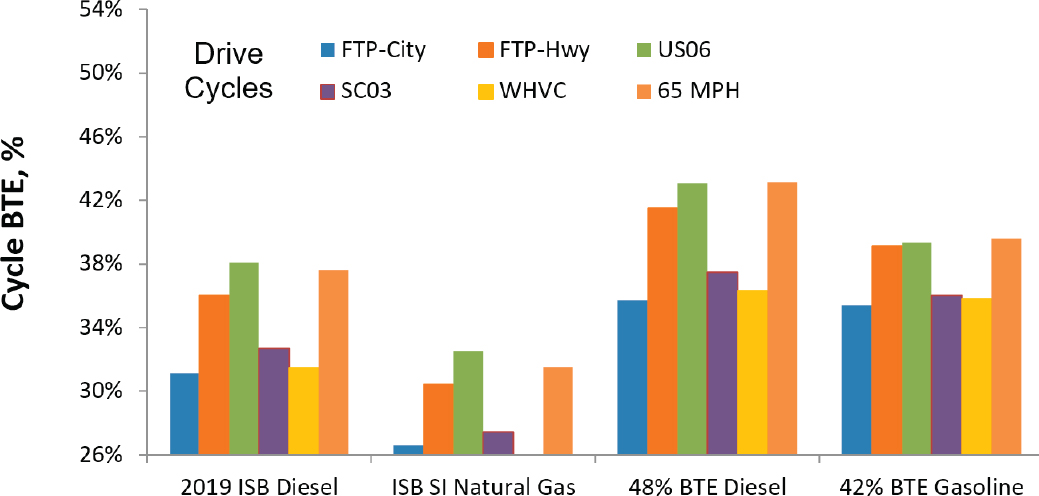
Gasoline-powered large pickups and loose engines for use in vocational vehicles are noted by the committee as somewhat of a paradox. The standards set for full Class 2b vehicles are quite challenging according to the OEMs,6 yet the SI engine standard (627 g CO2/bhp-h) for vocational vehicles is conservative relative to the committee’s view (shown at different payloads in Figures 6-21 and 6-22) of what SI engines can achieve. The proposed standards for this size of vehicle are generally less aggressive than nearly comparable light-duty vehicles (Lutsey, 2015), but one must recognize that about half the Class 2b pickups are already diesel powered. NHTSA and EPA have generally explained that most of these engines are certified in whole vehicles and that is where the aggressive standards are being applied.
Finding: In general the Phase II engine fuel consumption standards taking effect in 2027 are higher (i.e., less efficient) than is projected to be possible for vocational and pickup engines from the committee’s numerical simulations. This difference, however, may be offset by the relatively challenging whole-vehicle standards with which vocational vehicles and pickups must comply in Phase II.
Recommendation 6-3: Future standards for vocational truck engines (especially SI) and vehicle standards such as for Classes 2b and 3 should be in harmony regarding their technology stretch and both should require more ambitious progress in efficiency. This could be considered in the next phase of regulations.
___________________
6 Mark Allen and Barbara Kiss, GM, “GM Heavy-Duty Presentation,” presentation to the committee, Sacramento, CA, July 31, 2013.
6.4 OUTLOOK FOR COMBINATIONS OF ENGINE AND VEHICLE IMPROVEMENTS
In Reinhart (2016), SwRI and NHTSA examined many whole vehicle packages including technologies to reduce aerodynamic drag, rolling resistance, and mass, as well as reductions in auxiliary loads and transmission effects. That study in general used more near-term (conservative) engine efficiency forecasts than that used by the committee. If we consider those vehicles’ package effects with the advanced engines, we would expect the following:
- For the T700, for example, aggressive reductions in aerodynamic drag and rolling resistance would yield an additional 8 to 20 percent reduction in fuel consumption across the drive cycles, beyond the impact of the engine. Cycles with low average speed will show more effect of rolling resistance versus aerodynamic drag. The wide range here is due to the duty cycle effects.
- For the Dodge Ram Pickup, reductions in aerodynamic drag and rolling resistance would save an additional 1 to 3 percent fuel.
With the guidance of the committee, SwRI integrated challenging 2027 vehicle technology targets for aerodynamic drag coefficient, mass reduction, and rolling resistance with the advanced engine maps. This would represent the committee’s most ambitious expectation of reducing vehicle fuel consumption and GHG emisions in 2027 in the absence of a major shift to renewable diesel fuel. The vehicle technology targets were derived mostly from Table 2.32 of the Phase 2 RIA (EPA and NHTSA. 2016a, p. 2-100). The 2027 technology estimates for the committee’s simulated vehicles are shown in Table 6-23.
The results in Table 6-24 show that from baseline 2019 through 2027 best projected technology provides roughly 31 to 35 percent CO2 reduction at the vehicle level using a typical drive cycle and payload. For the Class 8 truck, the committee’s forecast is comparable to NHTSA and EPA’s Phase II regulation, and is further similar to other analyses (ICCT, 2015a; ICCT, 2015b). The committee estimates for vocational and heavy pickups are more optimistic, mostly due to the engine efficiency projections.
TABLE 6-23 Attributes for 2027 Vehicles Used in Simulation of Integrated Advanced Engines and Vehicle Technology
| T700 | T270 | Ram Pickup | |
|---|---|---|---|
| Aero drag coefficient, CdA | 4.83 Approx Cd is 0.45a |
4.278b | 1.354a |
| Rolling coefficient, kg/tonne | Trailer 4.7 Steer-5.6 Tractor-5.9 |
7.67b | 5.46b |
| Mass reduction, lbs | 2,000 | 1,100b | 500b |
| Other improvements (idling reduction, cruise control, lubes, etc.) | Use RIA Table 2-32, and NHTSA 812-146 |
aNote that for a fully integrated tractor-trailer as in the SuperTruck projects we could expect even lower CdA.
bFrom NHTSA 812-146, Tables C8, C9, and C11.
TABLE 6-24 CO2 and Fuel Consumption of Simulated 2027 Vehicles with Base through Advanced Engines, Vehicle CO2 (g/ton-mile) and Fuel Consumption (gallons per 1,000 ton-mile)
| Base Vehicle and Base Engine | Baseline 2019 Diesel, Adv Vehicle | 55% HD Diesel, Adv Vehicle | 50% HD Diesel, Adv Vehicle | 48% MD Diesel, Adv Vehicle | Percent Change, Base to Most Efficient | |
|---|---|---|---|---|---|---|
| T700 | 127.4a | 98.9a g/ton-mi 9.7a |
82.3 | 90.4 | -35% | |
| 12.5a | 8.1 | 8.9 | ||||
| T270 | 559b | 442b g/ton-mi 43.4b |
385 | -31% | ||
| 54.9b | 37.8 | |||||
| Ram | 821c | 642 g/ton-mi 63.3c |
558.6 | -32% | ||
| 80.7c | 54.8 |
aAt 24,020 lbs payload (50%), 65 mph cycle. If comparing to 2027 standards note that the Agencies’ payload is 38,000 lbs. A rough interpolation of results using NHTSA and EPA’s payload would reduce the committee advanced vehicle CO2 from 82.3 to about 60 g CO2/ton-mile, This is about 9% below the 2027 standard.
bAt 4,430 lbs (50%) payload, CARB cycle.
cAt 1,562 lbs payload, ALVW, average of 55% city and 45% highway cycles.
Finding: Combining projections for advanced engines and vehicle improvements, simulations for the committee show potentially over 30 percent reduction in CO2 and fuel usage for all vehicles studied. The technology projections are generally aggressive (in contrast to conservative).
Recommendation 6-4: NHTSA and EPA and future committees should determine whether these ambitious simulations of vehicle-level reductions in CO2 emissions would be consistent with national goals and international agreements to which the United States is a party and, if not, should consider alternative pathways and regulatory approaches7 to achieve greater reductions than just at the vehicle level.
___________________
7 Examples would be larger and/or heavier combination vehicles, low-GHG fuels, and reducing traffic congestion.
6.5 REFERENCES
Eckerle, W. 2015. Beyond GHG Phase 2 Rule, 2015 SAE ComVEC Executive Panel on GHG Legislation, Rosemont, IL, October 7.
EPA (Environmental Protection Agency) and NHTSA (National Highway Traffic Safety Administration). 2011. Greenhouse Gas Emissions Standards and Fuel Efficiency Standards for Medium- and Heavy-Duty Engines and Vehicles; Final Rule. Federal Register 76:57106-57513. September 15.
EPA and NHTSA. 2016a. Greenhouse Gas Emissions and Fuel Efficiency Standards for Medium- and Heavy-Duty Engines and Vehicles—Phase 2: Regulatory Impact Analysis. Publication No. EPA-420-R-16-900, August.
EPA and NHTSA. 2016b. Greenhouse Gas Emissions and Fuel Efficiency Standards for Medium- and Heavy-Duty Engines and Vehicles—Phase 2: Response to Comments for Joint Rulemaking. Publication No. EPA-420-R-16-901, August.
EPA and NHTSA. 2016c. Greenhouse Gas Emissions and Fuel Efficiency Standards for Medium- and Heavy-Duty Engines and Vehicles—Phase 2. Federal Register 81:73478-74274, October 25.
ICCT (International Council on Clean Transportation). 2015a. United States Efficiency and Greenhouse Gas Emission Regulations for Model Year 2018-2027 Heavy-Duty Vehicles, Engines, and Trailers: Policy Update. Washington, DC: ICCT, June.
ICCT. 2015b. Parsing Phase 2 Tractor-Trailers Proposed Regulation. Washington, DC: ICCT, July.
Langer, T. 2015. Fuel Efficiency and GHG Standards for Heavy-Duty Vehicles in the U.S. 8th Forum on Energy Efficiency in Transport, Mexico City, September 29.
Lutsey, N. 2015. Proposed U.S. Heavy-Duty Standards: Technologies, Costs, and Global Context SAE Commercial Vehicle Engineering Congress, Rosemont, IL, October 7.
NRC (National Research Council). 2014. Reducing the Fuel Consumption and Greenhouse Gas Emissions of Medium- and Heavy-Duty Vehicles, Phase Two: First Report. Washington, DC: The National Academies Press.
Reinhart, T.E. 2015. Commercial Medium- and Heavy-Duty Truck Fuel Efficiency Technology Study—Report #1. Report No. DOT HS 812 146. Washington, DC: NHTSA, June.
Reinhart, T.E. 2016. Commercial Medium- and Heavy-Duty Truck Fuel Efficiency Technology Study—Report #2. Report No. DOT HS 812 194. Washington, DC: NHTSA, February.


