
8
Battery Technology for Medium- and Heavy-Duty Hybrid and Electric Vehicles
8.1 INTRODUCTION
As identified in Chapter 7, there has been a significant increase in the number of hybrid and battery electric vehicles being offered in passenger cars and light-duty trucks within the past few years. Stimulated by research and development funding by the U.S. Department of Energy (DOE), there has been significant progress relative to the three major hurdles to wide-scale commercialization of hybrid and battery electric vehicles: (1) battery cell energy density and useful life; (2) battery pack reliability, thermal management, and safety; and (3) battery cell and resulting pack cost.
Another factor driving increased battery research and development is increasing regulatory pressure to eliminate the use of internal combustion engines, especially diesel engines, in large, densely populated cities. The mayors of Paris, Mexico City, Madrid, and Athens have announced that they will stop the use of all diesel-powered cars and trucks by 2025 in order to improve air quality.1
8.1.1 Evolution of Automotive Battery Chemistries
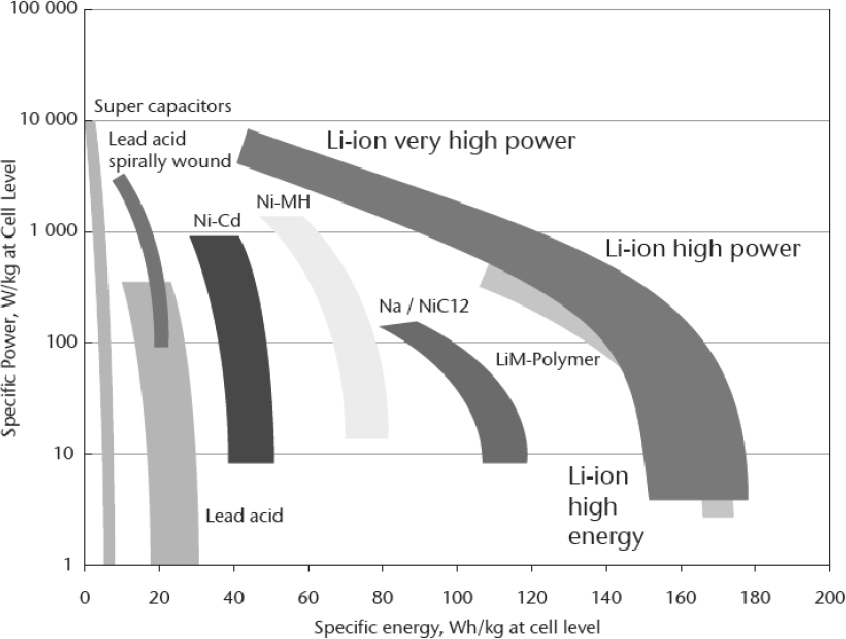
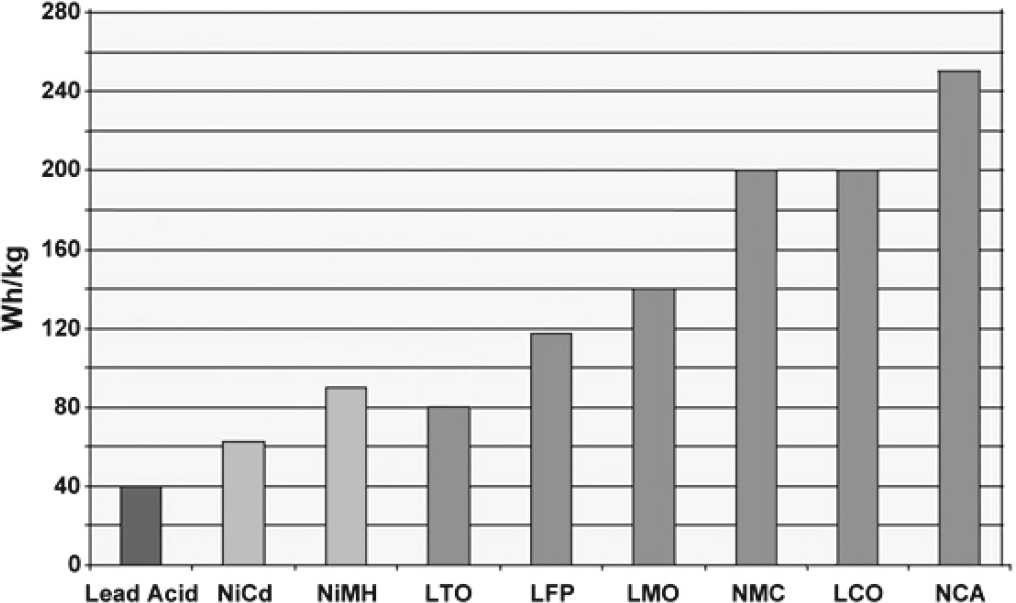
For the first 80 years or so of the automotive and commercial trucking industry, lead acid was the most common choice for battery chemistry due to its relatively low cost, useful level of its state of charge (SOC), and the ability to recycle the core elements of the battery. They were employed to provide 12-volt (V) power to starter motors, with the ability to provide rather large current levels for the time necessary to start spark-ignited, primarily gasoline-fueled engines in passenger cars and light trucks. For use in commercial trucks and buses, the voltage remained at 12 V, but the cold cranking amperage typically increased to 1,400 amperes (A) or more due to the higher power and torque needed to start diesel engines. Lead-acid batteries typically have energy densities of approximately 30 watt-hours per kilogram (Wh/kg).
With the arrival of the first electric car prototypes and limited production vehicles (GM EV1) in the early 1990s, battery chemistry migrated to nickel-cadmium (Ni-Cd) to increase energy density. Such Ni-Cd batteries typically exhibited energy densities of about 50 Wh/kg. When the first hybrid electric vehicles were introduced in the late 1990s (e.g., the Honda Insight and Toyota Prius), there was a need for even greater energy density, resulting in the introduction of nickel-metal hydride (NiMH). The energy density for NiMH increased approximately from 60 to
___________________
1 See http://www.bbc.com/news/science-environment-38170794 (accessed january 2, 2017).
70 Wh/kg, which, combined with its relative safety and thermal management requirements, saw very significant market penetration and is still in use today.
In the ongoing quest for higher energy density, especially for application in full hybrid and battery electric vehicles, lithium-ion (Li-ion) chemistries have seen increasing use in vehicular applications. Li-ion batteries underwent much research and development to support the tremendous growth of the portable computer, tablet, and cell phone industry. Although the basic chemistry may be appropriate for use in transportation, the application of such batteries to large-power battery packs has been the focus of the automotive and its Tier 1 supplier industry for the past 15 to 20 years. Advances in electrical control and thermal management have allowed increasing penetration into most current and future hybrid electric vehicles (HEVs), plug-in hybrid electric vehicles (PHEVs), and battery electric vehicles (BEVs). This is due to the much higher energy density than that of NiMH, with Li-ion packs demonstrating 120 to 180 Wh/kg, depending on the particular electrolyte and anode/cathode chemistry employed. Lithium-polymer batteries, for example, utilize a semisolid gel-type electrolyte. Figure 8-1 shows the range of specific energies for different battery chemistries compared to specific power (W/kg).
8.1.2 Breadth of Battery Systems Offered in Light-Duty Hybrid Vehicles
There has been a significant increase in the number of hybrid and battery electric passenger cars and light trucks sold in the United States between 2010 and 2014. In 2015, the report Cost, Effectiveness, and Deployment of Fuel Economy Technologies for Light-Duty Vehicles identified some 68 total hybrid and electric vehicle models offered in 2014, which included 46 different hybrid vehicle models and an additional 22 plug-in hybrids or battery electric vehicles (NRC, 2015a). Total sales numbers for model year 2014 were approximately 455,000 HEVs and 129,000 PHEVs and BEVs.
SOURCE: Pesaran et al. (2013).
Table 8-1 is reproduced from the 2015 National Research Council (NRC, 2015a) report to give the reader a better impression of the breadth of vehicles offered, which requires an equally broad development of battery cells and packs with varying chemistries, different thermal management and electronic control approaches, unique operating cycle optimization, and many different pack geometries, power requirements, and energy capacity needs.
8.1.3 Basic Working Principles of Li-Ion and Other Battery Chemistries
Batteries are designed to store energy and deliver it at needed rates, producing the power required to move the vehicle or power accessories. There are trade-offs in choice of battery chemistry and battery component design to maximize the energy or power performance of battery systems. For example, batteries that are designed to contain as much charge as possible, as used in BEVs, are designed for higher energy storage capacity. In contrast, batteries that must survive a high number of battery charging and discharge cycles, such as those used in HEVs, are designed with the ability to transfer electrical energy at higher power rates. In order to better understand the challenges associated with the use of high-energy-density Li-ion batteries in automotive applications, and especially in medium- and heavy-duty vehicles, an abbreviated explanation of working principles, application trade-offs, and influences on commercialization is presented below.
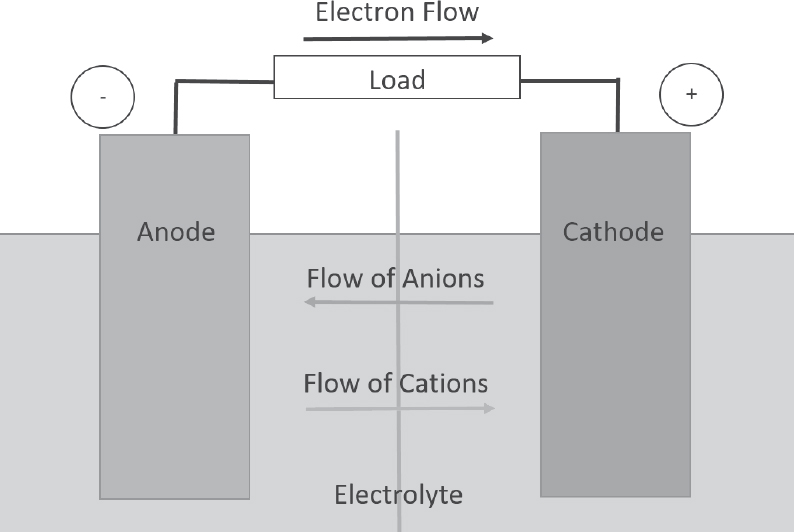
Most simply described, a battery contains at least two electrochemical cells that convert chemical energy into electrical energy in the form of current, voltage, and power (based on energy transfer over time). Figure 8-2 shows a very basic representation of an electrochemical battery.
During electrical discharge, current flows from the cathode (positive terminal) to the anode (negative terminal), both of which are isolated by a separator. This occurs because the cathode of a charged battery has a higher electrical potential than the anode, by definition. It is important to note that the direction of current flow is opposite that of electron flow. Therefore, current, by definition, flows through a circuit from the cathode to the anode, while the electrons flow from the anode to the cathode. When a battery is connected to an external circuit, the electrolyte within the battery supports the flow of ions created by the chemical reactions as they transfer between the cathode and anode. Under discharge, cations (positive ions) migrate to the cathode, where they can combine with the electrons, which flow from the anode to the cathode. If anions (negative ions) exist, as in a lead-acid battery, they migrate toward the anode. Therefore, the relative movement of the ions supports corresponding electron flow and associated current flow, such that the battery produces electrical energy over time to perform work.
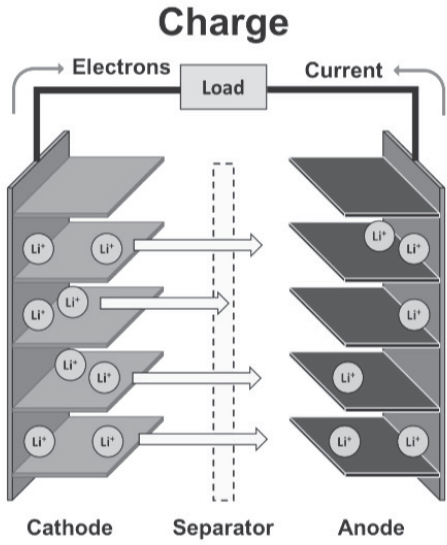
As previously discussed, Li-ion battery chemistries offer a higher level of specific energy than lead-acid, NiMH, and Ni-Cd types. Figure 8-3 provides additional details about the electrochemical function of Li-ion batteries.
Li-ion batteries store energy by intercalation of charged lithium ions within the anode, which may be carbon/graphite, titanate, silicon based, or some other metal oxide. The charger drives electrons from the cathode side of the battery to the anode, which in turn causes the positively charged Li+ to migrate through the separator to the anode. The chemical reactions, in the case of a graphite anode and lithium iron phosphate, are as follows:
Li-ion Battery Charging Mechanism
Reaction at Cathode:
LiFePO4 → FePO4 + Li+ + e-
Electron flow is driven by the charger and creates Li+.
Reaction at Anode:
Li+ + e- + C6 → LiC6
Li+ ions pass through the separator to combine with electrons.
As shown in the figure, as electrons are stripped and transferred, an equal number of Li+ ions are created in order for the process to remain balanced. During charging, these Li+ ions transfer within the electrolyte, through
TABLE 8-1 Hybrid Models in Light-Duty Vehicles in 2014
| Manufacturer | Model | Sales CY 2014 | U.S. Hybrid Share 2013 | Architecture |
|---|---|---|---|---|
| Toyota | Prius Liftback | 122,776 | 0.2715 | PS |
| Toyota | Prius C | 40,570 | 0.0897 | PS |
| Toyota | Camry Hybrid | 39,515 | 0.0874 | PS |
| Ford | Fusion Hybrid | 35,405 | 0.0783 | PS |
| Toyota | Prius V | 30,762 | 0.0680 | PS |
| Hyundai | Sonata | 21,052 | 0.0466 | P2 |
| Ford | C-Max Hybrid | 19,162 | 0.0424 | PS |
| Lexus | CT200h | 17,673 | 0.0391 | PS |
| Toyota | Avalon Hybrid | 17,048 | 0.0377 | PS |
| Lexus | ES Hybrid | 14,837 | 0.0328 | PS |
| Honda | Accord Hybrid | 13,997 | 0.0310 | i-MMD |
| Kia | Optima Hybrid | 13,776 | 0.0305 | P2 |
| Lincoln | MKZ | 10,033 | 0.0222 | PS |
| Lexus | RX 400 / 450 h | 9,351 | 0.0207 | PS |
| Subaru | XV Crosstrek Hybrid | 7,926 | 0.0175 | Other |
| Buick | Lacrosse Hybrid | 7,353 | 0.0163 | MH w IMA |
| Honda | Civic Hybrid | 5,070 | 0.0112 | MH w IMA |
| Honda | Insight | 3,965 | < 0.01 | MH w IMA and CVT |
| Toyota | Highlander Hybrid | 3,621 | < 0.01 | PS |
| Honda | CR-Z | 3,562 | < 0.01 | MH w IMA and CVT or M6 |
| Infiniti | Q50 Hybrid | 3,456 | < 0.01 | PS |
| Nissan | Pathfinder Hybrida | 2,480 | < 0.01 | P2 |
| Volkswagen | Jetta Hybrid | 1,939 | < 0.01 | P2 |
| Infiniti | QX 60 Hybrida | 1,678 | < 0.01 | P2 with CVT |
| Chevrolet | Malibu Hybrid | 1,018 | < 0.01 | SS |
| Buick | Regal Hybrid | 662 | < 0.01 | MH |
| Porsche | Cayenne Hybrid | 650 | < 0.01 | P2 |
| Chevrolet | Impala Hybrid | 565 | < 0.01 | SS |
| Acura | ILX Hybrid | 379 | < 0.01 | P2 |
| Audi | Q5 Hybrid | 283 | < 0.01 | P2 |
| Lexus | GS 450h | 183 | < 0.01 | PS |
| Infiniti | Q70 Hybrid | 180 | < 0.01 | |
| Mercedes | E400H | 158 | < 0.01 | P2 |
| BMW | Active(335ih) | 151 | < 0.01 | Other |
| Acura | RLX Hybrid | 133 | < 0.01 | |
| BMW | Active (535ih) | 112 | < 0.01 | Other |
| Chevrolet | Tahoe Hybrid | 65 | < 0.01 | 2-Mode |
| Lexus | LS 600h | 65 | < 0.01 | PS |
| BMW | 7-Series Hybrid | 45 | < 0.01 | Other |
| Cadillac | Escalade Hybrid | 41 | < 0.01 | 2-Mode |
| GMC | Yukon Hybrid | 31 | < 0.01 | 2-Mode |
| Volkswagen | Touareg Hybrid | 30 | < 0.01 | P2 |
| Chevrolet | Silverado Hybrid | 24 | < 0.01 | 2-Mode |
| Mercedes | ML450H | 20 | < 0.01 | |
| Mercedes | S400HV Hybrid | 10 | < 0.01 | P2 |
| GMC | Sierra Hybrid | 6 | < 0.01 | 2-Mode |
| Overall Hybrid Share of LDV Market | 2.75% | |||
aPHEV/BEV breakdown unknown.
NOTE: CVT, continuously variable transmission; IMA, integrated motor assist; i-MMD, intelligent multi-mode drive; MH, mild hybrid; PS, power split; SS, stop-start.
SOURCE: NRC (2015a).
SOURCE: Wessler (2018).
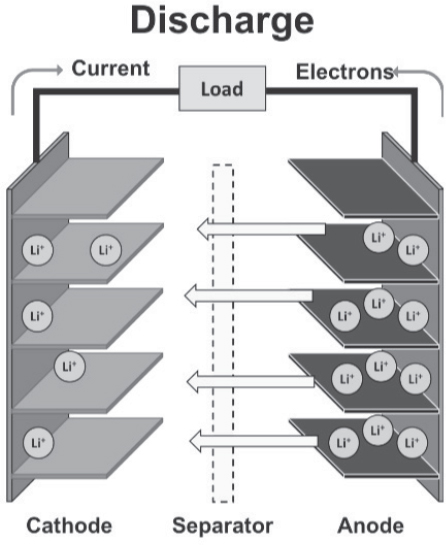
the separator from the cathode to the anode, where they intercalate into the carbon and create lithiated carbon, LiC6. The discharge process releases energy in the reversal of the charging processes. The discharge process is characterized in Figure 8-4 and the equations below.
Li-ion Battery Discharging Mechanism
The chemical reactions which take place during discharge, for the same anode/cathode chemistries, are as follows:
Reaction at Anode (separation of lithium from graphite):
LiC6 → Li+ + e– + C6
Electrons flow through the load.
Reaction at Cathode (conversion of iron phosphate to lithium iron phosphate):
FePO4 + Li+ + e– → LiFePO4
Li ions go through the separator.
Understanding Li-ion cell functionality is important in understanding the major advances that have been achieved in light-duty vehicle applications and the challenges which must be overcome in the development of battery designs which trade off all of the parameters necessary for commercialization in medium- and heavy-duty trucks. Although the examples above are simplified, optimizing all of the parametric factors that must be done for best performance in particular applications is very complex. For example, the graphite-electrode, lithium iron phosphate cell chemistry is only one of many that are currently being commercialized.
SOURCE: Wessler (2018).
Many anode chemistries are being evaluated and commercialized depending on the intended duty cycle, operating voltages, durability requirements, cost constraints, and safety goals. A group of about a dozen chemistries are the primary focus of attention. Current anode systems include, but are not limited to, carbon graphite (most popular, cost effective), silicon based (improved life and capacity), lithium titanate (Li4Ti5O12); 1.8-2.8 V (graphite on cathode), and metal oxides (Spotnitz, 2005). Graphite is relatively inexpensive and is used almost exclusively for most light-duty vehicle applications. However, graphite has a charge rate that is limited by lithium plating. In addition, graphite tends to be calendar-life limited due to the growth of solid electrolyte interphase, which forms a coating over time on the graphite that impedes Li+ transfer into the graphite anode. Lithium titanate oxide (LTO) technology is a derivative of traditional Li-ion batteries which adds additional lithium titanate nanocrystals to the surface of the carbon anode. As a result, the anode has a surface area of around 100 meters squared per gram (m2/g), which is some 30 times more than the 3 m2/g of conventional graphite, which supports electrons transferring to or from the anode much more quickly.2 As a result of this much larger surface area, recharging of the LTO battery is much faster than a traditional graphite anode battery. Furthermore, the increased surface area significantly improves the LTO cells’ general stability and safety during charging. LTO also exhibits excellent power at low temperatures.
Likewise, various electrolyte chemistries are being developed and optimized for commercial application, including salts such as LiPF6 and LiBF4 added, dimethyl or ethylene carbonates, ionic liquids, polymer electrolytes, and various solid electrolytes (Spotnitz, 2005). The liquid electrolyte solution permits the transport of Li+ ions between the cathode and anode. The most common electrolyte employs lithium salt, such as LiPF6, dissolved in an organic solution. In addition to lithium salt, other additives are necessary to achieve the desired properties of the electrolyte solution. These additives improve the stability of the solution by opposing dendritic formation and degradation of the solution. The electrolyte formulation will vary depending on the specific anode and cathode materials being used.3
In addition, much research and development are ongoing in cathode chemistry. Accordingly, different higher-performance, higher-capacity cathode materials including lithium cobalt oxide (LCO), spinel-based lithium manganese oxide (LMO), lithium nickel cobalt manganese oxide (NMC), lithium iron phosphate (LFP), and lithium nickel cobalt aluminum oxide (NCA). The cathode materials (Table 8-2) are constructed of cobalt, nickel, and manganese in the crystal structure forming a multi-metal oxide material to which lithium is added. This family of batteries includes a variety of products that cater to different user needs for high energy density and/or high load capacity.
Figure 8-5 compares the specific energy of lead- and nickel-based chemistries with those that are lithium based. Although Li-Al (NCA) demonstrates the highest specific energy, Lithium manganese (LMO) and lithium phosphate (LFP) show higher specific power and thermal stability. Lithium titanate (LTO), on the other hand, has relatively low specific energy but demonstrates excellent calendar life and performs the best in cold temperatures. As we look to medium- and heavy-duty vehicles, safety and calendar and cycle life may be more important than just specific energy or total energy capacity.
Table 8-3 provides a summary of different battery chemistries and construction methods which are provided in hybrid and electric vehicles available in model year 2015. Of interest is the variation in chemistries, the cell count associated with pack topology, and specific energy. This suggests that no single chemistry is either optimum or preferred.
8.2 COMPARISON OF DIFFERENT LITHIUM BATTERY CHEMISTRIES, PERFORMANCE, AND APPLICATIONS
Figure 8-1, presented in the beginning of this chapter, showed a graphic representation of specific energy capacity versus specific power of different basic battery chemistries. However, the Li-ion curve showed a broad range of possibilities. In order to better understand in what applications particular chemistry combinations are most preferred, a trade-off in performance metrics must be done for each application.
___________________
2 See http://investorintel.com/technology-metals-intel/lithium-titanate-battery-technology-bigger-better/ (accessed December 1, 2019).
3 See http://www.targray.com/li-ion-battery/electrolyte (accessed December 1, 2019).
TABLE 8-2 Comparison of Typical Cathode Materials Used in Lithium-Ion Batteries
| Chemistry | Nominal V | Charge V Limit | Charge and Discharge C-Rates | Energy Density (Wh/kg) | Applications |
|---|---|---|---|---|---|
| Cobalt | 3.60 V | 4.20 V | 1C limit | 110-190 | Cell phone, cameras, laptops |
| Manganese (spinel) | 3.7-3.80 V | 4.20 V | 10C cont. 40C pulse | 110-120 | Power tools, medical equipment |
| NCM (nickel cobalt manganese) | 3.70 V | 4.10 Va | ~5C cont. 30C pulse | 95-130 | Power tools, medical equipment |
| Phosphate | 3.2-3.30 V | 3.60 Va | 35C cont. | 95-140 | Power tools, medical equipment |
aHigher voltages provide more capacity but reduce cycle life.
SOURCE: Targray Technology International, Inc. (2017).
SOURCE: Battery University (2016), batteryuniversity.com (accessed August 20, 2019).
TABLE 8-3 Summary of Li-Ion Battery Chemistries and Geometries Utilized in Model Year 2015 Electric and Hybrid Electric Light-Duty Vehicles
| EV | Cathode | Anode | Battery Supplier | Type of Cell | Number of Cells | Electric Energy (kWh) | Power (kW) | Specific Energy Density (Wh/kg) | Electric Range (mi) |
|---|---|---|---|---|---|---|---|---|---|
| Tesla Model S | NCA (layered) | Carbon (layered) | Panasonic | Cylindrical | >7,000 | 85 | 270 | 116 (pack) | 265 |
| Chevy Volt | LMO (spinel) | Carbon (layered) | LG Chem | Prismatic | >200 | 16 | 111 | 88 (pack) | 40 |
| Nissan Leaf | LMO (spinel) | Carbon (layered) | Nissan NEC JV | Prismatic | 192 | 24 | 90 | 140 (pack) | 84 |
| Honda Fit | NCM (layered) | LTO (layered) | Toshiba Corp. | Prismatic | 432 | 20 | 92 | 100 (cell) | 82 |
| BYD E6 | LFP (olivine) | Carbon (layered) | BYD | Prismatic | 96 | 48 | 75 | – | 186 |
SOURCE: NRC (2015a).
The six primary battery performance metrics which must be traded off are
- Specific energy capacity (Wh/kg or watt-hours per liter [Wh/l]),
- Specific and total power (watts per kilogram [W/kg]),
- Cell and pack safety (abuse tolerance),
- Cell and pack life (total cycle and/or calendar life),
- Total battery system cost (dollars per watt-hour [$/Wh]), and
- Cell performance.
The specific energy or capacity of a battery pack is directly related to the total operational time before recharging is necessary. In the case of hybrid and electric vehicles, this corresponds to electric mileage or electric range. The specific power of the battery cells or the pack corresponds to the ability of the system to deliver high levels of current, which, at a given voltage over time, determines the total power that can be generated. Cell and pack safety are associated with the ability of the system to withstand harsh operational conditions or abuse. Protection against thermal runaway or other thermal events is also a factor considered in pack safety. The lifetime of cells and packs is evaluated not only on number of charging and discharging cycles, but also on calendar life or longevity, which is influenced by growth of deposits that will degrade lithium-ion transfer. Cell, battery pack, and total electrical system costs are very important parameters which are particularly important in commercial vehicle application where capital and operational costs are of the utmost importance. The component and total system costs are shown in Table 8-8 at the end of this chapter. Pack and cell performance, under both cold and hot conditions, is also important to consider. Factors such as self-discharge percentage, capacity (in percentage), and internal resistance, all evaluated as functions of the total number of charging/discharging cycles, are used to evaluate performance, which varies by cell chemistry. There are many other factors which must be considered, such as ease of maintenance, component commonality across different vehicle applications for a single fleet, fast-charge capabilities, and propensity to self-discharge and shelf life—all characteristics which must be considered in product commercialization. Table 8-4 shows a summary of many key features and functional parameters associated with seven leading Li-ion battery chemistries. These give the reader an understanding of the breadth of variation in performance functionality of batteries which together are all classified under “lithium-ion batteries.”
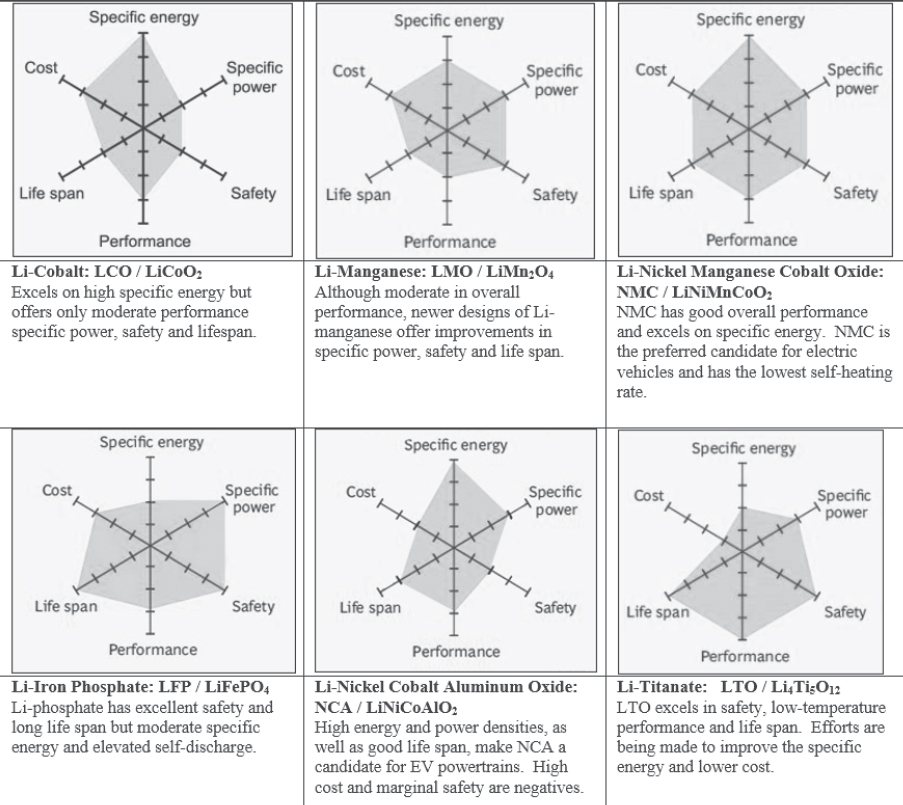
Figure 8-6 shows spider diagrams of the six major Li-ion cell chemistries which are currently being developed and/or produced by the battery industry. The six axes on the spider diagram represent relative achievements of each battery type in successfully accomplishing the metric being evaluated: (1) specific energy, (2) specific power, (3)
TABLE 8-4 Voltage, Specific Energy, and Volumetric Energy for Several Battery Chemistries
| Material | Voltage (Average vs Li/Li+) | Capacity (mAh/g) | Crystal Density (g/cm3) | Tap Density (g/cm3) | Specific Energy (Wh/kg) | Volumetric Energy (Wh/L) |
|---|---|---|---|---|---|---|
| LiCoO2 | 3.8 | 150 | 5.10 | 2.9 | 570 | 2,907 |
| LiNi1/3Mn1/3Co1/3O2 (NMC) | 3.7 | 170 | 4.75 | 2.5 | 629 | 2,988 |
| LiNi0.8Co0.15Al0.05O2 (NCA) | 3.7 | 185 | 4.85 | 2.5 | 685 | 3,322 |
| LiMn2O4 | 4.0 | 110 | 4.31 | 2.5 | 440 | 1,896 |
| LiFePO4 | 3.4 | 160 | 3.60 | 1.5 | 544 | 1,958 |
| 0.5Li2MnO3∙0.5LiMO2a | 3.6 | 250 | 4.30 | 1.8 | 828 | 3,870 |
| LiMn1.5Ni0.5O4a | 4.7 | 135 | 4.40 | 2.0 | 635 | 2,794 |
aNot yet commercialized.
NOTE: Crystal densities are theoretical values, while densities represent typical, practical values, determined experimentally as the actual weight per unit volume occupied by a given material. Volumetric energy densities are calculated using the crystal densities for comparison because the optimum, final electrode densities will vary among materials. M=Mn, Ni, or Co in LiMO2. Capacity and voltage targets for 0.5Li2MnO3∙0.5LiMO2 are based on DOE’s end-of-life goals for composite materials; crystal density is calculated as an average of Li2MnO3 and LiMn0.5Ni0.5O2.
SOURCE: Battery University (2016), batteryuniversity.com (accessed August 20, 2019).
safety, (4) performance, (5) life span, and (6) cost. These diagrams, which are adapted from information provided by Cadex Electronics through the Battery University website, provide a convenient way to compare the key performance metrics when evaluating application for vehicles.4 A review of the diagrams suggests that lithium nickel manganese cobalt oxide (LiNiMnCoO2, known as NMC) displays excellent values in most of the key metrics, and that is why it is a leading battery chemistry for light-duty hybrid and electric vehicles. NCA also demonstrates high specific energy and very reasonable specific power, which has made it the choice of Tesla-Panasonic (Table 8-7 at the end of this chapter). However, the cobalt concentration in NCA causes it to be more expensive than NMC. Lithium titanate demostrates relatively low specific energy and specific power, but its very long life span, excellent cold weather performance, and very high safety have made it the choice for some commercial applications (UPS) and certain lightweight electric vehicles (iMEV, Honda Fit EV).
As can be seen in Figure 8-6, the selection of basic battery chemistry has many different features and parameters which must be optimized for particular applications. However, other equally important issues that must be considered are the physical features of the cells, the complexity of electrical connection between the cells, the method of cooling (liquid versus air), available geometric space in the vehicle, and many more.
8.2.1 Li-Ion Battery Physical Characteristics
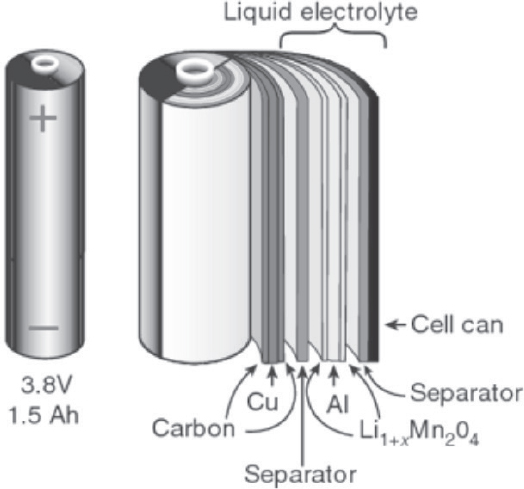
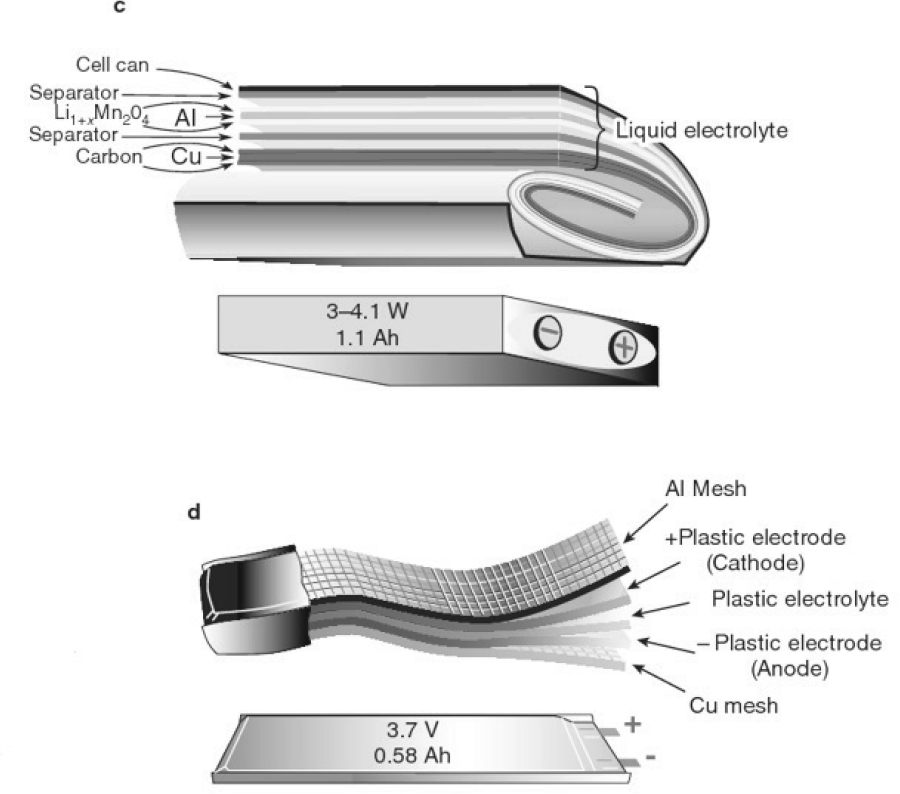
Certain key parameters which influence successful operation and commercialization are outlined below. The first feature to consider is Li-ion cell geometric and design configuration. There are two major options being pursued, which are cylindrical and prismatic. Cylindrical cell configurations can be divided into “jellyroll” or hard can types. For prismatic designs, they can be configured in wound or stacked layers which are encased within a soft pouch or hard can. Figures 8-7 and 8-8 show examples of these different configurations. Table 8-7 lists battery offerings from various manufacturers and describes their configurations and other characteristics.
Cylindrical cells have the advantage that the same cell geometry may be used in many consumer electronics applications, such that economies of scale tend to reduce the individual cell costs. An example of such dual use is the cells used in the Tesla Model S, where over 7,000 Panasonic 18650 cells are integrated into the battery pack.
SOURCE: Tarascon and Armand (2001), reprinted by permission from RightsLink: Springer Nature, Tarascon & Armand, 2001.
___________________
4 See http://batteryuniversity.com/learn/article/types_of_lithium_ion (accessed August 20, 2019)..
SOURCE: Tarascon and Armand (2001), reprinted by permission from RightsLink: Springer Nature, Tarascon & Armand, 2001.
Prismatic cells, on the other hand, have the potential for increased capacity and amperage for each unit that must have external electrical connections. This could lead to higher durability or reliability, especially in the application for commercial vehicles.
The composition of a Li-ion battery can be briefly summarized as
- Active material laminated to an aluminum collector at the cathode;
- Carbon-based material deposited on a copper collector at the anode;
- Anode and cathode, separated by a nonconductive film known as the separator;
- Layers of anode and cathode stacked with separators;
- Anode layers electrically joined (welded) to the negative cell tab;
- Cathode layers electrically joined (welded) to the positive cell tab;
- Stack inserted in a plastic/metal pouch or wound in a can; and
- Electrolyte poured and pouch sealed with exposed cell tabs.
This basic construction applies to both cylindrical and prismatic cells.
8.2.2 Commonly Used Terms Important in Battery Assessment
In order to better understand the ability of battery technology to fulfill future requirements for medium- and heavy-duty applications, it is important to understand commonly used terms that are important when evaluating battery cell and pack characteristics. Key terms include the following:
-
C-Rate
- Charging and discharging of batteries is governed by the C-rate, a measure of the discharge current. C-rate is the amount of constant current at which a battery cell can be discharged (or charged) for 1 hour.
- Example: A battery cell which is capable of providing 10 A for one hour has a 1C rate of 10 A.
-
Capacity
- Coulomb counting of current (in amperes) is capacity.
- The above-mentioned battery has a capacity of 10 amp-hours (Ah).
- Discharging the same cell at a 2C rate would theoretically mean withdrawing 20 A for 0.5 h.
- Putting such two cell in parallel would increase the C-rate of the battery to 20 A and capacity to 20 Ah.
- A higher C-rate typically reduces capacity owing to higher internal losses.
- It is not uncommon to discharge Li-ion batteries at 10C rates for a very short duration of time.
- State of Charge (SOC)/Depth of Discharge (DOD): SOC is the percent of charge or energy remaining in the battery. DOD is the percent of charge or energy used. If the SOC is 80%, the DOD is 20%.
-
Resistance to DC Current (DCR): Measure of a battery’s internal resistance.
- Charge/discharge resistance depends on SOC, temperature, and C-rate.
- Internal resistance of a battery grows over the life span of the battery.
- High Self-Discharge: Ni-Cd and NiMH have the highest self-discharge.
-
Cell Balancing
- As cells charge and discharge, their SOC levels deviate from one another due to variation in internal resistances. Periodically, cells in a battery pack need to be balanced to gain maximum usage.
- Battery cells are typically balanced at top of charge (PHEVs and electric vehicles [EVs]) or bottom of the charge (typically HEVs).
- Power: Power in simple terms equates to acceleration or the ability of an EV to climb a hill. Power = Voltage × Current (P = VI).
- Energy: Energy equates to vehicle range or capacity to do work. It is measured in watt-hours.
- Cycle Life: The cycle life is the number of cycles the battery can undergo before it fails to meet performance criteria. A complete cycle is defined as one deep charge/discharge cycle at a given C-rate.
-
Calendar Life
- Dependency on temperature, SOC, and time.
- Battery resistance increases with calendar life; thus, retained capacity decreases. Optimum storage temp is below 30°C. The calendar life of Li-ion batteries is far superior to that of other types of batteries.
-
State of Health (SOH): SOH is used to predict range, state of charge, etc.
- Measure of DCR, capacity, alternating current resistance etc.
- WH Throughput: Total energy in and out.
- Hybrid Pulse Power Characterization (HPPC): HPPC is a test to measure a battery’s power capability at various SOC levels.
- Charge Neutrality: A pulse cycle which discharges and charges the battery to maintain charge neutrality (100 A out/100 A in). SOC will still very slowly deplete.
8.2.3 Battery Pack Design Considerations
Once the basic priority for cell performance is defined, the cells must be combined into battery packs that much achieve a significant number of electrical, thermal, structural, and weight targets in order to have successful installation into a vehicle.
- Cells can be joined in various parallel and series configurations to achieve required power and energy.
- Cells in parallel increase capacity.
- Manufacturing/assembly puts limitations on how many cells can be put in parallel.
- Cells in series increase pack voltage.
- Cell tabs are joined with low resistance methods (welding).
- Cells in parallel increase capacity.
- Cells are put together in modules (arrays).
- Electromechanical construction comprises welding cell tabs, cell constraining mechanism, and cooling considerations.
- Provide means for cell voltage and temperature monitoring.
- Various numbers of modules are put together to make a battery pack.
There are several major components within battery packs that are common across most applications. These include the following:
-
Modules (Arrays)
- Cells in parallel/series combination. Modules are usually stand-alone components structurally.
-
Battery Management System (BMS): The BMS is low voltage and
- Controls all the devices internal to the battery.
- Limits power to and from the battery if cells are operated outside their recommended parameters.
- Can shut down the battery completely if needed.
- Communicates externally to the vehicle control module on the Controller Area Network bus.
- Monitors cell voltages and temperature for optimum life.
-
Distribution Box
- Contains switches, pre-charge resistor, current sense module, etc. Electronics are powered by low voltage.
-
Service Disconnect
- A manual switch which can be removed when working on the battery packs.
-
Fuse
- Safety fuse which is rated at a current somewhat higher than application current.
-
Vent
- Battery pack mounted inside the cabin has cell venting strategy to eject vent gases outside.
In addition to the battery pack components, there are other major parts to the electric drive system, which include the following:
-
DC-to-DC Converter
- Reduces batteries DC voltage to required DC voltage to run electronics/accessories.
-
DC-to-AC Inverter
- Converts battery’s DC voltage to AC voltage to accept charge and send to the traction motor.
-
Traction Motor
- Typically a multi-phase AC motor.
- Provides torque to wheels.
- Acts as a generator during braking (regenerative power).
- Some PHEVs have a separate generator for charging the battery while running the engine at its optimum efficiency.
- Typically liquid cooled.
8.3 INFLUENCE OF MEDIUM- AND HEAVY-DUTY USAGE ON BATTERY PERFORMANCE
In some cases, experience gained in light-duty usage sheds some light on the challenges which may be experienced in commercial vehicle applications. The report Overcoming Barriers to Deployment of Plug-in Electric Vehicles (NRC, 2015b) evaluates the current state of light-duty plug-in electric vehicles, their technologies, costs, and challenges for large-scale commercialization. Although the focus of the 2015 report is on smaller, light-duty passenger vehicles, the assessment of future challenges and opportunities has some direct bearing on medium- and heavy-duty applications.
Concerns about the durability and performance of the current lithium-ion batteries at extremely high and low temperatures could be a barrier widespread adoption. As more experience is gained with a larger number of vehicles and increasing miles driven, effects on durability are becoming clearer, which is an extremely important factor in commercial vehicle use (Steffke et al., 2008).
One study that evaluated a PHEV with a 20 kWh battery showed that a hot climate accelerates the normal degradation of battery capacity with time (Figure 8-9) (Pesaran et al., 2013). Reports on shorter battery life for
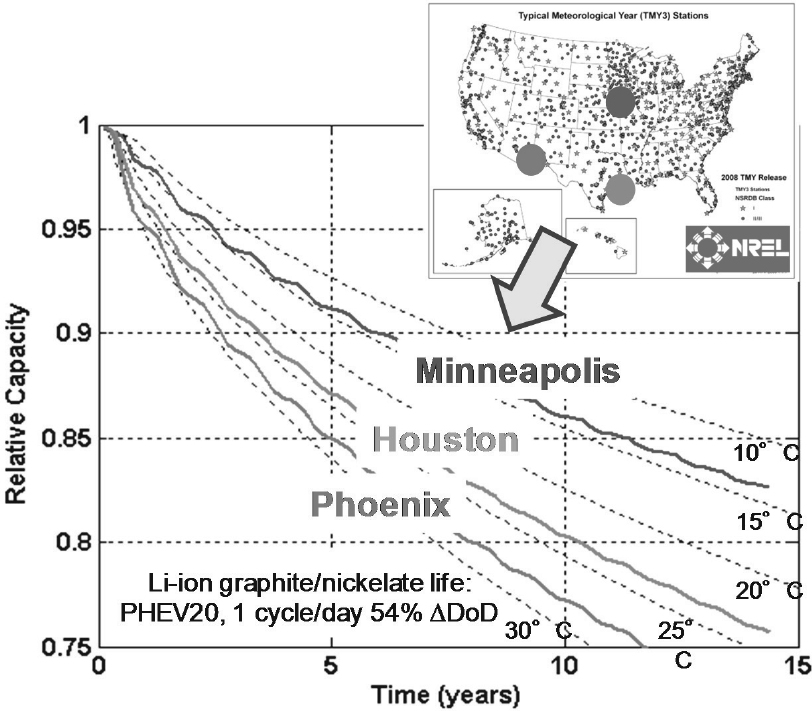
NOTE: DoD, depth of discharge; PHEV20, plug-in hybrid 20 mile range.
SOURCE: Pesaran et al. (2013).
Nissan Leafs in Arizona seem consistent with that observation (Gordon-Bloomfield, 2013). As a result, Nissan has tested new battery pack designs to address the observed problem (Gordon-Bloomfield, 2013).
Although Figure 8-10 illustrates preliminary results of studying the effect of temperature on battery capacity, battery life depends also on cycling at various depths of charge, rate of charge, and discharge, which are prevalent in commercial vehicle applications. Further experience in hot climates may be necessary to determine additional approaches for commercial vehicle use.
There are many requirements for battery use in medium- and heavy-duty commercial vehicles, compared to passenger cars and light-duty trucks, which must be addressed, including the following:
- Larger size with accompanying manufacturing complexity (number of welds),
- Higher power and associated cooling requirements,
- More demanding duty cycle,
- Higher annual mileage than typical passenger cars,
- Higher hours of usage than passenger cars,
- Higher number of charge/discharge cycles than light-duty vehicles,
- Harsher environment (temperatures, weather elements, shock/vibration, etc.),
- Higher sensitivity to total cost of ownership, and
- Higher manufacturing variability due to up-fitters, various bodies, and in-use requirements.
According to the National Renewable Energy Laboratory (NREL), the energy efficiency of PHEV and BEV passenger cars is approximately 200 to 400 Wh/mile, based upon vehicle weight, performance, aerodynamics, rolling resistance, etc.5 These parameters are characterized by
- Approximately 5 to 12 kWh usable battery capacity for 30 miles of electric driving,
- A 2-sec high-power performance of 30 to 60 kW, and
- A power/energy ratio from 1.0 to 12.0.
SOURCE: Howell et al. (2016).
___________________
5 K. Smith, S. Santhanagopalan, A. Pesaran, and K. Kelly, NREL, “Battery Technologies for Heavy Duty Electric Vehicles,” webinar to members of APTA, August 19, 2015.
By comparison, a medium- or heavy-duty vehicle will require energy efficiencies in the range of 1,000 to 2,000 Wh/mile. Likewise, the associated parameters would be
- More than 30 to 60 kWh usable battery capacity for 30 miles of electric driving;
- A 2-sec high-power performance of 60 to 150 kW or more;
- That volume, weight, and costs for such large systems are challenging; and
- That thermal management for high-power systems operating in commercial vehicles, especially in vocational vehicles, is also challenging.
A 40-ft bus for transit operation could have as much as a 320 kWh (total energy) battery system. Table 8-5 identifies some of the technical goals that have been guiding advanced battery technology development for light-duty vehicles in recent years. Significant progress has been made in achieving performance targets, while reducing the level of cooling and still achieving acceptable safety and durability. Figure 8-10 depicts the progress that has been made in several technical areas under the U.S. Department of Energy Vehicle Technologies Program related to batteries.
However, the technical focus has been directed toward increasing specific energy density and capacity of cells and packs associated with PHEV and BEV applications, including increasing the acceptable discharge level. This increases the available range of such plug-in vehicles, which is one of the major barriers to broad acceptance of such vehicles. This “range anxiety” was identified as major disadvantage in the report Overcoming Barriers to Deployment of Plug-in Electric Vehicles (NRC, 2015b).
Another very important factor for commercialization of both light-duty and commercial vehicle application of electrified propulsion systems is cost. The costs associated with traction motors, power electronics, and electrical accessories were discussed in Chapter 7 of this report.
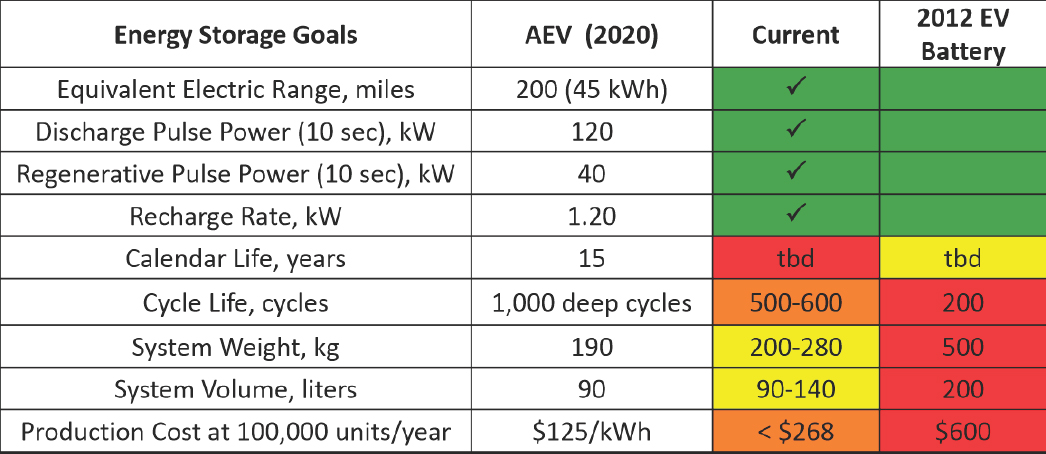
Figure 8-11 shows data concerning the evolution of Li-ion battery pack costs over the past 10 years. Also shown are future projections from various publications out to 2030. The figure references earlier targets identified by the U.S. Automotive Battery Consortium (USABC) (Table 8-6), which were about $150/kWh as a long-term goal for commercialization. However, more recent projections by USABC suggest that a cost of $125/kWh is achievable at the pack level ($100/kWh at the cell level). These targets are shown in Nykvist and Nilsson (2015).
TABLE 8-5 Technical Goals of Recent Light-Duty Vehicle Advanced Battery Technology Development
| DOE Energy Storage Goals | HEV | PHEV (2015) | EV (2020) | |
|---|---|---|---|---|
| PHEV-10 | PHEV-40 | |||
| Equivalent electric range (miles) | N/A | 10 | 40 | 200-300 |
| Discharge pulse power: 10 sec (kW) | 25 | 45 | 38 | 80 |
| Regen pulse power: 10 sec (kW) | 20 | 30 | 25 | 40 |
| Recharge rate (kW) | N/A | 1.4 | 2.8 | 5-10 |
| Cold crank power: -30°C/2sec(kW) | 5 | 7 | N/A | |
| Available energy (kWh) | 0.3 | 3.4 | 40 | |
| Calendar life (year) | 15 | 10+ | 10 | |
| Cycle life (cycles) | 300,000 (shallow) | 3,000-5,000 ( | eep) | 1,000 (deep) |
| Maximum system weight (kg) | 40 | 60 | 120 | 300 |
| Maximum system volume (l) | 32 | 40 | 80 | 133 |
| Operating temperature range (°C) | -30 to +52 | -30 to +52 | -40 to +85 | |
SOURCE: Howell and Elder (2011).
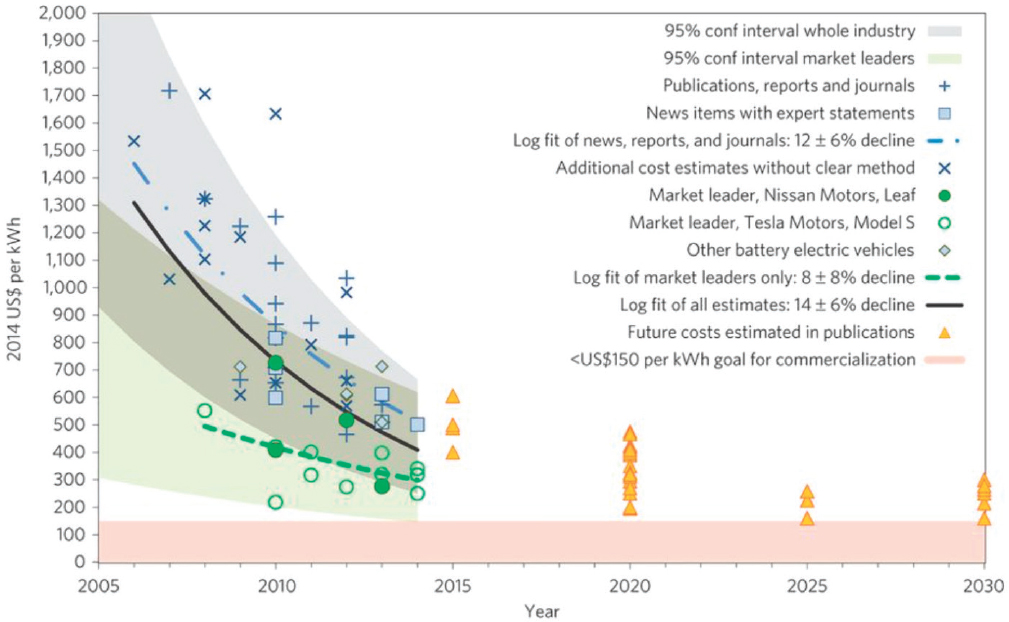
SOURCE: Nykvist and Nilsson (2015), reprinted by permission from RightsLink: Springer Nature, Nykvist & Nilsson, 2015.
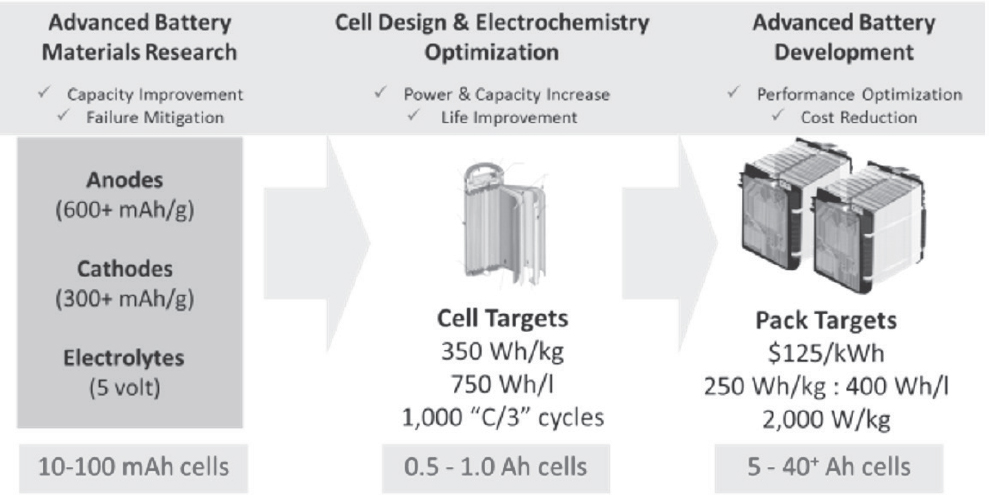
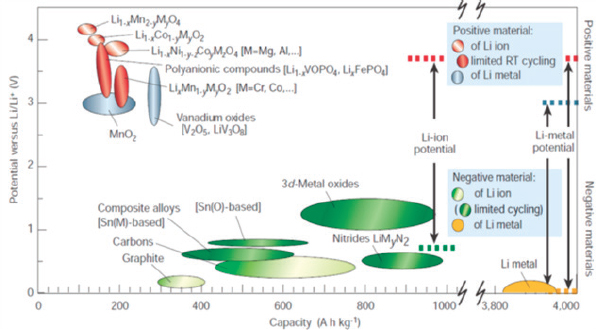
Figure 8-12 shows some technical breakdown of how the Department of Energy (DOE) and its research contractors envision steps to achieve further cost reduction, without compromising safety, reliability, useful life, or performance. However, for medium- and heavy-duty commercial vehicle applications, further development to address the power, functional, environmental, reliability, and cost issues for such applications is necessary. One major topic of interest for the development of commercial vehicle hybrid and electric propulsion systems is future battery chemistries which may address the functional and safety requirements for such vocational vehicles. Figure 8-13 provides a graphical representation of potential improvements in cell voltage and energy capacity which may be accomplished with new cathode and anode materials.
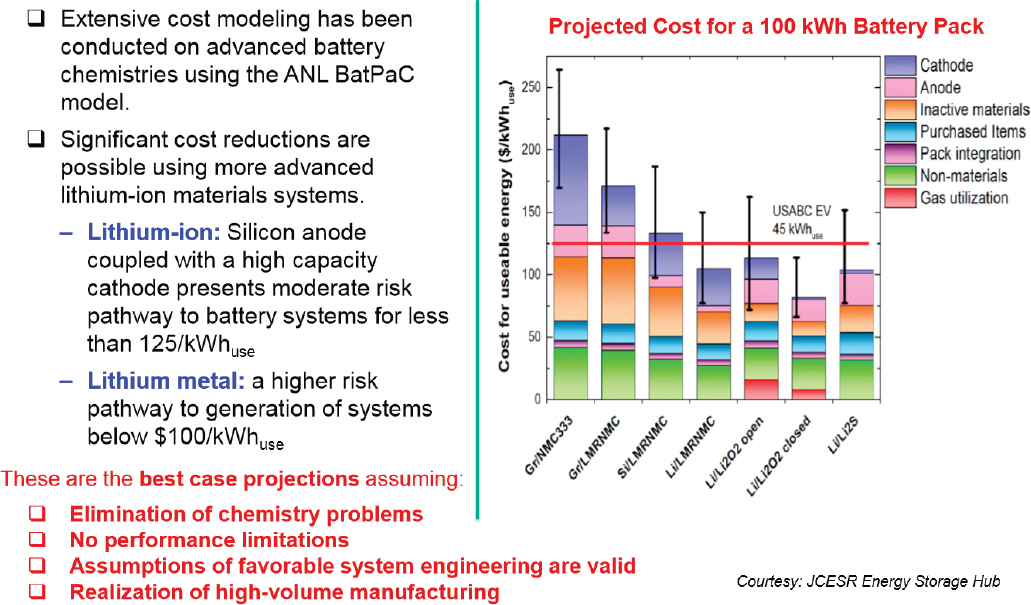
Figure 8-14 shows an exemplar cost breakdown for different advanced battery chemistries which could be utilized for further cost reduction, to levels of $100/kWh.
When parameters that are especially important for commercial vehicle application are considered, including safety, performance, reliability, and durability, graphite-LFP and LTO-NMC chemistries represent viable choices for commercial EVs in the foreseeable future, through about 2020. Figure 8-15 depicts the relative status of various aspects of different battery chemistries and their potential application in commercial vehicles, while Table 8-7 shows battery configurations currently offered by suppliers.
Graphite-LFP demonstrates a good compromise between these important parameters with high safety at a very competitive cost. LTO-NMC demonstrates the highest durability, excellent safety, and the highest charging rate and power, all of which are very important for commercial vehicle application. Therefore, despite a lower specific energy and higher cost, the durability, performance, and safety make LTO-NMC a viable option for commercial vehicles.
TABLE 8-6 USABC Goals for Advanced Batteries for 2020 EVs
| End-of-Life Characteristics at 30°C | Units | System Level | Cell Level |
|---|---|---|---|
| Peak discharge power density, 30 sec pulse | W/L | 1000 | 1500 |
| Peak specific discharge power, 30 sec pulse | W/kg | 470 | 700 |
| Peak specific regen power, 10 sec pulse | W/kg | 200 | 300 |
| Usable energy density @ C/3 discharge rate | Wh/L | 500 | 750 |
| Usable specific energy @ C/3 discharge rate | Wh/kg | 235 | 350 |
| Usable energy @ C/3 discharge rate | kWh | 45 | N/A |
| Calendar life | Years | 15 | 15 |
| DST cycle life | Cycles | 1000 | 1000 |
| Selling price @ 100K units | $/kWh | 125 | 100 |
| Operating environment | °C | -30 to +52 | -30 to +52 |
| Normal recharge time | h | <7 h, J1772 | <7 h, J1772 |
| High rate charge | min | 80% ΔSOC in 15 min | 80% ΔSOC in 15 min |
| Maximum operating voltage | V | 420 | N/A |
| Minimum operating voltage | V | 220 | N/A |
| Peak current, 30 s | A | 400 | 400 |
| Unassisted operating at low temperature | % | >70% usable energy @ C/3 discharge rate at -20°C | >70% usable energy @ C/3 discharge rate at -20°C |
| Survival temperature range, 24 h | °C | -40 to +66 | -40 to +66 |
| Maximum self-discharge | %month | <1 | <1 |
SOURCE: USABC (2017).
SOURCE: Howell (2014).
SOURCE: Tarascon and Armand (2001), reprinted by permission from RightsLink: Springer Nature, Tarascon & Armand, 2001.
SOURCE: Duong (2015).
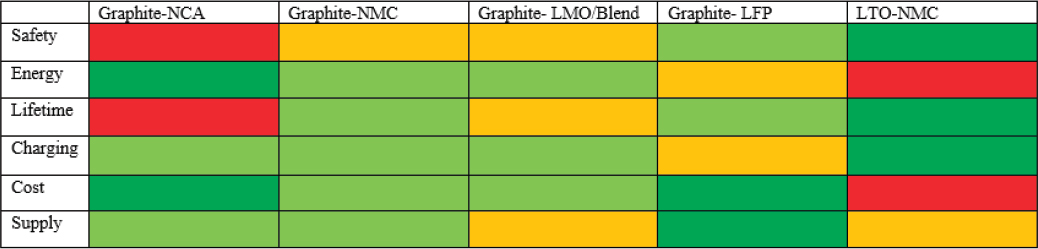
NOTE: red = poor, yellow = satisfactory, light green = good, and dark green = excellent.
SOURCE: Adapted from Kukkonen (2014).
8.4 FINDINGS
Finding: Spurred by increasing regulatory pressure for combustion-free transportation in many highly populated cities around the world, very significant research and development is being done to reduce the cost, increase the specific energy, and demonstrate sufficient safety of batteries over their useful life in PHEV and BEV passenger vehicles.
Finding: Several international passenger vehicle manufacturers and Tier 1 battery suppliers are projecting costs for PHEV/BEV battery packs that will achieve $120/kWh by 2020 and $100/kWh or less by 2025. At these cost levels, significant market growth with increasing levels of light-duty vehicle electrification can be expected worldwide by 2030.
Finding: As a result of the rugged use, high power, long life, and reliability requirements for commercial vehicles, the direct carryover of battery systems from light-duty vehicles will be limited. Additional research and development, beyond that which is being done for light-duty applications, will be necessary and could delay the market penetration of electrified commercial vehicles.
Finding: Due to the duty cycle, service life, and other boundary conditions for commercial vehicles, the battery-system costs are expected to decline significantly by 2030, but will remain somewhat higher than light-duty battery systems.
Finding: International regulatory incentives to promote combustion-free powertrain vehicle use in highly populated cities could support earlier introduction of electrified commercial vehicles than would normally occur in the technology and manufacturing cost development cycle.
8.5 RECOMMENDATIONS
Recommendation 8-1: EPA and the National Highway Traffic Safety Administration (NHTSA) should recognize the challenging performance, reliability, and safety requirements for commercial vehicles and coordinate with DOE, commercial battery suppliers, and international organizations to promote a timeline for development of battery chemistries and pack technologies which will allow the safe and efficient introduction of hybrid and all-electric drive of commercial vehicles, especially in highly-populated urban centers.
Recommendation 8-2: In recognition of the challenges associated with electrification of commercial vehicles, EPA and NHTSA should coordinate with U.S. and other international governmental bodies to assess the performance and safety progress of battery systems for use in commercial vehicles in an attempt to prevent forced early adoption which could result in poor reliability and safety performance and delayed market penetration.
TABLE 8-7 Battery Configurations Offered by Various Manufacturers
| Cell Maker | Chemistry Anode/Cathode | Capacity (Ah) | Configuration | Voltage (V) | Weight (kg) | Volume (l) | Energy Density (Wh/l) | Specific Energy (Wh/kg) | Used in Company | Model |
|---|---|---|---|---|---|---|---|---|---|---|
| AESC | G/LMO-NCA | 33 | Pouch | 3.75 | 0.80 | 0.40 | 309 | 155 | Nissan | Leaf |
| LG Chem | G/NMC-LMO | 36 | Pouch | 3.75 | 0.86 | 0.49 | 275 | 157 | Renault | Zoe |
| Li-Tec | G/NMC | 52 | Pouch | 3.65 | 1.25 | 0.60 | 316 | 152 | Daimler | Smart |
| Li Energy Japan | G/LMO-NMC | 50 | Prismatic | 3.7 | 1.70 | 0.85 | 218 | 109 | Mitsubishi | i-MiEV |
| Samsung | G/NMC-LMO | 64 | Prismatic | 3.7 | 1.80 | 0.97 | 243 | 132 | Fiat | 500 |
| Lishen Tianjin | G-LFP | 16 | Prismatic | 3.25 | 0.45 | 0.23 | 226 | 116 | Coda | EV |
| Toshiba | LTO-NMC | 20 | Prismatic | 2.3 | 0.52 | 0.23 | 200 | 89 | Honda | Fit |
| Panasonic | G/NCA | 3.1 | Cylindrical | 3.6 | 0.048 | 0.018 | 630 | 233 | Tesla | Model S |
Tesla-Panasonic’s current cell offers specific energy 50 percent higher than competition. This is primarily due to the use of highly reactive NCA cathodes and high-density electrodes. The gap will shrink to 20 to 25 percent in the next 3 years.
SOURCE: Anderman (2014).
TABLE 8-8 Component Costs of Hybrid Systems
| Battery Cells | Battery Pack | Power Electronics | Electric Motor | Light Heavy Duty (LHD) | Medium Heavy Duty (MHD) | Heavy Heavy Duty (HHD) | |||||||
|---|---|---|---|---|---|---|---|---|---|---|---|---|---|
| Class 2b-3 Specs | Class 2b-3 Cost | Class 4-5 Specs | Class 4 Cost | Class 5 Cost | Class 6-7 Specs | Class 6-7 Cost | Class 8 Specs | Class 8 Cost | |||||
| Micro-Hybrid with Stop-Start Low Cost | |||||||||||||
| 2015 $/kWh | $420.00 | $80.00 | 1.5 | $750.00 | 2.0 | $1,000.00 | $1,000.00 | 2.5 | $1,250.00 | 3.5 | $1,750.00 | ||
| 2022 $/kWh | $130.00 | $36.00 | 1.5 | $249.00 | 2.0 | $332.00 | $332.00 | 2.5 | $415.00 | 3.5 | $581.00 | ||
| 2030 $/kWh | $110.00 | $25.00 | 1.5 | $202.50 | 2.0 | $270.00 | $270.00 | 2.5 | $337.50 | 3.5 | $472.50 | ||
| 2015 $/kW | $12.00 | $18.00 | 10 | $300.00 | 15 | $450.00 | $450.00 | 20 | $600.00 | 35 | $1,050.00 | ||
| 2022 $/kW | $3.60 | $5.20 | 10 | $88.00 | 15 | $132.00 | $132.00 | 20 | $176.00 | 35 | $308.00 | ||
| 2030 $/kW | $3.30 | $4.70 | 10 | $80.00 | 15 | $120.00 | $120.00 | 20 | $160.00 | 35 | $280.00 | ||
| Rest of System | $140.00 | $260.00 | $280.00 | $300.00 | $500.00 | ||||||||
| 2015 Total Cost | $1,190.00 | $1,710.00 | $1,710.00 | $2,150.00 | $3,300.00 | ||||||||
| 2022 Total Cost | $477.00 | $724.00 | $744.00 | $891.00 | $1,389.00 | ||||||||
| 2030 Total Cost | $422.50 | $650.00 | $670.00 | $797.50 | $1,252.50 | ||||||||
| 2015 $/kWh | $420.00 | $80.00 | 1.5 | $750.00 | 2.0 | $1,000.00 | $1,000.00 | 2.5 | $1,250.00 | 3.5 | $1,750.00 | ||
| 2022 $/kWh | $140.00 | $40.00 | 1.5 | $270.00 | 2.0 | $360.00 | $360.00 | 2.5 | $450.00 | 3.5 | $630.00 | ||
| 2030 $/kWh | $125.00 | $25.00 | 1.5 | $225.00 | 2.0 | $300.00 | $300.00 | 2.5 | $375.00 | 3.5 | $525.00 | ||
| 2015 $/kW | $12.00 | $18.00 | 10 | $300.00 | 15 | $450.00 | $450.00 | 20 | $600.00 | 35 | $1,050.00 | ||
| 2022 $/kW | $4.50 | $6.50 | 10 | $110.00 | 15 | $165.00 | $165.00 | 20 | $220.00 | 35 | $385.00 | ||
| 2030 $/kW | $4.00 | $5.60 | 10 | $96.00 | 15 | $144.00 | $144.00 | 20 | $192.00 | 35 | $336.00 | ||
| Rest of System | $160.00 | $275.00 | $325.00 | $330.00 | $550.00 | ||||||||
| 2015 Total Cost | $1,210.00 | $1,725.00 | $1,775.00 | $2,180.00 | $3,350.00 | ||||||||
| 2022 Total Cost | $540.00 | $800.00 | $850.00 | $1,000.00 | $1,565.00 | ||||||||
| 2030 Total Cost | $481.00 | $719.00 | $739.00 | $897.00 | $1,411.00 | ||||||||
SOURCE: Committee generated estimates from the synthesis of its information gathering.
| Battery Cells | Battery Pack | Power Electronics | Electric Motor | Light Heavy Duty (LHD) | Medium Heavy Duty (MHD) | Heavy Heavy Duty (HHD) | |||||||
|---|---|---|---|---|---|---|---|---|---|---|---|---|---|
| Class 2b-3 Specs | Class 2b-3 Cost | Class 4-5 Specs | Class 4 Cost | Class 5 Cost | Class 6-7 Specs | Class 6-7 Cost | Class 8 Specs | Class 8 Cost | |||||
| Mild Hybrid with Regen/Launch and Stop-Start Low Cost | |||||||||||||
| 2015 $/kWh | $420.00 | $80.00 | 5 | $2,500.00 | 8 | $4,000.00 | $4,000.00 | 15 | $7,500.00 | 20 | $10,000.00 | ||
| 2022 $/kWh | $130.00 | $36.00 | 5 | $830.00 | 8 | $1,328.00 | $1,328.00 | 15 | $2,490.00 | 20 | $3,320.00 | ||
| 2030 $/kWh | $110.00 | $25.00 | 5 | $675.00 | 8 | $1,080.00 | $1,080.00 | 15 | $2,025.00 | 20 | $2,700.00 | ||
| 2015 $/kW | $12.00 | $18.00 | 60 | $1,800.00 | 120 | $3,600.00 | $3,600.00 | 200 | $6,000.00 | 200 | $6,000.00 | ||
| 2022 $/kW | $3.60 | $5.20 | 60 | $528.00 | 120 | $1,056.00 | $1,056.00 | 200 | $1,760.00 | 200 | $1,760.00 | ||
| 2030 $/kW | $3.30 | $4.70 | 60 | $480.00 | 120 | $960.00 | $960.00 | 200 | $1,600.00 | 200 | $1,600.00 | ||
| Rest of System | $850.00 | $2,200.00 | $2,200.00 | $3,600.00 | $5,000.00 | ||||||||
| 2015 Total Cost | $5,150.00 | $9,800.00 | $9,800.00 | $17,100.00 | $21,000.00 | ||||||||
| 2022 Total Cost | $2,208.00 | $4,584.00 | $4,584.00 | $7,850.00 | $10,080.00 | ||||||||
| 2030 Total Cost | $2,005.00 | $4,240.00 | $4,260.00 | $7,225.00 | $9,300.00 | ||||||||
| 2015 $/kWh | $420.00 | $80.00 | 5 | $2,500.00 | 8 | $4,000.00 | $4,000.00 | 15 | $7,500.00 | 20 | $10,000.00 | ||
| 2022 $/kWh | $140.00 | $40.00 | 5 | $900.00 | 8 | $1,440.00 | $1,440.00 | 15 | $2,700.00 | 20 | $3,600.00 | ||
| 2030 $/kWh | $125.00 | $25.00 | 5 | $750.00 | 8 | $1,200.00 | $1,200.00 | 15 | $2,250.00 | 20 | $3,000.00 | ||
| 2015 $/kW | $12.00 | $18.00 | 60 | $1,800.00 | 120 | $3,600.00 | $3,600.00 | 200 | $6,000.00 | 200 | $6,000.00 | ||
| 2022 $/kW | $4.50 | $6.50 | 60 | $660.00 | 120 | $1,320.00 | $1,320.00 | 200 | $2,200.00 | 200 | $2,200.00 | ||
| 2030 $/kW | $4.00 | $5.60 | 60 | $576.00 | 120 | $1,152.00 | $1,152.00 | 200 | $1,920.00 | 200 | $1,920.00 | ||
| Rest of System | $875.00 | $2,250.00 | $2,300.00 | $3,725.00 | $5,900.00 | ||||||||
| 2015 Total Cost | $5,175.00 | $9,850.00 | $9,850.00 | $17,225.00 | $21,900.00 | ||||||||
| 2022 Total Cost | $2,435.00 | $5,010.00 | $5,060.00 | $8,625.00 | $11,700.00 | ||||||||
| 2030 Total Cost | $2,201.00 | $4,602.00 | $4,652.00 | $7,895.00 | $10,820.00 | ||||||||
| Battery Cells | Battery Pack | Power Electronics | Electric Motor | Light Heavy Duty (LHD) | Medium Heavy Duty (MHD) | Heavy Heavy Duty (HHD) | |||||||
|---|---|---|---|---|---|---|---|---|---|---|---|---|---|
| Class 2b-3 Specs | Class 2b-3 Cost | Class 4-5 Specs | Class 4 Cost | Class 5 Cost | Class 6-7 Specs | Class 6-7 Cost | Class 8 Specs | Class 8 Cost | |||||
| HEV with Full Performance Low Cost | |||||||||||||
| 2015 $/kWh | $420.00 | $80.00 | 10 | $5,000.00 | 15 | $7,500.00 | $7,500.00 | 20 | $10,000.00 | 40 | $20,000.00 | ||
| 2022 $/kWh | $130.00 | $36.00 | 10 | $1,660.00 | 15 | $2,490.00 | $2,490.00 | 20 | $3,320.00 | 40 | $6,640.00 | ||
| 2030 $/kWh | $110.00 | $25.00 | 10 | $1,350.00 | 15 | $2,025.00 | $2,025.00 | 20 | $2,700.00 | 40 | $5,400.00 | ||
| 2015 $/kW | $12.00 | $18.00 | 180 | $5,400.00 | 220 | $6,600.00 | $6,600.00 | 250 | $7,500.00 | 300 | $9,000.00 | ||
| 2022 $/kW | $3.60 | $5.20 | 180 | $1,584.00 | 220 | $1,936.00 | $1,936.00 | 250 | $2,200.00 | 300 | $2,640.00 | ||
| 2030 $/kW | $3.30 | $4.70 | 180 | $1,440.00 | 220 | $1,760.00 | $1,760.00 | 250 | $2,000.00 | 300 | $2,400.00 | ||
| Rest of System | $1,850.00 | $3,000.00 | $3,000.00 | $4,500.00 | $5,500.00 | ||||||||
| 2015 Total Cost | $12,250.00 | $17,100.00 | $17,100.00 | $22,000.00 | $34,500.00 | ||||||||
| 2022 Total Cost | $5,094.00 | $7,426.00 | $7,426.00 | $10,020.00 | $14,780.00 | ||||||||
| 2030 Total Cost | $4,640.00 | $6,785.00 | $6,785.00 | $9,200.00 | $13,300.00 | ||||||||
| 2015 $/kWh | $420.00 | $80.00 | 10 | $5,000.00 | 15 | $7,500.00 | $7,500.00 | 20 | $10,000.00 | 40 | $20,000.00 | ||
| 2022 $/kWh | $140.00 | $40.00 | 10 | $1,800.00 | 15 | $2,700.00 | $2,700.00 | 20 | $3,600.00 | 40 | $7,200.00 | ||
| 2030 $/kWh | $125.00 | $25.00 | 10 | $1,500.00 | 15 | $2,250.00 | $2,250.00 | 20 | $3,000.00 | 40 | $6,000.00 | ||
| 2015 $/kW | $12.00 | $18.00 | 180 | $5,400.00 | 220 | $6,600.00 | $6,600.00 | 250 | $7,500.00 | 300 | $9,000.00 | ||
| 2022 $/kW | $4.50 | $6.50 | 180 | $1,980.00 | 220 | $2,420.00 | $2,420.00 | 250 | $2,750.00 | 300 | $3,300.00 | ||
| 2030 $/kW | $4.00 | $5.60 | 180 | $1,728.00 | 220 | $2,112.00 | $2,112.00 | 250 | $2,400.00 | 300 | $2,880.00 | ||
| Rest of System | $1,950.00 | $3,200.00 | $3,400.00 | $4,750.00 | $6,000.00 | ||||||||
| 2015 Total Cost | $12,350.00 | $17,300.00 | $17,500.00 | $22,250.00 | $35,000.00 | ||||||||
| 2022 Total Cost | $5,730.00 | $8,320.00 | $8,520.00 | $11,100.00 | $16,500.00 | ||||||||
| 2030 Total Cost | $5,178.00 | $7,562.00 | $7,762.00 | $10,150.00 | $14,880.00 | ||||||||
8.6 REFERENCES
Anderman, M. 2014. The Tesla Battery Report. Oregon House, CA: Total Battery Consulting, Inc. https://totalbatteryconsulting.com/industry-reports/Tesla-report/overview.html (accessed December 20, 2019).
Battery University. 2016. BU-205: Types of Lithium-Ion. Available at http://batteryuniversity.com/learn/article/types_of_lithium_ion (accessed July 25, 2019).
Duong, T.Q. 2015. “Overview and Progress of the Advanced Battery Materials Research (BMR) Program,” presentation for DOE Merit Review, June 8. Washington DC.
Gordon-Bloomfield, N. 2013. “Nissan Testing New Battery Pack to Address Problems with LEAF in Hot Weather.” Plug-in Cars, August 26. http://www.plugincars.com/nissan-testing-new-battery-pack-leaf-128088.html (accessed December 20, 2019).
Howell, D., and R. Elder. 2012. “Electrochemical Energy Storage Technical Team (EESTT),” presentation to the National Research Council’s Committee on Review of the U.S. DRIVE Partnership, January 26. Washington, DC.
Howell, D. 2014. “Overview of the DOE Advanced Battery R&D Program” presentation given by U.S. Department of Energy at 2014 DOE Hydrogen and Fuel Cells Program and Vehicle Technologies Office Annual Merit Review and Peer Evaluation Meeting. June 16. https://www.energy.gov/sites/prod/files/2014/09/f18/battery_rd_amr_plenary_june_2014_final.pdf (accessed December 20, 2019).
Howell D., B. Cunningham, T. Duong, and P. Faguy. 2016. “Overview of the DOE VTO Advanced Battery R&D Program,” presentation for DOE Merit Review, June 6. Washington, DC.
Kukkonen, S. 2014. “Current Trends in Battery Technology,” presented at Electric Commercial Vehicles National Seminar, September 24.
NRC (National Research Council). 2015a. Cost, Effectiveness, and Deployment of Fuel Economy Technologies for Light-Duty Vehicles. Washington, DC: The National Academies Press.
NRC. 2015b. Overcoming Barriers to Deployment of Plug-in Electric Vehicles. Washington, DC: The National Academies Press.
Nykvist, B., and M. Nilsson. 2015. Rapidly falling costs of battery packs for electric vehicles. Nature Climate Change 5:329-332.
Pesaran, A., S. Santhanagopalan, and G. Kim. 2013. “Addressing the Impact of Temperature Extremes on Large Format Li-Ion Batteries for Vehicle Applications.” Presented at the 30th International Battery Seminar, March 11-14, Fort Lauderdale, FL. Available at https://permanent.access.gpo.gov/gpo41672/58145.pdf (accessed September 23, 2019).
Spotnitz, R. 2005. “Advanced EV and HEV Batteries.” Presented at the 2005 IEEE Vehicle Power and Propulsion Conference, September, Chicago, IL. Available at http://ieeexplore.ieee.org/stamp/stamp.jsp?tp=&arnumber=1554579 (accessed August 25, 2019).
Steffke, K., S. Inguva, D. Van Cleve, and J. Knockeart. 2008. “Accelerated Life Test Methodology for Li-Ion Batteries in Automotive Applications.” SAE Technical Paper 2013-01-1548, doi:10.4271/2013-01-1548.
Tarascon, J.M., and M. Armand. 2001. Issues and challenges facing rechargeable lithium batteries. Nature 414:359-367.
Targray Technology International, Inc. 2017. Targray Cathode Materials for Battery Technologies. Available at http://www.targray.com/li-ion-battery/cathode-materials (accessed July 30, 2019).
USABC (U.S. Advanced Battery Consortium). 2017. USABC Goals for Advanced Batteries for EVs—CY 2020 Commercialization. Available through USCAR News center: https://www.uscar.org/guest/article_view.php?articles_id=85 (accessed September 23, 2019).
Wessler, G. (Duke SciPol). 2018. “Science Module: Energy Storage” available at http://scipol.duke.edu/content/science-module-energy-storage (accessed March 30, 2019).


