
9
Freight Operational Efficiency
This chapter discusses methods and technologies for improving the efficiency of freight operations that, loosely speaking, do not directly involve improving the efficiency of the vehicle powertrain. These methods entail improvements to freight efficiency through changes to trucking operations, such as those that involve the driver or through changing limits on truck size and weight. Also included is discussion of the impact on freight efficiency through use of other transportation modes, vessels, and conveyances.
9.1 METHODS TO IMPROVE MOVEMENT OF FREIGHT
Drivers face many challenges with respect to efficient movement of freight. A brief summary of these mechanisms includes the following:
- Driver’s Hours of Service per Federal Motor Carrier Safety Administration (FMCSA) requirements: At the end of 2015, FMCSA issued its proposed rule requiring the use of electronic logging devices. This will increase the already substantial penetration of on-board computers and will likely lead to operational improvements.
- Safety Inspections: State agencies and the FMCSA perform safety inspections on a random basis. Depending on the type of inspection, this can take from several minutes to over an hour to complete. If the vehicle can wirelessly provide information on its safety status, the number of physical inspections can be reduced while still accomplishing the needed safety audits. The PrePass system, a wireless intelligent transportation system service, has been enabling safety and weigh station inspection bypassing for well over a decade. FMCSA had a program for Wireless Roadside Inspection; however, it was ended, incomplete, in 2017.
- Weigh Stations: Various states monitor the weight of commercial vehicles on roads at weigh stations, frequently placed on major highways where traffic enters a state. PrePass and Drivewyze provide electronic verification, allowing bypassing of such stations via transponders or cell phones.
- Toll Booths: Eliminating the need to slow down, stop, or wait to pay tolls for bridges and tolled highways can improve average load-specific fuel consumption. E-ZPass is a network of automated collection of electronic tolls for the northeastern United States. Many such networks have been developed, and PrePass is now fully integrated with all E-ZPass roads.
- Border Crossings: Several sources provide real-time estimates and average wait times on border crossing delays. While the average delays to enter and leave Canada are typically less than 20 minutes, several of the United States–Mexico border crossings have average delays of over an hour (Calit2, 2016).
- Congestion: Congestion slows traffic down, often to stop-and-go, for miles. The amount of fuel used to accelerate and stop commercial vehicles can be minimized by reducing the amount of congestion that a commercial vehicle encounters by minimizing overall congestion, rerouting, and driving at alternative times.
- Accidents: The National Highway Traffic Safety Administration (NHTSA) tracks accident statistics, primarily as it relates to injuries and deaths. More recently, the impact of accidents on traffic congestion and fuel consumption has become important. Traveler information systems are providing information on accidents to eliminate additional accidents, relieve stress in drivers, and suggest alternate routes.
- Loading and Unloading: Additional driving hours are possible when the time to load and unload a vehicle is minimized. While there are limits on the number of hours for driving, there are also limits on the amount of time a driver is on duty. In some cases, driving time is impacted by waiting. Fleets work to minimize this lost time. Properly loading a trailer to maximize the load, in terms of both overall weight and volume, is a difficult challenge. Furthermore, it is constantly changing as new products and packaging are created. A primary requirement is to maintain legal weights on the axles that are properly spaced for whatever road requirements exist in the states being traveled. A second need is to maximize the amount of cargo in the trailer. Dry van trailers are used to transport items as diverse as square boxes on standardized pallets to axles for trucks at assembly plants, to full vehicles, such as race cars. A third requirement relates to how the product is configured on the trailer for loading and unloading. Some manufacturing operations expect the load on the trailer to be arranged in the sequence that the material will be used.
9.2 METHODS TO REDUCE DEADHEADING
Deadheading is the term used for a commercial vehicle moving without a load. After a load is delivered, the vehicle often has to move to another location to obtain a load to move. This is a significant number of miles in many cases. According to the American Trucking Associations (ATA), professional truck drivers cover more than 275 billion miles in a year (ATA, 2015a). Of those miles, 18 percent are non-revenue-generating miles according to surveys conducted annually by the American Transportation Research Institute (ATRI, 2014, 2015). While not new, improvements in load matching services may lead to a reduction in some of these miles.
Finding: The government and fleets are looking at numerous ways to keep commercial vehicles moving at highway speeds, while ensuring safety.
Recommendation 9-1: NHTSA should work more closely with the other parts of DOT to focus efforts on minimizing interruption of freight movements and encourage optimized loading.
9.3 METHODS TO IMPROVE DRIVER-VEHICLE INTERACTION
As discussed earlier in the section on transmissions, the driver plays a role in determining the fuel consumption of the vehicle. Fuel can be lost through unwanted manipulations of the throttle, unnecessary movements of the steering wheel, poor management of speed that causes excessive and hard braking, fast acceleration, and poor selection of gear for the powertrain and vehicle conditions, to name a few. Numerous suppliers of telematics and other driver interaction devices for commercial vehicles have done their own work to substantiate savings through eco-driver feedback. An example of one such system is SMARTDRIVE. Company information claims that the technology will significantly reduce collisions and will reduce fuel use by 10 percent. Recent studies by University of California, Riverside researchers found that providing real-time information to drivers can reduce fuel consumption by 3.5 to 7.5 percent (Jin et al., 2016; Scora et al., 2015). Driving more slowly is another method of improving fuel economy, and the anticipated FMCSA/NHTSA speed limiter regulation is expected to have a positive impact on this factor, removing it from the driver’s control to some extent.
As the FMCSA rule for electronic logging devices takes effect, the feedback to drivers on fuel consumption will improve. Furthermore, fleets will begin to have more real-time information for judging the effects of fuel. Some suppliers are including real-time information on loads, grades, road conditions, and weather to provide more reliable, achievable goals on fuel consumption improvements the driver can influence. Vehicle original equipment manufacturers (OEMs) are offering, via instrument clusters and in on-board computer systems, eco-driver feedback information to help them control fuel consumption.
The vehicle OEMs are working to minimize the effect of the driver on fuel consumption. They are implementing methods to control fuel during acceleration, increase the use of cruise control, and creating fuel-saving predictive cruise control products that anticipate fuel usage in order to optimize it. Semiautonomous and autonomous vehicles further decrease the driver influence on fuel consumption as well as impacting safety. The biggest gain in this area of driver-vehicle interactions may stem from idle reduction. In addition to state laws restricting idling, strong information campaigns linked with technology advances such as auxiliary power units, fuel-operated heaters, and electrification of accessories and appliances are significantly reducing idling.
Finding: Immediate feedback to the driver has been shown to be effective in getting fuel-conscious drivers to improve fuel consumption. Fleets provide economic incentives to drivers to get them to respond to the prompts.
Recommendation 9-2: NHTSA should work with FMCSA to complete additional research on driver influence on fuel consumption, taking into account the newer regulations for electronic logging devices, speed limiters, anti-idling technologies, and the introduction of technologies to reduce the driver influence on fuel consumption.
9.4 COUNTERVAILING FORCES TO FUEL CONSUMPTION REDUCTION
While the commercial vehicle freight market has a strong focus on improving costs and reducing fuel consumption, there is also a focus on customer satisfaction. This occurs especially in the areas of on-time delivery, just-in-time delivery, and line sequencing for assembly operations, to name a few. These countervailing forces tend to increase the number of trucks needed and to increase the amount of fuel used. For instance, just-in-time delivery often causes fleets to use trailers as warehouses to hold inventory close to an assembly operation. It also causes fleets to make sure they arrive early and that a driver is waiting to make the delivery. This can take away from valuable hours of service for the drivers. Furthermore, in some industries, the product on a trailer has to be loaded in an exact order to fit with the planned production at the consignee, such as an automotive assembly plant. This can reduce the amount of cargo the fleet is able to put on the trailer, to optimize the operation of the plant versus maximizing the load to be carried.
Several organizations are now pushing for faster delivery, sometimes as short as 1 to 2 hours in urban areas. These are small deliveries of restaurant food or consumer items, so the vehicles impacted will be medium-sized ones. However, this new delivery model increases the number of vehicles needed and those vehicles are far from optimally loaded. Drone deliveries have been proposed for these types of small deliveries in dense, urban areas. However, there are many issues to be addressed by the Federal Aviation Administration. Amazon, UPS, Workhorse, and many other companies are conducting tests of combination van and drone services, although it is not clear when or if these will be allowed.
Finding: Freight of all sorts is delivered to consignees for purposes that drive the timing and business model of shippers and brokers.
Recommendation 9-3: NHTSA should encourage the relevant government agencies, such as the Department of Transportation, the Environmental Protection Agency, and the Department of Energy, to monitor and assess new models for freight delivery that could impact fuel consumption and safety.
9.5 INTERMODAL SYSTEMS
“Intermodal” refers to the movement of freight among different modes of transportation, generally truck, rail, ocean, and inland waterways. While international intermodal is dominated by maritime-truck movements, domestic intermodal is almost exclusively truck-rail. It most often refers to movement of goods by rail and truck. Compared to historic truck-only supply chains and in particular tractor-trailer for longer routes or trucks for shorter ones, intermodal requires a major mode shift. This shift causes a movement of the freight itself or the container containing the freight to be moved onto a separate cargo-carrying vehicle. The advantage is that different, more efficient modes can be used for portions of the freight’s journey: ships for long sea travel, rail for longer land trips, and trucks on each end to most effectively reach the start and end of the route, a dock at a manufacturing site or a retail store on the other end. Many technologies, such as Global Positioning Systems (GPS) and freight tracking, help enable more efficient intermodal transportation of goods.
International intermodal refers to goods movement lanes that include ocean transportation and a port that transfers freight from a container ship to land transport, either directly onto rail or via truck drayage (very short-haul truck movements to the railyard) or to a longer truck move. Domestic intermodal, which has had and will likely continue to have higher growth rates, is one where the entire supply chain is in North America and where the growth comes from the addition of mode shifting from more traditional long-haul sleeper tractor single-mode moves. Goods movement in the United States over the past 60 years has been dominated by long-haul sleeper tractor moves as long as full coast-to-coast journeys. With higher fuel costs over the past 10 years, making part of this journey via rail has been considered an efficiency and an opportunity to cut costs.
9.5.1 Truck-Rail Intermodal Transport
Typical truck-rail intermodal movements involve freight moved by truck at the beginning and end of its trip and by rail over a long distance in the middle. Movement by rail is efficient due to its high ton-miles per gallon. A single locomotive can move a great deal of freight via many carloads with less overall energy, even though diesel fuel is predominately consumed. According to the Association of American Railroads, rail fuel efficiency in 2014 was 479 miles per gallon per ton (AAR, 2015). Historically, rail has been the primary solution for goods movement in the United States for bulk commodities such as grain, coal, and crude oil. These bulk commodities are sometimes referred to as “non-economically sensitive” because of their low value and also because deliveries are typically not time sensitive. As more goods have been hauled longer distances throughout the past 50 years, the movement of general freight—goods other than bulk commodities—has been moved more economically by rail for distances exceeding 2,000 miles. This was expanded with the development of containers in sizes commensurate with the needs of ocean and truck capabilities.
The most common challenges for shipping by rail are related to the fact that a mode shift must occur, as necessitated by the fact that railways do not generally go to the origin and destination of the freight. Technologies for rail intermodal moves have evolved over time and include trailer-on-flat-car moves in which a Class 8 trailer is placed on top of a rail car, container-on-flat-car, and increasingly double stacked containers, usually in well cars that are deep and offer stability, efficiency, and also security benefits because the well prevents the bottom trailers from being opened en route.
During the 1990s, just-in-time delivery of goods became a common and exploited inventory practice in the United States. The time sensitivity of freight became more important, a state of affairs that has created a head wind for movement to more domestic intermodal transport. Just-in-time manufacturing systems, such as the Toyota Manufacturing System, and warehousing infrastructure limit the ability to lengthen supply chain times. This has been a force keeping intermodal shipments low, though the size of the market has continued to expand slowly as technologies for managing the mode shifts have been improved.
Given domestic intermodal transport replaces part of the freight’s journey with rail in lieu of truck, the common decision-making aspect of this mode shift is the savings associated with moving part of the trip with more fuel efficient means—rail—with the increased cost of a mode shift, from truck on one end to another truck on the other and the risk of delay. Generally rail-truck delivery increases the time for the overall shipment. International and
domestic intermodal lanes are being served by expanding inland terminals (sometimes called inland ports or dry ports) in Atlanta, Chicago, Dallas, Kansas City, and other U.S. cities.
Capacity is an issue too. For example, the increases in oil and gas shipments have caused many delays over the past few years (Morris et al., 2014; Nixon, 2014). Adding capacity can be very expensive, requiring new tracks or modifying tracks, for example, lowering tracks along lines so that doubles can make it under bridges and into tunnels for capacity). Other infrastructure challenges are due to community and state involvement approvals, and long lead times for orders on new locomotives and rail cars. Rail regulations are also an issue. Adding weight for safer tanker cars, potentially lower speed limits, and increasing crew numbers are all under consideration and would have a negative effect on capacity.
Normal economic cycles may stall investment and actions to rationally exploit the opportunities for rail freight in the long-haul sector, which has historically favored trucking. Many shippers see rail as unreliable for time-sensitive general freight. Inland terminals in high-congestion cities, such as Atlanta and Chicago, present challenges which delay truck traffic in and out of the terminals. But the industry is responding by investing in new locomotive technologies, railcars, and other rail infrastructure in an effort to raise capacity and efficiency. However, capitalizing on these investments will require significant time and money. The industry is also responding to a reduction in demand for coal movements by increasing services for moving natural gas and crude oil. Trucking companies such as JBHunt, Schneider, CR England, FedEx, and UPS continue to increase their presence in intermodal transport through ownership of containers and chassis and improvements in logistics management. Costs appear to be improving with the movement of some shorter hauls being moved to intermodal transport. The rail industry claims that less than 1,000 miles and even down to 500 miles will become efficient for a shift to rail. However, with the movement to lower miles, the mode-shift cost accounts for a much higher portion of the overall time and labor cost for intermodal freight.
The truck driver shortage will continue to limit long-haul trucking capacity increases in the future. (Interestingly, there is evidence that drivers of less-than-load have far lower turnover.) (O’Marah, 2016) Moving freight to rail would reduce the need for truck drivers which will be increasingly important because many older drivers are retiring and the newer drivers are less willing to spend days or weeks on the road. The ATA estimates that there was a shortage of 48,000 drivers in 2015 and that the number could be as high as 175,000 by 2024 (ATA, 2015b).
Efficiencies can be improved at intermodal terminals. GPS and autonomous movement of containers by cranes, trucks, and dollies can improve times. Tracking of freight, containers, chassis, and pallets and individual orders can help with the reliability of the intermodal moves. Eastern U.S. ports are increasing their capacity by dredging to accept bigger ships that will be allowed with the expansion of the Panama Canal. Increasing capacity of lifts and moves within all terminals continues.
Finding: A long-term collaborative effort to optimize intermodal movements could help reduce transportation costs and fuel consumption. This is a system issue, though, and one that requires dedication to a long-term strategy with many stakeholders, many of whom consider each other competitors more than collaborators.
9.5.2 Truck-Truck Intermodal Transport
A solution that has been considered for nearly half a century, but which is gaining popularity in the United States and abroad, is the development of inland ports (often called freight villages) which allow for the transfer of loads from long-distance vehicles to smaller regional or urban vehicles (see, for example, Russo et al., 2015; Viscelli, 2014; Wu and Haasis, 2013).
These moves are truck-truck domestic intermodal moves. Improvements to the efficiency of long-haul sleeper tractors and trailers via aerodynamics, rolling resistance, and powertrains optimizes them for highways. Without the requirement to enter congested cities, technologies such as aggressive aerodynamics, platooning, and others become more realistic. The congestion in urban areas causes trucks to sit at low speeds around cities, where they operate inefficiently. Truck parking for mandatory rest periods can be more difficult to find in urban areas as well. As a result, trucks often overnight outside the urban area and subsequently travel into these areas during congested periods. Allowing drivers to drop their trailers on the outskirts of large cities and head back out on the open road
allows these tractors to operate more efficiently. Inside the city, the freight is moved by more highly maneuverable tractors, alternatively fueled, hybridized, etc., more specifically designed for a stop-start urban environment. Conflicts between urban freight facilities and other land uses have also been encountered. Therefore, the planning and development of these types of facilities needs to address both the opportunities and the challenges.
Finding: The development of freight transfer facilities near urban areas will increase the use of more agile, fuel efficient, and less polluting vehicles for “last-mile” freight movements.
9.5.3 Inland Waterway Transport
Inland water transportation is used mainly for bulk commodities such as petroleum and chemicals, coal, grain, and soybeans. While an important component of the overall freight transportation system, the share of freight moving on rivers will continue to be very small.
9.5.4 Drayage
Drayage is the movement of goods short distances to enable a mode shift in international or domestic intermodal transport. Historically, these moves were made with older trucks that have been taken out of long-haul service. However, the Environmental Protection Agency and local air quality regulations have recently required newer and much cleaner trucks to be adopted for drayage (for example, in the Ports of Long Beach and Los Angeles). A few active development, test, and deployment projects have emerged to support technologies to limit the emissions around these drayage routes. The 710 corridor set of projects in the Long Beach, California, area includes technologies such as all-electric trucks, catenary trucks (Impullitti, 2012), and other zero emission ideas.
The costs of implementing these technologies remain very high, and constraints on capacity in high-volume freight corridors limit the extent to which right of way can be dedicated to clean corridor projects. And the cost to produce a tractor specific for the routes could price these as much as an order of magnitude higher than the older Class 8 tractors currently in use.
Finding: The successful implementation of clean corridors will require incentives at the federal, state, and local levels for development of the necessary technologies.
9.6 SIZE AND WEIGHT CHANGES (VEHICLE-MILES-TRAVELED REDUCTION)
The discussion in this section was adapted, with permission of the author, from a recent Transportation Research Board paper (Woodrooffe, 2016) which features a much more detailed discussion and analysis.
Size and weight regulation defines the upper limit of both low- and high-density freight vehicle efficiency. In doing so, these regulations have direct influence on how trucks use infrastructure and contribute to the wear and tear of infrastructure, use fuel, produce emissions, and influence crash frequency. There is considerable evidence that the reduction in vehicle miles traveled that would result from more closely aligning U.S. regulations with those of our North American Free Trade Agreement (NAFTA) partners would more than make up for any additional danger to passenger car drivers and vulnerable road users that might result from longer and heavier vehicles. For the magnitude size and weight increase required to harmonize the NAFTA region, there is no evidence that such vehicle units pose additional threat to public safety (OECD, 2010).
Size and weight policy is not uniform across the United States. Both the federal and state governments have their own policies that apply to roads under their respective authority. For example, state roads are governed by individual state policies while Interstate and National Network facilities are governed by federal law. However, the federal law is not absolutely uniform in terms of vehicle weight. While the stated allowable gross vehicle weight (GVW) on the Interstate System is restricted to 80,000 pounds (36,300 kilograms [kg]), grandfather rights were given to states that had higher weights than federal law at the time of creation of the Interstate Highway Program in 1956. Michigan is a case in point where trucks can operate up to 164,000 pounds (74,400 kg) on the Interstate
System provided they have a sufficient number of axles to comply with Michigan size and weight policy (FHWA, 2016).
More than a dozen states have gross vehicle weight limits on state roads that exceed the limits on the Interstate and other national truck network routes, and many more states have commodity- or industry-specific exemptions that allow even higher truck weights on specific routes. This patchwork of truck size and weight limits presents challenges for interstate trucking operations as well as for public regulation of the trucking industry. Economies are regional and normally require operations across multiple state boundaries. For example, sugar beet growers operate trucks daily across the border between Minnesota and the Dakotas, but Minnesota has lower truck weight limits than the Dakotas, so carriers must break their loads into smaller units when they cross the state border into Minnesota. This drives up the cost of operations for truckers and contributes to suboptimal transport efficiency.
The Surface Transportation Assistance Act (STAA) of 1982 effectively froze size and weight limits on the National Network, limiting vehicle weight to 80,000 pounds (36,300 kg) and limiting so-called longer combination vehicles (LCVs) to twin 28 ft (8.5 m) trailers known as STAA doubles.1 The freeze was put in place at a time when there was great uncertainty regarding size and weight policy reform and at the time legislators were understandably cautious. However, since then, other countries have increased size and weight limits in what may be seen as a move to balance infrastructure consumption with vehicle productivity and safety, thereby making substantial improvements in transportation efficiency.
9.6.1 International Comparison
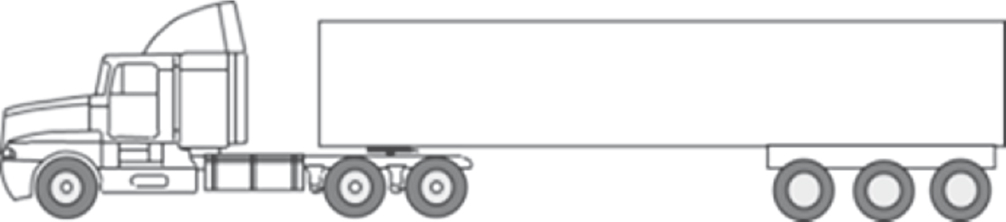
Compared with other industrialized countries, national weight limits in the United States are significantly lower. Table 9-1 provides detail on axle weights and GVW permitted for the common tractor semitrailer (OECD, 2010; Woodrooffe et al., 2010). U.S. federal size and weight regulations do not recognize the tridem axle group required for the six-axle tractor semitrailer, shown in Figure 9-1. Therefore, productivity comparisons were made based on the U.S. 80,000 pound (36,360 kg) five-axle tractor semitrailer against other countries’ six-axle tractor semitrailer. These vehicles represent the so-called workhorse tractor semitrailer of each country. Productivity was determined by subtracting an estimated tare (empty) weight of 36,400 pounds (16,500 kg) for six-axle tractor semitrailers from the maximum GVW to resolve the allowable cargo weight and then comparing this to the five-axle U.S. tractor semitrailer assuming a lower tare weight of 34,200 pounds (15,500 kg) to account for one less axle.
Uniformity of size and weight regulations in countries separated by oceans, such as the European Union and North America, is not as critical as those sharing a continent. Figure 9-2 shows the diversity of permitted vehicle weights for the signatories of NAFTA: Canada, Mexico, and the United States. The 80,000 pounds (36,300 kg)
TABLE 9-1 Comparative International Tractor Semitrailer Axle Weight Limits, GVW, and Productivity
| Country | Steer | lb (kg) | Drive | lb (kg) | Tridem | lb (kg) | GVW | lb (kg) | Productivity Advantage |
|---|---|---|---|---|---|---|---|---|---|
| Mexico | 14,300 | (6,500) | 43,000 | (19,500) | 49,600 | (22,500) | 106,900 | (48,500) | 53% |
| Denmark | 17,600 | (8,000) | 35,300 | (16,000) | 52,900 | (24,000) | 105,800 | (48,000) | 51% |
| Canada | 12,100 | (5,500) | 37,500 | (17,000) | 52,900 | (24,000) | 102,500 | (46,500) | 44% |
| Australia | 14,300 | (6,500) | 37,500 | (17,000) | 49,600 | (22,500) | 101,400 | (46,000) | 41% |
| UK | 14,300 | (6,500) | 35,300 | (16,000) | 47,400 | (21,500) | 97,000 | (44,000) | 32% |
| USA | 12,000 | (5,500) | 34,000 | (15,400) | 34,000a | (15,400)a | 80,000 | (36,300) | -- |
NOTE: Most of the axle weight values listed above are legal limits but some are approximate as higher axle weight may be permitted but the vehicle GVW is limited. This is the case for the UK and Mexico.
aThe United States does not have weight standards specified beyond tandem axles, so the tridem weight limit is the same as for the tandem, 34,000 pounds.
SOURCE: OECD (2010), Woodrooffe et al. (2010).
___________________
1 97th Cong., P.L. 97-424 (1983).
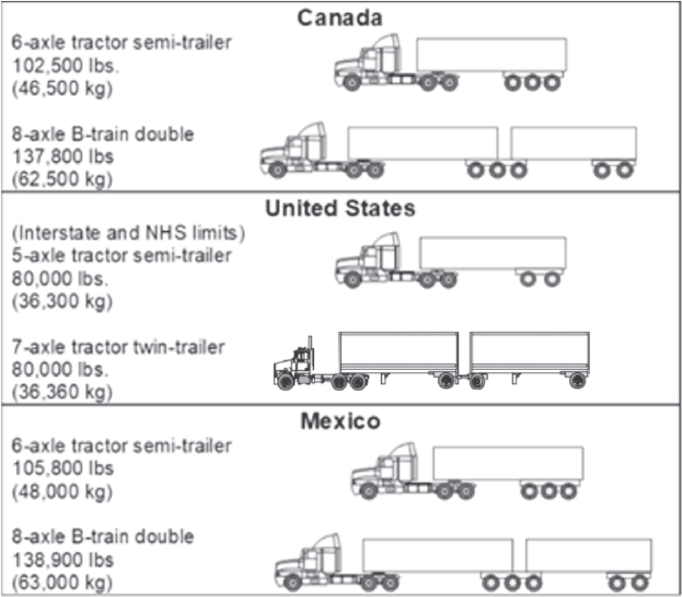
U.S. federal size and weight limit greatly restricts the ability to move mass-limited freight through the region efficiently. For tractor semitrailers, U.S. carriers are disadvantaged by 44 to 53 percent based on available cargo mass capacity, and for double trailer combinations, they are disadvantaged by a factor of 2. The 80,000 pound (36,360 kg) U.S. GVW limit represents a bottleneck for mass-limited freight moving within the NAFTA region, which has freight efficiency and societal cost implications for all NAFTA partners.
9.6.2 Longer Combination Vehicles
Transportation of low-density freight benefits from longer trucks with multiple trailers (LCVs). An example of an LCV combination is a tractor pulling two 53-foot (16.2 m) trailers. Because of their length, these vehicles are often restricted to certain road classes having geometric design characteristics that are compatible with LCVs. In some jurisdictions, LCVs operate under a special permit program governed by strict operating conditions. The structure and enforcement mechanisms engender a level of safety consciousness within the LCV fleet that far exceeds that found in other vehicle classes (Woodrooffe et al., 2004). Canada has developed unique policies with
respect to the operation of LCVs and select provinces use a performance-based standard to approve candidate vehicles. The provinces of Alberta and Ontario have developed policy governing LCV movements so as to reduce high-risk travel of the LCV fleet (Alberta Government, 2015). This is done by restricting movement during peak congestion hours, public holidays, and inclement weather. The safety performance of the Alberta LCVs was found to be on the order of three to five times better than the standard tractor-semitrailer fleet operating on identical roads (crashes, fatalities, and injuries per distance traveled) (Montufar et al., 2007; Woodrooffe et al., 2010).
9.7 SOCIETAL VALUE OF FREIGHT EFFICIENCY IMPROVEMENT
To obtain a rough estimate of the societal opportunity costs from improvements in freight efficiency, a recent study (Woodrooffe, 2014) used aggregated fuel use by vehicle class and applied carbon value analysis to estimate the savings that would accrue from an improvement in freight efficiency that results in reduced total truck travel distance. The study noted that the contributing strategies that influence truck transport efficiency include improved loading of the existing truck fleet; increased use of other modes, particularly rail transport, though increased intermodal capacity; and, most importantly, reforming truck size and weight policy with the intended goal of reducing total truck travel distance through consolidation of the freight task. The degree to which truck transportation efficiency can be improved was found to depend on many factors, including the amount by which policy makers might wish to extend truck size and weight limits. This makes forecasting freight efficiency improvement difficult and somewhat speculative. Therefore, rather than projecting what the magnitude of freight efficiency improvement might be for any number of options and assumptions, the study looked at what a goal of 10 percent reduction in truck travel distance from transport efficiency improvements would generate in societal benefit. Estimates of benefits associated with safety, emissions, and fuel are provided in Table 9-2. The total estimated benefit for a 10 percent reduction in truck miles traveled is approximately $16 billion annually.
A further category of benefits that might accrue from reducing truck miles traveled is the reduction in fuel and CO2 emissions. In the United States, single-unit trucks consume approximately 54.1 billion liters of diesel fuel and produce approximately 144 million metric tons of CO2 annually. Articulated vehicles, largely five-axle tractor-semitrailers, use approximately 106 billion liters of fuel per year and generate approximately 283 million metric tons of CO2 per year (FHWA, 2015a). Both the single-unit truck and the articulated vehicles will benefit from improved loading and reduced logistics costs. Articulated vehicles will also benefit from size and weight regulation reform while single-unit trucks are less likely to; however, there would be some diversion for single-unit truck freight to more productive tractor-semitrailers.
Finally, improvements in freight efficiency through various means including size and weight reform would likely have an added net safety benefit because the reduced amount of truck travel through improved truck cargo capacity would result in proportionately fewer truck crashes and that reduction would likely dominate negative safety consequences per distance traveled associated with increased vehicle size and weight. The recently completed U.S. size and weight study was unable to predict, with confidence, the likely safety outcome associated with particular larger heavier vehicle scenarios due to a lack of data (FHWA, 2015b). However, direct international experience with such vehicles has not found a substantive negative relationship between GVW and crash rate provided the vehicles comply with regulations (OECD, 2010; Woodrooffe, 2001). Insight into the potential truck efficiency improvement that could be gained from U.S. size and weight policy reform in line with NAFTA partners is that the improvement in freight efficiency would likely be in the range of 10 to 15 percent (Woodrooffe et al., 2009).
Finding: Higher weight limits and longer combination vehicles could significantly improve the productivity and therefore reduce the overall distance traveled in the heavy-vehicle long-haul transportation sector.
Recommendation 9-4: NHTSA and the U.S. Department of Transportation should consider urging Congress to adopt size and weight regulations that are in line with those of other North American trade partners.
TABLE 9-2 Estimated Reduction in the Number of Victims, Fuel Use, Greenhouse Gas Emissions, and Associated Opportunity Cost When Truck Exposure Is Reduced by 10 Percent
| Benefits Study Variable | Injury Severity | Reductions Assuming 10% Reduction in Exposure | Estimated Annual Benefits ($US billion) |
|---|---|---|---|
| Estimated safety benefits attributed to a 10% reduction in truck travel distance | No apparent injury | 21,562 | 0.20 |
| Possible injury | 2,929 | 0.44 | |
| Evident injury | 2,724 | 0.68 | |
| Disabling injury | 1,453 | 0.87 | |
| Killed | 330 | 2.54 | |
| Total safety cost saving attributed to 10% reduction in exposure | 4.73 | ||
| Estimated fuel and emissions benefits attributed to a 10% reduction in truck travel distance | Category | Quantity saved | Annual cost saving ($US billion) |
| Diesel fuel reduction | 10.6 billion liters | 10.60 | |
| CO2 reduction | 28.3 million metric tons CO2 | 0.680 | |
| Combined benefits | Total estimated annual savings | 16.01 | |
SOURCE: Woodrooffe et al. (2009).
9.8 REFERENCES
AAR (Association of American Railroads). 2015. Rail Intermodal Keeps America Moving. https://www.aar.org/BackgroundPapers/Rail%20Intermodal.pdf (accessed June 5, 2016).
Alberta Government. 2015. Conditions for the Operation of Long Combination Vehicles. Version 5.05. http://www.transportation.alberta.ca/Content/docType276/Production/lcv.pdf (accessed December 16, 2019).
ATA (American Trucking Associations). 2015a. Trucking Moves America Forward: Professional Truck Drivers. http://www.trucking.org/ata%20docs/what%20we%20do/image%20and%20outreach%20programs/misc%20documents/pro%20Truck%20Drivers_final.pdf (accessed December 16, 2019).
ATA. 2015b. Truck Driver Shortage Analysis. http://www.trucking.org/ATA%20Docs/News%20and%20Information/Reports%20Trends%20and%20Statistics/10%206%2015%20ATAs%20Driver%20Shortage%20Report%202015.pdf (accessed December 16, 2019).
ATRI (American Transportation Research Institute). 2014. An Analysis of the Operational Costs of Trucking: A 2014 Update. http://www.atri-online.org/wp-content/uploads/2014/09/ATRI-Operational-Costs-of-Trucking-2014-FINAL.pdf (accessed December 16, 2019).
ATRI. 2015. An Analysis of the Operational Costs of Trucking: A 2015 Update. http://atri-online.org/wp-content/uploads/2015/09/ATRI-Operational-Costs-of-Trucking-2015-FINAL-09-2015.pdf (accessed December 16, 2019).
Calit2. 2016. Best Time to Cross the Border. http://traffic.calit2.net/border/border-crossing-wait-times.php# (accessed April 4, 2016).
FHWA (Federal Highway Administration). 2015a. Modal Shift Comparative Analysis Technical Report, Comprehensive Truck Size and Weight Limits Study. http://ops.fhwa.dot.gov/freight/sw/map21tswstudy/technical_rpts/mscanalysis.pdf (accessed December 16, 2019).
FHWA. 2015b. Highway Safety and Truck Crash Comparative Analysis Technical Report, Comprehensive Truck Size and Weight Limits Study. http://ops.fhwa.dot.gov/freight/sw/map21tswstudy/technical_rpts/hstcanalysis.pdf (accessed December 16, 2019).
FHWA. 2016. Compilation of Existing State Truck Size and Weight Limit Laws. http://ops.fhwa.dot.gov/FREIGHT/policy/rpt_congress/truck_sw_laws/app_a.htm#mi (accessed May 9, 2016).
Impullitti, J. 2012. Mobile Source Zero Emission Catenary Truck Project. South Coast Air Quality Management District Clean Fuels Program Advisory Group, August 29, Diamond Bar, CA. http://www.aqmd.gov/docs/default-source/technology-research/clean-fuels-program/clean-fuels-program-advisory-group---august-29-2012/mobile-source-zero-emission-catenary-truck-project.pdf?sfvrsn=6 (accessed April 6, 2016).
Jin, Q., K. Boriboonsomsin, and M. Barth. 2016. Energy and Emissions Benefits of a Real-Time Driving Speed Advisory System for Heavy-Duty Trucks, No. 16-6008. In Transportation Research Board Annual Meeting Compendium of Papers. Transportation Research Board, Washington, DC, January 10-12.
Montufar, J., J. Regehr, G. Rempel, and R.V. McGregor. 2007. Long Combination Vehicle (LCV) Safety Performance in Alberta: 1999-2005. http://www.transportation.alberta.ca/Content/docType61/production/LCVFinalReport2005.pdf (accessed December 16, 2019).
Morris, B., J. Bunge, and J.W. Miller. 2014. Surge in rail shipments of oil sidetracks other industries. Wall Street Journal, March 13. http://www.wsj.com/articles/SB10001424052702304914904579437680173044774 (accessed May 9, 2016).
Nixon, R. 2014. Grain piles up, waiting for a ride, as trains move North Dakota oil. New York Times, August 25. http://www.nytimes.com/2014/08/26/us/grain-piles-up-waiting-for-a-ride-as-trains-move-north-dakota-oil.html (accessed May 9, 2016).
OECD (Organisation for Economic Co-operation and Development). 2010. Moving Freight with Better Trucks. International Transport Forum, Leipzig, Germany, May 26-28.
O’Marah, K. 2016. Truck driver shortage is a shortage of imagination. Forbes, September 1. https://www.forbes.com/sites/kevinomarah/2016/09/01/truck-driver-shortage-is-a-shortage-of-imagination/#73a1fde41d7e (accessed November 8, 2017).
Russo, F., C. Rindone, P. D’Agostino, C. Lanciano, and T. Scattarreggia. 2015. A city logistics system for long distance freight transport provisioning. In Urban Transport XXI, edited by C.A. Brebbia and J.L. Miralles I Garcia, pp. 279-290. Southampton, UK: WIT Press.
Scora, G., K. Boriboonsomsin, and M. Barth. 2015. Value of eco-friendly route choice for heavy-duty trucks. Research in Transportation Economics 52:3-14.
Viscelli, S. 2014. Urban Truck Ports, White Paper. http://media.wix.com/ugd/10984e_c38fde52fd804389bd4e94a55abe34a0.pdf (accessed December 16, 2019).
Woodrooffe, J. 2001. Long Combination Vehicle Safety Performance in Alberta 1995 to 1998. http://www.transportation.alberta.ca/Content/docType61/production/LCVSafetyPerformanceReport.pdf (accessed December 16, 2019).
Woodrooffe, J. 2014. Reducing Truck Fuel Use and Emissions: Tires, Aerodynamics, Engine Efficiency, and Size and Weight Regulations. University of Michigan Transportation Research Institute Report 2014-27. Ann Arbor, MI.
Woodrooffe, J. 2016. Opportunity cost for society related to US truck size and weight regulation: Freight efficiency. Transportation Research Record: Journal of the Transportation Research Board 2547:25-31. doi: 10.3141/2547-04.
Woodrooffe, J., D. Anderson, and L. Ash. 2004. The Influence of Policy on Crash Rates of Long Combination Vehicles. Presented at the 8th International Symposium on Heavy Vehicle Weights & Dimensions, Muldersdrift, Gauteng, South Africa, March 14-18.
Woodrooffe J., B.M. Belzowski, J. Reece, and P.F. Sweatman. 2009. Analysis of the Potential Benefits of Larger Trucks for U.S. Businesses Operating Private Fleets. University of Michigan Transportation Research Institute Report 2009-11. Ann Arbor, MI.
Woodrooffe, J., K.P. Glaeser, M. Bereni, A. Germanchev, P. Eady, B. Jacob, and P. Nordengen. 2010. Safety, Productivity, Infrastructure Wear, Fuel Use and Emissions Assessment of the International Truck Fleet-A Comparative Analysis. OECD International Transport Forum, Leipzig, Germany, May 26-28.
Wu, J., and H.-D. Haasis. 2013. Converting knowledge into sustainability performance of freight villages. Logistics Research 6(2-3):63-88.


