
4
Powertrain Technologies
4.1 INTRODUCTION
The powertrain is the engine plus the drivetrain which kinematically couples it to the wheels. The internal combustion engine (ICE) is the dominant prime mover for medium- and heavy-duty vehicles (MHDVs). For definition, ICEs encompass all configurations of piston engines, both reciprocating piston and rotary, and even gas-turbine vehicle engines. Four-stroke (or four-cycle) reciprocating piston engines are the prevailing configuration, and the Environmental Protection Agency (EPA) and the National Highway Traffic Safety Administration (NHTSA) in forming the Phase II rule have not anticipated a change. A key question the National Academies of Sciences, Engineering, and Medicine committee is reviewing is whether there will be developments or circumstances that would cause a shift from diesel to other engine types. Additionally, the committee is addressing whether there are emerging technology developments that would be game changers for diesels as well as other engine categories. Examples would include new materials and manufacturing methods, and new chemistries or catalysts for aftertreatment systems. Changes in emissions regulations and fuels could also cause a shift in greenhouse gas (GHG) potential or market preference among engine configurations. In addition to discussing improvements in the efficiency of the prime mover—whether diesel, gasoline, or other concept—this chapter discusses the transmission and drivelines and the changes in those technologies. (Electric drive, for which centralized electric power generating stations are the prime mover, and hybrid configurations are discussed in Chapter 7.)
Internal combustion engines using reciprocating pistons can be described as using any of three overall categories of combustion (Figure 4-1):
- Spark-ignition (SI) engines where the combustion process is dominated by flame propagation in a mostly premixed fuel-air mixture;
- Compression-ignition engines where the combustion is dominated by diffusion burning with start of combustion strongly influenced by timing of fuel injection; and
- Compression ignition where chemical kinetics dominate the combustion process. Examples here would include homogenous charge compression ignition (HCCI) and partially premixed combustion—often called low-temperature combustion because dilution by air or exhaust gas is usually significant.
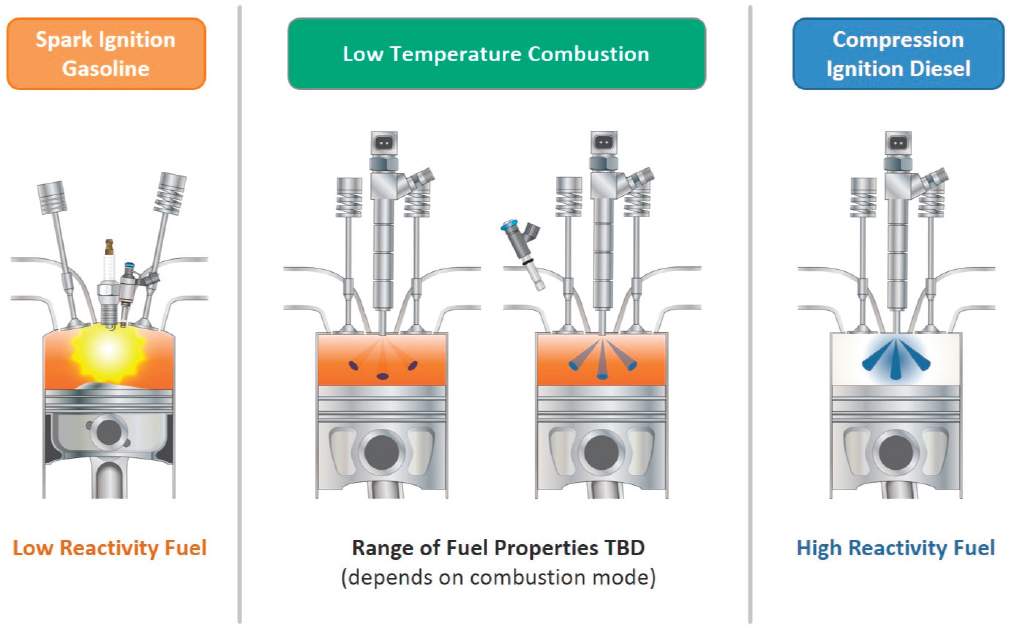
SOURCE: Wagner (2015).
Gas turbine combustion engines use a quite different combustion system and are reviewed in a separate section. External combustion engines, such as Stirling, Rankine, and Brayton closed-cycle heat engine cycles, are presently not used in road vehicles as prime movers, but find application as waste-heat recovery systems.
4.2 MARKET TRENDS IN ENGINE USE
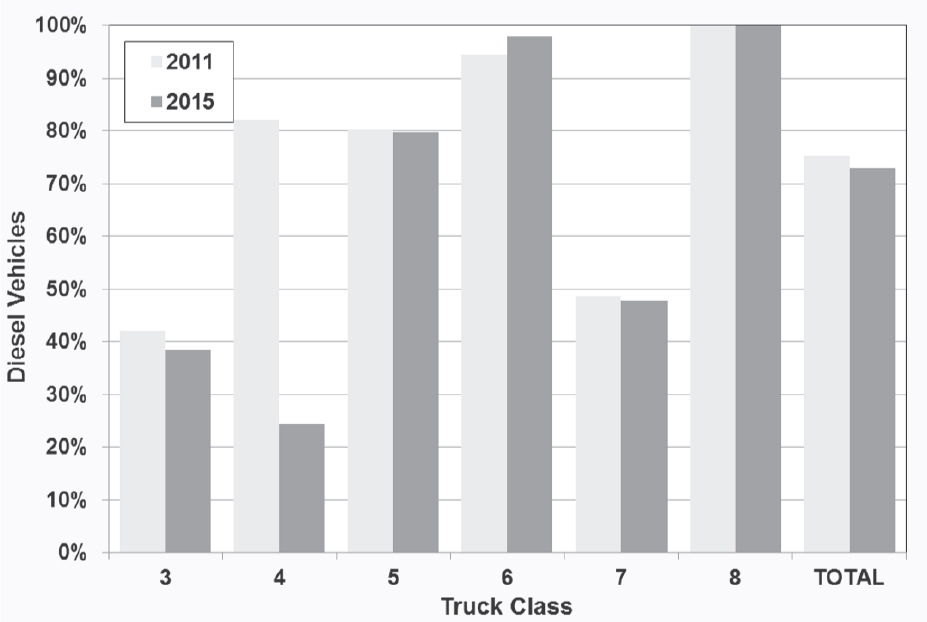
Diesel engines continue to be dominant in Class 8 trucks and recently gained market share in Class 6. In Classes 3 through 5, diesels have declined in use in the past few years (see Figure 4-2) in favor of gasoline and natural gas (NG) engines. Note, however, that NG vehicles represented less than 10,000 of a total of about 160,000 sales of Class 4 through 7 medium-duty (MD) trucks in 2013 (NGVAmerica, 2014; ORNL, 2016.
4.3 SPARK-IGNITION ENGINES
Since spark-ignition (SI) engines have different efficiency characteristics and fuel requirements than compression-ignition (CI) engines, their GHG signature is also different. The committee assessed whether there are technical and economic factors that could alter the current engine preferences across Class 2b through 8 vehicles, as well as assessing the potential efficiencies and emissions of SI engines.
We see several factors emerging that could cause an increase in use of SI engines for GHG benefits:
- The initial cost and operating costs of the control technology for criteria emissions is much less for SI than for CI engines.
SOURCE: ORNL (2017).
- Lower-carbon fuels available at large scale (natural gas, ethanol, and propane) are well suited for SI engines.1
- The cost of fuels for SI engines is expected to remain below that for CI fuels (diesel) for considerable time due to large world demand for diesel fuel.
- The efficiency of SI engines is continuing to be pushed to higher levels as progress is made to improve practically every feature of an engine’s energy balance: overall cycle efficiency (increased compression ratio and exhaust energy use), heat transfer losses, pumping losses, mechanical friction, and auxiliaries.
The National Research Council (NRC) light-duty vehicle report (NRC, 2015a) presents a thorough review of SI engine fundamentals, as did the NRC Phase One Report (NRC, 2010), which will not be repeated here. The committee attempted to identify plausible 2025 SI engine efficiencies to scale engine maps for whole vehicle studies to allow comparison of different engines and fuels in similar vehicles. Three sources or methods were used:
- Review of modern engine test results for peak and part load efficiency, and extrapolating progress. For example, the Cummins ETHOS engine achieved a brake efficiency near 43 percent on high-ethanol-content fuel (Perfetto and Geckler, 2014) (Figure 4-3), and Toyota has reported results for 2016 production engines of 40 percent (GreenCar and SAE). Department of Energy (DOE)-sponsored projects have yielded multicylinder experimental engines that have surpassed 42 percent efficiency (Chrysler) (DOE, 2013). A deep literature survey of SI engine and fuel trends revealed a continuing increase in compression ratio (Figure 4-4), which is a fundamental parameter governing engine efficiency (Splitter et al., 2016). In the
___________________
1 Of these fuels, propane is used in the smallest quantity for transportation. Yet 0.4 billion gallons are used annually in engines, approximately equal to the energy used by 1 million electric cars.
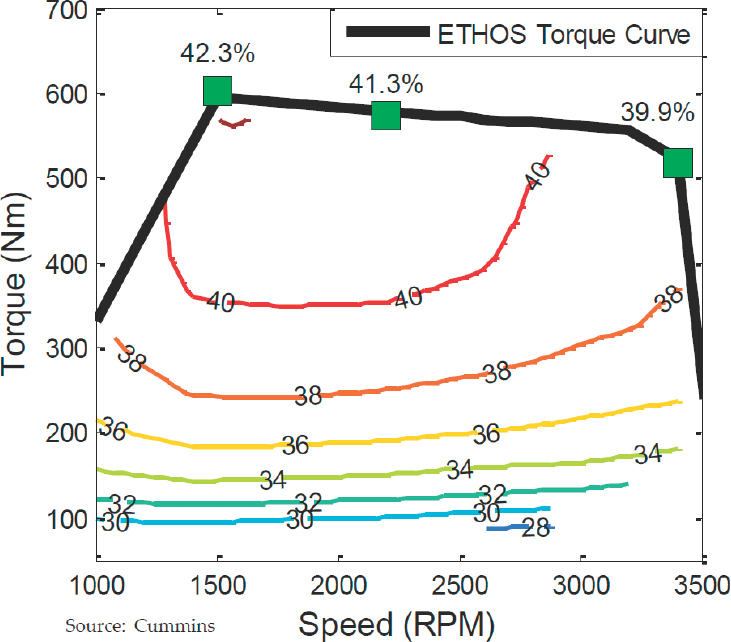
SOURCE: Perfetto and Geckler (2014).
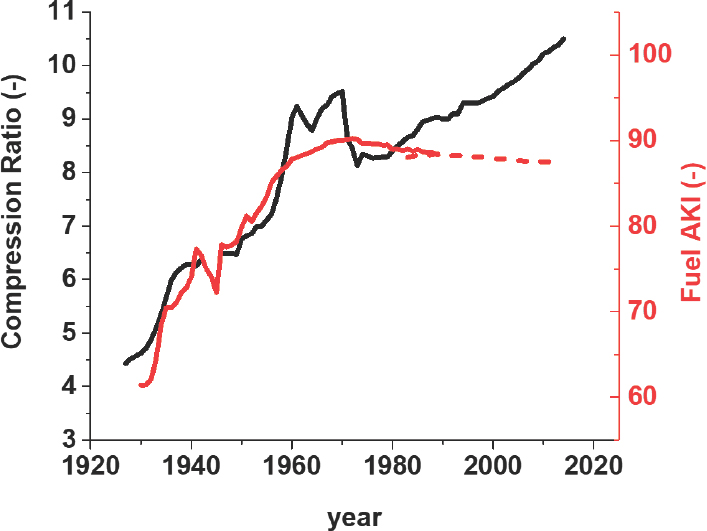
SOURCE: Splitter et al. (2016).
- Consultation of the analysis and results in the NAS light-duty study (NRC, 2015a). This was a “ground-up” type of study where the benefits of many specific technologies were added to a baseline engine.
- Consideration of the analysis and goal setting in the U.S. Driving Research and Innovation for Vehicle Efficiency and Energy Sustainability (USDRIVE) partnership (Edwards et al., 2011). This was a “top-down” analysis using second-law models and expert opinions on the feasible extent that fundamental losses could be mitigated without identifying specific devices.
of increasing the fuel octane number, increasing the compression ratio (and efficiency) without incurring engine knock has been accomplished with numerous engine innovations such as knock sensors, exhaust-gas recirculation (EGR), variable valve timing for Miller cycle effects, direct injection, and others (NRC, 2015a). Achievement of 45 percent brake thermal efficiency (BTE) was recently reported by Honda (Ikeya et al., 2015), via optimization of bore/stroke ratio, EGR level, compression ratio, and combustion chamber shape. This was a stoichiometric engine operating on 91 research octane number (RON) fuel, with boosting but no waste-heat recovery (WHR) system. In a recent simulation study comparing SI and diesel engines for medium- and heavy-duty vehicles, Southwest Research Institute (SwRI) projected a best point efficiency of about 40 percent for a dedicated EGR SI engine (Reinhart and Megel, 2016).
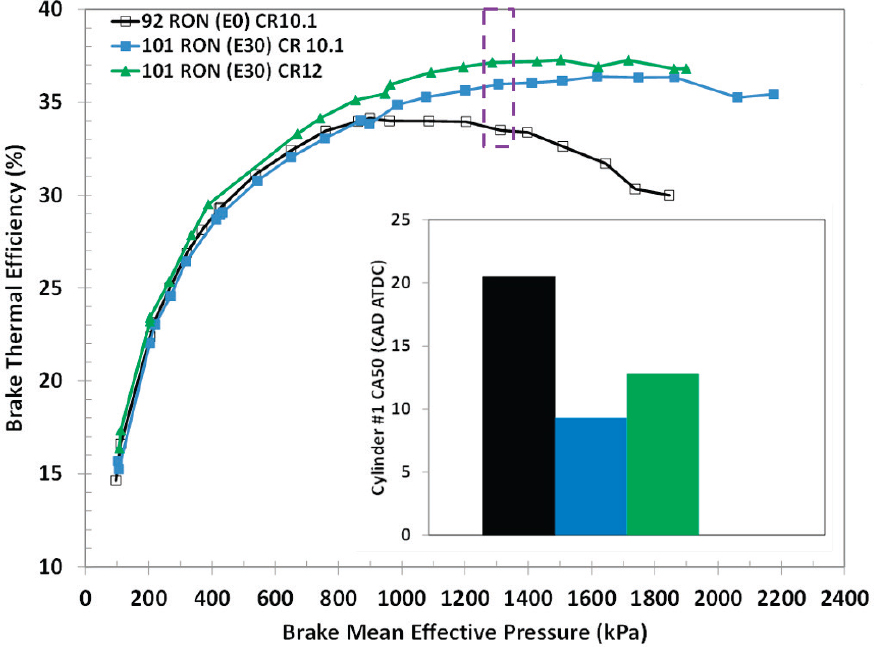
Based on these methods, the committee converged on an estimate for future (year-2025) SI engine peak efficiency of about 43 percent in the medium-duty size. Use of fuels with a higher octane number (the example here is RON) to enable higher compression ratio and more favorable spark calibration could improve this by an additional approximate 5 percent relative to the efficiency without the higher octane fuel specification (Figure 4-5) (Leone, 2015; Sluder et al., 2015; Stein et al., 2012). See the more detailed discussion in Section 4.9.4 in Chapter 4. In
SOURCE: Sluder et al. (2015).
comparison, NHTSA and EPA adopted 660 grams CO2 per horsepower-hour (g CO2/hp-h) as a 2010 baseline2 for a vocational truck gasoline engine and placed a standard of 627 g CO2/hp-h for 2016-2017. These equate to 28 to 30 percent efficiency over the cycle. For these SI engines available for medium- and heavy-duty vehicles, NHTSA and EPA are not requiring more aggressive CO2 targets beyond 2017. The CO2 requirements for full vehicles with SI engines (large pickup trucks, for example), are reported by the original equipment manufacturers (OEMs) to be difficult to achieve, presenting a paradox to be studied. Reasons for the paradox in efficiency are discussed in the following paragraphs.
With increasingly stringent regulations for criteria emissions in passenger vehicles, the SI engine system has achieved remarkably low emissions of hydrocarbons (HCs), CO, NOx, and particulate matter (PM). Developments of the three-way catalyst (TWC), engine fuel systems, and electronic controls have been key enablers. Tier 3 emissions requirements will also bring lower-sulfur gasolines to assist performance and longevity of the aftertreatment systems. If future regulations were to require lower NOx (for example by 90 percent as California has suggested), there is little doubt that the SI engine and TWC could meet this requirement, and probably at affordable cost. For example, citing “lower acquisition cost and simpler maintenance due to the complexities that diesel buses face in meeting emissions standards,” Navistar and Power Solutions International (PSI) recently introduced a gasoline engine for school buses to complement their propane and natural gas SI engine offerings (PSI, 2016). If SI engines for MHDVs adopt gasoline direct fuel injection, there could be a challenge in meeting PM standards unless gasoline particle filters are applied.
In the Phase II rule (EPA and NHTSA, 2016), the agencies would retain the Phase I fuel consumption/GHG standards for SI engines instead of adopting technology-forcing standards. NHTSA and EPA developed the baseline fuel consumption and CO2 emissions for the gasoline engines from manufacturer-reported CO2 values used in the certification of non-GHG pollutants.3 The baseline engine for the analysis was developed from a model year 2011 engine, because this is the most current information available. The average CO2 performance of the heavy-duty gasoline engines considered (all naturally aspirated V-8 without cam phasers or variable valve timing [VVT])4 was 660 gram per brake horsepower-hour (g/bhp-hour). For the Phase I standards—reaffirmed for the Phase II standards through 20275—NHTSA and EPA settled on an engine CO2 standard of 627 g/hp-h,6 a 5 percent reduction in fuel consumption from the baseline, or approximately 30 percent BTE. This modest stringency was partly predicated on the fact that there are relatively few loose SI engines sold on the vocational market compared to whole vehicles. Hence any technology forcing is done in the whole vehicle standards. This could possibly further improve the cost competitiveness of SI engines and increase the incentive for the MHDV sector to shift away from more efficient diesels. In NHTSA’s fuel efficiency technology study Report #1 (Reinhart, 2015), the gasoline baseline engine was a 6.2-liter (L) V-8 based on an OEM product and consistent with the discussion above. Interestingly for the Phase II rule, NHTSA and EPA selected a 6.8-L Ford V-10 engine to build a fuel map for use in the Greenhouse Gas Emissions Model for vocational vehicle simulation. This engine fuel map emulated a 627 g/bhp-h CO2 performance.
SI engines today are not the dominant engine in vehicles with high annual vehicle miles traveled due to their inferior efficiency compared to diesel (compression-ignition) engines. The lower efficiency of SI engines is due to the following:
- Lower compression ratio, mostly due to combustion knock limits, which is related to gasoline octane number.
- Throttling (pumping) losses at part load. Since SI engines must operate at stoichiometric air/fuel ratio for the TWC system (14.7:1 air:fuel), to reduce load they must reduce the air flow, which induces pumping losses. Boosting, downsizing, and EGR have all contributed to reducing pumping losses over the past 15 years.
___________________
2 81 Federal Register 57234.
3 81 Federal Register 57234. “The baseline gasoline engines are all stoichiometric port fuel injected V-8 engines without cam phasers or other variable valve timing technologies.”
4 81 Federal Register 57234.
5 81 Federal Register 83555.
6 76 Federal Register 57235 and 40 CFR 1036.108(a)(1)(i).
- SI engines, again needing to operate near lambda = 1, where the ratio of air to fuel is chemically correct for complete combustion, also have a less favorable ratio of specific heat in combustion products, thus reducing the work extraction (compared to diesel engines that run fuel-lean).
As mentioned, the technologies in development to reach 42 percent peak efficiency, and to approach this level across the most used operating areas of the engine map, have been covered in other reports. For reciprocating engines, the more important innovations include the following:
- A wide range of boosting and downsizing technologies, which may call for a fuel anti-knock upgrade (this includes electric assist boosting);
- Optimized and high combustion heat release rate within noise and structural limits;
- Friction reduction via materials, designs, and lubricants;
- Heat transfer reduction via low-temperature combustion and thermal management designs;
- Lean burn (needs further development in enabling technologies such as ignition and catalysts);
- Other means of reducing pumping losses (variable valve actuation [VVA], variable displacement);
- Atkinson, Miller over-expansion systems;
- Waste-heat recovery;
- In-cylinder reforming (for heat recovery and lean-limit extension) (Chadwell et al., 2014); and
- Variable compression ratio.
One would expect the advantage of diesels to be more pronounced in duty cycles requiring much part-load operation and idling. Computer simulations comparing projected 2025 diesel and SI engines in vocational vehicles did not show a dramatic advantage for the diesel. This is discussed further in Chapter 6 in the section “Class 6 Delivery Truck.” In spite of the increasing efficiency of SI engines and affordability of emission controls, the committee recognizes that SI engines would need to meet durability expectations for an overall attractive cost of ownership. The industry has advanced considerably in its ability to accurately model and simulate pressure and temperature stresses imposed on engine component parts and subsystems, and their related effect on duty-cycle-based durability. When SI engines are adapted for commercial vehicle applications, these advanced analyses are used to identify many upgrades compared to light-duty vehicle use, which are intended to address the higher durability requirements. Improved materials, more robust structural designs, and recalibration to manage peak cylinder pressures are examples. While it is true that such SI engines would likely not achieve the high durability of diesel engines if these modern analysis tools are not used, or the results not heeded in creating robust redesign of critical parts and interfaces, the lower overall production cost of SI engines, combined with the much less expensive exhaust aftertreatment system, can lead to similar total cost of ownership.
Finding: Spark-ignition engines continue to evolve and improve, with potential to reach well over 40 percent peak brake efficiency while still achieving stringent criteria emissions with relatively low-cost aftertreatment. Even higher efficiency would be achievable in technology pathways where high fuel octane numbers were used. They are well suited to renewable fuels such as ethanol or fuels with lower carbon like natural gas or propane. Based on emerging experimental and modeling results, the expected future efficiency of SI engines appears well beyond the Phase II regulatory requirements depending on the extent that advanced technologies for passenger vehicle engines are adapted to MHDV gasoline engines.
Recommendation 4-1: As SI engines continue to be improved, NHTSA and EPA should reassess the future balance in MHDVs between SI and CI, and the reductions in GHG and fuel consumption that might be achieved with a more challenging efficiency requirement for SI engines, including an optimized low-carbon or renewable fuel. An assessment on the extent that high-efficiency technologies emerging in light-duty SI engines can be adapted to MHDVs should be carried out and could be part of an “interim evaluation” for MHDVs.
4.4 COMPRESSION-IGNITION-DOMINATED ENGINES
Compression-ignition engines (diesel engines) are the most prevalent MHDV power plant type, especially for Class 7 and 8 vehicles. This section discusses compression-ignition engine technology, emissions aftertreatment, and total costs. The compression-ignition combustion process is dominated by diffusion burning, with a start of combustion strongly influenced by fuel injection timing. Diesel engines generically exhibit high efficiency by virtue of
- Higher compression ratio than typical SI engines,
- Overall lean operation for more favorable gamma and less heat loss,7 and
- Unthrottled operation.
The fundamentals of compression-ignition engines have been covered well in the NRC light-duty vehicle study (NRC, 2015a) and other reports and are not repeated here. Their continuous development has made diesels the most efficient transportation power plant available today, with a predominant position in heavy-duty applications. New developments in diesel engines are driven forward and demonstrated through the 21st Century Truck Partnership (21CTP), which seeks to implement and bring to market new transportation power plants through government-industry partnership. The 21CTP uses a coherent and convergent approach to improve engines, emission control and fuels for thermal efficiency, reduced petroleum dependency, lower exhaust emissions, lower cost, and improved safety. Related efforts in the Department of Energy programs include a long-standing catalysis/emission forum (Crosscut Lean Exhaust Emissions Reduction Simulation [CLEERS]), fuel effects studies such as Fuels for Advanced Combustion Engines and more recently fuel-engine optima, and combustion research and development (R&D) collaboratives. These efforts support diesel engines’ continuing ability to meet requirements for criteria emissions as well as fuel efficiency and GHG emissions.
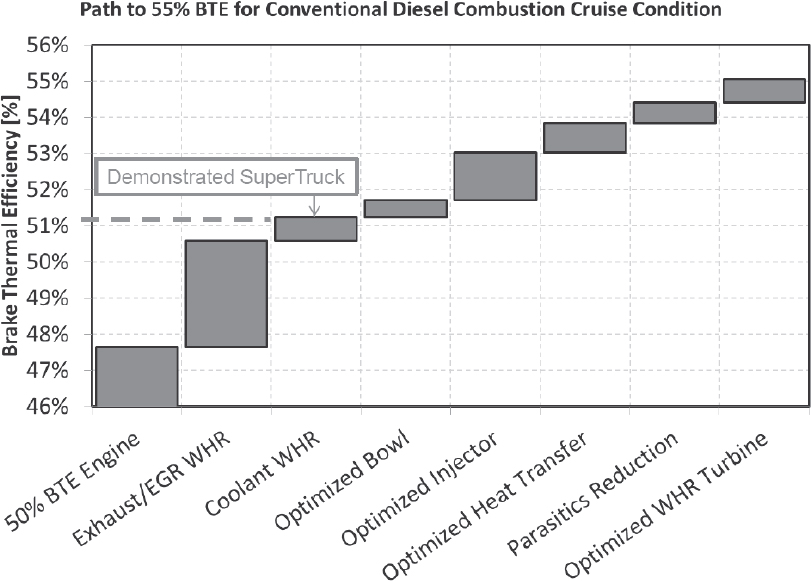
The 21st Century Truck Partnership projects like SuperTruck (ST) demonstrate the possibilities in record engine efficiency. The recently completed phase of the SuperTruck program saw several teams achieve engine efficiencies reaching 50 percent BTE in real-world packaging and on-road conditions (see NRC, 2015b). Concepts were defined to achieve 55 percent BTE in these projects. In the second phase of SuperTruck, teams are challenged to demonstrate 55 percent (Funding Opportunity Announcement [FOA] issued in March 2016).8 Some engine concepts may utilize features of low-temperature combustion, which is described below in the section “Kinetics-Dominated Combustion Engines.”
Other concepts include improved combustion, as embodied in the technologies listed in Figure 4-6. The optimized bowl, injector, and heat transfer efforts represent combustion improvement. The team is performing simulation and experiments with the objective of shortening the combustion interval as much as possible to maximize the work from expansion and minimize heat loss. As shown in Figure 4-6, the objective is to gain approximately three percentage points of improvement in engine BTE through this combustion improvement. Details about the engine technologies used by the four SuperTruck engine teams are given in detail in the NRC (2015b) report, Review of the 21st Century Truck Partnership, Third Report. Noteworthy is waste-heat recovery used and considered by all four groups, either with Rankine cycle or turbocompound plus Rankine cycle. The engine efficiency improvements have been met while meeting emissions regulations.
An important aspect of diesel engines and their efficiency is meeting criteria emissions. Because of their lean burn and variable air/fuel ratio over their operating map, diesel engines require a very different type of emission control aftertreatment system than stoichiometric SI engines. Before 2010, diesel emissions mostly used in-cylinder NOx controls. That year marked a transition to the synergistic integration of engine and fuel combustion development, with the capabilities of the aftertreatment systems. The use of selective catalytic reduction (SCR) on medium- and heavy-duty diesel engines became widespread in 2010 to meet the 2010 standard that required
___________________
7 Lower temperatures and leaner mixtures within the cylinder result in larger values of gamma, the ratio of specific heats of the gases in the cylinder during the closed portions of the engine’s cycle (γ = cp/cv). A larger average γ results in more work being extracted during the closed-cylinder portion of the engine’s mechanical cycle, leading to a decrease in the amount of useful energy leaving the system in the exhaust.
8 The next phase of the SuperTruck program calls for 55 percent engine efficiency of a Class 8 tractor-trailer with 65,000-pound gross combined vehicle weight traveling at 65 mph. The peak thermal efficiency may be slightly higher.
SOURCE: Koeberlein (2014).
tailpipe NOx emissions of 0.2 g/bhp-h. The introduction of SCR allowed higher engine-out emissions of NOx, and an associated 5 percent reduction in fuel consumption of the 2010 engines compared with the 2007 engines. However, a trade-off required an addition of about 2 percent (per unit diesel fuel uses) of the urea solution diesel exhaust fluid required by the SCR system (Cummins Filtration, 2009; Prevost/Volvo, 2010).
Costs of the criteria emissions aftertreatment systems for MHDVs are important factors in the choice of power plant. As described above, the prevailing system is urea SCR for NOx, in combination with a diesel oxidation catalyst and diesel particulate filter (DPF) since 2010. The content and complexity of these systems result in substantially higher cost than the TWC used with SI engines. The International Council on Clean Transportation (ICCT) reported the added cost of diesel emission controls (direct manufacturing costs) as about $7,000 for meeting the 2010 U.S. standards and Euro VI (Figure 4-7).
Presentations at the Technology and Maintenance Council meeting in 2012 showed cost increases considerably higher than this, but the increases likely included more than just the aftertreatment system.9 In contrast, Martec reviewed light-duty vehicle diesel costs, including the NRC 2015 Light Duty Report (NRC, 2015a), and found the costs in that report to be overestimated (Martec Group, 2016). Martec concluded that progress in diesel emission control technology, along with reductions in platinum group metal costs, would enable very cost-effective diesel engine systems for many light-duty vehicles. These findings as generally applicable to heavy-duty (HD) diesels and an indicator of probable success for HD diesels meeting future NOx targets cost effectively compared to alternatives. The added initial cost and maintenance cost of diesel aftertreatment is certainly a parameter to watch regarding the market share of diesel versus SI engines in the future.
The Phase II proposed rule (EPA and NHTSA, 2015) assumed no change in regulation for engine NOx output, yet there is an interest and investigation regarding more stringent NOx standards by the California Air Resources
___________________
9 Fleet Experiences with EPA 2010 Compliant Diesel Engines, Technology & Maintenance Council S3 Engines Study Group Annual Meeting February 23, 2012.
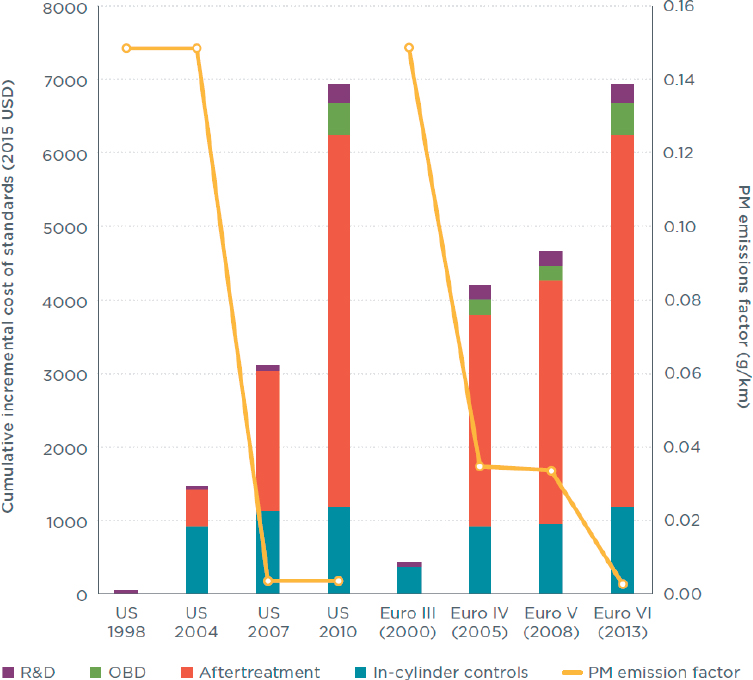
SOURCE: ICCT (2016).
Board (CARB). CARB has stated its intent to lower NOx as much as 90 percent below current (0.2 g/hp-h) standard, i.e., to 0.02 g. In December 2016, EPA issued a memorandum indicating that work would be begin on regulations to further reduce NOx from HD diesels with a target date of 2024 for all 50 states. This follows much public discussion and technology assessments especially in California about the need for stricter emissions regulations and petitions to EPA from California municipalities to act. Proposed regulations in China (Beijing 6 and China 6) stand to be the most stringent standards in the world in the 2017-2019 time frame (Johnson, 2016). The increasing stringency internationally provides strong additional incentive to improve the technology and increases confidence in success. In the next few pages of this report, data are presented which are encouraging that diesels could comply with new standards without loss of efficiency, but there will undoubtedly be additional cost.
Achieving lower NOx levels could increase the cost of the diesel engine system and perhaps reduce efficiency (increase fuel consumption). In a presentation to the committee, Dr. Anthony Greszler10 effectively summarized the NOx-fuel consumption trade-off as follows:
- Trade-off between NOx and engine efficiency has been long established:
- In-cylinder NOx reduction is highly detrimental to diesel cycle combustion efficiency.
- Improvements in aftertreatment can lower NOx (at potentially high cost) or contribute to better efficiency at current NOx levels.
___________________
10 Anthony Greszler, Volvo Trucks North America, “Impact of NOx Control on Heavy Duty Vehicle Efficiency,” presentation to the committee, July 30, 2014, Ann Arbor, MI.
- Any lower NOx requirement reduces potential efficiency gains from improved after treatment:
- Low-temperature combustion schemes can lower NOx with high in-cylinder efficiency but large pumping losses due to heavy EGR required.
- Real-world controls are highly problematic for low-temperature control (LTC).
- Vehicle level and driveline improvements help to lower NOx:
- Reduced power demand lowers engine-out NOx.
- Driveline changes to promote engine down-sizing or down-speeding will increase engine brake mean effective pressure and exhaust temperatures supporting better catalytic NOx reduction.
- Note: Neither of these effects is demonstrated in the engine certification test.
- Focusing GHG regulation on vehicle rather than engine can help to lower NOx emissions at any regulated NOx standard.
A key conclusion is that vehicle-level GHG improvements reduce the power demand, reduce fuel consumption, and thus reduce NOx (in g/ton-mile, for example) for a given engine technology.
The potential impact on fuel consumption is illustrated in Figure 4-8, where Volvo has looked at a case where NOx standards were reduced by 90 percent and SCR emission control technology did not improve. SCR has been the dominant NOx control technology for heavy trucks since 2010.
In this example, fuel consumption would increase by approximately 3.5 percent without an improvement in aftertreatment effectiveness. Progress is continuing in catalysis and emission control performance, however. Per the
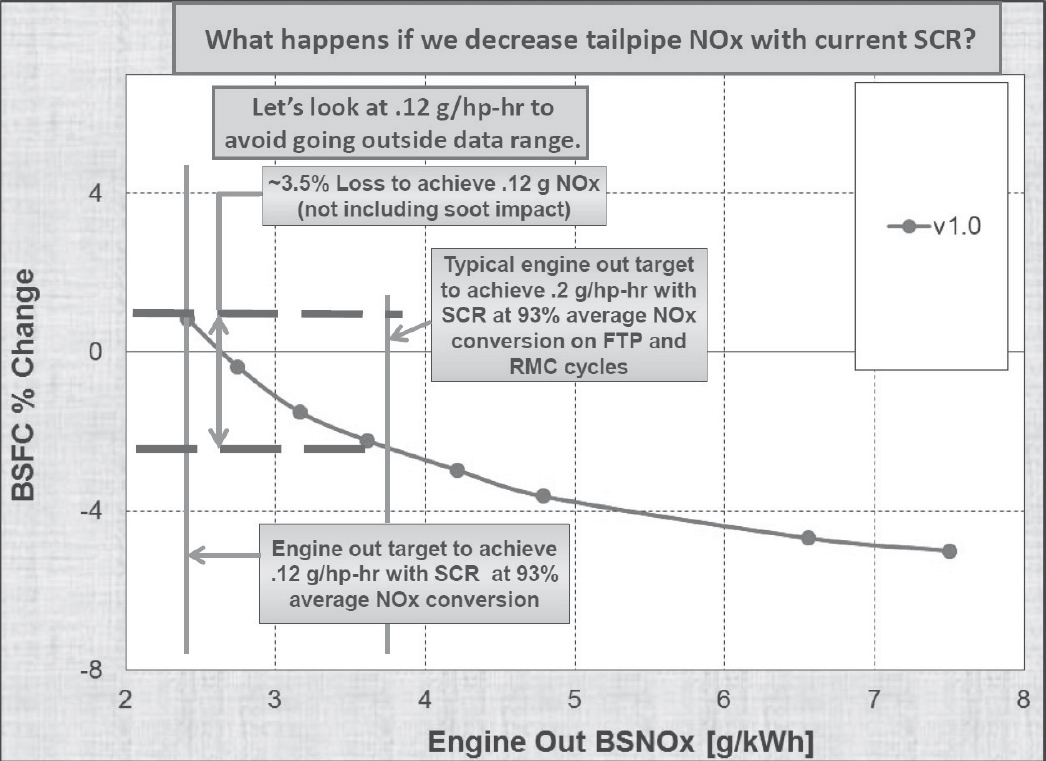
SOURCE: Greszler (2014).
Manufacturers of Emission Controls Association (MECA), “Every generation of SCR systems has led to improvements in catalyst conversion.” Further findings of MECA reveal that improving integration of emission control approaches is yielding simultaneous reductions of both CO2 and NOx, far from the experiences of a decade ago. Figure 4-9 shows certification data from 2002-2015, indicating that CO2 and NOx emissions have not necessarily been a trade-off since the introduction of SCR aftertreatment in 2010, except that there is additional cost of urea consumption and added component features or technology content. The trend is very clear toward simultaneous reduction of NOx and CO2 for diesel compression-ignition engines.
The graph from MECA refers to future enabling technologies for reduced NOx. Many of the technologies are reviewed by Johnson (2014) and Johnson and Corning Incorporated (2016) and include SCR catalyst systems with improved low-temperature performance, SCR+DPF (SCRF Johnson Matthey TM), SCR combined with NOx storage catalysts, and importantly new calibrations to enable faster catalyst warmup. Non-urea forms of delivering ammonia continue to be studied and developed. Sax et al. (2014) reviewed the California low-NOx program for the committee as well. Research is targeting high NOx conversion at 150 degrees Celsius (°C). For reaching a cycle standard of 0.02 g/hp-h NOx, what is needed, per MECA, is
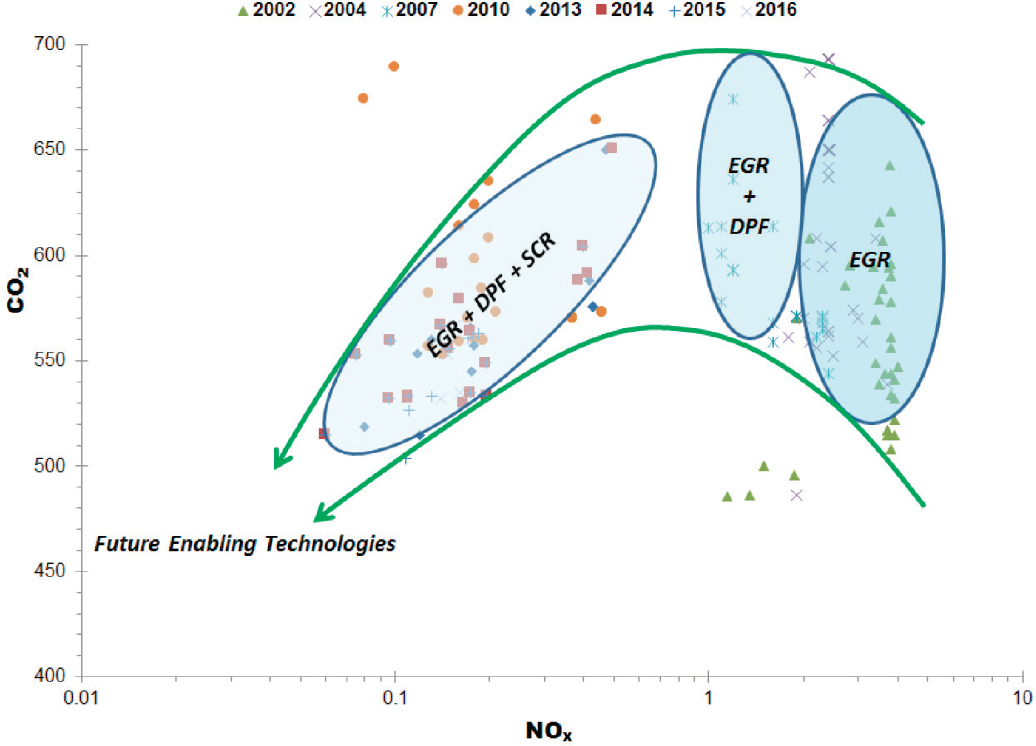
SOURCE: Tenneco, from data compiled by Dr. Benjamin Shade. Copyright 2015, Tenneco Automotive Operating Company, Inc. for MECA (2015).
- 95 percent efficiency for cold start,
- 99 percent for hot start, and
- 99 percent on steady-state cycle.
Low-temperature performance is an area of ongoing emphasis in the partnerships between DOE and industry as evidenced in the CLEERS consortia. The approach includes development of improved catalyst formulations with higher Cu content (Gao et al., 2015), developing improved understanding and models of ammonia absorption (Pihl et al., 2015), and development of improved protocols for characterizing catalysts (Rappé et al., 2016). A recent announcement by Continental regarding close-coupled oxidation catalysts is a further example of how the diesel aftertreatment systems are continuing to improve (ET Auto, 2016).
CARB sponsored research at SwRI to explore paths to reduce NOx by an order of magnitude below the current standard of 0.2 g/hp-h. Many configurations were examined, and recently the configuration shown below in Figure 4-10 was found to achieve a NOx level of 0.012 g/hp-h on the composite test cycles. It utilizes a passive NOx adsorber, mini-burner, SCR and SCR on filter, plus an ammonia slip catalyst (Sharp, 2016).
The impact on CO2 (fuel consumption) was reported as a 1.4 percent increase over the base engine. These results are encouraging that the CI engine’s efficiency can be mostly preserved with measures installed to greatly reduce NOx emissions. Determining how to achieve this system affordably will be very important for the technical and regulatory communities. In addition to emissions aftertreatment, changes in fuel composition can improve criteria emissions. An overview of diesel fuel requirements is presented elsewhere in this report. The reduction of sulfur levels in 2006, to accommodate exhaust emission controls, satisfied the major change needed in fuels for diesel engines at that time.
Finding: Diesel engines using the well-known diffusion-dominated compression-ignition combustion are presently the most efficient engines for MHDVs, with progress evident for further reductions in CO2 and fuel consumption, and NOx emissions. Supported by the U.S. Department of Energy’s SuperTruck initiative, demonstration of 55 percent peak engine efficiency in a research vehicle environment may occur in the next few years. Improvements in waste-heat recovery will be a necessary precursor to reaching such peak efficiencies.
Finding: Although substantial innovation and progress are being made in diesel emission control technology, the costs of the systems are still significant and in some applications advanced SI engines with lower-cost aftertreatment (or lower-cost natural gas fuel) may have overall lower life-cycle cost.
Recommendation 4-2: The committee recommends NHTSA and EPA review progress in diesel engine efficiency and emissions in an interim evaluation, noting the possibility of new engine platforms, and evaluate CO2 targets for beyond 2027. The committee also recommends that the GHG benefits of diesels be reassessed in a scenario of more stringent NOx standards, considering the overall cost effectiveness and impact on market share of diesels.
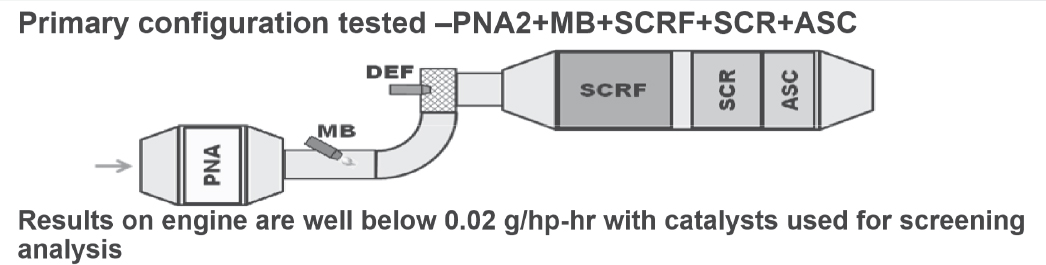
SOURCE: Sharp (2016), image courtesy of Southwest Research Institute.
4.5 KINETICS-DOMINATED COMBUSTION ENGINES
Kinetics-dominated combustion processes are another opportunity to improve powertrain efficiency. Kinetics-dominated combustion processes have generally fallen under the term LTC, also referred to as HCCI, premixed charge compression ignition (PCCI), and reactivity controlled compression ignition (RCCI), and by many other names. LTC is dominated by chemical kinetics and is largely flameless and is controlled by the staged, autoignition combustion of dilute mixtures created by excess air and/or EGR). Recent assessments of fuel effects for LTC identified approximately 13 documented variants of LTC. An abbreviated spectrum is illustrated below in Figure 4-11, showing the key distinguishing features of fuel injection timing, degree of mixing, and fuel properties (Dempsey et al., 2016).
Kinetics-dominated low-temperature combustion is an area of research that has been pursued in recent decades and has been addressed in numerous publications including in recent National Academies reports reviewing DOE’s 21st Century Truck Partnership to which the reader is referred for additional details (NRC, 2008, 2012, 2015b). The following brief discussion follows from those reports.
The basic concept of LTC, in its various forms (Figure 4-11), is to carry out the combustion process in an ultralean or dilute mixture, the temperature of which is low enough to forestall the fixation of nitrogen and oxygen, i.e., with the intent to reduce NOx formation to levels capable of meeting prevailing emission standards without aftertreatment, and whose lean composition avoids the formation of particulate matter. Equally significant, there are features of LTC that also can enhance engine efficiency and reduce GHGs. The fundamental technical issue or barrier to LTC combustion in diesel (and SI) engines is that there is no longer a source of positive ignition, which is easily controlled. Although stable control can be achieved at a steady-state set point, difficulty arises in
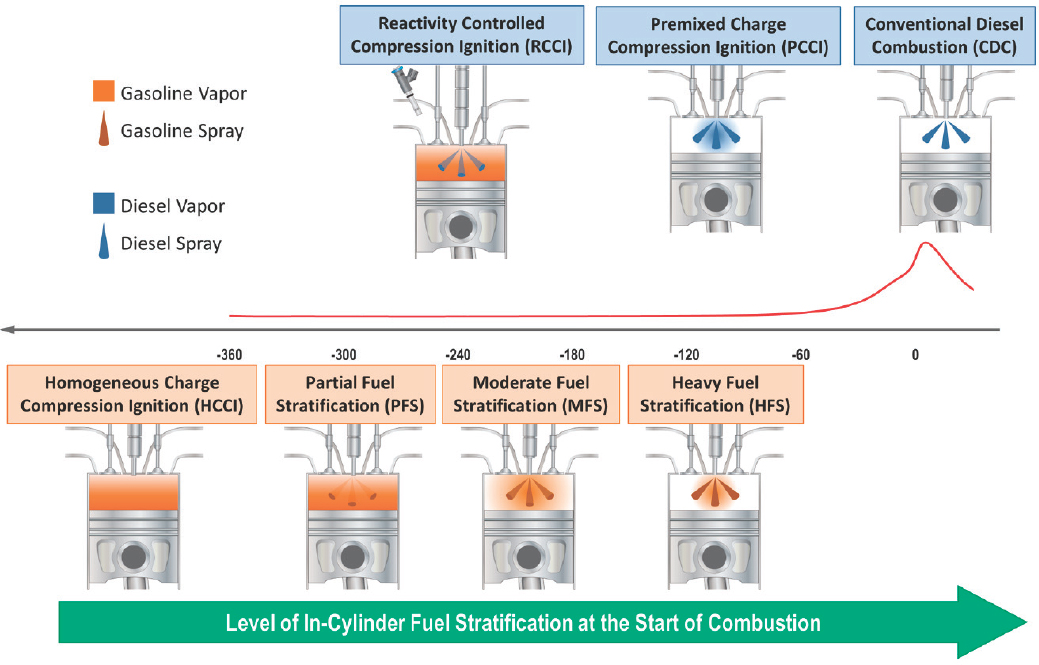
SOURCE: Dempsey et al. (2016).
establishing control over a broad operating envelope and during rapid load transients. The fuel and air are premixed before entry into the cylinder, or fuel is injected very early in the case of HCCI to achieve homogeneity. In the case of PCCI, fuel injection takes place later in the compression stroke, so there is considerable stratification of the fuel and air. In either case, the mixture is so dilute that combustion has to occur through the natural chemical kinetic mechanisms between the fuel and the surrounding air and residual gases (i.e., burned gases containing nitrogen, oxygen, CO2, and water [H2O] as major species) as the mixture is compressed to higher temperatures during the compression stroke of the engine. This reliance on gas-phase chemical kinetics results in major control and operational issues because the kinetic rates do not scale with engine speed (measured in revolutions per minute [RPM]), are variable at different loads, are dependent on engine thermal condition and prior-cycle events, and are a function of the fuel composition, which can vary across a significant range (cetane number in the United States, for example, typically ranges from 40 to 54, and biodiesel content varies from 0 to 11 percent; Infineum, 2014) and still be acceptable for traditional diesel combustion.
A method of overcoming the difficulty of managing fast transients in an engine and expanding the engine operating envelope involves the use of two fuels of differing reactivity introduced into the cylinder in a controlled sequence. The resulting RCCI combustion varies the ratio of fuels fed to the cylinder depending on load required (Reitz and Duraisamy, 2015). This provides more rapid and simple control than the use of variable engine geometry, boost, exhaust gas recirculation, and intake temperature control. However, it has the disadvantage of a design with two separate fuels on board, with no guarantee that these fuels will be used in the same ratio in different vehicle activities and applications. As described in most literature, RCCI uses port injection for the low-reactivity fuel (often gasoline) and direct injection for the high-reactivity fuel (often diesel fuel). A recent development utilizes direct injection for both fuels and is termed direct dual-fuel stratification (DDFS). Comparison of DDFS to other LTC modes has been described by Wissink and Reitz (2015). On-board reforming to control fuel properties in real time has also been explored (Posada et al., 2007).
The efficiency advantages from LTC are summarized here. It is somewhat counterintuitive that lower combustion temperatures can generate higher engine efficiencies, yet this is a reminder that internal combustion engines are not classic thermodynamic heat engines and do not follow the characteristics of Carnot cycles, etc. (Edwards et al., 2011). If the in-cylinder temperatures can be kept low during the closed portion of the cycle, the thermal efficiency will increase. This is explained by the dependence of the closed-cycle efficiency of the engine on the ratio of the specific heats of the gases (γ = cp/cv) in the cylinder.11 Lower temperatures and leaner mixtures within the cylinder result in γ values that are larger than when the temperatures are higher or the mixtures are stoichiometric. A larger average γ results in more work being extracted during the closed-cylinder portion of the engine’s mechanical cycle, which subsequently decreases the amount of useful energy leaving the cylinder in the exhaust. Furthermore, lower in-cylinder temperatures also result in less heat transfer from the cylinder. Reduction of radiation to the cylinder walls also increases efficiency. Finally, LTC combustion also can produce very high rates of pressure rise and peak cylinder pressures, which are favorable for efficiency but have limits for noise and structural loads.
With this background, three related and important questions appear for LTC modes:
- Is there clear evidence of an efficiency advantage over diesel and SI engines?
- Is there evidence that the control and operational challenges of LTC can be met?
- Is there an uptake of the technology in progress that would expand to have considerable impact in the time frame of this study?
The potential benefits of LTC for efficiency or vehicle fuel economy have been explored in laboratory experiments as well as in demonstration vehicles. Experiments with variants of LTC have demonstrated indicated engine efficiencies in excess of 55 percent, but the application of realistic friction and gas exchange losses would reduce this quantity in a full prototype engine (Daw et al., 2010; Johansson, 2015). We also note the “gross indicated efficiency” for RCCI of 56 percent reported by Reitz and Duraisamy (2015). This is not much greater than expected for peak efficiency of a diesel engine on a test stand. This same review describes experiments with
___________________
11 Cp, specific heat at constant pressure; Cv, specific heat at constant volume.
higher compression ratio and no piston cooling that stretched gross efficiency toward 60 percent. Additionally, there are experimental results combined with vehicle simulation, as well as data from prototype vehicles. Oak Ridge National Laboratory (ORNL) used a multicylinder RCCI engine to develop engine maps that were then applied to a simulation of a passenger vehicle (Curran et al., 2015). The key results are shown below in Figure 4-12, where we see RCCI enabling 8 to 15 percent higher fuel economy than a baseline diesel, and even much higher improvement compared to a gasoline port fuel injection engine. As we note elsewhere, RCCI is challenged by HC emissions, and additional aftertreatment penalties are acknowledged but not included in this study.
An RCCI hybrid research vehicle was assembled by a University of Wisconsin team and evaluated in chassis dynamometer experiments at Ford and ORNL. Importantly the vehicle with the RCCI engine successfully negotiated the Federal Test Procedure (FTP) cycles, but its lack of optimization and high losses in the drivetrain inhibited demonstration of a fuel economy advantage (Hanson et al., 2015).
Again, for a light-duty vehicle application, Delphi has taken gasoline direct injection compression ignition (GDCI) engine development to a vehicle demonstration (Sellnau et al., 2014, 2015). GDCI is characterized by multiple injections and significant stratification and high compression ratio (approximately 15). Initial multicylinder engine development achieved efficiency of about 38 to 39 percent on 91 RON gasoline, approaching the best production diesel engines and somewhat better than SI engines. The vehicle demonstration project, with Hyundai as partner, “culminated in a vehicle level demonstration of 39 percent combined City+Highway fuel economy improvement with a warmed-up engine relative to a 2009 port fuel injected baseline vehicle also run warm” (Confer and Delphi Advanced Powertrain, 2015). A follow-on project is addressing emission control development for GDCI.
LTC processes depend on the ignition quality of the fuel used in their operation. If a new fuel specification were needed, most likely the market introduction and uptake of LTC engines would be slowed. Fuels with high cetane numbers (CNs) such as those typically used for diesel fuels have significant low-temperature reactivity and thus ignite easily at modest overall engine compression ratios. These low compression ratios limit the maximum thermal efficiency obtainable from such cycles. Fuels with lower cetane, or higher octane, ratings have a smaller amount of low-temperature reactivity and thus require higher compression ratios to obtain ignition. Research activity includes investigating the optimization of fuel composition for such approaches to obtain combustion at appropriate compression ratios and engine operating temperatures. Volatility of the fuel also plays a role in
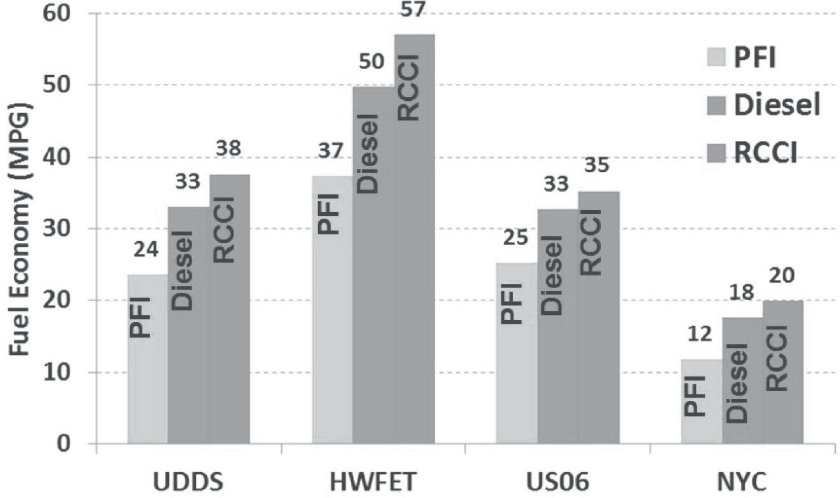
SOURCE: Curran et al. (2015).
establishing the ignition timing. It is difficult to prepare completely homogenous gaseous mixtures with heavy fuels, and ignition may start in a preferred region for a mixture that is inhomogeneous on either a large or small length scale.
Furthermore, if LTC is ultimately able to operate successfully at the maximum engine load, the lean or dilute nature of this combustion process will require significant increases in engine maximum cylinder pressures or engine displacement to achieve output similar to those of engines presently used in highway trucks. If these changes in engine cylinder pressure requirements or displacement are introduced into the market, these product introductions would require major changes in engine materials and design and require a research and development cycle of over 5 years to demonstrate appropriate engine life targets. Higher cylinder pressures may also introduce significantly higher friction losses, which should be considered. It is possible to operate an engine with a novel combustion regime at light loads and using conventional diesel injection at high loads, but the emissions spectrum then demands the same aftertreatment found on current production engines.
DOE, through its 21st Century Truck Partnership and USDRIVE Partnership, has funded much of the research on LTC within the national laboratories, industry, and academia. The goals of the DOE laboratory and university research programs are to develop the fundamental understanding and tools necessary to facilitate such a high level of engine combustion control. Numerous engine producers are involved in research projects and the fuel companies have also joined in understanding the effects of fuel composition on advanced combustion strategies (NRC, 2012, 2015a). Critical aspects of how HCCI and diesel LTC combustion progress, how their heat release rate and combustion phasing can be controlled, the sources of HC and carbon monoxide (CO) emissions when the LTC approaches are pushed to limits of operation, and fuel effects on LTC are being unraveled. Advanced combustion regimes have been explored using fuels other than diesel. Although blends of naphtha or fuel cuts lying between diesel and gasoline are suited to the evaporation and ignition requirements, some may represent a safety hazard in the fuel tank ullage, and they do not have a current distribution infrastructure. The Coordinating Research Council has led research on the properties of both diesel and gasoline fuels for alternative combustion mode research, with support from DOE (Kim et al., 2012; Zigler et al., 2012). More recently DOE has revisited this key issue of fuels for LTC via a newly planned Fuel-Engine Optimization program (Farrell, 2015).
Higher efficiencies using LTC in heavy-duty truck engines have also been shown in the laboratory with examples described below. Implementation of diesel LTC approaches has begun in heavy-duty diesels for a portion of the fuel burned during almost any engine cycle and over moderate- to light-load parts of the engine operating range, providing significant engine-out emissions reduction. In general, higher injection pressure, multipulse injection, and EGR use have allowed a greater fraction of the reactive mixtures during diesel combustion to be pushed toward LTC conditions, contributing to the lower engine-out emissions that have been achieved. The SuperTruck projects under DOE’s 21st Century Truck Partnership are investigating advanced LTC approaches including RCCI that has been discussed previously. In their SuperTruck Project, Daimler, and partner ORNL, examined dual fuel (RCCI) in a modified DD15 engine with natural gas and diesel fuel as the two RCCI fuels. Brake thermal efficiency was improved 3.8 to 5.7 percent over the diesel baseline, peaking at about 46 percent, with 74 to 86 percent replacement of diesel fuel on an energy basis (Singh, 2015). Working with a Navistar modified multicylinder engine modified for RCCI, Argonne National Laboratory (ANL) explored a range of fuels and strategies and found peak efficiencies around 43 percent (Reitz and Duraisamy, 2015). The highest-efficiency advanced conventional engines demonstrated in SuperTruck have WHR systems. A direct comparison of a LTC heavy-duty engine with WHR was not found by the committee.
The challenge with trying to drive the in-cylinder temperatures down is that the burning velocity of the fuel and air mixture decreases as the temperature decreases, and in trying to push this concept to the limit, the time necessary to complete combustion gets too long and engine efficiency and emissions suffer. Achieving this type of combustion is highly dependent on the chemical and physical characteristics of the fuel and requires very precise control of the thermokinetic state of the air-fuel mixture within the cylinder. Understanding the fundamentals of these phenomena is prerequisite to success and is a principal focus of the individual DOE engine combustion research projects in 21CTP.
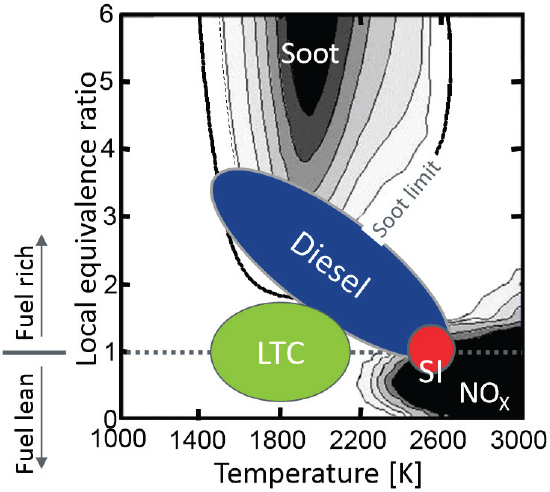
If successfully achieved, LTC strategies yield higher closed-cycle efficiency that minimizes heat loss from the cylinder and exhibits low NOx and particulate emissions. This is shown in the plot of fuel-air equivalence
ratio versus temperature (Figure 4-13), which shows that low-temperature combustion operates in a regime that has both low soot and NOx. At the same time, LTC introduces concern about unburned HC and CO emissions. Consequently, it is likely that aftertreatment will still be required, if not for PM and NOx, then for HC and CO, and the aftertreatment systems will most likely need to operate at lower temperatures than current systems today.
A recent presentation by DOE to the National Academies Committee on Review of the Research Program of the U.S. DRIVE Partnership noted that LTC is still a long-range research endeavor with uncertainty about its application and commercial success.12 It was noted that LTC faces a number of challenges and that the following issues need to be addressed:
Challenges facing the success of LTC operation include
- Combustion noise (American Council of Engineering Companies guidelines) and combustion robustness,
- High engine-out HC and CO emissions,
- Transient combustion control, and cold and transient emissions,
- Wider speed and load operating region, and
- Cost and complexity.
In summary, the understanding and demonstration of LTC efficiency advantages has become clearer, as have the fuel requirements, and also the challenges to application in commercial engines. The efficiencies of advanced conventional diesel and spark-ignited engines are also being improved, relegating the kinetics combustion modes to the research status or moderate portions of engine operation maps for the time being. Research programs are in place to continue the exploration and development of kinetics-driven combustion. Vehicle simulations with experimental LTC engine maps, as well as full light-duty (LD) vehicle tests have shown moderate potential fuel consumption benefits if practical emissions and operational challenges are overcome.
SOURCE: DOE (2012).
___________________
12 Solomon, A., and K. Howden. 2016. Advanced Combustion and Emission Control Technical Team. Presentation to the National Academies Committee on Review of the Research Program of the U.S. DRIVE Partnership, Phase 5, April 20, Washington, DC.
Finding: Progress in understanding and demonstrating the benefits and challenges for kinetics-dominated combustion has continued, but there are still many recipes of the phenomena in flux depending on fuel properties and stratification modes. Full-scale HD engines have been successfully demonstrated on test stands, and LD vehicle demonstrations have been conducted. A full commercial application of LTC was not found by the committee.
Recommendation 4-3: The status of LTC should be followed and reassessed as part of an interim evaluation. The government-industry R&D portfolio should include determination of overall GHG reduction via LTC in comparison to advanced conventional combustion engines, including the applicability of WHR to both engine systems. The market uptake of LTC should be tracked and reported. This comparison should consider overall cost effectiveness including aftertreatment requirements.
4.6 NATURAL GAS ENGINE UPDATE
In the committee’s first report (NRC, 2014) natural gas engine availability and performance characteristics were reviewed, including discussion of potential efficiency-improving technologies. Cummins has continued work on their market well-received ISX12-G natural gas SI stoichiometric/cooled EGR engine, and recently EPA certified this engine for the next EPA GHG standard with compliance required in January 2017.
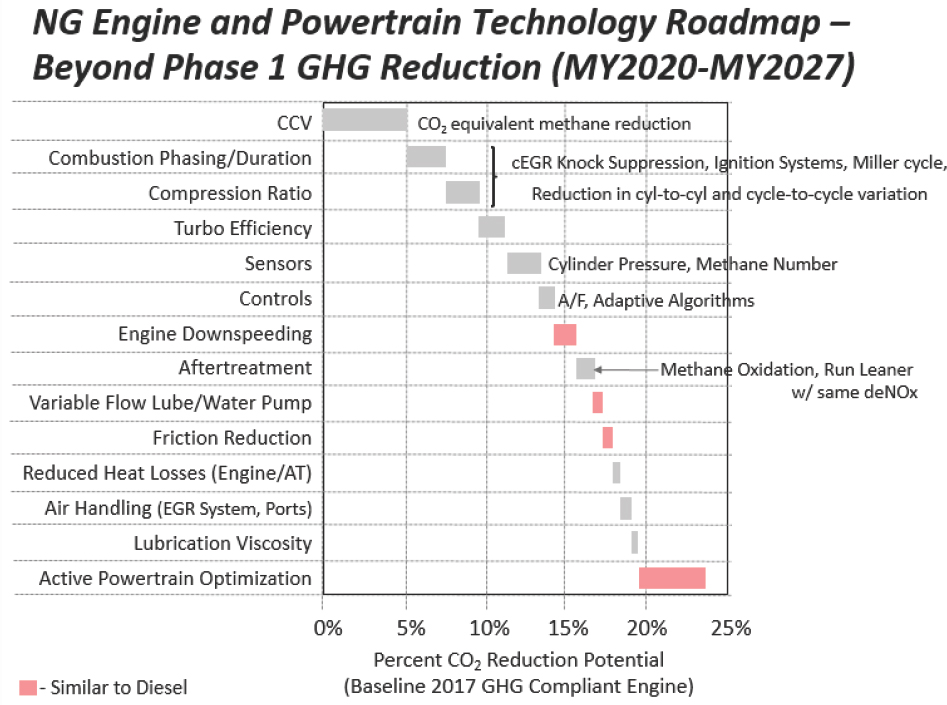
Cummins has identified technologies they believe will enable efficiency development toward EPA’s Phase 2 standards, proposed to be effective in 2021. These are listed in Figure 4-14.
SOURCE: Stanton (2014).
4.6.1 Comparing Diesel and Natural Gas Engines for Reduced NOx and GHG
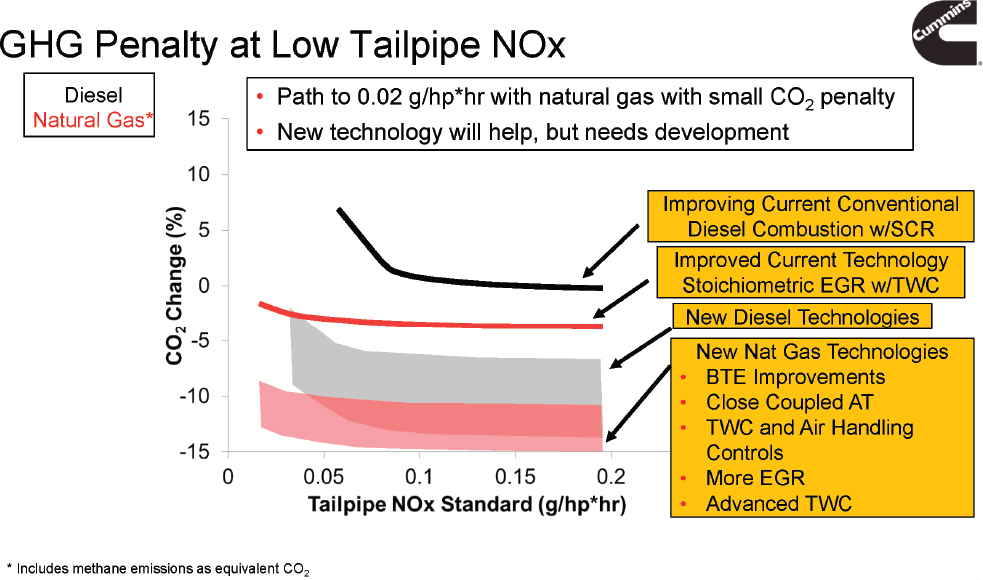
A presentation by Cummins to a 2015 CARB Symposium on Phase II GHG provided valuable forward-looking GHG and criteria emission forecasts both for baseline diesel and derivative NG fueled engines (Eckerle, 2015). Figure 4-15 from their presentation used their expected 2017-2018 results as a base case and looked to the late-2020s time frame for potential results from intense research and development. The small (3 percent) quantitative separation between the two CO2 base cases implies that the combined effects of the NG engine efficiency gap13 and the methane tailpipe leakage basically eliminate the low-carbon advantage of natural gas.
This result is similar to the 5 percent NG net improvement reported for the ISX 12 Diesel and NG-2013 FTP data from Figure 5-5 of the NRC (2010). These two reports together suggest that technology development will likely reduce GHGs from both the SI natural gas and DI diesel engines, but the net CO2 differences are not be expected to be near the 25 percent carbon differences of these fuels.
Note that the current diesel behavior (black line) “anchors” the graph with its 2017-2018 NOx at 0.2 g/hp-h and the 0 percent CO2 change point. Applying new diesel and new natural gas technologies drives the expected NOx lower along with simultaneous GHG (CO2) reductions as shown. Both late-2020s regions center at about a 10 percent CO2 reduction from their respective bases with the identified mix of technologies.
Figure 4-15 also illustrates a potential solution for application in ozone nonattainment regions, another CARB objective. That NOx solution favors the NG, with the currently imagined new technologies for both engines.
SOURCE: Eckerle (2015).
___________________
13 NG spark-ignition engines have features that make them less efficient than compression-ignition diesel fuel engines. The NG engines have lower compression ratio, operate at stoichiometric fuel-air mixture, and use throttling for load control, all tending to reduce efficiency compared to diesels. NG engines that use high-pressure direct injection (DI) are closer to diesel engine efficiency.
Finding: There are engine research, development, demonstration, and deployment opportunities both for advanced diesel-fueled and NG-fueled heavy-duty truck engines, which can contribute to GHG (CO2) and fuel consumption reduction in truck transportation as recently demonstrated and forecast.
Recommendation 4-4: NHTSA should coordinate with other federal agencies to define the necessary research, development, and demonstration projects focused on NG engine thermal efficiency to achieve near-diesel parity, and to manage tank-to-wheels methane leakages in combustion processes as well as crankcase intrusion.
4.6.2 High-Pressure Direct-Injection Natural Gas Engines
Natural gas engines offer opportunities for improved efficiency and lower GHG emissions. In this NG fuel delivery system, the high-pressure-cylinder injected gas is combustion ignited by an appropriately timed pilot quantity of diesel fuel. In the committee’s first report (NRC, 2014), this technology was reviewed and it was reported that the Westport high-pressure direct injection (HPDI) was discontinued in the fall of 2013. This natural gas fuel delivery process is now in a Generation 2 design configuration. This evolution by the manufacturer is to optimize system mechanics, hydraulics, electronics, and cost, seeking particularly to overcome the cost obstacle of their first-generation system. In Chapter 6, results are presented for simulation of an advanced HPDI engine in a Class 8 vehicle, where the engine map was approximated based on the 2010 Westport HPDI. This simulation found near parity on CO2 with a highly advanced diesel engine, and near parity on thermal efficiency with the committee’s baseline 2019 diesel.
Westport announced that it has completed an engineering program with Daimler AG to develop the Gen 2.0 system for a Daimler heavy-duty engine. The prototype HPDI engine met all technical targets (Westport, 2015a). Gen 2.0 is reported to be at thermal efficiency parity with its base diesel at nominal 44 percent14 and capable of complying with Euro 6 and EPA 2014 (Westport, 2015b). This performance for a NG fuel engine moves the efficiency gap versus diesel-only fueled engines essentially to 0 percent. Westport reported engine testing of early production design intent components, including the latest generation of injectors from Delphi (Westport, 2015c). In October 2017, Volvo introduced HPDI natural gas engines in Europe in their FH LNG and FM LNG trucks, meeting Euro VI emissions regulations. They are reported to give comparable efficiency to Volvo diesel engines. The HPDI engines are no longer available from Volvo in the U.S. market as of January 2018.15
Finding: The thermal efficiency of the Westport HPDI natural gas engine appears comparable to current compression-ignition diesel engines, thus potentially providing a strong net CO2 reduction in heavy-duty engines, in contrast to SI natural gas engines with their efficiency impediment compared to diesels.
Finding: Natural gas as a replacement fuel for diesel can contribute to reduced GHG emissions with the magnitude depending on the efficiencies of the engines and impact of NG leakage. Progress is expected in NG engine efficiency. This places the two engine types in direct competition for achieving the better net GHG result. From the perspective of fuel consumed, natural gas contributes to energy security, one of the original purposes of fuel economy regulations. Also recognized, of course, is the potential for NG to provide a lower-cost fuel benefit to truck companies. Such a benefit is subject to the dynamics of commodity pricing, as is currently being experienced.
4.7 ALTERNATIVE-CONFIGURATION ENGINES
Many engine configurations other than the conventional slider-crank reciprocating piston system (with four-stroke cycle) have been investigated and are even presently being explored. A partial list is shown below:
___________________
14 See http://www.westport.com/is/core-technologies/hpdi-2 (accessed December 18, 2019).
15 See https://www.dieselnet.com/news/2017/10volvo.php (accessed December 18, 2019).
-
Variants of reciprocating piston engines
- Two- and six-stroke reciprocating piston engines (Blain, 2015; Kierstein, 2014).
Two-stroke spark-ignition and diesel engines have been used in a number of on-highway vehicles and remain popular in handheld equipment and applications where power/weight and simplicity are imperative. New developments or concepts have appeared. The emissions characteristics are generally challenging. A profound advantage in fuel efficiency does not appear likely for MHDV uses, but see the discussion on opposed piston engines below.
Six-stroke engines have been analyzed and tested wherein an additional compression and power stroke is added to recover residual heat after the initial power stroke. The residual heat can be captured by adding water or additional fuel after the initial power stroke. In the case of water injection, steam is created that expands to create work during the second power stroke. If fuel is injected, endothermic reforming can occur that results in fuel with added energy content and hydrogen content which enhances combustion. In some respects the six-stroke concept is waste-heat utilization. Unlike the split-cycle concepts, there need not be transfer of the working fluid between multiple cylinders (Conklin and Szybist, 2010; Kothari et al., 2014).
- Piston engines with staged compression and expansion cylinders (“split cycle”). Multiple expansion cylinders may be used. There have been many embodiments of this approach with generally the same barrier of pressure (exergy) losses as the working fluid is transferred between expansion cylinders. The concept is directionally advantageous and similar to the effect of an Atkinson configuration, but the expansion ratio can be much greater. Hence these engines in concept can remove some of the thermodynamic constraints of the traditional slider-crank mechanism (Clarke and O’Malley, 2013; General Motors, 2012; Ricardo, 2013).
- Opposed piston engines are in development, some based on designs used decades ago in various applications (Huo et al., 2015; Naik et al., 2015; Pirault and Flint, 2009). These engines typically use a two-stroke cycle, meaning combustion and a power stroke every revolution. Elimination of the cylinder head eliminates a heat-loss path, and the configuration can be conducive to lower mechanical friction. Since the power density is inherently higher, the overall fuel/air ratio on each combustion event can be leaner on average, which helps the efficiency. The geometry of two pistons moving in the same cylinder creates a unique cylinder volume-crank rotation profile that influences heat release. Two organizations, Achates and Ecomotors, are noted here as having demonstrated opposed piston engines of significant size, yet with distinct designs. These are among few unconventional engines that have progressed to multicylinder testing.
Achates has published test data and analyses of their engine compared to a conventional diesel and estimated greater than 15 percent improvement in fuel economy over a representative range of conditions including transient operation. Engine-out emissions have been reported but as of 2016 there has not been a full demonstration of meeting 2010 regulated emissions levels. Engine-out levels would dictate the need for about 95 percent effective aftertreatment (Sharma and Redon, 2016). A peak efficiency of 43 percent was reported in comparison to the 6.7-L diesel at 41 percent. The advantage was attributed to the mechanisms cited above. Further improvements are expected that would increase the advantage, but the baseline diesel engine is improving as well. Achates modeling results show a path to 55 percent peak brake efficiency in a heavy-duty scale even without waste-heat recovery systems (Abani et al., 2016). Achates as well as AVL were awarded contracts from the U.S. Army Tank Automotive Research Development and Engineering Center to develop and test demonstrator engines for military vehicles. Cummins is a partner to Achates. In addition, the Advanced Research Projects Agency-Energy (ARPA-e) awarded a development contract to Achates in 2015 to develop a gasoline-fueled compression-ignition engine for medium-duty vehicles. Opposed piston engines have their specific challenges in emission controls, lubricant consumption, and thermal management, which are being addressed (Redon, 2011).
- Axial configuration engines where the crankshaft is replaced by an alternative device such as a swash plate. The result is usually a barrel-shaped engine. There are many configurations.
- Two- and six-stroke reciprocating piston engines (Blain, 2015; Kierstein, 2014).
-
- Linear alternators using a reciprocating free-piston combustion process. There are many attempted versions of this type of engine that directly generates electricity from reciprocating movement of a free piston within electric coils. The Department of Energy supported a project in this area for many years at Sandia National Laboratory. In concept, very high compression ratios can be used for high efficiency. A recent concept has been publicized as derived by Toyota, and a development project sponsored by ARPA-e was recently started at West Virginia University (WVU) for stationary power. There is a body of work at WVU dating back over 15 years on this topic (Atkinson et al., 1999; Robinson, 2015).
- Other positive displacement devices. There are many mechanical systems that can produce a power cycle based on compression, combustion, and expansion.
- Rotary/eccentric piston engines such as the Wankel and Liqui-Piston. This category includes other cam-like piston motions.
- Rotating vanes such as in the TurbX engine (Arimilli et al., 2003). Other than the Wankel rotary engine, no alternatives to the reciprocating piston/crankshaft configuration have been widely used for on-highway vehicles. Most alternative mechanical configurations produce power with processes that are thermodynamically similar to conventional engines, whereas to gain a notable advantage they would need to produce an over-expansion effect (Atkinson cycle), reduce heat transfer, reduce mechanical friction, enable high dilution or lean burn, etc.
- Gas turbine/Brayton engines. Gas turbines have been explored for use in trucks and cars for many decades and have appeared in truck demonstrations again in the past few years.16 Gas turbines have benefits in power density and low emissions (they run very lean, so NOx and particle emissions are relatively low) and are adaptable to many fuels. Gas turbine engines are used in combined-cycle electric power plants and have achieved approximately 60 percent efficiency at the multimegawatt scale; however, such configurations are generally considered impractical for vehicles. Marine diesel piston engines of 10-19 MW exceed 50 percent efficiency. The turbine engine is still the choice for powering the U.S. Army M1 Abrams main battle tank, due to this engine’s high power-to-weight ratio. However, the efficiency of this engine was not a primary military specification. Its engine peak efficiency is far below that of the diesel alternatives. They are generally less fuel efficient than piston engines. Turbines rely on using high combustion temperatures to achieve high efficiency, but the continuous combustion occurs at lower temperature than the intermittent combustion in piston engines. The Brayton cycle turbines also require use of highly effective regenerative heat exchangers to deliver competitive efficiency. In spite of progress in compact heat exchangers, the recuperators are large and a packaging challenge. In 2005, Volvo summarized the development and demonstration of a gas turbine for heavy trucks (Figure 4-16), achieving low emissions but with peak efficiencies only around 40 percent (Olsson et al., 2005). In the present committee study, information from Brayton Energy indicated peak efficiency potential for their system approaching 50 percent employing an advanced ceramic turbine. However, in a full system demonstration the efficiency peaked at about 38 percent (DeLizo, 2015).
Simulated vehicle fuel consumption is described in Chapter 6. If regulatory agencies were to require further reduction in NOx and PM emissions from medium- and heavy-duty vehicles, the turbine engine may receive further investigation. The California Energy Commission in conjunction with Kenworth, ICR Turbine Engine Corporation, and Brayton Energy conducted a demonstration project using a turbine engine in a Class 8 truck in a series hybrid configuration running on natural gas. The vehicle was operated on a chassis dyno and test track, gaining valuable experience and data (DeLizo, 2015). Walmart, Peterbilt, Capstone, Wrightspeed, FedEx, and others are exploring turbines in hybrid powertrains as well, but there are limited data available from these projects (Cobb, 2014; Karagozian, 2013; Senefsky, 2003). Walmart is unique in this field in that they have favored the gas turbine parallel or mechanical drive over the more common series hybrid electric. Many vehicle integrators have utilized the Capstone C30 and C65 in vehicle demonstrations. These demonstrations usually showed low emissions, but
___________________
16 See https://www.braytonenergy.net/brayton-presenting-at-mit-center-for-center-for-advanced-nuclear-energy-systems-canes/ (accessed December 18, 2019).
SOURCE: Olsson et al. (2005).
efficiency was quite low, generally well below that of today’s SI engines. Low efficiencies are bound by uncooled metal turbine alloys and have low shaft conversion efficiency from the high-frequency alternator generator, combined with the battery and electrical powertrain losses. Finally, the very large thermal inertia of the recuperator results in wasted fuel for those series hybrid applications where the engine is frequently cycled on and off. In November 2016, Wrightspeed and the Ratto Group introduced a refuse hauler powered by a gas turbine generator range extender hybrid, reported to achieve 70 percent reduction in fuel use in the refuse hauler operation compared to a conventional powertrain.17 In this special application, diesel engines are not able to meet emission standards and thus the alternative engine in the hybrid is SI. The single-shaft turbine generator is 80 kW but with the batteries and electric motors the max power is closer to 300 kW. It uses an intercooler and recuperator, and is capable of operating on diesel fuel, propane, or natural gas. The turbine is in a dedicated range extender configuration and does not follow load (it is either running near peak efficiency or is off). The gas turbine in this system has a best efficiency of about 32 percent, hence its principal advantage in the application is low emissions.
The key question to address is whether there will be developments or circumstances that would cause a shift from diesel to other engine types. Additionally, are there technology developments emerging that would be game changers for diesels as well as other engine categories? Examples would include new materials and manufacturing methods and new chemistries or catalysts for aftertreatment systems. Changes in emissions regulations and fuels could also cause a shift in GHG potential or market preference for engine configurations.
___________________
17 See http://www.wrightspeed.com/releases/wrightspeed-ratto-group-deploy-first-route-enabled-refuse-truck (accessed December 18, 2019).
Finding: There are numerous alternative-configuration combustion engines. Many of these are merely alternative mechanisms to carry out thermodynamic processes very similar to conventional engines, but there are a few that provide clear enhancements via changing the basic cycles or reducing a prominent loss mechanism (such as heat transfer or friction). Few alternative concepts have reached a scale of development where they could be tested in a MHDV system for performance and emission requirements. With limited data found on alternative configurations, the magnitude of improvement over advanced conventional engines is not readily predictable and will depend on prevailing emissions requirements.
Finding: Since so few new concepts pass fundamental tests of merit, and even fewer scale to meaningful power levels, independent benchmark tests would be reasonable endeavors.
Recommendation 4-5: NHTSA, together with EPA, DOE, and the Department of Defense, should maintain a technology assessment of developments and progress in alternative-configuration engines which evaluates them, analytically and experimentally, against benchmarks and fundamental criteria.
4.8 WASTE-HEAT RECOVERY
4.8.1 Introduction
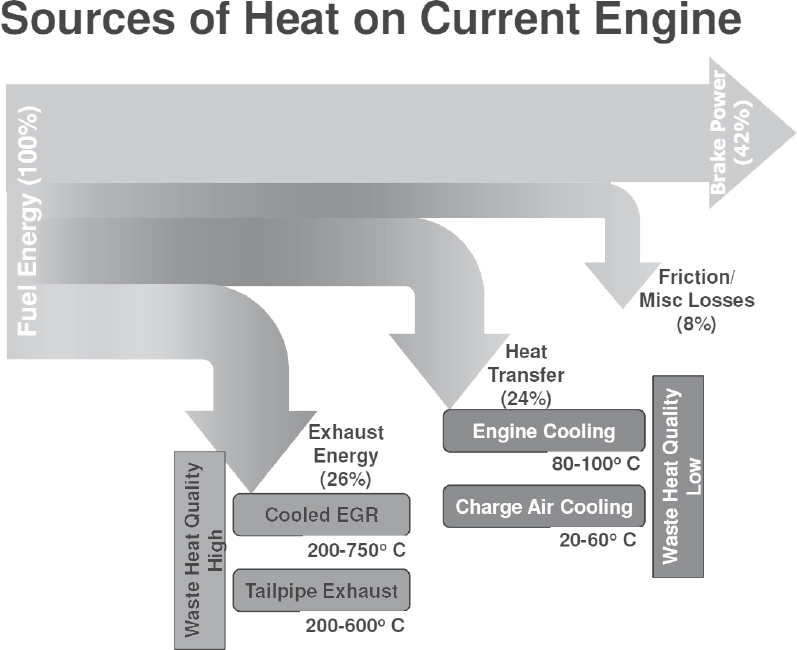
Approximately 50 percent of the fuel energy consumed by typical diesel engines in Class 8 line-haul truck applications is lost through heat transfer and unused exhaust energy and fails to perform useful work. In the example of Figure 4-17 engine heat rejection accounts for 24 percent of the fuel consumed, and exhaust sensible heat accounts for another 26 percent. Technologies and techniques exist or are under development that can recapture a portion of this rejected heat and help reduce vehicle emissions as well as reduce fuel consumption. In these cases, consideration of the second law of thermodynamics dictates how much of that heat can be converted to useful work. Hence in Figure 4-17 Cummins distinguishes between high- and low-quality heat where the higher temperature energy is the greater resource to produce additional shaft work.
Many options exist at least conceptually to utilize these sensible heat streams from the exhaust, EGR coolers, water jackets, and exhaust, with examples shown in Table 4-1.
Several recent review papers (Bhatnagar and Owende, 2015; Liang et al., 2015; Nadaf and Gangavati, 2014; Orr et al., 2016) have covered these very numerous options in some detail. Many WHR systems are investigated or utilized in nonmobile applications, for example, in combined heat-power systems. The ARPA-e Generators for Small Electrical and Thermal Systems program (GENSETS) includes projects on direct energy conversion for small combined heat and power systems. Vehicle applications bring significant challenges such as weight, performance, packaging, and reliability. In general the WHR systems are most effective at high engine loads and in fact offer little benefit in urban driving cycles (Reinhart, 2015). Transient response is a major issue or barrier as well. The Phase II GHG Regulatory Impact Analysis (RIA) includes a summary of NHTSA and EPA’s perspective on WHR and concludes that there is high potential yet limited commercialization before 2027 because of the need for further engineering development (EPA, 2015a, p. 2-11).
In particular the organic Rankine cycle (ORC) system has seen considerable progress and adaptation to on-road trucks. An ORC system was demonstrated on a tractor-trailer truck in the 1970s (Patel and Doyle, 1976), and this type of system was selected again in a recent set of advanced vehicle studies. An example project is reviewed here.
4.8.2 Application of Waste-Heat Recovery in SuperTruck and 21st Century Truck Partnership
All of the teams in the DOE SuperTruck Project included waste-heat recovery approaches to improve engine efficiency. The teams chose bottoming cycles and turbocompounding systems in various configurations, but not any of the direct energy conversion methods seen in Table 4-1. The SuperTruck engine systems with WHR are described in the NRC (2015b) report Review of the 21st Century Truck Partnership, Third Report. As a represen-
SOURCE: Eckerle (2013).
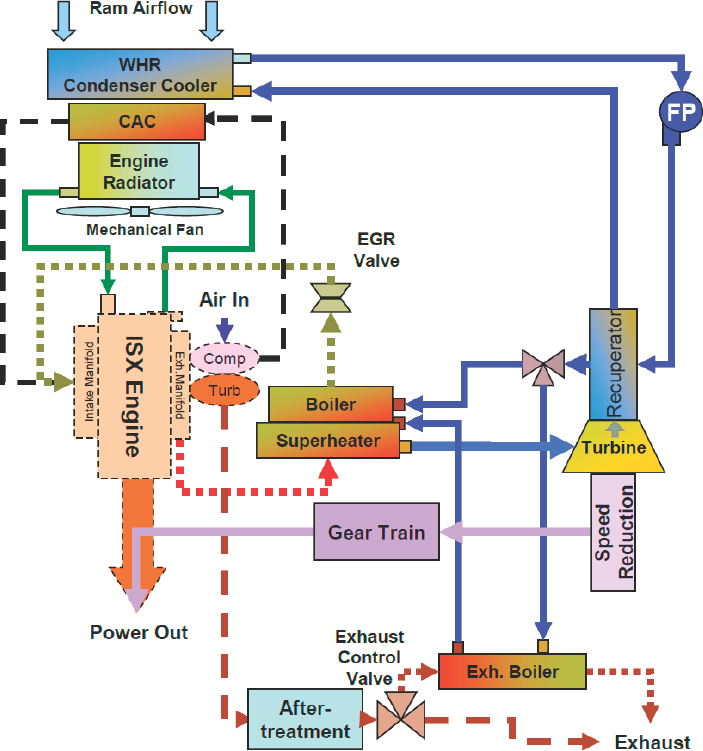
tative, road-tested example, the Cummins WHR system is shown in Figure 4-18. This system is packaged to fit within the vehicle underhood and underbody space, indicative of overall progress in the technology.
The relative contribution by WHR to engine efficiency gains is shown in Figure 4-17, in comparison to other improvements being introduced by Cummins. Overall, WHR increased the system efficiency (i.e., decreased the fuel consumption) by about 6 to 7 percent.
4.8.3 Continued Development of the Organic Rankine Cycle
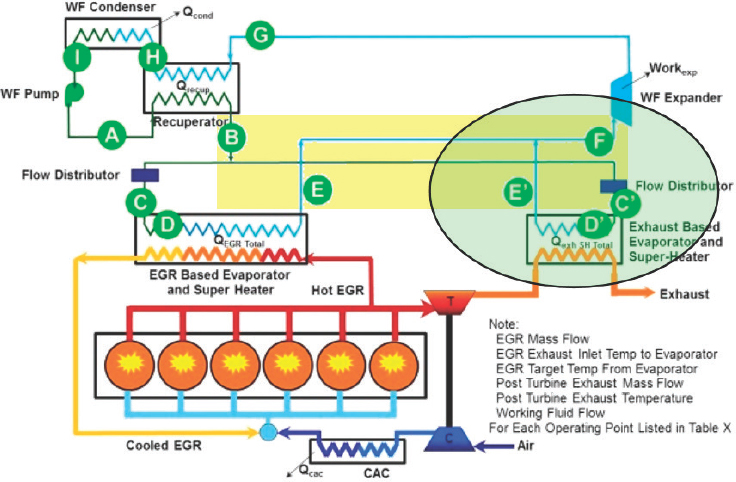
In recognition of the need for reducing cost and complexity of WHR systems, the DOE-sponsored project with Eaton, AVL, and Deere is noted in Figure 4-19 and uses a Roots-type expander in the ORC system. Most of the development work has been performed with ethanol as the working fluid.
The system in simulation has a 3 to 6 percent benefit over a wide range of engine speeds and loads, and can be declutched if necessary to avoid parasitic losses. The roots machine operates at a lower speed and lower pressure and can tolerate two-phase flow for potentially improved reliability.
Each of the SuperTruck teams had its own design of ORC and associated WHR components. As in this example of the Roots expander, the committee expects continued refinement in ORC systems.
TABLE 4-1 Categories and Examples of Waste-Heat Recovery Technology
| Category of Heat Recovery | Specific Example Technologies | Range of Efficiency Impact | Source |
|---|---|---|---|
| Direct energy conversion | Thermoelectric materials and devices | 1-2% in large pickup ~3.3% of incident energy |
Kumar et al. (2013) Liang et al. (2015) |
| Direct energy conversion, additional examples | Thermionic, pyroelectric, thermoacoustic, usually combined with piezoelectric, thermophotovoltaic | Fraas et al. (2003) Hunter et al. (2011) Keolian (2011) Wekin (2008) Yu et al. (2012) |
|
| Mechanical recovery | Turbocompound mechanical or electrical | 1-5% overall reduction in fuel consumption | NRC (2010) Reinhart (2015) |
| Heat engine cycle | Organic Rankine cycle | 4-8% | Greszler (2012) Koeberlein (2013) Reinhart (2015) Singh (2011) |
| Heat engine cycle | Refrigeration cycle Stirling engine | Nadaf and Gangavati (2014) | |
| Thermochemical recuperation | Fuel reforming, hydrogen production | 10-13% | Daw et al. (2010) Liang et al. (2015) Szybist et al. (2017) Tartakovsky Leonid et al. (2014) |
4.8.4 Summary
Many examples of engines with waste-heat recovery have been analyzed, constructed, and tested. Most experiences have been with turbocompounding, Rankine bottoming cycles, and thermoelectric generators; yet many more heat-to-power technologies exist and may see further development. The existence of waste-heat streams throughout the industrial and power generation sectors will likely force technology development at least as much as in vehicles (Elson et al., 2015). In recent projects with modern engines, the WHR systems decrease fuel consumption by 3 to 8 percent. Cost and packaging and transient response are significant challenges to widespread adoption (Delgado and Muncrief, 2015). Costs of WHR systems are discussed in Chapter 12.
Finding: There are many approaches to waste-heat conversion to power that can provide 3 to 8 percent efficiency improvements in modern truck engines. This effect is comparable to other engine improvements in combustion, air handling, friction, etc., and even comparable to many vehicle technology improvements. The WHR systems are clearly technically feasible, yet carry challenges in their weight, packaging, thermal response, and cost. Progress in addressing the challenges is evident. NHTSA and EPA’s RIA noted a potential 25 percent penetration in some Class 8 segments by the end of the Phase II rule period.
Recommendation 4-6: Industry and government should continue to research, develop, and apply WHR systems where technical and economic considerations are reasonable to capture this opportunity to reduce fuel consumption.
SOURCE: Koeberlein and Cummins Inc. (2014).
SOURCE: Subramanian (2014).
4.9 FUEL TRENDS, GHG IMPACTS, AND INFRASTRUCTURE
4.9.1 Introductory Comments
U.S. petroleum production today is greater than it has been in more than 25 years. During September 2014, daily U.S. oil production exceeded 8.8 million barrels per day, the most since early 1986 (Shenk, 2014). Crude oil production reached over 9.4 million barrels per day in 2015, the most since 1970 (EIA, 2016). The increased production is largely attributable to the significant amounts of oil generated from shale deposits using advanced extraction techniques developed during the past several decades. It is expected that petroleum-based fuels will continue to be the major source of transportation fuels well into the 21st century. Alternative fuel sources will contribute some portion of the transportation fuel pool, but petroleum-based diesel fuel, perhaps with modified properties or blended with other components, will be the primary energy source for heavy-duty trucks (particularly Classes 7 and 8). This increased U.S. energy production, together with improvements in vehicle fuel consumption, has improved the U.S. energy security position with regard to dependence on imports of petroleum. Increased domestic natural gas production and the associated sharp decline in natural gas prices have also stimulated interest in the use of natural gas in certain applications in the transportation sector, another trend that can contribute to improving energy security. Nonetheless, the Energy Information Administration (EIA), as noted above, forecasts a significant increase in fuel use by MHDVs, mostly diesel, in the next few decades, with natural gas playing a relatively small role as a percentage of the total transportation fuel consumption (see Table A2 of EIA, 2014). Increasing use of biomass-based fuels has also helped with domestic production, but it remains to be seen to what extent cellulose-based biofuels will contribute in the future. EIA also forecasts that the U.S. net import share of petroleum and other liquids will decline from 2012 to 2040 but the net expenditures in constant 2012 dollars will increase. Petroleum fuel still represents significant expenditures and exposure to energy security concerns, especially given U.S. and global projections for increased fuel use by MHDVs.
4.9.2 Trends and Impacts from Petroleum Diesel Fuel Properties
GHG emissions from future MHDVs can be impacted by fuel properties of predominantly petroleum fuels, most notably by addition of renewable fuel content, but possibly by other changes as well. The most impactful fuel change in on-road GHG emissions in recent years was the reduction of diesel fuel sulfur in 2006 that enabled highly effective NOx aftertreatment devices such as urea SCR introduced in many 2010 on-highway engines. Many engine OEMs were able to recalibrate engines for higher fuel efficiency (and engine-out NOx) and still meet the tailpipe emissions standards. On-road fuel economy gains of approximately 5 percent were reported, compared to pre-2010 engines (Cummins Filtration, 2009).
Are there other diesel fuel properties that may enable higher efficiency and/or lower GHG? Cetane number is one of the most important properties regarding diesel engine performance and emissions, and it is very important for CN to be high enough for engine starting at low ambient temperatures. However, there is not a compelling case for increasing CN for GHG and engine efficiency (ACEA, 2013). Consistency of CN in the market is desired.
For enabling high-efficiency kinetics-dominated combustion, the optimal compression-ignition fuel is being explored in numerous projects (Curran et al., 2014; Warey et al., 2010). For example, a new fuel in the naphtha/gasoline boiling range for gasoline compression-ignition engines has been suggested (Chang et al., 2012). Additional discussion is found in this report in the section “Kinetics-Dominated Combustion Engines.”
4.9.3 Biomass-Derived Diesel Fuels
4.9.3.1 Renewable Diesel
Renewable diesel fuel, as well as biodiesel, represents paths to well-to-wheels (WTW) GHG reduction for MHDVs. Renewable diesel fuel is a hydrogenation-derived renewable diesel (HDRD) using vegetable oil or animal fat that results in a fuel containing no oxygen and whose HC species are highly paraffinic and similar to those in petroleum diesel fuel. See Knothe (2010) for a comparison between biodiesel and HDRD. A comparison of key properties of HDRD to other fuels is shown in Table 4-2.
TABLE 4-2 Comparison of Properties of Three Diesel Fuels for MHDVs: No. 2 Ultralow-Sulfur Diesel Petroleum, FAME Biodiesel, and Renewable Diesel
| Property | No. 2 Petroleum ULSD | Biodiesel (FAME) | Renewable Diesel |
|---|---|---|---|
| Carbon, wt% | 86.8 | 76.2 | 84.9 |
| Hydrogen, wt% | 13.2 | 12.6 | 15.1 |
| Oxygen, wt% | 0.0 | 11.2 | 0.0 |
| Specific gravity | 0.85 | 0.88 | 0.78 |
| Cetane number | 40-45 | 45-55 | 70-90 |
| T90, °C | 300-330 | 330-360 | 290-300 |
| Viscosity, mm2/s @ 40°C | 2-3 | 4-5 | 3-4 |
| Energy content (LHV) | |||
| Mass basis, MJ/kg | 43 | 39 | 44 |
| Mass basis, BTU/lb | 18,500 | 16,600 | 18,900 |
| Vol. basis, 1000 BTU/gal | 130 | 121 | 122 |
NOTE: FAME, fatty acid methyl ester; LHV, lower heating value; ULSD, ultralow-sulfur diesel.
SOURCE: Robbins et al. (2011).
HDRD fuel has a very high CN, suggesting it could be used as a blending stream for conventional fuels. There are additional paths of creating renewable diesel fuel which fall under a range of biomass-to-liquid (BTL) processes. Biomass pyrolysis is one example. These paths typically result in a drop-in petroleum-like fuel. CARB studies show that renewable diesel can reach up to 70 percent greenhouse gas reduction compared to petroleum diesel, depending on feedstock and processing methods (Propel Fuels, 2015).
HDRD producers include Neste Oil, Phillips 66, Petrobas, and UOP (NREL and AFDC). Phillips 66 began commercializing renewable diesel in 2006, and similarly did Neste Oil in Europe. Neste Oil is the largest producer of HDRD and now exports to many world regions including North America. Since HDRD is compatible with petroleum diesel and infrastructure, there is no blending limit per se as long as the finished fuel meets ASTM specifications. As an example, NExBTL is the commercialized brand of HDRD by the Finnish oil and refining company Neste Oil.18 Unblended NExBTL meets the requirements set by the European pre-standard CEN TS 15940. Fuel blends meet the European diesel fuel standard EN 590. Neste Oil was recently cited as the supplier of renewable diesel for vehicles in the City and County of San Francisco, California, and Oakland, California. The feedstock for NExBTL is vegetable oil and waste animal fats; however, fuel quality is equal to the synthetic Fischer-Tropsch BTL and gas-to-liquids diesel fuels (EPA, 2010). Neste Oil says the production cost of NExBTL is mainly driven by utility costs and the price of hydrogen.
4.9.3.2 Biodiesel
Biodiesel is a mix of fatty acid methyl esters (FAMEs) produced through a chemical process called transesterification whereby the glycerin is separated from the fat or vegetable oil. The process leaves behind two products: methyl esters (the chemical name for biodiesel) and glycerin (a valuable byproduct usually sold to be used in soaps and other products). The biodiesel industry has steadily grown over the past decade, with commercial production facilities from coast to coast. The industry reached a key milestone in 2011 when it crossed the billion gallon production mark for the first time. It repeated that in 2012 with more than 1.1 billion gallons and set a new record in 2013 by producing nearly 1.8 billion gallons, according to EPA figures. The industry’s total production significantly exceeded the 2013 biodiesel requirement under the Federal Renewable Fuel Standard and was enough to fulfill the majority of the Advanced Biofuel requirement. Biodiesel content in the U.S. diesel supply has a mean
___________________
18 Neste US Inc. 2015. NEXBTL Renewable Diesel, October.
value of 2 to 3 percent with a maximum of 11 percent (Infineum, 2014). B5 is the most prominent blend level. At these blend levels, biodiesel is compatible with the existing fuel-dispensing infrastructure, but pipeline movement of biodiesel is still limited and hindered due to potential mixing with jet fuel if moved in the same pipeline.
Issues with use of biodiesel are mostly well understood, and there is high importance that retail biodiesel comply with ASTM specifications. In past years, a considerable fraction of biodiesel did not meet some of the key specifications, but this has improved greatly (Alleman, 2013; Lopes et al., 2014). The manufacturers of MHDV engines typically approve up to either B5 (e.g., Daimler, DD-15, PACCAR) or B20 (Cummins, Volvo). The National Biodiesel Board maintains a list of approved biodiesel content.19 The total biomass-based diesel volume of 1.8 billion gallons is primarily biodiesel but also includes renewable diesel.
Biodiesel reduces greenhouse gas emissions by 20 percent to about 80 percent (depending on fuel source and analysis) (EPA, 2009; Pradhan et al., 2012), as well as reducing PM, CO, and HC emissions (EPA, 2002). Biodiesel usually has a CN number well over 40 and typically higher than petroleum diesel fuel. A number of tests of biodiesel in pre-2010 (no aftertreatment on engines) reported increases in NOx on the order of 2 to 5 percent for B20, although the results varied across engine platforms and duty cycles. The EPA 2002 citation contained an often-cited figure showing a small NOx increase with biodiesel blends. More recent studies with newer engines generally conclude that biodiesel does not increase NOx with statistical significance (Lammert et al., 2012; McCormick et al., 2006). A deep review published by SAE (Robbins et al., 2011) concluded that “NOx effects are small and variable.”
4.9.3.3 Summary
Biomass-derived diesel fuels are commercially developed and in widespread use in the U.S. diesel fuel pool. The use of these fuels represents a pathway to reduced GHG emissions (WTW) for MHDVs, with the magnitude depending on the blend level and production process, of course. The impacts on criteria emissions and CO2 at the vehicle level are dependent on blend levels, baselines of comparison, and specific vehicles (CRC, 2014). EPA identified biobased diesel fuels as meeting at least a 50 percent GHG reduction criterion compared to petroleum as required in the Renewable Fuel Standard (EPA, 2010). Independent studies (Huo et al., 2009) have indicated similar levels of GHG reduction.
Finding: Petroleum-derived diesel fuel will likely remain the dominant CI engine fuel through the time period of this study (approximately 2030). Regarding changes to diesel fuel to reduce life-cycle GHG, an effective measure would be additional use of biomass-derived fuel components (in contrast to changing diesel fuel cetane number). Renewable diesel fuel (HDRD) and biodiesel are both well developed, commercially available, and suitable for this path. They offer overall GHG reduction of up to about 80 percent relative to petroleum-derived diesel.
Recommendation 4-7: Engine manufacturers, with appropriate engagement of NHTSA and EPA, should allow and promote use of biodiesel and renewable diesel in their engines. NHTSA, in concert with EPA, is encouraged to continue some types of incentive for use of biomass-derived diesel fuel because of the overall GHG reduction. The agencies are encouraged to seek harmony and synergy between their separate rules for renewable fuels and tailpipe regulations to enable further GHG reduction and petroleum displacement.
4.9.4 Trends and Impacts from Gasoline Fuel Properties
As noted in the engine section of this report, a significant number of MHDVs are gasoline fueled; over half of Class 3 and 4, for example, are nondiesel, although the overall fuel consumed in these classes is far less than in Class 8 trucks. Recent news noted that about half of buyers of Ford Class 3 to 5 trucks are opting for SI engine power (Government Fleet News, 2014). It is likely that advanced SI engine technologies like boosting and downsizing will find greater use in these classes of trucks, which will close the fuel economy advantage of diesels. The SI engines offer lower initial cost and at least for now a lower fuel price. Two aspects of SI engine fuels’ reduction of GHG emissions from MHDVs are noted here:
___________________
19 See http://biodiesel.org/using-biodiesel/oem-information/oem-statement-summary-chart (accessed December 30, 2018).
- Recent studies have suggested that overall WTW GHG emissions in future SI vehicles can be reduced with higher-octane-number gasoline, especially if the engines or vehicles are optimized for the higher-octane fuels. There is even a small benefit in the legacy vehicles if higher-octane fuels are used (Leone et al., 2015; Theiss et al., 2016).
- The magnitude of the GHG reduction is generally greater if renewable, high-octane blending materials (ethanol, butanol, etc.) are used to achieve the higher anti-knock performance (Leone, 2015; Theiss et al., 2016). Higher blend levels of biofuels in gasoline, for example, higher than approximately 25 percent, may require changes in refueling infrastructure, but this is being addressed in new dispenser installations ongoing at present. As of 2017, about 40 percent of gasoline dispensers sold in the United States were compatible with E25, largely because a major supplier, Wayne Fueling, is making all of their new dispensers E25 compatible (Renewable Fuels Association, 2016). Many underground tanks and lines are also already compatible with higher blends, up to E100 (Moriarty et al., 2014). Such higher blends may offer overall GHG emissions on a WTW basis. According to recent studies by three DOE National Laboratories (Theiss et al., 2016):
The experimental and analytical results of this study considered together show that High Octane Fuels (HOF), specifically mid-level ethanol blends (E25-E40), could offer significant benefits for the United States. These benefits include an improvement in vehicle fuel efficiency in vehicles designed and dedicated to use the increased octane. The improved efficiency of 5-10% could offset the lower energy density of the increased ethanol content, resulting in volumetric fuel economy parity of E25-E40 blends with E10. Most of the flex-fuel vehicles on the road today would be expected to have faster acceleration using HOF, which offers a marketing opportunity in the near term. Furthermore, dedicated HOF vehicles would provide lower well-to-wheel GHG emissions from a combination of improved vehicle efficiency and increased use of ethanol. If ethanol were produced using cellulosic sources, GHG emissions would be expected to be up to 30% lower than those from E10 using conventional ethanol and gasoline. Refinery modeling suggests that refiners could use higher levels of ethanol to meet potentially high market shares of HOF.
Hence, unlike diesel fuel, there appear to be GHG benefits in SI engine fuels by future improvements in performance properties such as octane number.
Tier 3 rules for criteria emissions include a further reduction in gasoline fuel sulfur level to 10 ppm starting in 2017. This is expected to extend performance of aftertreatment devices, reduce criteria emissions from in-use as well as Tier 3 emission vehicles, and bring the U.S. fuel sulfur level in harmony with California, Japan, and Europe.20 The reduced sulfur could possibly enable U.S. commercialization of lean-burn SI engines which offer part-load efficiency benefits compared to stoichiometric operation engines.
In addition to the importance of sulfur level and octane number, attention is drawn to the impact of gasoline properties on PM emissions from SI engines. Modern direct-injection SI engines emit higher levels of PM than premixed charge engines. EPA Tier 3 standards are calling for a 70 percent reduction in PM emissions from light-duty cars and trucks, to 3 mg/mi; 8 mg/mi from Class 2b trucks; and 10mg/mi from Class 3 trucks. Over the past few years, strong correlations were developed between certain gasoline fuel properties (principally volatility and double-bond-equivalent) and PM emissions, as described in the literature on PM index (PMI). Retail gasolines across the United States were found to create a fourfold variation in PM emissions from typical vehicles. Honda et al. developed a predictive index for PM emissions based on several key fuel properties that appears to be valid for many fuels and engine types (Aikawa and Jetter, 2013; Aikawa et al., 2010). The general trends are as follows:
- Fuels with components of low vapor pressure increase PM.
- Fuels with high content of double carbon bond equivalent (DBE) HCs increase PM.
___________________
20 Emission and Fuel Standards 2014. 40 CFR Parts 79, 80, and 85. April.
- High levels of highly reactive HCs like indene tend to increase PM.
- Oxygenates such as ethanol and methanol tend to decrease PM when merely added to a base gasoline (splash blending). Match blending (for constant volatility) with ethanol can actually cause higher PM emissions. Results are variable in the literature.
The PMI is expressed as a function of the vapor pressure of fuel components and the DBE.21 The DBE has been found to correlate well with PM mass and number for many gasoline vehicles, although EPA studies found some vehicles that did not follow the correlation (Butler et al., 2015). The committee notes a PMI of some type as a possible future feature of gasoline specifications.
Finding: In consideration that SI engines fueled with gasoline-based fuels are economically attractive for some market segments, GHG reductions with these engines can be enhanced by improving the performance properties of the fuel such as octane number and maintaining or increasing the content of renewable fuels. The effect of a moderate increase in octane number (RON) on efficiency is 5 to 10 percent improvement, whereas the GHG reduction can be up to 30 percent if renewable ethanol is the high-octane-number blending material (Leone, 2015; Theiss et al., 2016).
Recommendation 4-8: NHTSA, in coordination with EPA, should consider and further analyze scenarios where SI engines and gasoline-like fuels play a larger role in freight movement. The regulatory environment they develop should enable and encourage adoption of the best technologies for gasoline SI engines into MHDVs, including higher octane number in the fuels since it is shown as an overall GHG benefit.
4.9.5 Natural Gas
Natural gas and fuels derived from natural gas were covered in depth in the committee’s first report (NRC, 2014). A key finding noted lower engine efficiency with NG and the body of analysis estimating that methane leakage tended to offset the inherent GHG benefits of the low-carbon fuel. The load-specific CO2 emissions from NG engines are generally 5 to 20 percent less than those from comparable diesel engines. NG’s inherent GHG benefit by virtue of its low carbon content (approximately 28 percent) is partially negated by lower efficiency in currently available engines and the higher GHG impact of methane emissions (NRC, 2014, p. 65). The committee recommended further study of leakage and related methane emissions to quantify the trade-offs, and will review here several studies released in 2015.
Also in the first report, the committee addressed the “new” interest in natural gas derived principally from increased domestic NG extraction owing primarily to process developments permitting major volumes of gas removal from tight shale deposits in the vast Utica and Marcellus shale region (the “fracking” process). This NG availability has driven its price down to extremely low levels compared to diesel, whose prices had been significantly increasing over the prior decade.
Nearly simultaneously, the petroleum exploration and extraction industries, especially in the United States and Canada, have significantly reduced the North American petroleum dependencies on other world regions. And, now, depressed diesel fuel prices resulting from a world petroleum glut with Organization of the Petroleum Exporting Countries–controlled pricing finds September 2015 natural gas at a small diesel energy equivalent price differential (Q3-2015 Diesel, $2.62; NG, $2.35) (ACT, 2015), effectively resulting in an unacceptable payback period, since NG fuel consumption is exacerbated by its poorer engine efficiency.
Progress in engine efficiency continues for both CI and SI engines using a variety of fuels, as well as new analysis of methane leakage impacts. CARB is furthermore studying reduction of NOx emissions standards by
___________________
21 The double bond equivalent is also called the degree of unsaturation. In the chemical structure, each pi bond will generate one DBE. The DBE can also be calculated with the following formula, where C is the number of carbon atoms, H is the number of hydrogen and halogen atoms, and N is the number of nitrogen atoms:
![]()
SOURCE: Committee generated using Department of Energy Alternative Fuels Data Center widget titled “U.S. Alternative Fueling Stations by Fuel Type.”
approximately 90 percent, which could change the GHG comparison of NG to diesel fuel. New WTW studies of NG have been conducted (Carnegie Mellon, ICCT, and ANL). Sales of NG-fueled MHDVs increased more than 25 percent in 2014 compared to 2013 (NGV America, 2014), although still less than 1 percent of NG is used for vehicle fuel. EIA forecasts large growth in NG usage, especially for freight vehicles (EIA, 2014), yet this still accounts for only 7 percent of heavy vehicle fuel use in 2040. These projections are generally more conservative than the National Petroleum Council study of 2012. The number of liquefied natural gas (LNG) and compressed natural gas (CNG) refueling stations has continued to grow since 2009—about 948 and 76, respectively22—and has surpassed the peak number from nearly 20 years ago (Figure 4-20). Over half of these stations are available to the public. Providers of CNG tanks have also made progress in reducing the price of that component.
Some manufacturers of HD NG engines suspended development of those programs in late 2014 and early 2015 when the return-on-investment driver for their product was drying up. Only Cummins-Westport, who introduced their ISX 12L-G in mid-2013, continued forward. Certain financing companies have offered truck companies incentives to continue their purchases (ACT, 2015). Nevertheless, the potential reduction in operating cost still holds great potential for this industry whenever diesel prices return to a reasonably stable and commercially favorable (for NG) differential.
4.9.5.1 Impacts of Natural Gas Leakage on Overall GHG Benefits of Natural Gas–Fueled MHDVs
Recent studies on natural gas supply chain leakage have estimated that relatively low levels of methane emissions could detract from the GHG reduction benefit that might otherwise accrue from the use of this fuel relative to diesel. The United States, through its network of 555,364 producing gas wells23 and 305,000 miles of
___________________
22 U.S. Department of Energy, Alternative Fuels Data Center. “Natural Gas Fueling Station Locations.” Available at http://www.afdc.energy.gov/fuels/natural_gas_locations.html (accessed March 30, 2017).
23 Energy Information Administration, February 28, 2017, “Number of Producing Gas Wells.” Available at https://www.eia.gov/dnav/ng/ng_prod_wells_s1_a.htm (accessed March 30, 2017).
NG pipeline24 in the lower 48 states, already deals with complex methane leakage control issues. For example, the leakage of domestic natural gas has been estimated at roughly 10 grams CO2-equivalent per megajoule (MJ), with the majority occurring in production and with decreasing amounts in processing, transmission, and distribution. Another 6 grams CO2-equivalent per MJ is attributed to flaring and fuel consumption (Venkatesh et al., 2012).
These extensive upstream facilities link to local delivery systems which provide gas storage, compression, and, in the motor vehicle case, vehicle fueling hardware and process, each with their own sealing mechanisms. All of these upstream leakages that occur through dispensing into the vehicle’s on-board tank can be referred to as well-to-tank (WTT) leakages. Once in a vehicle fuel tank, we now might refer to methane leakages and losses as comprising tank-to-wheel (TTW) leakage. It follows:
WTW = WTT + TTW
In the case of SI, stoichiometric NG engines TWCs, there is opportunity for methane both to pass uncombusted into the tailpipe and to pass unchecked from the crankcase valve. Methane passing is counted as leakage. Typically, the TWC is not fully capable of eliminating small levels of unburned methane. Eliminating tailpipe methane emissions is a long-standing challenge for oxidation catalysts, but there has been ongoing R&D to improve methane oxidation due to its global warming potential. Cummins made rapid progress with their NG engines in 2016 and received “near-zero” emissions certification from CARB and EPA for 0.02 g/hp-h NOx (Cummins Westport, 2016). Methane slip has been reduced by about 70 percent by closing the crankcase ventilation and more effective catalysts.
A recent study (Clark et al., 2017b) of pump-to-wheels (PTW) emissions for heavy-duty vehicles found total methane emissions for an assumed scenario and vehicle mix to be 1.33 percent by mass of the fuel used. Both high-pressure direct-injection CI and stoichiometric SI engines, and both CNG and LNG fuels and fueling stations, were addressed in this study. Engine crankcase emissions represented about 39 percent of the losses, so that the latest engines with closed crankcases would reduce losses to 0.81 percent of fuel used. A second paper (Clark et al., 2017a), which used the data to project future scenarios, suggested that for 2035 methane PTW losses could range from 0.15 to 0.67 percent. Alvarez et al. (2012) computed that 2.4 percent of U.S. gas production was lost due to leaks and venting from production to local distribution, based on an EPA estimate.
A further study, by the ICCT, published an analysis of leakage (Delgado and Muncrief, 2015). The results are summarized in Table 4-3.
4.9.5.2 Methane Leakage and CO2 Emissions: Scenarios and Pathways (Delgado and Muncrief, 2015)
ICCT conducted and published a study on the potential GHG benefits of NG vehicles by considering various scenarios of market penetration, leakage levels, global warming potential (GWP), and engine efficiency gap relative
TABLE 4-3 Summary of Low and High Estimates of Well-to-Wheels Methane Loss, as a Percentage of Fuel Delivered
| Source | Reference Low Estimate | Reference High Estimate |
|---|---|---|
| Well to pump | 1.4 | 2.6 |
| Fueling station | 0.3 | 0.3 |
| Tailpipe | 0.1 | 0.9 |
| Crankcase (or HPDI venting) | 0.4 | 0.8 |
| TOTAL | 2.2 | 4.6 |
SOURCE: Delgado and Muncrief (2015).
___________________
24 Energy Information Administration, 2008, “Estimated Natural Gas Pipeline Mileage in the Lower 48 States, Close of 2008.” Available at https://www.eia.gov/pub/oil_gas/natural_gas/analysis_publications/ngpipeline/mileage.html (accessed March 31, 2017).
to diesels. Their primary tool in the analysis was the Argonne National Laboratory Vision Model. The scope of the analysis is strictly limited to heavy-duty vehicles, so nothing can be concluded for light-duty passenger vehicles. Class 3 to 6 natural gas vehicles and Class 7 and 8 straight units were assumed to use SI engines and CNG as fuel supply, and Class 7 and 8 combination trucks were assumed to use HPDI engines and LNG as fuel supply (Delgado and Muncrief, 2015).
The ICCT scenarios for natural gas vehicles (NGVs) market share estimates were described in their text and are consistent with forecasts reported in the committee’s first report. Their scenarios assume the market share reaches the selected penetrations in 2025 and beyond. The Vision Model’s resulting benefits (positive or negative) are achieved in 2040, where 2040 is imagined as a mature fleet. The model reports a GHG fleet inventory for the scenarios and compares each to a reference case with a trivial 1 percent NGV market share. “The Reference case assumes that the new vehicle fleet sees efficiency improvements of 3.5 percent per year [in vehicle fuel efficiency], and that the share of natural gas–fueled trucks remains at about 1 percent of the market, with methane leakage assumed to be 1.1 percent and natural gas trucks continuing to have a 10 percent efficiency gap (or loss) versus diesel” (Delgado and Muncrief, 2015, p. 17).
The reference case benefits are driven by the assumed 3.5 percent per year fleet efficiency improvements (for 2018 through 2025). That assumed annual improvement is driven by Phase II regulations and is supported by industry forecasts documented in the ICCT reference. Selected scenarios representing a range of WTW cases and a range of engine efficiency gap cases are reported in Table 4-4.
These results at a 10 percent efficiency gap indicate that zero leakage is needed for NG vehicles to reduce GHG emissions below the reference case, and that the loss of benefits is potentially very large (39 percent) compared to the overall reference Phase II benefits. Note that the committee’s current analysis presented in Chapter 6 of this report shows an efficiency gap of over 15 percent between a modern diesel and a SI-NG engine. ICCT further examined the impact of increasing NG engine efficiency, such as HPDI engines, so that the gap was 0 to 15 percent. The ICCT results are shown in Table 4-5, where the leakage was fixed at the reference case (latest EPA estimate).
The average NGV efficiency gap needs to be under 10 percent to avoid a worse (negative) global result than the reference case (1.0 percent market share [MS]). The source analysis did not describe the technologies to achieve
TABLE 4-4 Estimated Sensitivity of Emissions of NG Vehicles (Life-Cycle Basis) with Varying Well-to-Wheels Leakage Rates
| No. | Name | NGV Market Share | WTW Leakage | Methane GWP | NGV Efficiency Gap | GHG Benefits (millions of metric tons CO2e) | Percentage Change from Reference |
|---|---|---|---|---|---|---|---|
| R | Reference (Phase II) | 1% | 1.1% | 28 | 10% | 144.9 | - |
| 1 | High MS, no leak, 100 y | 20% | 0.0% | 28 | 10% | 151.7 | 5% |
| 2 | Mid MS, no leak, 100 y | 10% | 0.0% | 28 | 10% | 147.1 | 2% |
| 3 | High MS, mid leak, 100 y | 20% | 2.2% | 28 | 10% | 143.1 | -1% |
| 4 | Mid MS, mid leak, 100 y | 10% | 2.2% | 28 | 10% | 142.7 | -2% |
| 5 | Mid MS, high leak, 100 y | 10% | 4.6% | 28 | 10% | 137.9 | -5% |
| 6 | High MS, high leak, 100 y | 20% | 4.6% | 28 | 10% | 133.6 | 8% |
| 7 | Mid MS, mid leak, 20 y | 10% | 2.2% | 84 | 10% | 130.5 | -10% |
| 8 | High MS, mid leak, 20 y | 20% | 2.2% | 84 | 10% | 119.3 | -18% |
| 9 | Mid MS, high leak, 20 y | 10% | 4.6% | 84 | 10% | 115.1 | -21% |
| 10 | High MS, high leak, 20 y | 20% | 4.6% | 84 | 10% | 89.1 | -39% |
NOTE: CO2e, carbon dioxide equivalent; GHG, greenhouse gas; GWP, global warming potential; MS, market share; NGV, natural gas vehicle; WTW, well to wheels. Annual benefits are for 2040.
SOURCE: Delgado and Muncrief (2015).
TABLE 4-5 Estimated Sensitivity of Emissions of NG Vehicles (Life-Cycle Basis) with Varying Efficiencies Gaps
| No. | Name | NGV Market Share | WTW Leakage | Methane GWP | NGV Efficiency Gap | GHG Benefits (MMTCO2e) | Percentage Change from Reference |
|---|---|---|---|---|---|---|---|
| R | Reference (Phase II) | 1% | 1.1% | 28 | 10% | 144.9 | - |
| 11 | High MS, low leak, 100 y, 0% gap | 20% | 1.1% | 28 | 0% | 155.6 | 7% |
| 12 | High MS, low leak, 100 y, 5% gap | 20% | 1.1% | 28 | 5% | 151.7 | 5% |
| 13 | Mid MS, low leak, 100 y, 0% gap | 10% | 1.1% | 28 | 0% | 149.0 | 3% |
| 14 | High MS, low leak, 100 y, 10% gap | 20% | 1.1% | 28 | 10% | 147.4 | 2% |
| 15 | Mid MS, low leak, 100 y, 5% gap | 10% | 1.1% | 28 | 5% | 147.1 | 2% |
| 16 | Mid MS, low leak, 100 y, 10% gap | 10% | 1.1% | 28 | 10% | 144.9 | 0% |
| 17 | High MS, low leak, 100 y, 15% gap | 20% | 1.1% | 28 | 15% | 142.5 | -2% |
| 18 | Mid MS, low leak, 100 y, 15% gap | 10% | 1.1% | 28 | 15% | 142.4 | -2% |
NOTE: GHG, greenhouse gas; GWP, global warming potential; MMTCO2e, million metric tons carbon dioxide equivalent; MS, market share; WTW, well to wheels. Annual benefits are for 2040.
SOURCE: Delgado and Muncrief (2015).
1.1 percent leakage level. Indeed, it cannot be achieved without the kinds of leakage reduction processes EPA has proposed for the oil and natural gas industry sectors (EPA, 2015b).
Finding: Both WTW methane leakages and the NG-to-diesel thermal efficiency gap are critical to NG-fueled HD trucks achieving the previously anticipated CO2 benefit compared to legacy diesels. Even at an optimistic efficiency gap of 10 percent, the upstream leakages potentially negate the benefits of NG low carbon content. The committee’s review of the literature has found the NG engine efficiency gap over most drive cycles to be over 15 percent. WTT leakages appear to hold the most importance, and EPA is proposing significant emphasis on industry actions to reduce the upstream methane leaks. NG SI combustion engines will likely always have some thermal efficiency deficit with comparable model year diesel; this is due to inlet air throttling which degrades thermal efficiency. Among available technologies, natural gas HPDI engines are expected to enable the greatest reduction of the efficiency gap.
Finding: Methane leakage to the engine crankcase will persist more significantly in SI versus DI engine combustion systems. This is due to leakage of the cylinder contents into the crankcase during the relative compression strokes, and where in SI there is high methane content. Yet in SI, the crankcase content might be positively ventilated to the vehicle exhaust and catalytically combusted there.
NG engines designed for direct injection of the fuel are found to have much reduced methane tailpipe and methane crankcase leakages, based on their fuel delivery and lean combustion characteristics.
Recommendation 4-9: Given the significance of WTW methane leakages and losses on GHG reduction, NHTSA and EPA should monitor progress on all of those errant upstream methane emissions and use a regulatory approach that accounts for them along with the tailpipe GHG emissions.
4.9.5.3 Analysis of the Report Life Cycle GHG for Natural Gas Pathways in MHDVs, Including Leakage Effect (Tong et al., 2015)
In its first report (NRC, 2014), the committee noted multiple pathways to use natural gas in MHDVs, including direct combustion (as in the just-reviewed ICCT study), conversion to electricity, and conversion to other liquid
fuels such as Fischer-Tropsch liquids, dimethyl ether, and ethanol. Carnegie Mellon University (CMU) researchers (Tong et al., 2015) analyzed multiple pathways of using natural gas for road transportation and compared them for different types of MHDVs. Life-cycle analyses were performed on a comprehensive set of natural gas–derived fuels, engine technologies, and vehicle types, and most importantly included the impacts of methane leakage. We summarize the results of this study and suggest the reader review the publication for detailed analyses and conclusions.
Shown below in Figure 4-21 are the different pathways examined. As shale gas is an increasing percentage of the NG produced in the United States, it was assumed to be the primary source in the analysis. Carnegie Mellon researchers defined the baseline fuel pathways as conventional gasoline (Class 2b) and conventional (ultralow-sulfur) diesel (Class 3 through 8 MHDVs). There are four stages in the life cycle of the pathways: feedstock (natural gas) production and transport, transportation fuel production, transportation fuel delivery, and vehicle use. The analysis estimates of GHGs, CO2, methane, and N2O are converted to CO2 equivalents for the GWP values.
Table 4-6 considers seven types of MHDVs and their interaction between fuel pathways, vehicle engine technologies, and types MHDVs with various parameters. The detailed assumptions and estimates are provided in the Carnegie Mellon reference. The primary functional metrics are (1) vehicle distance traveled (gCO2-e/km) and freight-distance moved (gCO2-e/km-metric-ton).
To account for a potential bias in methane leakage rate estimates, and also to account for choices of GWPs with different integration periods,25 four scenarios were considered: (1) a baseline methane estimate with 100-year GWP (baseline scenario), (2) a baseline methane estimate with 20-year GWP, (3) a pessimistic estimate with 100-year GWP, and (4) a pessimistic estimate with 20-year GWP.
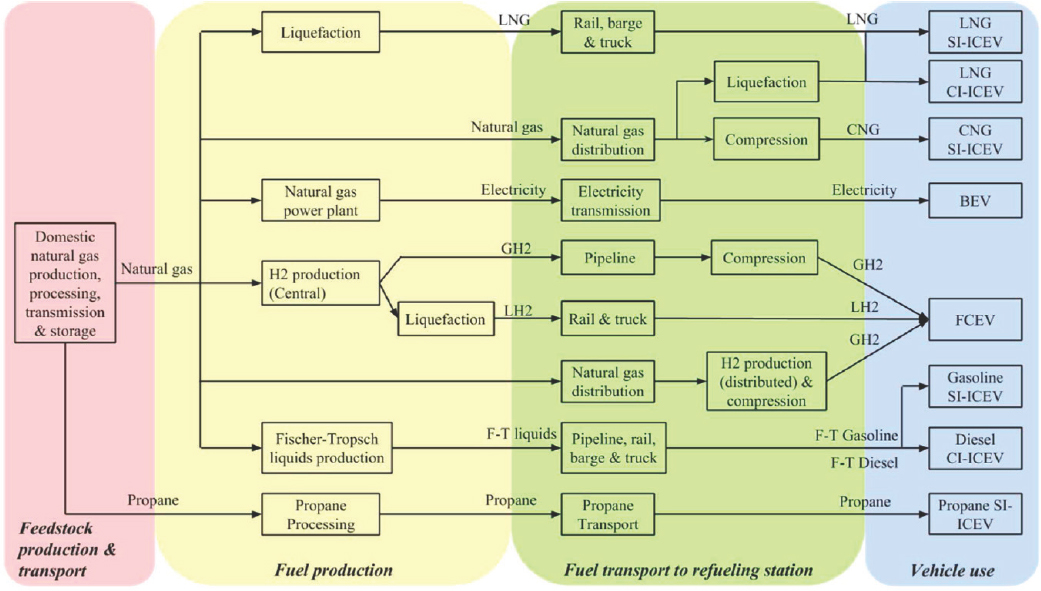
NOTE: Further permissions related to use of this material should be directed to the American Chemical Society (ACS).
SOURCE: Tong et al. (2015), available at: https://pubs.acs.org/doi/abs/10.1021/es5052759 (accessed December 18, 2019).
___________________
25 GWP is defined per unit mass of a gas as the ratio of its time-integrated radiative forcing to that of CO2. The period of time integration is user defined.
TABLE 4-6 Vehicle Specifications for Different Fuel Pathways and Different Vehicle Applications
| Class 2b Pickup Truck/Van | Class 4 Parcel Delivery Van | Class 6 Box Truck | Class 8 Transit Bus | Class 8 Refuse Truck | Class 8 Tractor-Trailer Local Haul | Line Haul | ||
|---|---|---|---|---|---|---|---|---|
| Unit of fuel economya | mpg/L/100 km | mpg/L/100 km (diesel gallon/liter equivalent) | ||||||
| Gasoline (SI-ICEV) | 14.0/16.8a | - | - | - | - | - | - | |
| Diesel (CI-ICEV) | 16.1/14.6 | 11.5/20.5a | 7.0/33.6a | 4.0/58.8a | 3.3/71.3a | 4.3/54.7a | 6.5/36.2a | |
| Gasoline-HEV (SI-ICEV) | 16.8/14.0 | 10.9/21.5 | - | - | - | - | - | |
| Diesel-HEV (CI-ICEV) | 19.3/12.2 | 14.4/16.4 | 9.3/25.3 | 4.8/49.0 | 3.6/64.8b | 5.2/45.6 | 7.2/32.9 | |
| CNG (SI-ICEV) | 14.0/16.8 | 10.8/21.8 | 6.6/35.7 | 3.6/65.3 | 2.9/81.0 | 3.9/60.8 | 5.9/40.2 | |
| LNG (SI-ICEV) | - | - | - | 3.6/65.3 | 2.9/81.0 | 3.9/60.8 | 5.9/40.2 | |
| LNG (CI-ICEV) | - | - | - | - | - | 4.2/55.8 | 6.4/36.9 | |
| Propane (SI-ICEV) | 14.0/16.8 | - | - | - | - | - | - | |
| BEV | 42.0/5.6 | 34.5/6.8 | 21.0/11.2 | 16.8/14.0 | - | - | - | |
| H2-FCEV | - | - | - | 7.6/30.9 | - | - | - | |
| Conventional Truck | Gross weight (lbs) | 8,501-10,000 | 16,000 | 19,501-26,000 | 39,980 | 60,000 | 80,000 | 80,000 |
| Empty weight (lbs) | 5,000-6,300 | 9,700 | 11,500-14,500 | 27,730 | 16,627 | 30,500 | 35,550 | |
| Payload (lbs) | 3,700 | 6,300 | 11,500 | 12,150 | 43,373 | 49,500 | 44,450 | |
| Alternative fuels | Weight penalty for payloads (lbs) | Gasoline/diesel HEV: 350 CNG: 200 BEV: 600 |
Gasoline/diesel HEV: 0 CNG: 0 BEV: 200 |
HEV: 1200 CNG: 515 BEV: 200 |
Gasoline/diesel HEV: 0/750 CNG: 900 LNG: 1150 H2-FCEV: 5,400 BEV: 4,800 |
Hybrid: 400 CNG: 915 LNG (SI): 265 |
HEV: 880 CNG: 502 LNG (SI): 252 LNG (CI): 1249 |
HEV: 880 CNG: 2042 LNG (SI): 1142 LNG (CI): 2541 |
| Volume penalty | Reduced cargo space | No difference (except for transit buses) because fuel tanks are mounted on the chassis, behind the cabin, or atop the vehicle. For transit buses, volume penalty has been factored into weight penalty. | ||||||
NOTE: CNG, compressed natural gas; LNG, liquefied natural gas; SI-ICEV, spark-ignition internal combustion engine vehicle; CI-ICEV, compression-ignition internal combustion engine vehicle; HEV, hybrid electric vehicle; BEV, battery electric vehicle; H2-FCEV, hydrogen fuel cell electric vehicle; mpg, miles per gallon.
aThe baseline petroleum fuel pathway is marked.
bA diesel refuse truck with hydraulic hybrid system is assumed.
NOTE: Further permissions related to use of this material should be directed to the American Chemical Society (ACS).
SOURCES: Tong et al. (2015), available at: https://pubs.acs.org/doi/abs/10.1021/es5052759 (accessed December 18, 2019). Vehicle figures: NREL (2013).
The CMU study included
- Life-cycle assessment (LCA) of the multiple pathways using a best estimate for methane leakage and
- Analysis to determine a break-even level of methane leakage that would be needed to ensure a net GHG benefit with natural gas.
Based on extensive review of the literature on methane leakage, which is a topic of continuing study, CMU determined to use a leakage level of 1.0 to 2-2 percent for the initial LCA. We show three examples from the CMU paper (see Figures 4-22, 4-23, and 4-24) that are similar vehicles to those emphasized elsewhere in our report: Class 2b pickup, Class 6 box truck, and Class 8 line haul.
CMU estimated that, where the technology is available (pickups, buses), the path of natural gas to electricity in battery electric vehicles (BEVs) is advantageous for GHG emission reduction. However, comparing CNG to conventional diesel vehicles in delivery trucks and Class 8 line hauls suggests that natural gas vehicles would not offer a net GHG benefit for any of the pathways considered.
The second phase of the CMU study examined the question of what leakage level would be necessary to more likely ensure GHG benefits from natural gas. As described in the previous section on the ICCT study, the efficiency gap between natural gas and diesel fuel end-use devices is a key parameter as well.
Figure 4-25 is reproduced from Tong et al. (2015) and shows the break-even life-cycle methane leakage rates for CNG and LNG vehicles. The methane leakage rate is defined as the volumetric percentage of natural gas produced that is lost through venting or fugitive leaks. It includes fugitive methane emissions from the natural gas system, boil-off leaks from production and storage of LNG, and crankcase and tailpipe methane leaks from
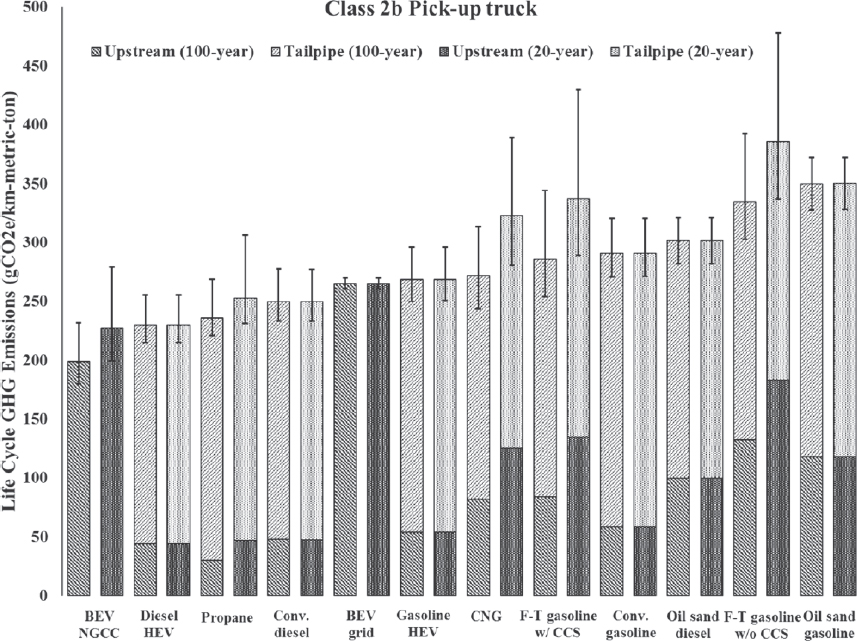
NOTE: Further permissions related to use of this material should be directed to the American Chemical Society (ACS).
SOURCE: Tong et al. (2015), available at: https://pubs.acs.org/doi/abs/10.1021/es5052759 (accessed December 18, 2019).
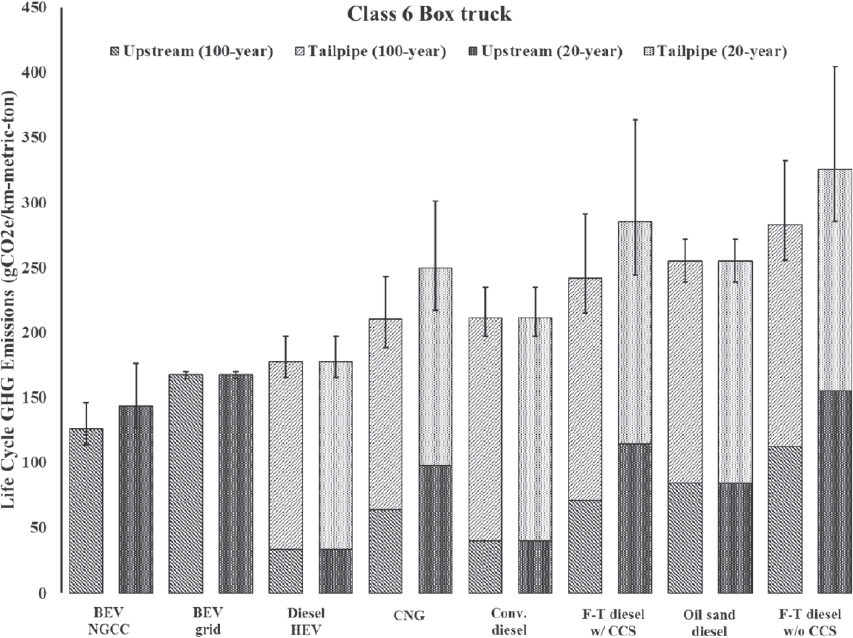
NOTE: Further permissions related to use of this material should be directed to the American Chemical Society (ACS).
SOURCE: Tong et al. (2015), available at: https://pubs.acs.org/doi/abs/10.1021/es5052759 (accessed December 18, 2019).
vehicle operation. The break-even life-cycle methane leakage rate identifies the methane leakage rate at which the natural gas fuel pathway and vehicle would have the same life-cycle greenhouse gas emissions as diesel. The figure can be interpreted as follows: If the vehicle fuel efficiency of the natural gas vehicle is the same as that of the diesel vehicle (i.e., it has a value of 0 percent), the methane leakage rate needs to be less than 1.2 percent for LNG vehicles to have lower life-cycle emissions than a diesel vehicle (if one uses the 100-year GWP) or less than 0.5 percent (if one uses the 20-year GWP). Similarly for CNG vehicles, if the vehicle fuel efficiency of the natural gas vehicle is the same as that of the diesel vehicle (i.e., it has a value of 0 percent), the methane leakage rate needs to be less than 3 percent for LNG vehicles to have lower life-cycle emissions than a diesel vehicle (if one uses the 100-year GWP) or less than 1.2 percent (if one uses the 20-year GWP).
In engine and vehicle modeling presented in Chapter 6, the committee has found the efficiency of NG engines to be on the order of 15 percent less than diesel.
4.9.5.4 Argonne National Laboratory GREET Analysis of Diesel and NG WTW Emissions
In 2016 the Greenhouse gases, Regulated Emissions, and Energy use in Transportation Model (GREET) analysis team at ANL also published a study comparing GHG emissions from diesel- and natural gas–powered medium- and heavy-duty vehicles (Burnham et al., 2016). The ANL team used a variety of sources to arrive at inputs to GREET for diesel- and NG-fueled vehicles, resulting in an overall picture of the efficiency advantage of diesels shown in Table 4-7 below. The study scope generally does not look as far ahead as the committee’s current study or the Phase II rule.
These values for projected fuel efficiency advantage for diesels are in the same parameter range as other studies, except the committee’s analysis and models show the NG disadvantage much higher for combination trucks. The
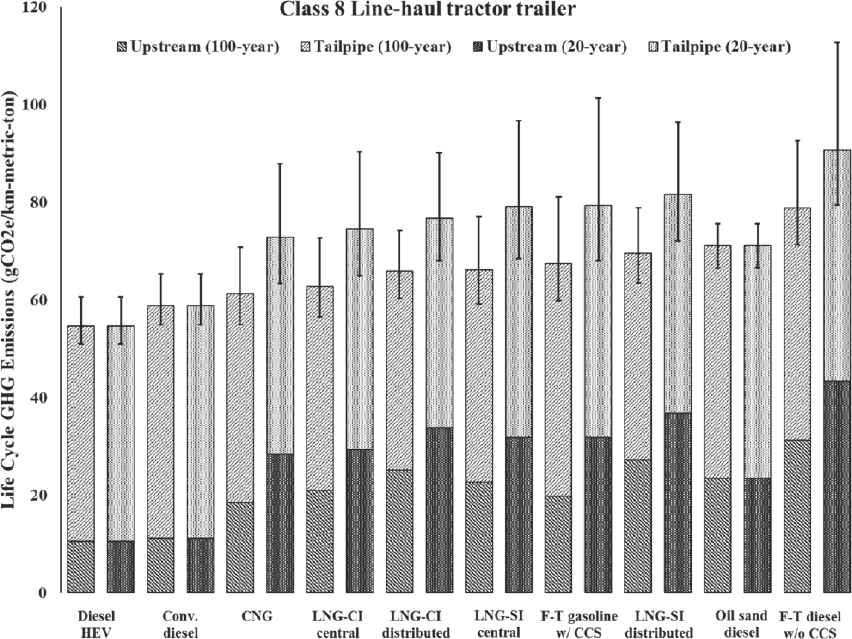
NOTE: Further permissions related to use of this material should be directed to the American Chemical Society (ACS).
SOURCE: Tong et al. (2015), available at: https://pubs.acs.org/doi/abs/10.1021/es5052759 (accessed December 18, 2019).
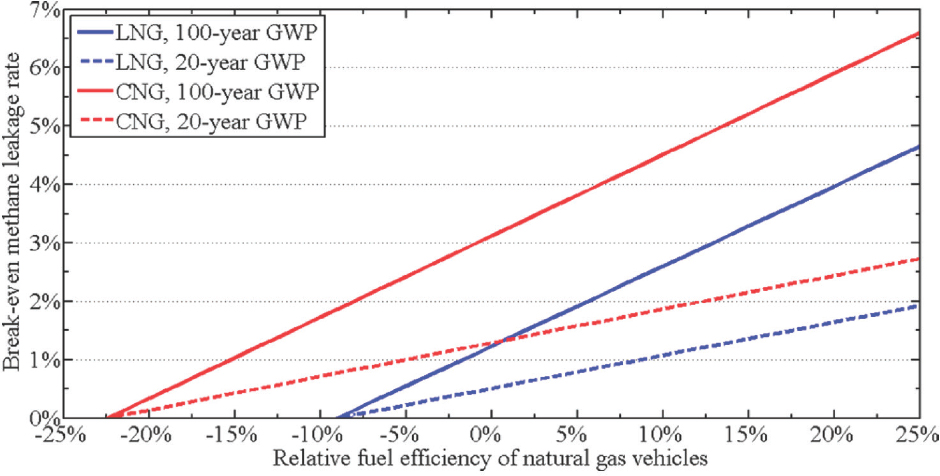
NOTE: Further permissions related to use of this material should be directed to the American Chemical Society (ACS).
SOURCE: Tong et al. (2015), available at: https://pubs.acs.org/doi/abs/10.1021/es5052759 (accessed December 18, 2019).
TABLE 4-7 Efficiency Advantage Assumed for Diesel Engines in GREET Analysis
| HDV Subcategory | MY 1990-2005 | MY 2010-2020 |
|---|---|---|
| SI NG combination long-haul or short-haul trucks | 0.80 | 0.90 |
| CI HPDI NG combination long-haul or short-haul trucks | 0.90 | 0.95 |
| SI NG heavy heavy-duty vocational vehicles | 0.80 | 0.90 |
| SI NG medium and light heavy-duty vocational vehicles | 0.75 | 0.85 |
| SI NG refuse trucks | 0.75 | 0.85 |
| SI NG transit buses | 0.75 | 0.85 |
| SI NG intercity buses | 0.80 | 0.90 |
| SI NG school buses | 0.75 | 0.85 |
| SI NG heavy-duty pickup trucks and vans | 0.75 | 0.85 |
NOTE: CI, combustion ignition; HDV, heavy-duty vehicle; HPDI, high-pressure direct injection; MY, model year; NG, natural gas; SI, spark ignition.
SOURCE: Burnham et al. (2016).
overall results for the ANL study for long-haul combination trucks are shown in Figure 4-26, predicting a slight GHG advantage for even the SI natural gas–powered vehicles, and the expected results that an HPDI natural gas engine would have a distinct GHG benefit. The assumed methane leakage rate is 2 percent for this figure, including upstream and vehicle seepage.
Similar to the ICCT and CMU studies, ANL prepared a parametric presentation of the trade-off between engine efficiency difference (diesel versus natural gas) and methane leakage in Figure 4-27. In summary they found that if parity were achieved in engine efficiencies, leakage could be 4 percent for a break-even GHG output for diesel or natural gas vehicles. On the other hand, if the SI natural gas engine had a 25 percent efficiency disadvantage, a leakage rate of zero would be needed for natural gas to have any GHG advantage.
Finding: With the present understanding of methane leakage levels and the efficiency of diesel versus natural gas engines, natural gas provides little or no GHG benefit over diesel-fueled vehicles.
4.9.5.5 Natural Gas Fuel Quality and Composition
In the Phase Two First Report (NRC, 2014) the committee recommended that natural gas engines and vehicles would probably benefit from at least consistency in fuel composition and preferably specifications for natural gas fuel composition for vehicles. At that time, efforts related to standards and studies on NG quality were getting under way. Several studies are now complete that confirmed significant variation in NG composition and properties by region and time at any given refueling location (CRC, 2014). Properties such as Wobbe Index,26 methane number, heating value, and sulfur level vary by 20 percent. In CRC project E-109 three NG light-duty vehicles were tested on seven NG fuels representative of the national survey.27 The findings are provided below (Box 4-1).
___________________
26 The Wobbe Index is the main indicator of the interchangeability of fuel gases and is frequently defined in the specifications of gas supply and transport utilities. The Wobbe Index is used to compare the combustion energy output with different compositions of fuel gases. If two fuels have identical Wobbe Indices then for given pressure and valve settings the energy output will also be identical. The Wobbe Index is a critical factor to minimize the impact of fluctuations in your fuel gas supply and can therefore be used to increase the efficiency of your burner or gas turbine applications.
![]()
27 Effect of Fuel Composition on the Emissions and Performance of Modern, Light-Duty Natural Gas Vehicles – CRC Project No. E-109, April 2015.
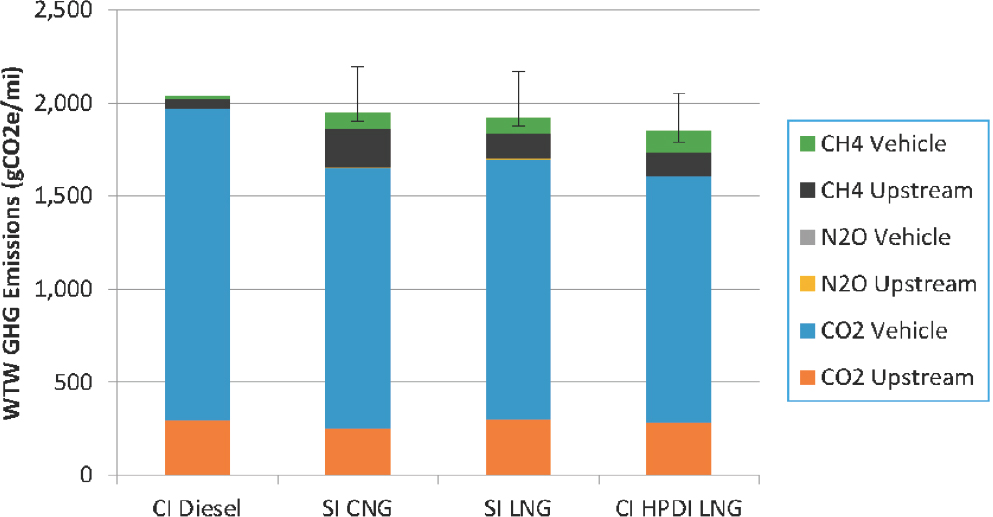
SOURCE: Burnham et al. (2016).
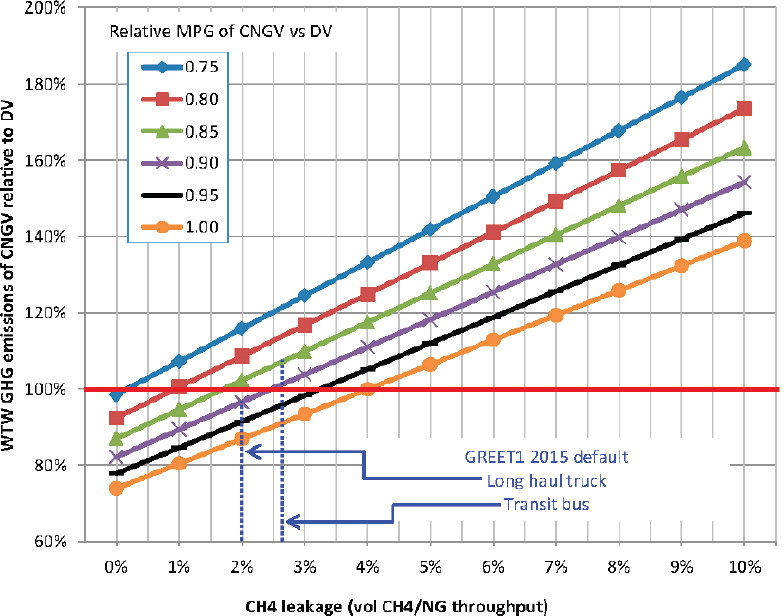
SOURCE: Burnham et al. (2016).
In California, the CARB- and South Coast Air Quality Management District–sponsored chassis dynamometer tests of two transit buses and a refuse hauler on seven NG fuels at University of California Riverside’s Bourns College of Engineering, Center for Environmental Research & Technology observed small effects on fuel economy and CO2, yet more notable impacts on criteria emissions (Durbin et al., 2012).
Finding: Natural gas composition is confirmed to have significant variation across the United States, both regionally and temporally. The effects on vehicle and engine emissions have been found to be statistically significant in published studies. Consistency of fuel properties and some limits on the range of property values would appear beneficial for vehicle and engine manufacturers.
Recommendation 4-11: The industry and fuel suppliers should work with regulatory agencies on a means to ensure greater consistency (less variability) in NG properties, including the limits on contaminants like moisture, sulfur, and particles. These efforts should include more comprehensive tests to confirm effects and needed specifications, and the test programs should include HPDI natural gas engines for MHDVs.
4.10 TRANSMISSION AND DRIVELINES
4.10.1 Introduction
The primary job of the transmission is to match the wheel speed to the optimum engine speed for torque, horsepower, and fuel usage. Over the past two decades, the improvements in engines have necessitated transmission changes to achieve the optimum match. The number of gears in the transmission has increased to allow the engine to operate in a narrower band of speeds as dictated by the fuel map. Engine torque curves have flattened and extended to lower engine speeds. Engine horsepower and torque have continued to increase, but not as rapidly as in prior decades. There has been a continued migration from mechanical transmissions shifted by the driver to electronically controlled transmissions that automatically shift based on the speed of the vehicle, road grade, and knowledge of the engine operation, including the fuel map.
Table 4-8 shows the typical types of transmissions used in each weight class of vehicle. The lower classes generally use transmission technology and products derived from the light-duty vehicles. By example, Class 3 and 4 walk-in vans have moved toward automatic transmissions over the past decade. Automatic transmission usage in Classes 5 and 6 has also increased. Automated mechanical transmissions with dry clutches, wet clutches, or torque converters have increased penetration in the past 5 years so that OEMs are reporting penetration rates in excess of 50 percent (NACFE, 2014). Dual clutch transmissions have recently been introduced by Volvo, Mitsubishi Fuso, ZF, Allison, and Eaton. Continuously variable transmissions are not a factor in these weight classes. The remainder of this chapter will primarily focus on Class 8 vehicle transmissions, since the majority of fuel for commercial vehicles is used by this classification of vehicle.
For the purposes of this report, transmissions are categorized as follows:
- Mechanical transmissions,
- Automated mechanical transmissions with dry or wet clutches,
- Automated mechanical transmissions with torque converters,
- Automatic transmissions,
- Continuously variable transmissions,
- Dual clutch transmissions, and
- Hybrid transmissions, electric and hydraulic (see Chapter 7 for more information).
Transmissions are efficient in translating rotational torque at the input to torque at the output. Efficiencies up to 98 percent are typical for steady-state operation. The fewer the number of gears that are meshed, the more efficient the transmission. The better the lubricating oil is dispersed, the more efficient. Compared to the opportunity for fuel savings through the engine, with its 42 to 48 percent efficiency today, the transmission would appear to
TABLE 4-8 Typical Transmission Types by Vehicle Weight Class
| Vehicle Weight Class | Transmission Types |
|---|---|
| 2b | 4, 5 |
| 3 | 4 |
| 4 | 4 |
| 5 | 1, 2, 3, 4, 6 |
| 6 | 1, 2, 3, 4, 6 |
| 7 | 1, 2, 3, 4 |
| 8 | 1, 2, 3, 4 |
NOTE: 1, mechanical transmissions; 2, automated mechanical transmissions with dry or wet clutches; 3, automated mechanical transmissions with torque converters; 4, automatic transmissions; 5, continuously variable transmissions; 6, dual clutch transmissions; 7, hybrid transmissions, electric and hydraulic.
be a much lower priority. However, better coordination of the shifting of the transmission can create significant savings for even long-distance, line-haul applications. The 2014 North American Council for Freight Efficiency (NACFE) Confidence Report: Electronically Controlled Transmissions provides a description of the basics of vehicle/engine/transmission driveline design and recent changes that have created technology solutions to improve fuel consumption. As discussed in the first report and elsewhere, the importance of real-world fuel savings has led to improved understanding of the duty cycles of commercial vehicles and the impact of freight efficiency in ton-miles per gallon. The simplified diagram of power demand, at constant speed on level ground, used for more than a decade is being replaced by diagrams such as these in Figure 4-28 from the 21st Century Truck Partnership RoadMap. This increased understanding of real-world impacts, combined with improvements in component and system design, has led to new insights and innovations for synergistic operation of the engine and transmission.
Key points are that
- Engines produce torque at lower speeds,
- The sweet spot of the engine fuel map has become smaller,
- Smaller engines weigh less and produce sufficient horsepower/torque,
- Shift density is increasing,
- Startability and gradeability remain key design parameters, and
- Engine and transmission parameters must be optimized.
These are the factors driving increases in the number of gears for the transmission, development of sensors and software to detect grade and mass of the vehicle, lock-up of torque converters as early as possible, development of dual clutch transmissions, predictive cruise control, and deeper integration of the engine and transmission controls.
4.10.2 New Product Developments
4.10.2.1 Mechanical Transmissions
Mechanical transmission development is focused on weight, lubrication, cooling, and gearing. Weight savings come from redesign of the housing to reduce its size, often eliminating wasted space inside the housing. It also comes from greater use of aluminum where possible. Lubrication improvements come from changes in the lubricant and changes in the internal transmission design to better ensure fluid is moved to the gear interfaces effectively. Gearing changes are regularly improved to adapt to the preferred engine speeds for fuel consumption and the axle ratios available. Axle ratios continue to get faster (lower number). Continued, but small, improvements in these areas are expected in the next decade.
4.10.2.2 Automated Mechanical Transmissions with Dry or Wet Clutches
This type of transmission has seen increased penetration on new vehicle orders for over-the-road trucks and tractors. Volvo publicly stated in March 2015 at the MidAmerica Truck Show that they are seeing in excess of 75 percent use on new vehicles. One year later, they are reporting 83 percent.28 Daimler Trucks North America indicates penetration rates of 42 percent in its high-volume Cascadia product.29 By August of 2016, the penetration had grown to over 60 percent.30 Both automated mechanical and automatic transmissions are an enabler for more advanced driver assistance systems and, eventually, more autonomous operation of vehicles.
___________________
28 See http://www.volvotrucks.us/about-volvo/news-and-events/new-volvo-i-shift-with-crawler-gears-offers-slow-speed-maneuverabilityextreme-startability/ (accessed December 18, 2019).
29 See http://www.hdma.org/Main-Menu/HDMA-Publications/Diesel-Download/September-17-2015/DT12-Detroit-Assurance-HelpingDTNA-Defend-Market-Share.html (accessed September 17, 2019).
30 See http://www.ttnews.com/articles/basetemplate.aspx?storyid=42839&page=2 (accessed December 18, 2019).
SOURCE: DOE (2013, p. 25).
4.10.2.3 Automatic Transmissions
Automatic transmissions dominate the lower weight classes of vehicles as shown in Figure 4-29 taken from the EPA Fuel Economy Trends Report (EPA, 2015c). Depending on the shape of the fuel curves of the engine, more or fewer gears are needed to maintain the engine at the best operating point. For passenger cars and light trucks, the trend is to increase the number of gears substantially. For heavy diesel engines, the trend is to flatten out the brake specific fuel consumption curves at the best fuel consumption points. This argues for fewer gears. Truck transmissions have had as many as 16 to 20 gears for a combination of the torque requirements, combined vehicle weight, and the engine fuel curves. The committee does not foresee a substantial increase in the number of gears for these applications. Class 6 vehicles are often used in urban delivery applications with much starting and stopping and low-speed operation. Recent developments, such as the Eaton Procision line, show seven gears in this product range.31
Figure 4-30 shows a larger view of the number of gears for light trucks. This trend can be expected to extend to the Class 2b through 6 categories, especially for vehicles and transmissions based on passenger car and light truck developments.
Figure 4-31 shows the Allison share of transmissions for several end-user markets for automatic transmissions in North America.
4.10.2.4 Continuously Variable Transmissions
Continuously variable transmissions (CVTs) are used heavily in passenger cars as shown above, where penetration is as much as 25 percent. Light truck penetration is lower, as shown in Figure 4-32, taken from the Vehicle Technologies 2017 Market Report by ORNL.
4.10.2.5 Dual Clutch Transmissions
Dual clutch transmissions (DCTs) are designed to minimize the torque interrupt during shifting. As the shift density for vehicles increases, this becomes more important. Mitsubishi Fuso, Eaton, Volvo, ZF, and Navistar have introduced DCTs in classes 3-8. PACCAR has announced it has begun an engineering program to introduce the transmission, but has not provided a date for availability.32 Penetration growth will depend on fleet experience with the transmission over the next 5 years or more, including reliability, serviceability, up-front cost, residual value, and any fuel consumption improvements. Fleets will likely look to the fuel usage improvement when compared to the automated mechanical transmission, rather than to a mechanical transmission. This is based on the high penetration of the automated mechanical transmissions without the dual clutch, the increased cost of the dual clutch, and the unknown maintenance costs.
Fuel Consumption Improvements: Large percentage improvements in fuel consumption are possible for medium- and heavy-duty trucks using automatic transmissions. These improvements are related to shift points and time to shift rather than to purely mechanical efficiency, as discussed in the technologies to more fully integrate the operation of the engine, transmission, driveshaft, and axle. However, since the majority of fuel in commercial vehicles is consumed by large vehicles operating at high speeds, it is important to look at the efficiency at this point. Transmissions are highly efficient in transferring mechanical power from input to output, especially in top gear where gear meshing is minimized. Allison Transmission automatics are 95 percent efficient or better.33 Eaton reports efficiencies of 96 to 99 percent in its comments on the Phase II Notice of Proposed Rulemaking. Given these efficiencies, the transmission alone is not a large contributor to losses of power in the vehicle. However, transmissions, in close cooperation with the engine, can allow the vehicle to achieve 3 to 6 percent improvement
___________________
31 Eaton, “Procision Dual-Clutch Automatic Transmission,” Available at http://www.eaton.com/Eaton/ProductsServices/Vehicle/Transmissions/procision/index.htm (accessed December 18, 2019).
32 See http://www.peterbilt.com/about/media/2016/501/ (accessed December 18, 2019).
33 Personal communication to Paul Menig from Michael J. Howenstein, Allison Transmission, December 11, 2015.
SOURCE: EPA (2015c).
SOURCE: ORNL (2017).
SOURCE: Allison Transmission Inc. (2016).
NOTE: CHR, Chrysler; FOR, Ford; GM, General Motors; NIS, Nissan; SUB, Subaru; TOY, Toyota.
SOURCE: ORNL (2017).
in fuel consumption over defined routes. This is accomplished through efficient shifting of the transmission to avoid loss during the shift and to place the engine in the best position on its fuel map.
Costs: Purchase price is often a small part of the cost of technology in the trucking industry. Additional considerations include resale value, maintenance requirements, training, and government incentives. Figure 4-33 is taken from the Automated Transmission Study (NACFE, 2014).34
Initial purchase price for transmissions, as paid by fleets, is difficult to determine publicly. In general, fleets report prices of $3,000 to $5,000 more for an automated transmission than for a mechanical transmission (NACFE, 2014). As Class 8 vehicle OEMs continue to improve fuel consumption to meet the Phase I regulations, and the Phase II regulations, the cost of the transmission may be dwarfed by the cost of the vehicle. This will make it even more difficult to determine the added cost of the new technology. Automatic transmissions for Class 8 vehicles are likely to cost more. The fleet cost typically ranges from $3,000 added cost to $11,000 or more. Figure 4-34 is taken from the Q2 2016 investor relations presentation of Allison Transmission. It provides a reasonable example of the added cost of technology.
Increased Shifting Density: As engine, transmission, and vehicle OEMs work to improve fuel consumption and reduce greenhouse gas emissions, engine speeds are decreasing. In some cases, there is a shift to using smaller displacement engines as well. Alone or in combination, these trends require more manipulation of the transmission gearing to keep the engine in its most efficient status under normal driving conditions. This is leading to an increased number of shifts per mile necessary for Class 8 vehicles to achieve fuel economy goals.
Finding: Automated transmission penetration in the commercial vehicle industry is growing significantly as engine, transmission, and vehicle OEMs work to improve fuel consumption for the benefit of the customer and to meet government regulations.
Recommendation 4-13: Future regulations for fuel consumption, criteria emissions, and greenhouse gases must take account of the close relationship of the engine, transmission, and axle ratios and the effect of lubricants on
___________________
34 The calculator itself can be accessed at http://www.nacfe.org/powertrain/automated-manual-transmissions (accessed December 18, 2019).
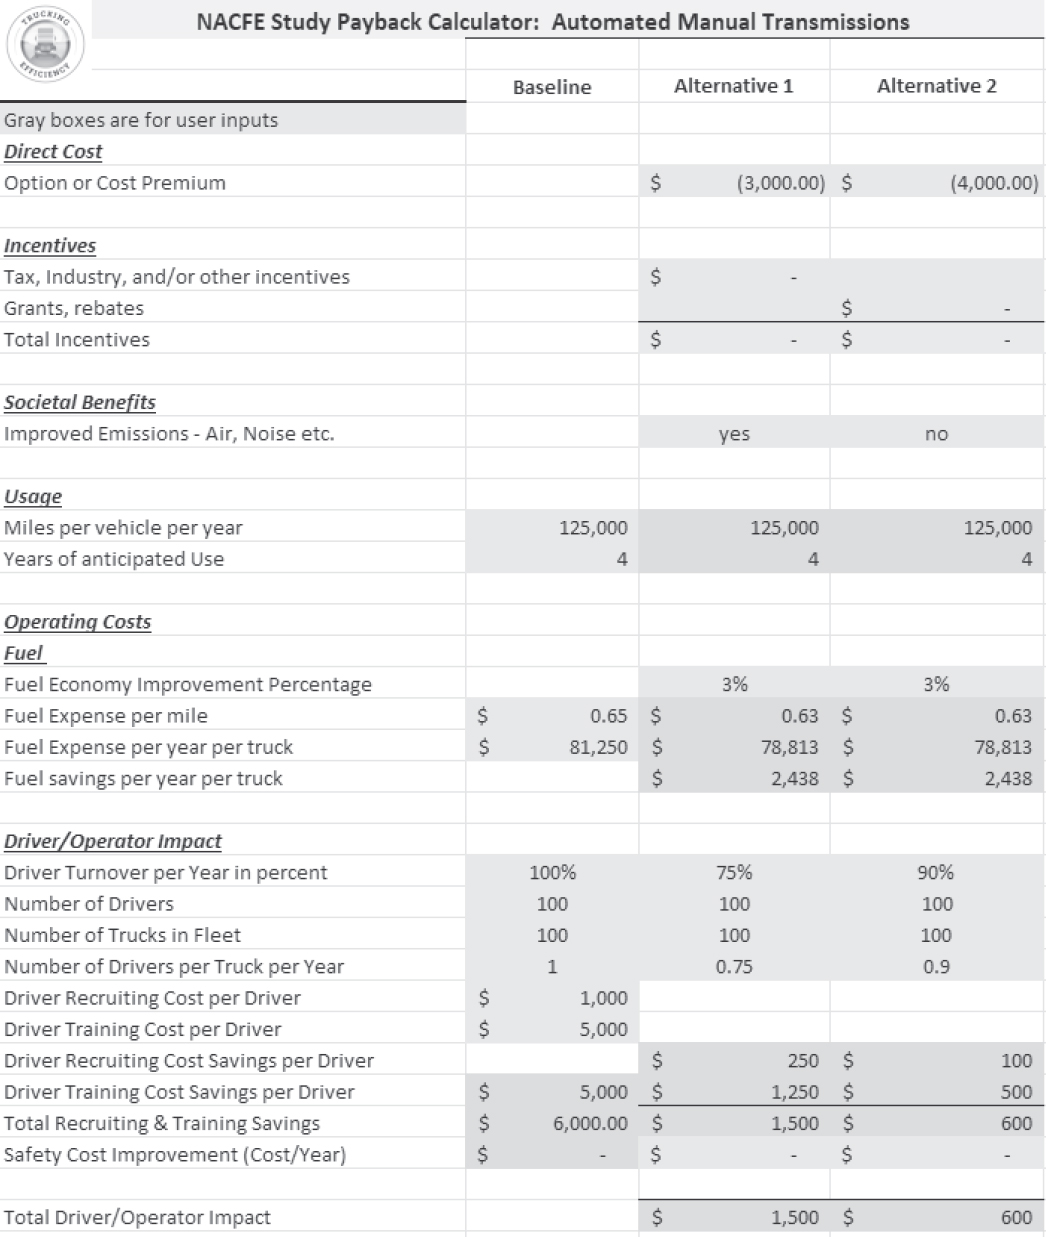
SOURCE: NACFE (2014).
these. As mentioned elsewhere, NHTSA should immediately be collecting information on the details of vehicle production.
4.11 AXLES AND DRIVELINES
For fuel consumption purposes, axle developments related to gearing, lubrication, weight, and axle ratio are the most important. Several of these are similar to the developments for transmissions. As the engines have become more fuel efficient at lower speeds and able to handle the torque, this has necessitated faster (lower numerical) axle ratios to maintain the speed of the vehicle. Axle ratios of 2.26 are readily available. A 2.16 ratio has been announced for availability in 2017 by Freightliner. Research programs are using axle ratios lower than 2.00 (Sturgess, 2016).
The slower engine speed at cruise, combined with the faster axle ratio, requires the driveline to handle more torque, especially at startup. Dana has published a white paper providing information on the issue. Meritor has also published a study.35 For any given startability, as the axle ratio becomes faster, the driveline torque increases. Torque transients, especially during aggressive starting, create significantly more stress in the driveline. Component fractures can occur; thus, axle and driveline manufacturers have been strengthening the components to eliminate over-stress fractures.
Since there is significant fuel savings from down-speeding the engine, there will continue to be development in the axles and drivelines to match the speed and torque characteristics needed.
___________________
35 See https://www.meritor.com/ourcompany/news/whitepapers/pdfs/Meritor-WhitePaper-EngineDownspeeding.pdf.
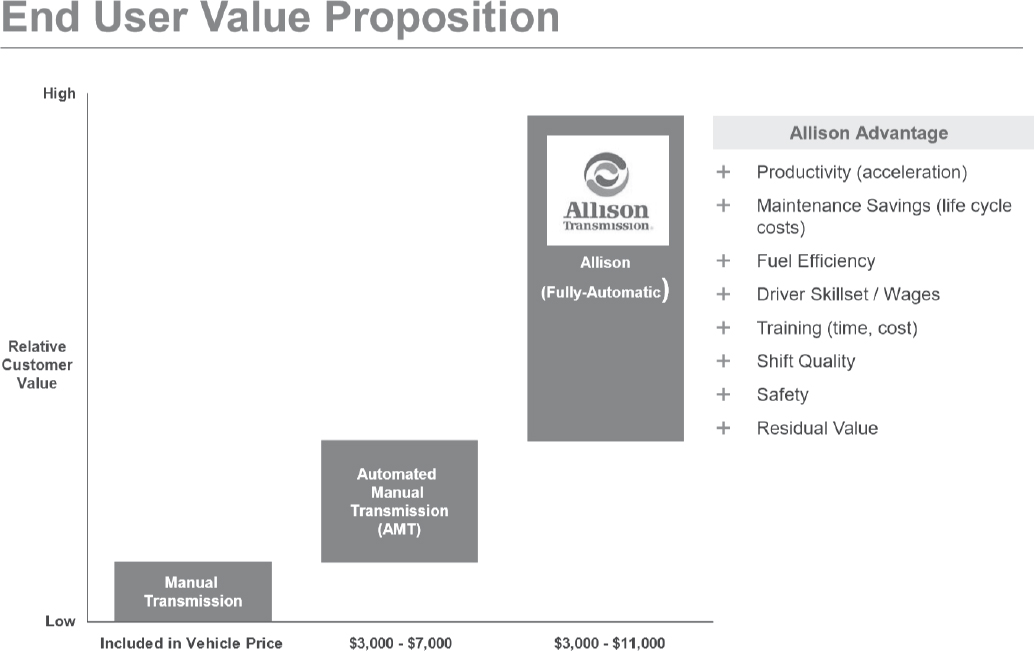
SOURCE: Allison Transmission Inc. (2016).
As with the transmission, lubrication of the axle gearing is an important factor in achieving long life and high efficiency. Various types of axle lubrication have been field tested. These include systems by Meritor, Dana, and Freightliner. These systems often reduce the lubrication splash during cruise control by reducing the lubricant in the reservoir. Electronic controls and sensors are required to effect this reduction. Such systems are available at additional cost and are reported to provide improvements of less than 1 percent in fuel economy.
The 6×2 axle configurations are another development with axles. The Confidence Report on 6×2 axles from NACFE (2014) is a good summary of the potential for 2 percent improvement in fuel consumption.
Motorized axles have been researched in the past and are available on some buses. Mercedes-Benz’ recent announcement of an urban electric truck uses such a motorized axle from ZF. A number of developments and early product offerings exist for trailer axles with motors.
Driveline developments are focused on reducing weight, including hollow-tube drivelines and carbon fiber materials. These developments appear to still be in the early concept and research phases. Such developments will provide small improvements in overall vehicle fuel consumption.
4.12 CLUTCHES
Another side effect of the reduced engine speeds is vibration in the driveline that is translated to the driver. Development to reduce this vibration is in process. Valeo announced the development of a clutch combining high torque, low stiffness, and a pendulum approach with floating masses. The goal is a further reduction of up to 200 RPM in engine speed.
4.13 REFERENCES
Abani, N., M. Chiang, I. Thomas, N. Nagar, and R. Zermeno. 2016. Developing a 55+ BTE Commercial Heavy-Duty Opposed-Piston Engine without a Waste Heat Recovery System. San Diego, CA: Achates Power, Inc.
ACEA. 2013. Worldwide Fuel Charter. Fifth Edition. Available at http://www.acea.be/uploads/publications/Worldwide_Fuel_Charter_5ed_2013.pdf (accessed December 18, 2019).
ACT (Americas Commercial Transportation Research Company, LLC). 2015. ACT Research, Natural Gas Quarterly: U.S. Class 8 NG Trends, Forecast, Analysis & Insight Q3 2015. Available at http://www.actresearch.net/wp-content/uploads/Q3-15-NGQ.pdf (accessed September 15, 2016.
Aikawa, K., and J.J. Jetter. 2013. Impact of gasoline composition on particulate matter emissions from a direct-injection gasoline engine: Applicability of the particulate matter index. International Journal of Engine Research 15(3):298-306.
Aikawa, K., T. Sakurai, and J. Jetter. 2010. Development of a predictive model for gasoline vehicle particulate matter emissions. SAE International Journal of Fuels and Lubricants 3(2):610-622.
Alleman, T. 2013. US Biofuels Quality Update. NIST Biocorrosion Workshop, Boulder, CO, July 22.
Allison Transmission, Inc. 2016. Q2 2016- Investor Relations Presentation of Allison Transmission, August 2.
Alvarez, R.A., S.W. Pacala, J.J. Winebrake, C.W. Chameides, and S.P. Hamburg. 2012. Greater focus needed on methane leakage from natural gas infrastructure. Proceedings of the National Academy of Sciences of the United States of America 109(17):6435-6440.
Arimilli, R.V., K. Erickson, F.T. Mottley, and J.C. Conklin. 2003. Performance evaluation of a prototype TurbX™ engine. In Proceedings of the ASME Turbo Expo: Power for Land, Sea, and Air, Vol. 3. International Gas Turbine Institute, pp. 295-304.
Atkinson, C., S. Petreanu, N.N. Clark, R.J. Atkinson, T.I. McDaniel, S. Nandkumar, and P. Famouri. 1999. Numerical Simulation of a Two-Stroke Linear Engine-Alternator Combination. SAE Technical Paper 1999-01-0921, doi: 10.4271/1999-01-0921.
Bhatnagar, V., and P. Owende. 2015. Energy harvesting for assistive and mobile applications. Energy Science & Engineering 3(3):153-173.
Blain, L. 2015. Honda files patents for brand new, fuel injected two-stroke engine. New Atlas. http://www.gizmag.com/honda-two-stroke-with-fuel-injection-patent-filing/38529/ (accessed April 13, 2016).
Burnham, A., H. Cai, and M. Wang. 2016. Critical Factors in the Development of Well-to-Wheel Analyses of Alternative Fuel and Advanced Powertrain Heavy-Duty Vehicles. SAE Technical Paper 2016-01-1284, doi: 10.4271/2016-01-1284.
Butler, A., R. Sobotowski, G. Hoffman, and P. Machiele. 2015. Influence of Fuel PM Index and Ethanol Content on Particulate Emissions from Light-Duty Gasoline Vehicles. SAE Technical Paper 2015-01-1072, doi: 10.4271/2015-01-1072.
Chadwell, C., T. Alger, J. Zuehl, and R. Gukelberger. 2014. A demonstration of dedicated EGR on a 2.0 L GDI engine. SAE International Journal of Engines 7(1):434-447.
Chang, J., G. Kalghatgi, A. Amer, and Y. Viollet. 2012. Enabling High Efficiency Direct Injection Engine with Naphtha Fuel through Partially Premixed Charge Compression Ignition Combustion. SAE Technical Paper 2012-01-0677, doi: 10.4271/2012-01-0677.
Clark, N.N., D.R. Johnson, D.L. McKain, W.S. Wayne, H. Li, J. Rudek, R.A. Mongold, C. Sandoval, A.N. Covington, and J.T. Hailer. 2017a. Future methane emissions from the heavy-duty natural gas transportation sector for stasis, high, medium, and low scenarios in 2035. Journal of the Air & Waste Management Association 67(12):1328-1341.
Clark, N.N., D.L. McKain, D.R. Johnson, W.S. Wayne, H. Li, V. Akkerman, C. Sandoval, A.N. Covington, R.A. Mongold, J.T. Hailer, and O.J. Ugarte. 2017b. Pump-to-wheels methane emissions from the heavy-duty transportation sector. Environmental Science & Technology 51(2):968-976.
Clarke, J., and E. O’Malley. 2013. Analytical Comparison of a Turbocharged Conventional Diesel and a Naturally Aspirated Compact Compression Ignition Engine both Sized for a Highway Truck. SAE Technical Paper 2013-01-1736, doi: 10.4271/2013-01-1736.
Cobb, J. 2014. Wrightspeed Combines Gas Turbine and Batteries for Big Fuel Savings. Hybrid Cars, February 18. http://www.hybridcars.com/wrightspeed-combines-gas-turbine-and-batteries-for-big-fuel-savings/ (accessed April 13, 2016).
Confer, K., and Delphi Advanced Powertrain. 2015. Ultra Efficient Light Duty Powertrain with Gasoline Low Temperature Combustion. Presentation at the 2015 DOE Vehicle Technologies Review, June 11.
Conklin, J.C., and J.P. Szybist. 2010. A highly efficient six-stroke internal combustion engine cycle with water injection for in-cylinder exhaust heat recovery. Energy 35(4):1658-1664.
CRC (Coordinating Research Council, Inc.). 2014. Biodiesel and Renewable Diesel Characterization and Testing in Modern LD Diesel Passenger Cars and Trucks, CRC Report No. AVFL-17b.
Cummins Filtration. 2009. Diesel Exhaust Fluid (DEF) Q&A. Available at https://www.cumminsfiltration.com/sites/default/files/MB10033.pdf (accessed December 18, 2019).
Cummins Westport. 2016. Introducing ISL G Near Zero. Available at https://mart.cummins.com/imagelibrary/data/assetfiles/0042998.pdf (accessed December 18, 2019).
Curran, S., Z. Gao, J. Szybist, and R.Wagner. 2014. Fuel Effects on RCCI Combustion: Performance and Drive Cycle Considerations. Presentation at the 2014 CRC Workshop on Advanced Fuels and Engine Efficiency, February 26. Baltimore, MD. Oak Ridge, TN: Oak Ridge National Laboratory.
Curran, S., Z. Gao, and R. Wagner. 2015. Reactivity-controlled compression ignition drive cycle emissions and fuel economy estimations using vehicle system simulations. International Journal of Engine Research 16(8):1014-1024.
Daw, C.S., et al. 2010. Report on the Transportation Combustion Engine Efficiency Colloquium Held at USCAR, March 3-4. Oak Ridge National Laboratory Report No. ORNL/TM-2010/265, October.
Delgado, O., and R. Muncrief. 2015. Assessment of Heavy-Duty Natural Gas Vehicle Emissions: Implications and Policy Recommendations. Washington, DC: ICCT. July.
DeLizo, S. 2015. Kenworth Class 8 AFV NG Micro-Turbine Hybrid Electric Vehicle, CEC-ARV-009-012, April.
Dempsey, A., S. Curran, and R. Wagner. 2016. A perspective on the range of gasoline compression ignition combustion strategies for high engine efficiency and low NOx and soot emissions: Effects of in-cylinder fuel stratification. International Journal of Engine Research 17(8):897-917.
DOE (Department of Energy). 2012. Overview of the DOE Advanced Combustion Engine R&D. Presentation at the 2012 Annual Merit Review and Peer Evaluation Meeting in Washington, DC, May 14-18.
DOE. 2013. The Roadmap and Technical White Papers of the 21st Century Truck Partnership. February 27.
Durbin, T., G. Karavalakis, K. Johnson, M. Hajbabaei, and W. Miller. 2012. Effect of Natural Gas Fuel Composition on Vehicle Emissions and Performance. Presentation to the Program to Evaluate the Implications of Gas Variability in California, February 15. University of California, Riverside Bourns College of Engineering.
Eckerle, W. (Cummins Inc.). 2013. Roadmap to Energy Conversion Efficiency at Cummins. Presentation to the 2013 ERC Symposium in University of Wisconsin, June 5.
Eckerle, W. (Cummins Inc.). 2015. Engine Technologies for GHG and Low NOx: ARB Symposium on Phase 2 GHG. Presentation to the CA Phase 2 GHG April 2015 Symposium in Diamond Bar, CA.
Edwards, K.D., R. Wagner, T.E. Briggs, and T. Theiss. 2011. Defining Engine Efficiency Limits. Presentation at the 17th DEER Conference in Detroit, MI, October 5. Oak Ridge, TN: Oak Ridge National Laboratory.
EIA. 2014. Annual Energy Outlook 2014 with Projections. Washington, DC: Environmental Protection Agency.
EIA. 2016. Annual Energy Outlook 2016 with Projections. Washington, DC: Environmental Protection Agency.
Elson, A., et al. 2015. ICF International Waste Heat to Power Market Assessment. ORNL/TM-2014/620, March.
EPA (Environmental Protection Agency). 2002. A Comprehensive Analysis of Biodiesel Impacts on Exhaust Emissions: Draft Technical Report. EPA420-P-02-001.
EPA. 2009. EPA Lifecycle Analysis of Greenhouse Gas Emissions from Renewable Fuels. EPA-420-F-09-024.
EPA. 2010. EPA Lifecycle Analysis of Greenhouse Gas Emissions from Renewable Fuels. Office of Transportation and Air Quality, EPA-420-F-10-006.
EPA. 2015a. Proposed Rulemaking for Greenhouse Gas Emissions and Fuel Efficiency Standards for Medium- and Heavy-Duty Engines and Vehicles–Phase 2 Draft Regulatory Impact Analysis. EPA-420-D-15-900. Washington, DC: EPA.
EPA. 2015b. Oil and Natural Gas Sector: Emission Standards for New and Modified Sources. Federal Register 80:56593-56698.
EPA. 2015c. Light Duty Automotive Technology, Carbon Dioxide Emissions, and Fuel Economy Trends. EPA 420-R-15-016. Washington DC: EPA.
EPA and NHTSA (National Highway Traffic Safety Administration). 2015. Greenhouse gas emissions and fuel efficiency standards for medium- and heavy-duty engines and vehicles—Phase 2. Federal Register 80:40137-40765 (July 13).
EPA and NHTSA. 2016. Greenhouse gas emissions and fuel efficiency standards for medium- and heavy-duty engines and vehicles—Phase 2. Federal Register 81:73478-74274 (October 25).
ET Auto (Economic Times Auto). 2016. Continental to Present Connected Technologies for CVs. Available at http://auto.economictimes.indiatimes.com/news/auto-components/continental-to-present-connected-technologies-for-cvs/53886925 (accessed December 19, 2019).
Farrell, J. (National Renewable Energy Laboratory). 2015. Optima Program Overview. Presented at Optima Stakeholder Listening Day, June 15.
Fraas, L., J. Avery, E. Malfa, J.G. Wuenning, G. Kovacik, and C. Astle. 2003. Thermophotovoltaics for combined heat and power using low NOx gas fired radiant tube burners. AIP Conference Proceedings 653:61. doi: 10.1063/1.1539364.
Gao, F., M. Kollár, Y. Wang, N.M. Washton, J. Szanyi, and C. Peden. Institute for Integrated Catalysis, Pacific Northwest National Laboratory. 2015. Effects of Alkali and Alkaline Earth Cocations on the Activity and Hydrothermal Stability of Cu/SSZ-13 NH3-SCR Catalysts. Presentation at the 2015 DOE CLEERS Workshop. University of Michigan, Dearborn, MI. April 29.
General Motors. 2012. Split Cycle Internal Combustion Engine. U.S Patent 8,267,056 B2. September 18.
Government Fleet News. 2014. Half of Ford’s Class 3-5 Chassis Cab Buyers Choose Gasoline. Available at http://www.government-fleet.com/news/story/2014 (accessed February 18, 2017).
Greszler, A. (Volvo Group Truck Technology). 2012. View from the Bridge—Commercial Vehicle Perspective. Presentation at the DEER Conference, Department of Energy.
Greszler, A. (Volvo Group Truck Technology). 2014. Impact of NOx Control on Heavy Duty Diesel Vehicle Efficiency. Presentation to the National Academies of Sciences Committee on the Assessment of Technologies and Approaches for Reducing the Fuel Consumption of Medium- and Heavy-Duty Vehicles, Phase Two, Ypsilanti, MI, July 28.
Hanson, R., S. Spannbauer, C. Gross, R. Reitz, S. Curran, J. Storey, and S. Huff. 2015. Highway Fuel Economy Testing of an RCCI Series Hybrid Vehicle. SAE Technical Paper 2015-01-0837. doi: 10.4271/2015-01-0837.
Hunter, S., et al. 2011. Development of MEMS based pyroelectric thermal energy harvesters. In Energy Harvesting and Storage: Materials, Devices, and Applications II, edited by N.K. Dhar, P.S. Wijewarnasuriya, and A.K. Dutta. Proceedings of SPIE 8035. doi: 10.1117/12.882125.
Huo, H., M. Wang, C. Bloyd, and V. Putsche. 2009. Life-cycle assessment of energy use and greenhouse gas emissions of soybean-derived biodiesel and renewable fuels. Environmental Science & Technology 43:750-756.
Huo, M., Y. Huang, and P. Hofbauer. 2015. Piston Design Impact on the Scavenging and Combustion in an Opposed-Piston, Opposed-Cylinder (OPOC) Two-Stroke Engine. SAE Technical Paper 2015-01-1269. doi:10.4271/2015-01-1269.
ICCT (International Council on Clean Transportation). 2016. Costs of Emission Reduction Technologies for Heavy-Duty Diesel Vehicles. Washington, DC: ICCT. February. Available at https://www.theicct.org/sites/default/files/publications/ICCT_costs-emission-reduction-tech-HDV_20160229.pdf (accessed December 19, 2019).
Ikeya, K., M. Takazawa, T. Yamada, S. Park, et al. 2015. Thermal efficiency enhancement of a gasoline engine. SAE International Journal of Engines 8(4):1579-1586. doi: 10.4271/2015-01-1263.
Infineum. 2014. Worldwide Winter Diesel Fuel Quality Survey 2014. Available at https://www.infineum.com/media/80722/wdfs-2014-full-screen.pdf (accessed December 19, 2019).
Johansson, B. 2015. High efficiency combustion engines, what is the limit?, Society of Automotive Engineers High Efficiency Engine Symposium, Detroit, MI.
Johnson, T. 2016.Vehicular emissions in review. SAEInternationalJournalofEngines9(2):1258-1275. doi: 10.4271/2016-01-0919.
Johnson, T., and Corning Incorporated. 2014. Review of Heavy-Duty Truck Emissions and Efficiency Trends. Presentation to the National Academies of Sciences Committee on the Assessment of Technologies and Approaches for Reducing the Fuel Consumption of Medium- and Heavy-Duty Vehicles, Phase Two, Ypsilanti, MI, July 29.
Karagozian, M. 2013. A look back at Ford’s Big Red turbine powered concept truck. Examiner, February 9. http://www.examiner.com/article/a-look-back-at-ford-s-big-red-turbine-powered-concept-truck (accessed April 13, 2016).
Keolian, R. 2011. Final Report: DOE Project DE-FC26-04NT42113 CPR/IW Project 17057 Truck Thermoacoustic Generator and Chiller.
Kierstein, A. 2014. The humble two-stroke might be the engine of the future. Road and Truck, December 12. http://www.roadandtrack.com/new-cars/car-technology/news/a24496/renaults-unveils-tiny-2-stroke-2-cylinder-turbo-diesel/ (accessed April 13, 2016).
Kim, J., C. Sluder, and R. Wagner. 2012. Combustion studies with FACE diesel fuels: A literature review. SAE International Journal of Engines 5(4):1648-1660. doi: 10.4271/2012-01-1688.
Knothe, G. 2010. Biodiesel and renewable diesel: A comparison. Progress in Energy and Combustion Science 36(3):364-373.
Kocher, L. 2016. Cummins 55% BTE Project. Presentation at the SuperTruck Annual Merit Review, Arlington, VA, June 16.
Koeberlein, D., and Cummins Inc. 2013. Cummins SuperTruck Program Technology and System Level Demonstration of Highly Efficient and Clean, Diesel Powered Class 8 Trucks. Presentation at the 2013 Department of Energy Annual Merit Review, May 16.
Koeberlein, D., and Cummins Inc. 2014. Cummins SuperTruck Program: Technology and System Level Demonstration of Highly Efficient and Clean, Diesel Powered Class 8 Trucks. Presentation at the 2014 DOE Hydrogen and Fuel Cells Program and Vehicle Technologies Office Annual Merit Review and Peer Evaluation Meeting, Washington, DC, June 20.
Kothari, T. U., D. Kumar, and K.D. Tandel. 2014. Design and analysis of six-stroke internal combustion engine. International Journal of Engineering Development and Research 2(2):2409-2416.
Kumar, S., S.D. Heister, X. Xu, J.R. Salvador, and G.P. Meisner. 2013. Thermoelectric generators for automotive waste heat recovery systems part I: Numerical modeling and baseline model analysis. Journal of Electronic Materials 42(4):665-674.
Lammert, M., R. McCormick, P. Sindler, and A. Williams. 2012. Effect of B20 and low aromatic diesel on transit bus NOx emissions over driving cycles with a range of kinetic intensity. SAE International Journal of Fuels and Lubricants 5(3):1345-1359. doi: 10.4271/2012-01-1984.
Leone, T. (Ford Motor Company). 2015. The Importance of Fuel Octane. Presentation at the 2015 Fuels Institute Annual Meeting, Indianapolis, IN, September 23.
Leone, T., J. Anderson, R. Davis, A. Iqbal, R.A. Reesell, M.H. Shelby, and W.H. Studzinski. 2015. The effect of compression ratio, fuel octane rating, and ethanol content on spark-ignition engine efficiency. Environmental Science & Technology 49(18):10778-10789.
Liang, X., X. Wang, G. Shu, H. Wei, H. Tian, and X. Wang. 2015. A review and selection of engine waste heat recovery technologies using analytic hierarchy process and grey relational analysis. International Journal of Energy Research 39:453-471. doi: 10.1002/er.3242.
Lopes, S., P. Geng, and A. Konzack. 2014. Review of 2013 U.S. Retail Biodiesel Blends Quality Survey. SAE Technical Paper 2014-01-1379. doi: 10.4271/2014-01-1379.
Martec Group. 2016. Diesel Engine Technology and the Midterm Evaluation: An Analysis of Compliance Costs and Benefits. Available at http://www.martecgroup.com/wp-content/uploads/2016/05/The-Martec-Group-White-Paper-Diesel-Engine-Technology-and-the-Midterm-Evaluation-Summer-2016.pdf (accessed December 19, 2019).
McCormick, R.L., et al. 2006. Effects of Biodiesel Blends on Vehicle Emissions Fiscal Year 2006 Annual Operating Plan Milestone 10.4. Milestone Report NREL/MP-540-40554, October.
MECA (Manufacturers of Emission Controls Association). 2015. Statement of the Manufacturers of Emission Controls Association on the U.S. Environmental Protection Agency’s Proposed Rulemaking on Greenhouse Gas Emissions Standards and Fuel Efficiency Standards for Medium- and Heavy-Duty Engines and Vehicles—Phase 2. Docket ID No. EPA-HQ-OAR-2014-0827.
Moriarty, K., M. Kass, T. Theiss. 2014. Increasing Biofuel Deployment and Utilization through Development of Renewable Super Premium: Infrastructure Assessment. NREL/TP-5400-61684. doi: 10.2172/1164886.
NACFE (North American Council for Freight Efficiency). 2014. Confidence Report: Electronically Controlled Transmissions. Available at http://nacfe.org/wp-content/uploads/2014/12/Trucking_Efficiency_Transmissions_Confidence_Report.pdf (accessed December 19, 2019).
Nadaf, S.L., and P.B. Gangavati. 2014. A review on waste heat recovery and utilization from diesel engines. International Journal of Advanced Engineering Technology 5(4):31-39.
Naik, S., F. Redon, G. Regner, and J. Koszewnik. 2015. Opposed-Piston 2-Stroke Multi-Cylinder Engine Dynamometer Demonstration. SAE Technical Paper 2015-26-0038. doi: 10.4271/2015-26-0038.
National Renewable Energy Laboratory (NREL). 2013. Clean Cities Guide to Alternative Fuel and Advanced Medium- and Heavy-Duty Vehicles. http://www.afdc.energy.gov/uploads/publication/medium_heavy_duty_guide.pdf.
NGVAmerica. 2014. 2014 NGV Production and Sales Report. Available at https://www.ngvamerica.org/pdfs/2014%20NGV%20Production%20and%20Sales%20Report.pdf (accessed December 19, 2019).
NRC (National Research Council). 2008. Review of the 21st Century Truck Partnership. Washington, DC: The National Academies Press.
NRC. 2010. Technologies and Approaches to Reducing the Fuel Consumption of Medium- and Heavy-Duty Vehicles. Washington, DC: The National Academy Press.
NRC. 2012. Review of the 21st Century Truck Partnership, Second Report. Washington, DC: The National Academies Press.
NRC. 2014. Reducing the Fuel Consumption and Greenhouse Gas Emissions of Medium- and Heavy-Duty Vehicles, Phase Two: First Report. Washington, DC: The National Academies Press.
NRC. 2015a. Cost, Effectiveness, and Deployment of Fuel Economy Technologies for Light-Duty Vehicles. Washington, DC: The National Academies Press.
NRC. 2015b. Review of the 21st Century Truck Partnership, Third Report. Washington, DC: The National Academies Press.
Olsson, A., B. Jönsson, and L. Sundin. 2005. The Volvo Heavy Truck Gas Turbine VT300. SAE Technical Paper 2005-01-3504. doi: 10.4271/2015-01-3054.
ORNL (Oak Ridge National Laboratory). 2016. 2015 Vehicle Technologies Market Report. Available at http://cta.ornl.gov/vtmarketreport/pdf/2015_vtmarketreport_full_doc.pdf.
ORNL (Oak Ridge National Laboratory). 2017. 2016 Vehicle Technologies Market Report. Available at https://tedb.ornl.gov/wp-content/uploads/2019/04/2016_Vehicle_Technologies_Market_Report.pdf.
Orr, B., A. Akbarzadeh, M. Mochizuki, and R. Singh. 2016. A review of car waste heat recovery systems utilising thermoelectric generators and heat pipes. Applied Thermal Engineering 101:490-495. doi: 10.1016/j.applthermaleng.2015.10.081.
Patel, P.S., and E.F. Doyle. 1976. Compounding the Truck Diesel Engine with an Organic Rankine-Cycle System. SAE Technical Paper 760343. doi: 10.4271/760343.
Perfetto, A., and S. Geckler. 2014. Ultra-Low Carbon Powertrain. Final Report for California Energy Commission, ARV-10-044, August.
Pihl, J., S. Daw, and Oak Ridge National Laboratory. 2015. Measuring the Impacts of Catalyst State on NH3 Adsorption in Copper Zeolite SCR Catalysts. Presentation at the 2015 DOE CLEERS Workshop, University of Michigan, Dearborn, MI, April 27.
Pirault, J.-P., and M. Flint. 2009. Opposed Piston Engines: Evolution, Use, and Future Applications. Warrendale, PA: SAE International.
Posada, F., C. Bedick, N.N. Clark, A. Koslov, M. Linck, D. Boulanov, and J. Pratapas. 2007. Low Temperature Combustion with Thermal Recuperation. Presented at SAE Commercial Vehicle Engineering Conference, Rosemont, IL, October-November. SAE Paper 2007-01-4074.
Pradhan, A., D.S. Shrestha, J. Van Gerpen, A. McAloon, W. Yee, M. Haas, and J.A. Duffield. 2012. Reassessment of life cycle greenhouse gas emissions for soybean biodiesel. Transactions of the American Society of Agricultural and Biological Engineers 55(6):2257-2264.
Prevost/Volvo. 2010. The Volvo D13: Powertrain Product Tour. Available at https://www.prevostcar.com/sites/default/files/attachments/27volvod13engine_1_en.pdf (accessed September 30, 2019).
Propel Fuels. 2015. Propel Launches North America’s First Retail Rollout of High Performance Renewable Diesel Fuels. March 18. Available at https://propelfuels.com/news_and_media/press_releases/propel_launches_diesel_hpr (accessed December 19, 2019).
PSI (Power Solutions International). 2016. Navistar & Power Solutions International Launch Gasoline-Fueled IC Bus at STN EXPO. July 26. Available at http://investors.psiengines.com/releasedetail.cfm?ReleaseID=981194 (accessed February 18, 2017).
Rappé, K., M. Stewart, C. DiMaggio, J. Theis, W.L. Se-Oh, J. Parks, J. Pihl, G. Fisher, and K. Howden (USDRIVE Low Temperature Aftertreatment Team). 2016. USDRIVE and Advanced Engine Crosscut Teams: Roadmaps and Protocols. Presentation at the 2016 DOE CLEERS Workshop, Ann Arbor, MI, April 6.
Redon, F. 2011. The Opposed-Piston Two-Stroke Engine Alternative: Performance and Emissions Results in a Medium-Duty Application. Directions in Engine-Efficiency and Emissions Research Conference, Detroit, MI, October 3-6.
Reinhart, T. 2015. Commercial Medium- and Heavy-Duty Truck Fuel Efficiency Technology Study—Report #1. Report No. DOT HS 812 146. Washington, DC: National Highway Traffic Safety Administration, June.
Reinhart, T., and M. Megel. 2016. An efficient, durable vocational truck gasoline engine. SAE International Journal of Engines 9(3):1437-1448. doi: 10.4271/2016-01-0660.
Reitz, R.C., and G. Duraisamy. 2015. Review of high efficiency and clean reactivity controlled compression ignition (RCCI) combustion in internal combustion engines. Progress in Energy and Combustion Science 46:12-71.
Renewable Fuels Association. 2016. Press Release. https://ethanolrfa.org/2016/08/rfa-applauds-wayne-fueling-systems-move-to-e25-in-standard-dispensers/ (accessed December 19, 2019).
Ricardo. 2013. Game Changing Ricardo Concept for High Efficiency Heavy Duty Diesel Moves Forward. Press Release, September 4. http://www.ricardo.com/en-GB/News--Media/Press-releases/News-releases1/2013/Game-changing-Ricardo-concept-for-high-efficiency-heavy-duty-diesel-moves-forward/ (accessed April 13, 2016).
Robbins, C., et al. 2011. Effects of Biodiesel Fuels Upon Criteria Emissions. Society of Automotive Engineers Paper No. 2011-01-1943.
Robinson, M.C. 2015. Analysis and Optimization of a Dual Free Piston, Spring Assisted, Linear Engine Generator. West Virginia University, ProQuest Dissertation Publishing.
Sax, T., S. Yoon, C. Misra, J. Collins, J. Herner, D. Hawelti, S. Lemieux, et al. California Environmental Protection Agency Air Resources Board. 2014. An Integrated Approach to Heavy-Duty GHG and NOx Control. Presentation to the National Academies of Sciences Committee on the Assessment of Technologies and Approaches for Reducing the Fuel Consumption of Medium- and Heavy-Duty Vehicles, Phase Two, Ypsilanti, MI, July 29.
Sellnau, M., M. Foster, K. Hoyer, W. Moore, J. Sinnamon, and H. Husted. 2014. Development of a gasoline direct injection compression ignition (GDCI) engine. SAE International Journal of Engines 7(2):835-851. doi: 10.4271/2014-01-1300.
Sellnau, M., W. Moore, J. Sinnamon, K. Hoyer, M. Foster, and H. Husted. 2015. GDCI multi-cylinder engine for high fuel efficiency and low emissions. SAE International Journal of Engines 8(2):775-790. doi: 10.4271/2015-01-0834.
Senefsky, B. 2003. Chevrolet Turbo-Titan III Concept Vehicle - Space Truckin’. Truck Trend Network, September 1. http://www.trucktrend.com/cool-trucks/0309st-chevrolet-turbo-titan-3-concept-vehicle/ (accessed April 13, 2016).
Sharma, A., and F. Redon. 2016. Multi-Cylinder Opposed-Piston Engine Results on Transient Test Cycle. SAE Technical Paper 2016-01-1019. doi: 10.4271/2016-01-1019.
Sharp, C. (Southwest Research Institute). 2016. CARB Low NOx Demonstration Program—Update. Presentation at the SAE 2016 Heavy-Duty Diesel Emissions Control Symposium (HDDEC), Gothenburg, Sweden, September 21.
Shenk, M. 2014. U.S. oil output surges to highest since 1986 on shale. Bloomberg, September 17. https://www.bloomberg.com/news/articles/2014-09-17/u-s-oil-output-surges-to-highest-since-1986-on-shale (accessed December 19, 2019).
Singh, S. 2011. “Exhaust Heat Driven Rankine Cycle for a Heavy Duty Diesel Engine” presentation at 2011 DEER Conference. October 5. Detroit, MI, USA. https://www.energy.gov/sites/prod/files/2014/03/f8/deer11_singh.pdf.
Singh, S. (Detroit Diesel Corporation). 2015. SuperTruck Program: Engine Project Review, Class 8 Truck Freight Efficiency Improvement Project, Project ACE 058. Presentation at the DOE Annual Merit Review, June 20.
Sluder, S., J. Szybist, B. Kaul. 2015. Preliminary Investigation of Heat of Vaporization Effects in High-Octane Fuel Experiments at ORNL. Presentation to USDRIVE Combustion and Emission Control Tech Team, July.
Splitter, D., A. Pawlowski, and R. Wagner. 2016. A historical analysis of the co-evolution of gasoline octane number and spark-ignition engines. Frontiers in Mechanical Engineering. January 6. doi: 10.3389/fmech.2015.00016.
Stanton, D. (Cummins Inc.). 2014. Natural Gas Engine Technologies to Meet Future U.S. GHG Regulations for Commercial Vehicles. Presented to the 5th International CTI Conference, September.
Stein, R., D. Polovina, K. Roth, M. Foster, et al. 2012. Effect of heat of vaporization, chemical octane, and sensitivity on knock limit for ethanol-gasoline blends. SAE International Journal of Fuels and Lubricants 5(2):823-843. doi: 10.4271/2012-01-1277.
Sturgess, S. 2016. Engine downspeeding dictates drive-axle design. Transport Topics, October 24. http://www.ttnews.com/articles/petemplate.aspx?storyid=43628 (accessed December 19, 2019).
Subramanian, S. (Eaton). 2014. Heavy Duty Roots Expander Heat Energy Recovery. Presentation at the 2014 DOE Annual Merit Review, June.
Szybist, J.P., R. Steeper, D. Splitter, V.B. Kalaskar, J. Pihl, and C. Daw. 2014. “Negative Valve Overlap Reforming Chemistry in Low-Oxygen Environments.” SAE International Journal of Engines 7(1): 418-33. www.jstor.org/stable/26277775 (accessed December 19, 2019).
Tartakovsky Leonid et al. (2014): Table 4.1, p 90: Tartakovsky, L., V. Baibikov, M. Gutman, A. Poran, M. Veinblat. 2014. “Thermo-Chemical Recuperation as an Efficient Way of Engine’s Waste Heat Recovery.” Applied Mechanics and Materials 659:256–261. https://doi.org/10.4028/www.scientific.net/amm.659.256 (accessed December 19, 2019).
Theiss, T., T. Alleman, A. Brooker, A. Elgowainy, G. Fioroni, J. Han, S. Huff, et al. 2016. Summary of High-Octane MidLevel Ethanol Blends Study. ORNL/TM-2016/42. Available at http://info.ornl.gov/sites/publications/files/Pub61169.pdf (accessed December 19, 2019).
Tong, F., P. Jaramillo, and I. Azevedo. 2015. Comparison of Life Cycle Greenhouse Gas from Natural Gas Pathways for Medium and Heavy-Duty Vehicles (Supporting Information). Pittsburgh, PA: Carnegie Mellon University. May.
Venkatesh, A., P. Jamarillo, W.M. Griffin, and H.S. Matthews. 2012. Uncertainty in life cycle greenhouse gas emissions from United States natural gas end-uses and its effects on policy. Environmental Science & Technology 45(19):8182-8189. doi: 10.1021/es200930h.
Wagner, R. 2015. “Future Engines: Incremental Advances Driving Disruptive Opportunities” presented at 2015 SAE International High Efficiency Internal Combustion Engines Symposium. April. Detroit, MI.
Warey, A., J. Hardy, M. Hennequin, M. Tatur, et al. 2010. Fuel Effects on Low Temperature Combustion in a Light-Duty Diesel Engine. SAE Technical Paper 2010-01-1122. doi: 10.4271/2010-01-1122.
Wekin, A. 2008. Characterization and Comparison of Piezoelectric Materials for Transducing Power from a Thermoacoustic Engine. Master’s thesis, Washington State University.
Westport. 2015a. Westport Completes HPDI Gen 2.0 Technology Program with Daimler AG, Westport Innovations, Inc., Vancouver, BC, July.
Westport. 2015b. HPDI 2.0 - New Diesel-Gas System by Westport. http://gazeo.com/automotive/technology/HPDI-2.0-new-diesel-gas-system-by-Westport,article,7689.html (accessed September 19, 2015).
Westport. 2015c. Westport HPDI 2.0 on Track for Commercial Production, November. http://www.westport.com/news/2015/westport-hpdi-2.0-on-track-for-commercial-production?utm_source=Westport+Communications&utm_campaign=c1a37b053dWestport+WatCH4+News&utm_medium=email&utm_term=0_f905da2430-c1a37b053d-84079581 (accessed November 5, 2015).
Wissink, M., and R. Reitz. 2015. Direct dual fuel stratification, a path to combine the benefits of RCCI and PPC. SAE International Journal of Engines 8(2):878-889. doi: 10.4271/2015-01-0856.
Yu, Z., A.J. Jaworski, and S. Backhaus. 2012. Travelling-wave thermoacoustic electricity generator using an ultra-compliant alternator for utilization of low-grade thermal energy. Applied Energy 99:135-145. doi: 10.1016/j.apenergy.2012.04.046.
Zigler, B., W. Pitz, N. Killingsworth, D. Flowers, S. Aceves, M. Ratcliff, R. Wagner, et al. (National Renewable Energy Laboratory). 2012. Fuels for Advanced Combustion Engines, Project FT002. Presentation at the DOE Annual Merit Review, May 15.
Zukouski, R. 2014. “SuperTruck–Development and Demonstration of a Fuel-Efficient Class 8 Tractor and Trailer,” presented to NRC Committee on Review of the 21st Century Truck Partnership, Phase 3, Washington, D.C., November 18.


