
4
Terrestrial Water Cycle
Observing and understanding the water cycle and changes in the water cycle are essential to protect this life-enabling resource both now and in the future. In the past decades, high-precision geodesy has become an important source of information for hydrologists, climate scientists, and water managers. This chapter examines the components of the geodetic infrastructure that are required to meet scientific needs related to the water cycle, as laid out in the Decadal Survey (NASEM, 2018). The Decadal Survey science questions used to focus this discussion are:
H-2. How do anthropogenic changes in climate, land use, water use, and water storage interact and modify the water and energy cycles locally, regionally, and globally and what are the short- and long-term consequences?
H-4. How does the water cycle interact with other Earth System processes to change the predictability and impacts of hazardous events and hazard chains (e.g., floods, wildfires, landslides, coastal loss, subsidence, droughts, human health, and ecosystem health), and how do we improve preparedness and mitigation of water-related extreme events?
S-6. How much water is traveling deep underground and how does it affect geological processes and water supplies?
The geodetic infrastructure needs associated with these questions appear in the Water Cycle Science and Applications Traceability Matrix (see Appendix A, Table A.2). Some water cycle components such as soil moisture and snow depth/water equivalent are discussed in Chapter 7 (Ecosystems).
SCIENCE OVERVIEW
The water cycle interacts with all near-surface Earth system processes. Surface topography and surface and subsurface structure largely control the location and movement of water. Surface topography is dynamic—resulting from surface loading and unloading, land subsidence, erosion and deposition, sea-level rise, tectonics, and volcanoes—and thus requires repeated geodetic measurements to quantify that change in three dimensions. The location, quantity, and flow direction of surface water is often determined using knowledge of channel and floodplain morphology or lake bathymetry and gradients, all of which rely on geodetic observations in three dimensions.
Subsurface aquifer-system structure and groundwater levels are generally mapped relative to the land surface, and so require an accurate understanding of land-surface elevations and changes in elevations through time. To understand flood risk, accurate geodetic data describing the land surface is critical for forecasting flood location, frequency, depth, and duration. Land subsidence induced by dropping groundwater levels permanently reduces the storage capacity of aquifer systems, damages near-surface or surface infrastructure, shifts migration of river courses and wetlands, and alters surface water. Subsidence also can exacerbate flood frequency, depth, and duration, as well as alter (or reverse) gravity-driven flow or drainage of storm water or sewage. Land subsidence alone or exacerbated by sea-level rise causes coastal retreat, including marshes and wetlands, which serve as protective barriers against wave action or storm surge.
Repeated geodetic observations of dynamic land surfaces enable these hazardous areas to be mapped.
Some of the recent and novel applications of geodesy to hydrologic science are highlighted below. These include (1) elastic loading caused by changes in terrestrial water storage; (2) aquifer-system compaction and land subsidence caused by groundwater overdraft; (3) surface-water monitoring by satellite altimetry to support science, water management, and flood forecasting; and (4) water cycle monitoring by satellite gravimetry to track changes in total water storage. These new applications require high accuracy in the vertical and gravity components of deformation that rely on maintaining, and in some cases enhancing, the geodetic infrastructure.
ELASTIC LOADING
The hydrological cycle and associated water availability vary both on longer time scales according to wet and drought periods, and on shorter time scales from intense precipitation events (Anderson et al., 2005). Increases and decreases of surface and near-surface water mass cause elastic deformation, inducing vertical and horizontal displacements (Farrell, 1972). In the western United States, seasonal changes in crustal loading are linked to precipitation changes. Increased precipitation in the cool seasons increases terrestrial water storage (surface water, snowpack, soil moisture, and groundwater) and decreased precipitation in the warm seasons decreases the terrestrial water storage. Precipitation and surface-water levels are well-sampled in the western United States, but snowpack, soil moisture, and groundwater are monitored at a small number of locations. For example, the U.S. Climate Reference Network1 has only seven soil moisture stations in California. The number of Snow Telemetry2 stations (snow pillows for measuring snow water equivalent) in the Sierra Nevada is limited, and so repeated, labor-intensive measurements at snow courses are required.
Measurements
The sensitivity of methods that can directly monitor changes in terrestrial water vary at different temporal and spatial scales. Gravimeters can detect highly local (a few hundred meters) mass changes, but they are not deployed in sufficient numbers to be useful for water cycle research (Van Camp et al., 2014). The Gravity Recovery Climate Experiment (GRACE) and GRACE Follow-On (GRACE-FO) can detect changing mass distributions over the entire Earth, but the spatial resolution is several hundred kilometers and the measurements are made monthly (Frappart et al., 2014; Thomas et al., 2014). The load-induced signals measured with the Global Navigation Satellite System (GNSS) or Interferometric Synthetic Aperture Radar (InSAR) reflect both local and regional changes, which can be inverted to estimate mass loss at basin to regional scales (Argus et al., 2014; Borsa et al., 2014; Chew and Small, 2014). Combining GNSS loading estimates and GRACE mass distribution estimates is a promising approach for monitoring terrestrial water storage at higher temporal and spatial scales (Milliner et al., 2018).
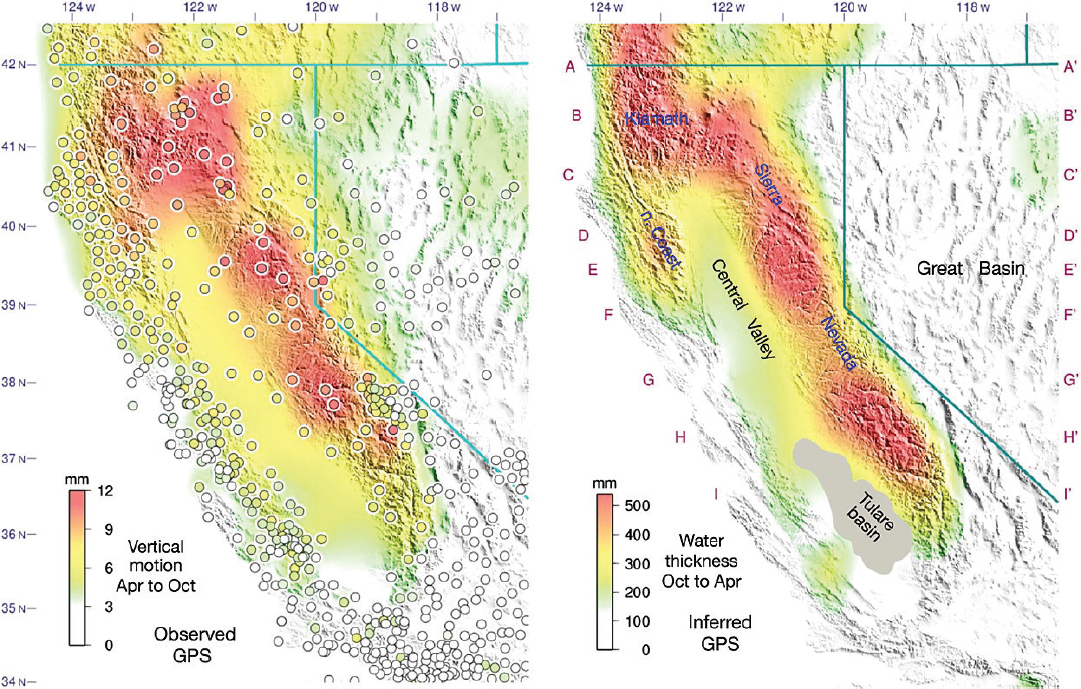
The availability of large and dense GNSS networks and improved GNSS analysis software has enabled new studies of hydrologic signals in GNSS time series, particularly in the western United States, where high-quality receivers, antennas, and monuments were installed at the 1,100 sites of the Plate Boundary Observatory. Argus et al. (2014) used GNSS data from the stations in California and Nevada and inverted the seasonal vertical coordinates to infer changes in equivalent water thickness. Their map of seasonal water mass (see Figure 4.1) has a spatial resolution of ~50 km, four times higher than that provided by GRACE. Borsa et al. (2014) used GNSS data from Plate Boundary Observatory stations throughout the western United States (see Figure 4.2). Although details of the analysis differ from Argus et al. (2014), the same general principles for elastic loading were used to estimate terrestrial water changes, in this case over several years. Their maps show the response of the solid Earth, as observed by almost 1,000 GNSS receivers, to a sustained drought in the western United States. The results indicate uplift caused by decreased loading and correlate with measured decreases in precipitation and streamflow. Water maps, such as those developed by
___________________
1 See https://www.ncdc.noaa.gov/data-access/land-basedstation-data/land-based-datasets/us-climate-reference-networkuscrn.
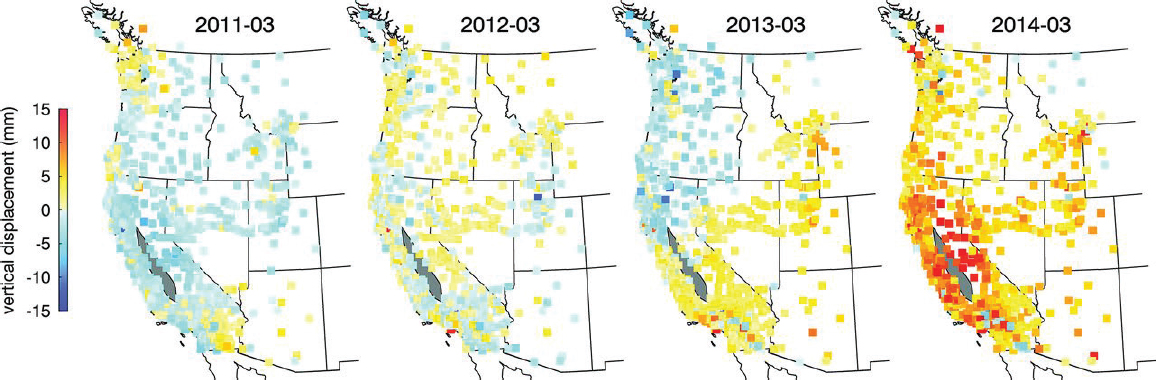
Borsa et al. (2014) and Argus et al. (2014), can be used for climate studies and they also provide independent constraints on annual snowpack estimates needed by water managers in California and Nevada.
Although hydrologic studies using GNSS data have focused almost entirely on seasonal and long-term land-surface deformation, studies of deformation on much shorter time periods are emerging. An example is heavy precipitation loading associated with Hurricane Harvey (see Box 4.1).
Geodetic Needs
In the western United States, the existing network of continuous GNSS stations and the underlying terrestrial reference frame (TRF) measures vertical crustal motion at sufficient precision (3–5 mm), sampling frequency (daily), and sampling density (40 km) to estimate interannual changes in water loads (Argus et al., 2014). The exceptional stability of the GNSS monumentation at Plate Boundary Observatory sites (Langbein et al., 1995; Herring et al., 2016) means that the GNSS network can be used to monitor the long-term effects of drought and regional climate change in this area (Borsa et al., 2014; Chew and Small, 2014). However, its value as a hydrological network assumes that this GNSS network will be maintained in the future. On the order of a few hundred of these stable, long-duration GNSS stations are now considered part of the geodetic infrastructure. At the time of this writing, the instruments are nearly 15 years old and need to be replaced or upgraded to track modern GNSS signals. Surface displacement observations from GNSS networks in other parts of the world could make an enormous contribution to the global hydrological observing network, which supports understanding current and future hydrological changes and provides clear social and economic benefits. However, a sustained commitment is required to install and operate these international GNSS networks over decadal time scales.
GNSS loading applications for hydrology require center of mass velocity and scale rate stability of 0.2 mm/yr. This requirement is equivalent to 10 mm/yr of water. In addition, a stable TRF over seasonal time scales is needed for hydrological studies. More study is needed to assure that this requirement is being met.
AQUIFER-SYSTEM COMPACTION (LAND SUBSIDENCE)
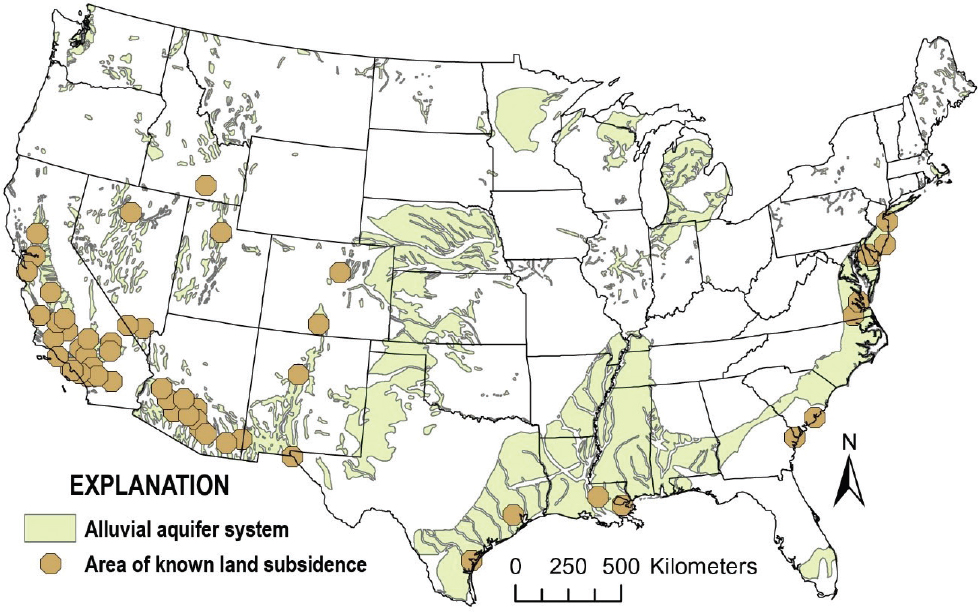
Land subsidence is inextricably linked to the development of groundwater. The compaction of aquifer systems that are partly composed of unconsolidated to semi-consolidated silt and clay and have been heavily pumped is the primary cause of subsidence in the United States (Galloway et al., 1999). Aquifer-system compaction has lowered the elevation of nearly 125,000 km2 of land and waterways, an area larger than Pennsylvania (Sneed, 2018; see Figure 4.4).
Groundwater-level changes cause aquifer systems to deform elastically (reversibly) or inelastically (permanently) as pore spaces expand or contract. Groundwater levels that vary with the seasons can cause a few centimeters of elastic land subsidence and uplift. However, sustained groundwater declines can result in a one-time discharge of water from the pore spaces of fine-grained sediments and a permanent reduction in the pore volume. The result is a decrease in the volume of the aquifer system, which is manifested as subsidence at the land surface (Galloway et al., 1999). An example of aquifer compaction in the Central Valley of California appears in Box 4.2.
Subsidence from aquifer compaction damages engineered structures, such as dams, roads, bridges, and pipelines. It can also adversely affect natural systems, for example by altering stream gradients or causing wetlands to migrate toward subsiding areas. Finally, subsidence in coastal basins can amplify relative sealevel rise (see Chapter 3).
Measurements
Geodetic surveying (spirit leveling and campaign GNSS), continuous GNSS, InSAR, and altimetry are needed to determine the location and extent of land subsidence. The ground measurements capture temporal (monthly, seasonal, or interannual) variations in subsidence rates at specific locations, and the InSAR data delineate the spatial extent of subsidence. Together, these techniques yield the spatially and temporally dense data needed to understand the causes of the observed spatial subsidence patterns and to improve subsidence models.
Repeated geodetic measurements are needed to track the changing topography to operate surface
water conveyance infrastructure, and to evaluate flood risk and stream (ecosystem) health. InSAR analyses yield spatially detailed subsidence maps that in some instances can reveal subsurface geologic structure controlling groundwater-flow fluxes (Sneed et al., 2014). InSAR is also used as a reconnaissance tool, guiding the spatial design of ground-based networks and the temporal frequency of surveying those networks (Sneed et al., 2014). Altimetry analyses provide strips of subsidence maps along tracks (Hwang et al., 2016).
Geodetic Needs
Weekly InSAR and daily GNSS verticals in the current program of record are precise enough (~5 mm) for most current water science and management applications. The program of record specifies 40 km spacing of GNSS stations, with increased spatial deployment in watersheds. Although InSAR has superior spatial sampling compared with GNSS, decorrelation, atmospheric, and ionospheric errors continue to limit its use in many areas. For this reason, a combined InSAR-GNSS product would be preferred for many land subsidence studies. Deployment of GNSS instruments augmented with nearby corner reflectors or radar transponders to amplify the synthetic aperture radar (SAR) signal, particularly in landscapes with high-frequency dynamics (agriculture), is also a possibility. While this strategy could improve InSAR retrievals, such deployments should be carefully assessed for their negative impact on nearby GNSS infrastructure.
As was discussed for loading studies, continuously operating GNSS sites are more valuable for water cycle studies if they are located in watersheds and in geographic regions that lack traditional hydrological measurement networks (e.g., Africa, South America, and some parts of Asia). Support for GNSS software in general, and for precise positioning station coordinates in particular, is needed. Automated processing of InSAR data would make the data far more accessible to more users and could serve as reconnaissance for targeted ground-based investigations, which is especially critical for those with scarce resources, such as local water districts.
Measurements of elevation changes must be tied to the TRF. Hydrological applications also need a high-quality digital elevation model (DEM), preferably a bare-earth DEM. This DEM needs to be consistent
across entire basins for local ground control or to support suborbital navigation. Radar or lidar can be used to develop accurate land-surface topography data sets, but they require GNSS (and positioning software) and the geodetic infrastructure to define the DEM in the TRF. In locations where subsidence is fairly rapid, repeat DEMs are required, or high-quality InSAR data could be used to periodically adjust an initial high-quality DEM. A high-quality DEM also could be used to improve water level measurements in wells (which are referenced to a point on or near ground surface). In places where the flow gradient is small, even small errors in water level measurements can lead to mischaracterization of the flow direction.
SURFACE WATER MONITORING BY SATELLITE ALTIMETRY
Although optimized to study ocean dynamics, satellite altimetry has been used for more than two decades to monitor water-level changes over rivers, lakes, human-made reservoirs, and floodplains (e.g., Birkett, 1998). The number of water gauges has been declining in many regions of the world (Milliman and Farnsworth, 2013), and some river basins are ungauged. Consequently, satellite altimetry plays an important and unique role in providing homogeneous and long-term monitoring of surface water levels and volumes (if combined with optical or radar imagery) over the continents (Alsdorf and Lettenmaier, 2003; Alsdorf et al., 2007). Water-level time series based on altimetry (e.g., Topography Experiment/Poseidon, Jason) extend more than 25 years, are routinely computed over thousands of surface water bodies, and are freely available.3
Measurements
The Surface Water Ocean Topography (SWOT) mission will support a range of applications in land hydrology science, surface water management, and flood forecasting (e.g., Biancamaria et al., 2010; Bates et al., 2014). SWOT will produce water elevation images for two 50 km swaths on either side of the satellite, globally (Desai, 2018). The mission will allow water height and lake extent to be measured at a resolution of 250 m or better (the goal is 100 m resolution) every 10 days. The water level of lakes, reservoirs, and floodplains will be measured with 0.1 m accuracy over 1 km2 areas. On rivers, the river slope will be measured over successive 10 km-long segments on rivers wider than 100 m to within 17 mm/km, allowing direct estimation of river discharge.
Geodetic Needs
As with other applications of satellite altimetry (see Chapter 3), the geodetic infrastructure is fundamental for estimating accurate water heights of surface waters on land. For SWOT and other altimetry missions, precise orbit determination relies on well distributed GNSS stations at the surface of the Earth, as well as a stable and accurate TRF. As with any satellite mission, SWOT also requires calibration and validation data. Accurate water level measurements can be provided with existing tide gauges only if they are tied to TRF using GNSS (Santamaria-Gomez et al., 2012).
WATER CYCLE MONITORING WITH SATELLITE GRAVITY
The 2018 launch of the GRACE-FO mission ensures the continuation of land water cycle change measurements that began in 2002. Gravity change measurements from these missions are being interpreted as change in the total water storage at spatial scales greater than 300 km and time scales longer than subseasonal. Results from these missions have been used to study total water storage variations as well as the associated meteorological and climate processes or societal influences in nearly every major river basin around the world (Rodell et al., 2018). For example, these data have been used to study drought conditions (Zhu et al., 2018) and flood potential (Geoweleeuw et al., 2018). Gridded total water storage data sets are now routinely assimilated with other data into land surface models, leading to disaggregation and downscaling of satellite geodetic observations to the catchment scales (Khaki et al., 2019).
___________________
3 See http://www.pecad.fas.usda.gov/cropexplorer/global_reservoir for lakes and http://ctoh.legos.obs-mip.fr/data/hydroweb for lakes, rivers, floodplains, and man-made reservoirs.
Measurements
The GRACE-FO mission has a design lifetime of 5 years and is expected to continue to provide measurements compatible with the GRACE mission. This application would benefit from improved measurement of all fluxes in and out of groundwater systems (Objective S-6c) at target 100-km gravity field resolution with a precision of 10 mm water layer equivalent thickness.
Geodetic Needs
Results from GRACE and GRACE-FO need to be supplemented with information from other components of the geodetic infrastructure before the results can be used in water cycle applications. First, the geodetic infrastructure is needed to determine the geocenter. Geocenter motion is one of the largest sources of uncertainty in GRACE-based surface mass change estimates (e.g., Blazquez et al., 2018), and it is typically determined using GRACE-based gravity field variations and model-based assumptions on water mass redistribution in the global ocean (Swenson et al., 2008; see also Chapter 3). Satellite laser ranging (SLR) can be used to determine the geocenter motion independently. Second, SLR is needed to independently determine the low-degree harmonics of the geopotential to mitigate the nongeophysical spaceflight environmental effects on the low-degree harmonics measured from satellites (Landerer et al., 2019). Independent estimates of low-degree harmonics are also essential to support continuity between space missions. As a practical matter, gaps are inevitable between space gravity missions, and SLR and tracking to other geodetic satellites can help test measurement continuity across these gaps.
CALIBRATION/VALIDATION AND GNSS-IR
The sections above emphasize the role of GNSS infrastructure in measuring terrestrial water storage variations, land subsidence, and surface-water heights. This same ground-based infrastructure also plays a key role in hydrologic research by providing calibration and validation data for water-related satellite missions. For example, GNSS Interferometric Reflectometry (GNSS-IR) measurements from ~120 sites in the western United States were used to validate results from the Soil Moisture Active Passive (SMAP) mission (Al-Yaari et al., 2017). GNSS-IR measurements of the ice sheet surface in Greenland and Antarctica are being used to constrain surface mass balance (Larson et al., 2015) and thus provide validation data sets for Ice, Cloud, and land Elevation Satellite 2. GNSS sites installed in the cryosphere to measure effects of glacial isostatic adjustment can also be used to provide tide gauge data in a region with limited in situ sensors (Larson et al., 2013). The SWOT mission will also need validation data sets on lakes and rivers, which can be provided by opportunistic GNSS-IR data sets or by targeted deployments of GNSS receivers. Unlike any other tide gauge technology, GNSS-IR directly provides water measurements defined in the International Terrestrial Reference Frame (ITRF).
Measurements
The measurements used in GNSS-IR are the signal-to-noise ratio computed by any high-precision GNSS receiver. Thus, they are already provided in existing GNSS data streams. Initially these data streams included only GPS but are increasingly including signals from the other constellations. This expansion provides a spatially and temporally dense data set. The spatial footprint of GNSS-IR depends on the height of the antenna above the reflecting surface, about 1,000 m2 for most GNSS sites. For a tower site (such as the 30-m Alexander tower on the Ross Ice Shelf used for meteorological measurements), the GNSS-IR footprint is nearly 1 km2 (Roesler and Larson, 2018). The temporal sensing mostly depends on whether only GPS or all GNSS satellites are tracked and varies from ~15–60 minutes.
Geodetic Needs
The main geodetic needs for GNSS-IR are orbits and software to retrieve the reflection parameters. The needed orbit accuracy is low, several meters radially. In some cases, resolving the reflection parameters requires a higher sampling rate than the standard geodetic sampling interval of 30 seconds.
SUMMARY
Water cycle research using the geodetic infrastructure requires the maintenance of at least the current stability of the ITRF. All of the geodetic products described
in this chapter depend on the frame for traceability of measurement precision.The following summarizes needs for maintaining or enhancing the geodetic infrastructure, and related improvements to enhance scientific returns.
Maintenance of the Geodetic Infrastructure
- Maintain the current stability of the ITRF. All geodetic products described herein depend on an accurate global frame scale for absolute measurement precision traceability.
- Maintain InSAR orbit accuracy to 20 mm radially and 60 mm along-track. The onboard GNSS precise orbit determination measurements should be International GNSS Service (IGS) quality (i.e., mm-level phases and dm-level pseudoranges at two or more frequencies for all four global GNSSs and with accurately calibrated antennas).
- Maintain a robust global distribution of high-quality GNSS stations, analysis products, and software. This includes high-quality GNSS satellite orbits and clocks for near-real-time and long-term scientific studies, currently provided by the IGS.
- Continue support for high-accuracy GNSS analysis software.
- Support antenna phase calibrations (for GNSS transmitters and ground antennas), currently provided by the IGS.
- Support automated GNSS processing services that can be accessed by the hydrologic community (e.g., Nevada Reno positioning products), including high-rate positions.
- Maintain geodetic expertise to maintain institutional knowledge and technical capabilities. Training is required for GNSS, InSAR, GRACE, and lidar software. Stable and predictable funding is needed to support an educated technical workforce, software development, and infrastructure.
Enhancements to the Geodetic Infrastructure
- Additional GNSS stations in the western United States to be made part of the geodetic infrastructure. These stations would have ~40 km spacing, with additional stations in watersheds or areas that lack traditional hydrological measurement networks. They may be selected largely from the existing National Science Foundation Plate Boundary Observatory. They must meet the highest standards for data quality, site design, stable monumentation, and metadata definition and dissemination. In addition to the water cycle needs, they would improve the accuracy of local surveys (e.g., aircraft lidar).
Related Improvements to the Geodetic Infrastructure to Enhance Scientific Returns
- Automated estimates of daily soil moisture, snow depth/snow water estimate, vegetation water content, and subdaily water level variations.
- Improved spatial resolution in time-variable gravity from GRACE-type missions.
- Automated InSAR processing and improvements in removing atmospheric errors.
- Improvements in GNSS vertical accuracy and precision.
- Combined GNSS-InSAR products.
- Enhance GNSS stations with corner reflectors or radar transponders for coherent InSAR signal.
- Support for GNSS reflection software for hydrological, cryosphere, and water level applications.
- Lidar for defining an initial bare-earth DEM, which could be updated regularly using InSAR for flood and wetland/riparian ecosystems applications.
- Free and open SAR data, analysis software, and products such as time series.
- Free and open GRACE data and ancillary products.
REFERENCES
Al-Yaari, A., J.P. Wigneron, Y. Kerr, N. Rodriguez-Fernandez, P.E. O’Neill, T.J. Jackson, G. De Lannoy, A. Al Bitar, A. Mialon, P. Richaume, J.P. Walker, A. Mahmoodi, and S. Yueh. 2017. Evaluating soil moisture retrievals from ESA’s SMOS and NASA’s SMAP brightness temperature datasets. Remote Sensing of Environment 193:257-273.
Alsdorf, D.E., and D.P. Lettenmaier. 2003. Tracking fresh water from space. Science 301:1492-1494.
Alsdorf, D., L.L. Fu, N. Mognard, A. Cazenave, E. Rodriguez, D. Chelton, and D. Lettenmaier. 2007. Measuring global oceans and terrestrial fresh water from space. Eos, Transactions, American Geophysical Union 88(24):253.
Anderson, M.T., and L.H. Woosley, Jr. 2005. Water availability for the Western United States—Key scientific challenges. U.S. Geological Survey Circular 1261, 85 pp.
Argus, D.F., Y. Fu, and F.W. Landerer. 2014. Seasonal variation in total water storage in California inferred from GPS observations of vertical land motion. Geophysical Research Letters 41:1971-1980.
Bates, P.D., J.C. Neal, D.R. Alsdorf, and G.J.P. Schumman. 2014. Observing global surface water flood dynamics. Surveys in Geophysics 35(3):839-852.
Biancamaria, S., K.M. Andreadis, M Durand, E.A. Clark, E. Rodriguez, N.M. Mognard, D.E. Alsdorf, D.P. Lettenmaier, and Y. Oudin. 2010. Preliminary characterization of SWOT hydrology error budget and global capabilities. IEEE Journal of Selected Topics in Applied Earth Observations and Remote Sensing 3(1):6-19.
Birkett, C.M. 1998. Contribution of the TOPEX NASA Radar Altimeter to the global monitoring of large rivers and wetlands. Water Resources Research 34(5):1223-1239.
Blazquez, A., B. Meyssignac, J.M. Lemoine, E. Berthier, A. Ribes, and A. Cazenave. 2018. Exploring the uncertainty in GRACE estimates of the mass redistributions at the Earth surface: Implications for the global water and sea level budgets. Geophysical Journal International 215(1):415-430.
Borsa, A.A., D.C. Agnew, and D.R. Cayan. 2014. Ongoing drought-induced uplift in the western United States. Science 345(6204):1587-1590.
Chew, C.C., and E.E. Small, 2014. Terrestrial water storage response to the 2012 drought estimated from GPS vertical position anomalies. Geophysical Research Letters 41(7):6145-6151.
Clawges, R.M., and C.V. Price. 1999. Digital data sets describing principal aquifers, surficial geology, and ground-water regions of the conterminous United States. U.S. Geological Survey Open-File Report 99-77. https://pubs.er.usgs.gov/publication/ofr9977.
Desai, S. 2018. Surface Water and Ocean Topography (SWOT) Project: Science Requirement Document. JPL D-61923, Revision B. https://swot.jpl.nasa.gov/docs/D-61923_SRD_Rev_B_20181113.pdf.
Farr, T.G., C.E. Jones, and Z. Liu. 2015. Progress report—Subsidence in the Central Valley, California. California Department of Water Resources, 34 pp. https://water.ca.gov/groundwater/docs/NASA_REPORT.pdf.
Farr, T.G., C.E. Jones, and Z. Liu. 2016. Progress report—Subsidence in California, March 2015-September 2016. California Department of Water Resources, 37 pp. https://www.water.ca.gov/waterconditions/docs/2017/JPL%20subsidence%20report%20final%20for%20public%20dec%202016.pdf.
Farrell, W.E. 1972. Deformation of the Earth by surface loads. Reviews of Geophysics 10:761-797.
Frappart, F., F. Papa, J. Santos da Silva, G. Ramillien, C. Prigent, F. Selyer, and S. Calmant. 2012. Surface freshwater storage and dynamics in the Amazon basin during the 2005 exceptional drought. Environmental Research Letters 7:044010.
Galloway, D.L., D.R. Jones, and S.E. Ingebritsen. 1999. Land subsidence in the United States. U.S. Geological Survey Circular 1182, 175 pp. http://pubs.usgs.gov/circ/circ1182.
Geoweleeuw, B.T., A. Kvas, C. Gruber, A.K. Gain, T. Mayer-Gürr, F. Flechtner, and A. Güntner. 2018. Daily GRACE gravity field solutions track major flood events in the Ganges–Brahmaputra Delta. Hydrology and Earth System Sciences 22:2867-2880.
Herring, T.A., T.I. Melbourne, M.H. Murray, M.A. Floyd, R.W. King, W.M. Szeliga, D.A. Philips, C.M. Puskas, M. Santillan, and L. Wang. 2016. Plate Boundary Observatory data analysis methods and related networks: GPS data methods and geodetic products. Journal of Geophysical Research 54(4):759-808.
Hwang, C., R. Kao, J. Han, C.K. Shum, D.L. Galloway, M. Sneed, W.-C. Hung, Y.-S. Cheng, and F. Li. 2016. Time-varying land subsidence detected by radar altimetry: California, Taiwan and north China. Scientific Reports 6:28160.
Khaki, M., I. Hoteit, M. Kuhn, E. Forootan, and J. Awange. 2019. Assessing data assimilation frameworks for using multi-mission satellite products in a hydrological context. Science of the Total Environment 647:1031-1043.
Landerer, F., C. Dahle, F. Webb, F. Flechtner, H. Save, D. Wiese, C. McCullough, D.-N. Yuan, S. Bettadpur, and M. Murboeck. 2019. Assessment of the first gravity and mass change fields from the GRACE Follow-On Science Data System. Geophysical Research Abstracts 21:EGU2019-12596-3.
Langbein, J.O., F. Wyatt, H. Johnson, D. Hamann, and P. Zimmer. 1995. Improved stability of a deeply anchored monument for deformation monitoring. Geophysical Research Letters 22:3533-3536.
Larson, K.M., R. Ray, F. Nievinski, and J. Freymueller. 2013. The accidental tide gauge: A case study of GPS reflections from Kachemak Bay, Alaska. IEEE Geoscience and Remote Sensing Letters 10(5):1200-1205.
Larson, K., J. Wahr, and P. Kuipers Munneke. 2015. Constraints on snow accumulation and firn density in Greenland using GPS receivers. Journal of Glaciology 61(225):101-114.
Milliman, J.D., and K.L. Farnsworth. 2013. River Discharge to the Coastal Ocean—A Global Synthesis. Cambridge, UK: Cambridge University Press.
Milliner, C., K. Materna, R. Burgmann, Y. Fu, A.M. Moore, D. Bekaert, S. Adhikari, and D.F. Argus. 2018. Tracking the weight of Hurricane Harvey’s stormwater using GPS data. Sciences Advances 4(9):EAAU2477.
NASEM (National Academies of Sciences, Engineering, and Medicine). 2018. Thriving on Our Changing Planet: A Decadal Strategy for Earth Observation from Space. Washington, DC: The National Academies Press.
Rodell, M., J.S. Famiglietti, D.N. Wiese, J.T. Reager, H.K. Beaudoing, F.W. Landerer, and M.-H. Lo. 2018. Emerging trends in global freshwater availability. Nature 557:651-659.
Roesler, C.J., and K.M. Larson. 2018. Software Tools for GNSS Interferometric Reflectometry. GPS Solutions 22:80. https://doi.org/10.1007/s10291-018-0744-8.
Santamaria-Gomez, A., M. Gravelle, X. Collilieux, M. Guichard, B. Martin Miguez, P. Tiphaneau, and G. Woppelmann. 2012. Mitigating the effects of vertical land motion in tide gauge records using a state-of-the-art GPS velocity field. Global and Planetary Change 98-99:6-17.
Sneed, M. 2018. Land subsidence. In Groundwater: State of the Science and Practice, W.M. Alley, ed. Westerville, OH: National Groundwater Association. Pp. 58-62.
Sneed, M., and C. Faunt. 2018. Water availability and land subsidence in California’s San Joaquin Valley (abstract). In Workshop on Land Subsidence Induced by Fluid Extraction, Taipei, Taiwan, November 8-9, 2018.
Sneed, M., J. Brandt, and M. Solt. 2013. Land subsidence along the Delta-Mendota Canal in the northern part of the San Joaquin Valley, California, 2003-10. U.S. Geological Survey Scientific Investigations Report 2013-5142, 87 pp.
Sneed, M., J.T. Brandt, and M. Solt. 2014. Land subsidence, groundwater levels, and geology in the Coachella Valley, California, 1993-2010. U.S. Geological Survey, Scientific Investigations Report 2014-5075, 62 pp.
Sneed, M., J.T. Brandt, and M. Solt. 2018. Land subsidence along the California Aqueduct in west-central San Joaquin Valley, California, 2003-10. U.S. Geological Survey Scientific Investigations Report 2018-5144, 67 pp.
Swenson, S., D. Chambers, and J. Wahr. 2008. Estimating geocenter variations from a combination of GRACE and ocean model output. Journal of Geophysical Research: Solid Earth 113(B8):B08410.
Thomas, A.C., J.T. Reager, J.S. Famiglietti, and M. Rodell. 2014. A GRACE-based water storage deficit approach for hydrological drought characterization. Geophysical Research Letters 41:1537-1545.
Thomas, B.F., J.S. Famiglietti, F.W. Landerer, D.N. Wiese, N.P. Molotch, and D.J. Argus. 2017. GRACE groundwater drought index: Evaluation of California Central Valley groundwater drought. Remote Sensing of Environment 198:384-392.
Van Camp, M., O. de Viron, L. Métivier, B. Meurers, and O. Francis. 2014. The quest for a consistent signal in ground and GRACE gravity time-series. Geophysical Journal International 197(1):192-201.
Zhu, B., X. Xie, and K. Zhang. 2018. Water storage and vegetation changes in response to the 2009/10 drought over North China. Hydrology Research 49(5):1618-1635.


