
2
Contextual Factors That Shape the Current Teacher Workforce
Changes to the national landscape of K–12 education over the past 20 years have shaped both the needs and dynamic nature of the current teacher workforce. Chief among these changes are revisions to federal policy, new rigorous national content standards, and an increasingly diverse student population (including, e.g., race and ethnicity, culture, spoken language, disability). In this chapter, the committee provides an overview of these key changes and lays the groundwork for the next chapter’s closer look at how these changes in policy, standards, and increasing emphasis on classroom inclusion give rise to changes in expectations for teaching. The chapter begins by giving a clear picture of the current demographics of the teacher workforce. This discussion of teacher demographics is followed by an exploration of the makeup of the student population, including students who vary with respect to the home language and cultures they represent, their linguistic proficiency, socioeconomic status, and disability status. The increasing diversity of the classroom in terms of student demographics has outpaced the changes in the demographics of teachers, resulting in a deepening mismatch between the makeup of the teacher workforce and the student population in public schools. The chapter concludes with a discussion of changes in federal legislation related to elementary and secondary education since 2000. We explain how the recent (voluntary) adoption and implementation of more rigorous national content standards by some states has increased the expectations for both students and teachers.
DEMOGRAPHICS OF THE TEACHER WORKFORCE
Before looking at factors that impact the work teachers do in the classroom, it is important to understand the current demographics of the teacher workforce. In this section, the committee presents demographic data on the current teacher workforce and discusses the relationship between these demographic characteristics and those of the population of K–12 public school students.1 We draw on the latest available nationally representative data on the trends in the K–12 teaching profession: the 2011–2012 Schools and Staffing Survey (SASS) and the 2015–2016 National Teacher and Principal Survey (NTPS).2
In fall 2017, there were approximately 3.8 million full-time-equivalent public school elementary and secondary teachers in the country (McFarland et al., 2019). The majority of these K–12 teachers were White (80.1%), and the majority were women (76.6% of K–12 teachers in 2015). To contextualize the low proportion of Black teachers in the workforce, Box 2-1 unpacks the notable historical context including school desegregation. Moreover, it should be noted that the committee was unable to find data related to the number of teachers with disabilities; that is, there are no data systems at the local, state, or national level that provide the number of teachers who identify themselves as having a disability.
Changes Over Time
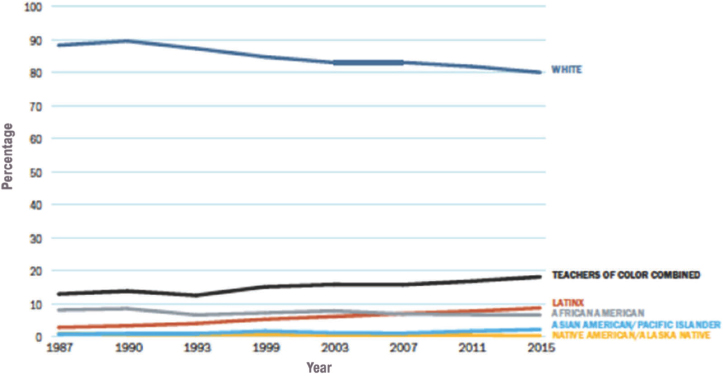
Notably, the demographic makeup of the teacher workforce has undergone relatively small changes over the past 20 years (see Table 2-1). For example, as will be described in the subsequent section, the percentage of White teachers in 2003 was roughly 83 percent and fell to 80 percent by 2016. This is somewhat contrary to other notable claims in the field that have suggested bigger changes in the workforce (e.g., Ingersoll et al., 2018). However, the changes are more pronounced going back 30 years to 1987 where White teachers comprised 88 percent of the total workforce.
Race and Ethnicity3
Data in Table 2-1 show that the number of Black teachers has remained relatively steady over the past 20 years, whereas there has been an
___________________
1 All demographic data about the U.S. teacher workforce population cited in this chapter are from Goldring et al. (2013) and Taie and Goldring (2017), unless otherwise noted.
2 The 2015–2016 NTPS is a redesign and replacement of the SASS, which has served as one of the key sources of nationally representative data on a range of important education topics since the 1987–1988 school year.
3 When reporting the race and ethnicity demographics, the committee uses the nomenclature from the studies described throughout the report and recognizes that this leads to inconsistencies in reporting.
TABLE 2-1 Teacher Workforce Demographics from 1987 to 2016 in Percentages of Total Workforce, by Demographic Characteristic
| 1987–1988 | 2003–2004 | 2011–2012 | 2015–2016 | |
|---|---|---|---|---|
| Male | 29.3 | 25.0 | 23.7 | 23.4 |
| Female | 70.2 | 75.0 | 76.3 | 76.6 |
| American Indian/Native American | 1.1 | 0.5 | 0.5 | 0.4 |
| Asian/Pacific Islander | 0.9 | 1.5 | 1.9 | 2.5 |
| Black | 8.2 | 7.9 | 6.8 | 6.7 |
| White | 88.3 | 83.1 | 81.9 | 80.1 |
| Multiple Races | n/a | 0.7 | 1.0 | 1.4 |
| Hispanic | 2.9 | 6.2 | 7.6 | 8.8 |
| Average Age | — | 42.5 | 42.4 | 41.4 |
| Less Than 30 | 13.4 | 16.6 | 15.3 | 15.0 |
| 30–49 | 67.4 | 50.4 | 54.0 | 55.9 |
| 50 or More | 17.9 | 33.0 | 30.7 | 29.0 |
NOTE: The data do not have equal spacing due to the reporting years available.
SOURCE: U.S. Department of Education, NCES 2018-070. Available: https://nces.ed.gov/programs/digest/d17/tables/dt17_209.10.asp?referrer=report.
increase of roughly 2.5 percent in the number of Hispanic teachers over the same time period. As Figure 2-1 demonstrates, in the past decade, Latinx teachers have supplanted Black teachers as the most represented teachers of color: in 2015, 8.8 percent of teachers were Latinx, whereas Black teachers made up only 6.7 percent of the workforce. The issue of
SOURCE: Carver-Thomas (2018). Available: https://learningpolicyinstitute.org/sites/default/files/product-files/Diversifying_Teaching_Profession_REPORT_0.pdf.
TABLE 2-2 Science and Math Teacher Demographics, by Teacher Characteristics (in percentage)
| Science | Math | |||||
|---|---|---|---|---|---|---|
| Elementary | Middle | High | Elementary | Middle | High | |
| Sex | ||||||
| Female | 94 | 71 | 57 | 94 | 70 | 60 |
| Male | 6 | 28 | 43 | 6 | 30 | 40 |
| Race | ||||||
| White | 88 | 91 | 91 | 89 | 89 | 91 |
| Hispanic | 9 | 7 | 6 | 10 | 8 | 7 |
| Black or African American | 8 | 8 | 5 | 7 | 8 | 5 |
| Asian | 2 | 2 | 5 | 3 | 3 | 4 |
| American Indian or Alaskan Native | 1 | 2 | 2 | 1 | 1 | 2 |
| Native Hawaiian or Other Pacific Islander | 1 | 0 | 0 | 0 | 1 | 1 |
SOURCE: Banilower et al. (2018).
teacher demographics as it relates to the labor market is discussed in detail in Chapter 4.
The issue of underrepresentation of teachers of color occurs across grade bands and content areas. In a 2018 survey of teachers in science, technology, engineering, and mathematics (STEM) content areas, Banilower and colleagues disaggregated teachers by grade range (i.e., elementary, middle, and high school) and by subject taught to demonstrate that the percentage of teachers of color is even less prevalent in the STEM fields than it appears to be in the population of teachers at large (see Table 2-2). Among high school science and math teachers, 91 percent of teachers identify as White (Banilower et al., 2018). In addition, teachers of color are highly concentrated in certain geographical areas: in 2011 an estimated 40 percent of schools had no teachers of color, meaning students of color in those schools might never experience a teacher of their own race or ethnicity (Bireda and Chait, 2011).
Gender and Age
The teacher workforce has also remained relatively stable with respect to gender and age.4 There has been little change in the percentages
___________________
4 It should be noted that during the reporting period the survey instruments did not offer respondents an opportunity to identify as any gender other than male or female. Therefore, there are likely a population of non-binary teachers that are not represented in the data.
of men and women in the teaching workforce since the early 2000s. The proportion of female teachers in public schools across the country was 75 percent in 2003–2004 and 76.6 percent in 2015–2016, while the percentage of male teachers was 25 percent in 2003–2004 and 23.4 percent in 2015–2016. Whereas women make up the majority of the teaching staff at schools throughout the United States, the proportion of male teachers increases as grade level increases. This remains particularly true in the STEM content areas, with men making up 40 percent of high school math teachers and 43 percent of high school science teachers, as compared to 36 percent of high school teachers generally (Banilower et al., 2018; Taie and Goldring, 2017).
The average age of teachers has also remained consistent over time. In 2016, the average age of K–12 public school teachers was 41.4 years old, whereas in 2003–2004 that average was 42.5 years old. However, there were slight changes in the distribution of teachers’ ages from 1987 to 2015. There was a decrease in the percentage of teachers ages 30–49 and an increase in the percentage of teachers ages 50 and older (refer to Table 2-1). These changes in the ages over the broader timeframe is more consistent with data reported by Ingersoll and colleagues (2018). Similarly, teacher experience has also remained relatively consistent: in 2003–2004, 17.8 percent of all public school teachers reported less than 3 years of full-time teaching experience, while that number dropped to 15 percent in 2016.
The Importance of a Diverse Teacher Workforce
As highlighted by a recent National Academies of Sciences, Engineering, and Medicine report, Monitoring Educational Equity (NASEM, 2019), “there is growing and compelling evidence that teacher-student racial match has important effects on student outcomes” (p. 87). Not only do these effects appear for both short-term outcomes, such as student test scores and academic attitudes (Dee, 2004; Egalite and Kisida, 2018; Egalite, Kisida, and Winters, 2015; Goldhaber and Hansen 2010) but also they are observed for long-term outcomes, such as dropping out of high school (Gershenson, Jacknowitz, and Brannegan, 2017).
For example, Gershenson and colleagues (2018) conducted a longitudinal study in North Carolina and found that Black students who were assigned to a class with a Black teacher at least once in 3rd, 4th, or 5th grade were less likely to drop out of high school and more likely to aspire to go to college. Black boys that had at least one Black teacher during grades 3–5 were more likely to stay in school as evidenced by the high school dropout rate cut in half. Although less pronounced, the same holds true for Black boys from low-income families who were 39 percent less likely to drop out of high school than those who had never had a Black teacher (for more discussion, see Carver-Thomas, 2018). In other words, the benefit
of having a Black teacher for just 1 year in elementary school can persist over several years, especially for Black students from low-income families (Carver-Thomas, 2018).
In addition to academic benefits, students of color can experience social and emotional benefits from having teachers of color. A study using longitudinal data for North Carolina K–5 students and teachers between 2006 and 2010 found that students with teachers of another race had more unexcused absences and an increased likelihood of being chronically absent than students with race-matched teachers (Lindsay and Hart, 2017). In particular, boys of color taught by White teachers were more likely to be chronically absent and to have more suspensions than did other students. Thus, it is increasingly clear that students of color benefit from having teachers of color. While the mechanisms that lead to these positive impacts are not fully understood, the committee notes that the underrepresentation of teachers of color in the workforce is particularly troubling.
Although one option for trying to create more purposeful role models for students of color would be to place more teachers of color in schools serving high concentrations of students of color, the committee argues that it is important that all teachers are able to recognize and leverage the various assets students are bringing into the classroom, and receive some preparation to respond to the shifting population of students (the ways in which the makeup of the student population has changed will be described in the next section). Central to the work of teachers is for them to be aware of when teachers and their students do not share similar backgrounds and experiences, as teachers need to develop an understanding of their students’ incoming knowledge and experience. Additionally, as Chapter 4 will articulate, there are substantial local differences in the distribution of teachers—inherent inequity exists when a school system has students from one race but lacks many teachers of that race. Lastly, as articulated above, students can benefit from having teachers from the same background in terms of motivation and having visible role models. Through the use of inclusive pedagogies, discussed in Chapter 3, teachers can equip themselves with a better understanding of their students and position them as capable learners and contributors in the classroom.
STUDENT DIVERSITY IN THE CLASSROOM
There have been substantial changes to the student population over the past 20 years. These shifts in student population and new understandings of the role of culture in learning (see Chapter 3) have also given rise to changing expectation for teachers. We outline these changes in student demographics below.
SOURCE: de Brey et al. (2019).
Race and Ethnicity
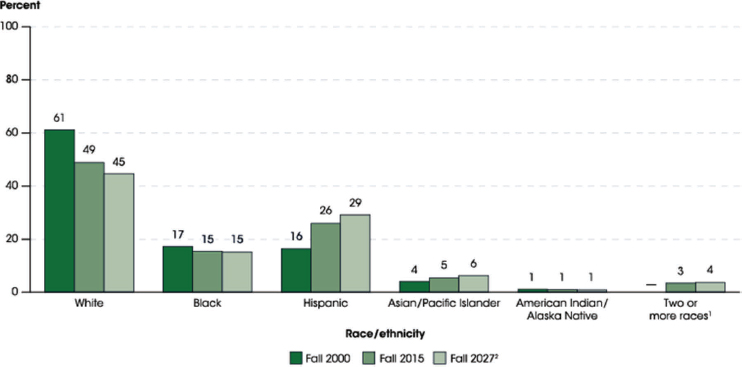
One of the major changes in student demographics over the period from 2000 to 2015 is the decline in the percentage of White students in the K–12 public school population from 61 percent to 49 percent.5 In 2015, 50 percent of the students enrolled in public schools were students of color (i.e., Black, Hispanic, Asian/Pacific Islander, American Indian/Alaska Native, and two or more races6), reflecting an ongoing increase in the racial/ethnic diversity of students in U.S. public schools (de Brey et al., 2019; see Figure 2-2). The fastest growing group are Hispanic students; between fall 2000 and fall 2015, the proportion of Hispanic students increased from 16 percent to 26 percent. Over the same period, the percentage of Black students dropped slightly from 17 percent to 15 percent. The percentage of Asian students stayed almost the same moving from 4 percent to 5 percent.
Native Language and Country of Origin
Coupled with the increase in the racial/ethnic diversity of U.S. public school, the linguistic diversity within the student population has also
___________________
5 Note that the percentage of White students is 49 percent, whereas the percentage of White teachers is 80 percent. For that same time, Hispanic students were 26 percent of the population and Hispanic teachers were only 8.8 percent. This difference is less striking for the relationship between Black students (15%) and Black teachers (6.7%)
6 Students self-identifying as two or more races were first reported in the 2008–2009 school year.
SOURCE: McFarland et al. (2018).
increased (see NASEM, 2018). Students enrolled in U.S. schools come with a variety of linguistic resources. For many students, English is not spoken in the home, or is not the only language spoken in the home. One way that research instruments have attempted to capture information about linguistic diversity is by classifying students as English learners (ELs). While the practices that districts and researchers have used to make these classifications are fraught, looking across data on students that have been classified as ELs does reveal important trends.
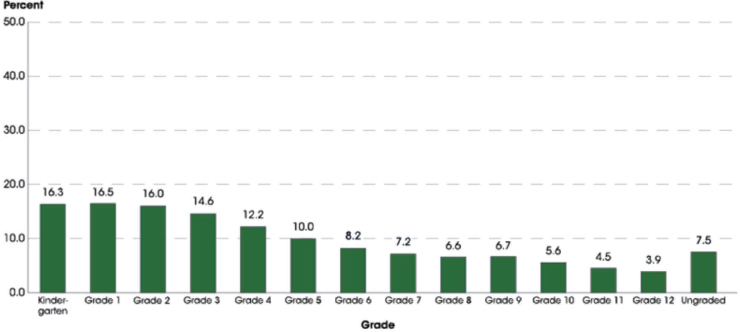
ELs constitute a sizable and fast-growing segment of the K–12 student population in the United States: nearly 5 million students are classified as ELs in K–12 public schools, making up about 10 percent of total students enrolled (McFarland et al., 2018). Although ELs are found across all grades in K–12 public schools, there are higher percentages of ELs in the elementary grades (see Figure 2-3; McFarland et al., 2018). ELs are enrolled in every state and the District of Columbia, and a significant proportion of EL students (nearly 54.6%) reside in California, Texas, and Nevada. Following California, Texas, and Nevada, New Mexico (15.7%) and Colorado (11.6%) reported the next highest percentages of ELs. Additionally, ELs are more concentrated in urban and suburban areas (McFarland et al., 2018).
There has also been a rise in the number of immigrant students in U.S. elementary and secondary schools, reflected in the increase in the population overall.7 The proportion of U.S. children, ages 0–17, growing up in immigrant
___________________
7 All data were accessed from the Migration Policy Institute’s Data Hub, see https://www.migrationpolicy.org/programs/data-hub/state-immigration-data-profiles.
families8 is approximately 26 percent. Currently, the overwhelming majority of all children in immigrant families (88%) were born in the United States. However, within the group of children and youth born outside of the country, there has been an increase in the number of unaccompanied minors, growing from 13,625 in 2012 to 57,496 in 2014. The majority (approximately 75%) of these children are ages 14–18 and they are entering U.S. schools without the support of adult family members.
Socioeconomic Status
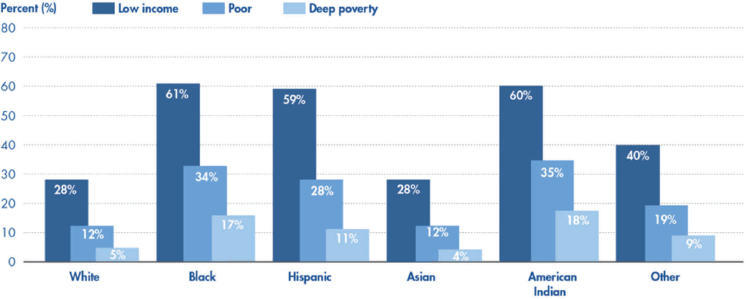
“Among all children under age 18 in the United States, 41 percent are low-income children and 19 percent—approximately one in five—are poor” (Jiang and Koball, 2018). The low-income category includes individuals who would qualify as poor (defined as below 100% of the federal poverty threshold [FPT]) and near poor (defined as between 100% to 199% of the FPT).9 Deep poverty is defined as less than 50 percent of the FPT. Younger children (birth to age 11) were more likely to be in either low-income or poor families compared to older children (ages 12–17) (Jiang and Koball, 2018).
As shown in Figure 2-4, Black, American Indian, and Hispanic children are disproportionately low income and poor, and Hispanics comprise the largest share of all low-income children and poor children (Jiang and Koball, 2018). The number of children living in low-income families varies by region with 4.1 million (35%) children in the Northeast, 5.8 million (39%) in the Midwest, 7.2 million (41%) in the West, and 12.5 million (45%) in the South.
Jiang and Koball also show that children living in low-income families are 50 percent more likely to have less residential stability. However, research conducted by Aratani (2009) shows that stable housing is important for healthy child development. Overall, research points to links between educational outcomes and family incomes; that is, the incidence, depth, duration, and timing of poverty all influence a child’s educational attainment (Ferguson, Bovaird, and Mueller, 2007; OECD, 2018).
___________________
8 The term “immigrants” refers to people residing in the United States who were not U.S. citizens at birth. This population includes naturalized citizens, lawful permanent residents, certain legal nonimmigrants (e.g., persons on student or work visas), those admitted under refugee or asylee status, and persons illegally residing in the United States. The term “immigrant family” refers to children under age 18 with at least one immigrant parent.
9 The 2016 FPT is equivalent to $24,339 for a family of four with two children; $19,318 for a family of three with one child; and $16,543 for a family of two with one child. See http://www.nccp.org/publications/pub_1194.html for additional information.
SOURCE: Jiang and Koball (2018).
Individuals with Disabilities
In 2016, the number of children and youth ages 3–21 receiving special education services was roughly 6 million, or about 9 percent of all public school students (Office of Special Education and Rehabilitative Services, 2018). Among students receiving special education services, the most prevalent disability category is specific learning disabilities in which 38.6 percent of students receive services (Office of Special Education and Rehabilitative Services, 2018). The number of students with Individual Education Plans, which are required for special education students, has remained relatively stable, with minor fluctuations from 1998 to 2017.
However, compared to a decade ago, students identified as needing special services are slightly more likely to be educated inside a regular education classroom than pulled out and served through a designated special education classroom. In 2008, 58.5 percent of students needing special services received 80 percent or more of their instruction in a regular classroom compared to 63 percent in 2016.10 Close to one-half of students categorized with multiple disabilities or intellectual disabilities received their education inside a regular classroom less than 40 percent of the time (Office of Special Education and Rehabilitative Services, 2018).
Another shifting trend associated with students receiving special education services is the number of students who may be categorized with health impairments. Special education eligibility classifications have fluctuated
___________________
10 This includes students who are classified under the speech or language impairment, visual impairment, specific learning disability, developmental delay, or other health impairment categories.
over the past 20 years, due in part to new disability classifications. For example, traumatic brain injury (TBI) and autism were first reported as unique disability categories in 1991–1992. Students with TBI and autism (0.9%) have always existed within special education populations; however, prior to 1991 they were identified as eligible for Individuals with Disabilities Education Act services by meeting other category criteria such as mental retardation or speech impairment (Brock, 2006). New classification structures allow students to receive the individual services they need to be successful. However, this can place additional demands on classroom teachers who may not be adequately prepared to meet the unique needs of students who require differentiated supports.
Summary
Overall, students in today’s classrooms are racially and ethnically diverse, more likely to speak a language other than English at home, and students in these classrooms have a higher percentage of immigrants. Special education students are more likely to receive instruction in the general education classroom than in specialized settings. These shifting demographics indicate that teachers today need the knowledge and skills to successfully understand the diversity of their students. This also calls for positive beliefs and attitudes about the changing demographics. There have been changes not only in the student population, but also in the views about schools’ responsibilities to students with varying needs. That is, teachers are being asked to further differentiate instruction, connect learning experiences to the interests and identities of their students, and set up inclusive and welcoming learning environments (for a deeper discussion of these expectations, see Chapter 3).
FEDERAL EDUCATION POLICY
Changes in federal education policy over the period from 2000 to 2019 led to substantial policy changes at the state, district, and school level that had consequences for teachers’ work. Some of these changes in policy are in response to comparisons made globally to determine how the “nation’s students are prepared to compete with their counterparts in a globalizing economy” (Singer, Braun, and Chudowsky, 2018, p. vii). In the following section we briefly describe three pieces of legislation that had significant effects on districts and schools: the No Child Left Behind Act (NCLB), the Race to the Top (RTTT) Program, and the Every Student Succeeds Act (ESSA). (Note that NCLB and ESSA are reauthorizations of the Elementary and Secondary Education Act).
No Child Left Behind Act
The passage of NCLB in 200111 marked a number of critical changes in the federal education policy landscape and significantly increased the federal role in holding schools responsible for the academic progress of all students. NCLB required states and local districts to (1) have academic standards, (2) make annual progress toward having every student achieve those standards and closing gaps between all students and certain groups of students, (3) test students to see whether they are learning, and (4) collect and report data on how students are doing. Specifically, the law required that all U.S. public schools test and report student achievement in mathematics and English language arts (and eventually science) annually in grades 3–8 and once in high school. Schools were required to report the results, for both the student population as a whole and for particular subgroups of students, including English learners, students in special education, students from low-income families, and students from racial/ethnic minoritized groups.
The NCLB legislation also required that every classroom be staffed by a “highly qualified” teacher and that “highly qualified” teachers were evenly distributed among schools with high concentrations of poverty and wealthier schools. Highly qualified here meant holding a bachelor’s degree, having state licensure or certification, and demonstrating knowledge of the subject they teach. This gave states latitude in determining how subject knowledge would be measured. As a result, states varied in the tests they used and even when they used the same tests, they might set different passing scores (RAND Corporation, 2007).
Under the law, schools and districts became responsible for demonstrating that all their students not only were making adequate yearly progress in their achievement in different subjects, but also had access to highly qualified teachers to support this progress. And, for the first time in history, states, districts, and schools were required to report achievement data that was disaggregated by race, class, sex, ability, language, and other characteristics. When schools failed to demonstrate adequate yearly progress, they entered into a sequence of sanctions that included requirements around the provision of supplemental education services, loss of funds, loss of local control, and the provision of pathways for students to transfer out of low-performing schools.
Starting in 2011, the Obama administration allowed states to apply for waivers that would give them flexibility from key mandates of the law, such as the target that all students would be proficient by the 2013–2014 school year. However, to receive a waiver, states had to agree to other provisions. For example, states were required to agree to set standards aimed at preparing students for higher education and the workforce. States could either
___________________
11 See No Child Left Behind Act of 2001, Pub. L. 107–110.
choose the Common Core State Standards (CCSS) or have their own state’s standards approved by local higher education institutions. States then had to put in place assessments aligned to those standards, and they had to institute teacher-evaluation systems that took into account student progress on state standardized tests. By 2015, more than 40 states had been granted waivers.
In the years following the passage of the law and as states were granted waivers, states obtained control over the content of their assessments, when and how assessments were performed, and how achievement results were to be interpreted. This state-level control resulted in wildly divergent state accountability systems across the country, and the level of rigor associated with state performance standards varied considerably from state to state (Phillips, 2014).
Although there have been a number of criticisms of NCLB, implementation of the law shed light on student populations that had historically been underperforming and underserved: states, schools, and districts were tasked with attending to the underperformance of any group of students, regardless of how well the school was performing overall. ELs and students with disabilities are examples of subgroups who were identified and whose progress was then monitored through state accountability systems, with specific consequences for how educators work with these subgroup populations. The law also highlighted the chronic underperformance of schools serving larger numbers of students of color and students living in poverty (Milner and Williams, 2008). As states implemented new school accountability models, designed to increase achievement for all students, school administrators and classroom teachers began to examine and implement tiered interventions and differentiated instructional supports to better meet the diverse needs of all students being served.
Taken together, the provisions of NCLB raised the stakes for teachers and schools. Student performance on annual assessments that were tied to content standards had direct implications for schools, placing pressure on teachers to ensure that students scored well. In addition, the disaggregation of scores meant that teachers were also held responsible for promoting the success of a diverse range of students.
Race to the Top Program
The Department of Education’s RTTT Program, a part of the America Recovery and Reinvestment Act of 2009, provided funding for competitive grants to states to encourage education innovation and reform in four areas: (1) enhancing standards and assessments, (2) improving collection and use of data, (3) increasing teacher effectiveness and achieving equity in teacher distribution, and (4) turning around low-achieving schools. The program rolled out in three phases; by the end of Phase 3 in December 2011, 18 states and the District of Columbia had received awards.
RTTT went beyond teacher quality as defined in NCLB to include a focus on teacher effectiveness. It did this by giving higher scores to proposals that included teacher performance evaluations based on student achievement. States responded by creating educator evaluation systems that considered student achievement data alongside teacher observations and other sources of evidence of student learning. These teacher evaluation systems had direct consequences for teachers.
Every Student Succeeds Act
In 2015, the passage of ESSA revised the previous policies outlined in NCLB to provide states more discretion in the use of federal funds and in implementation and revision of accountability measures. ESSA12 reframed conversations about how federal funding and accountability could be leveraged to promote more equitable systems of education for all students. Under ESSA, states had flexibility to develop their own long-term and short-term goals, though they were required to address proficiency on tests, English language proficiency, and graduation rates. Furthermore, the goals had to set an expectation that gaps in achievement and graduation rates between all students and students in particular groups would become smaller over time. Additionally, under ESSA, states were not required to evaluate teachers through student outcomes and the “highly qualified teacher” requirement was relaxed.
ESSA ushered in a focus on a “well-rounded education for all students” with an emphasis on schools utilizing Title IV, Part A funding to ensure all students have access to courses such as social studies and fine arts and that all students be provided a safe and healthy school environment. As states began to submit their state ESSA plans, equity became a central theme in several initiatives, including new accountability models and plans that emphasized and provided recognition for growth among subgroups of students within a population.
Though the passage of ESSA has eased some of the high stakes associated with NCLB’s accountability requirements and RTTT’s educator evaluation systems, the increased focus on student performance and achievement ushered in at the beginning of the 21st century has fundamentally altered the work of educators (for more on this, see Chapter 3).
CONTENT AREA STANDARDS
The standards-based reform movement developed in response to A Nation at Risk (National Commission on Excellence in Education, 1983) was driven by the idea that standards could catalyze improvements in the
___________________
12 Every Student Succeeds Act of 2015, Pub. L. 114–95.
American education system and ensure the nation’s economic competitiveness. In 1994 the reauthorization of the Elementary and Secondary Education Act made standards-based reform the official national approach to public schooling by requiring states to set challenging standards aligned to assessments and accountability measures (Massell, 2008). The testing requirements imposed by NCLB built on the commitment to standards and assessments linked to them.
Standards for students learning in the content areas have been in use at the state level since the early 1990s. By the early 2000s, every state had developed and adopted its own learning standards that specify what students in grades 3–8 and high school should be able to do. However, standards varied across states and each state had its own definition of proficiency. Concern about the lack of consistency across state standards led to the development of the CCSS in mathematics and English language arts (ELA) in 2009 (National Governors Association Center for Best Practices and Council of Chief State School Officers, 2010). These standards are intended to ensure that all students leave high school ready to enter college or start a career; they are more rigorous than many previous state standards. In 2010, 45 states initially adopted the CCSS in mathematics and ELA, though since that time 8 of the 45 states are no longer part of the consortium. Similarly, the Next Generation Science Standards: For States, By States (NGSS; NGSS Lead States, 2013) were developed to provide guidance for K–12 science education. The NGSS are also more challenging than many previous state standards in science. As of 2019, 44 states have adopted the NGSS or standards that are based on them. These more rigorous standards, coupled with the increased accountability demands placed by NCLB, raise the expectations for teachers, which are discussed in detail in Chapter 3.
SUMMARY
Teachers work within a larger, ever-expanding and shifting education system, characterized by ongoing federal reform efforts. The demographics of the teacher workforce have remained relatively stable, but the expectations placed on teachers have changed enormously. The 2001 federal law, No Child Left Behind, established accountability standards for all U.S. public schools by requiring that all students in grades 3–8, and once in high school, be tested in mathematics and ELA, and eventually science. The relatively recent adoption and implementation of rigorous national content standards in some states has raised the expectations for students’ learning, which in turn raised the expectations for instruction (see Chapter 3 for a deeper discussion of the shifts of standards across content areas). It is this broader policy landscape that provides part of the context for what is expected of K–12 teachers.
Another important change in the education system is the increasing diversity of the student population; that is, there are more students in the classroom who vary with respect to their cultural backgrounds, the language that they speak, their proficiency with English, as well as students who qualify for disability status. As articulated above (see section on The Importance of a Diverse Teacher Workforce) and developed more in Chapter 3, emerging research suggests that it can be beneficial for students to have teachers from similar backgrounds at some point in their educational experience. Given the emerging research that shows benefits to students when they have role models, the lack of diversity (including teachers with disabilities) in the teacher workforce is concerning.
Overall, it is clear that the work of teachers today is impacted by increased and explicit demands placed on them, demands that stem in part from accountability legislation, shifts in rigorous content standards, and the increasing diversity of students in the classroom. Each of these factors are compounded by and responsive to the others. In the following two chapters, the committee explores both the changing expectations for teachers (Chapter 3) and the dynamics of the teacher workforce (Chapter 4) in greater detail.
REFERENCES
Aratani, Y. (2009). Homeless Children and Youth: Causes and Consequences. New York: National Center for Children in Poverty, Columbia University, Mailman School of Public Health. Available: http://www.nccp.org/publications/pdf/text_888.pdf.
Banilower, E.R., Smith, P.S., Malzahn, K.A., Plumley, C.L., Gordon, E.M., and Hayes, M.L. (2018). Report of the 2018 NSSME+. Chapel Hill, NC: Horizon Research, Inc.
Bireda, S., and Chait, R. (2011). Increasing Teacher Diversity: Strategies to Improve the Teacher Workforce. Washington, DC: Center for American Progress.
Brock, S.E. (2006). An examination of the changing rates of autism in special education. The California School Psychologist, 11, 31–40. Available: https://files.eric.ed.gov/fulltext/EJ902516.pdf.
Carver-Thomas, D. (2018). Diversifying the Teaching Profession: How to Recruit and Retain Teachers of Color. Palo Alto, CA: Learning Policy Institute.
de Brey, C., Musu, L., McFarland, J., Wilkinson-Flicker, S., Diliberti, M., Zhang, A., Branstetter, C., and Wang, X. (2019). Status and Trends in the Education of Racial and Ethnic Groups 2018 (NCES 2019-038). U.S. Department of Education. Washington, DC: National Center for Education Statistics. Available: https://nces.ed.gov/pubs2019/2019038.pdf.
Dee, T.S. (2004). Teachers, race, and student achievement in a randomized experiment. Review of Economics and Statistics, 86(1), 195–210.
Egalite, A.J., and Kisida, B. (2018). The effects of teacher match on students’ academic perceptions and attitudes. Educational Evaluation and Policy Analysis, 40(1), 59–81.
Egalite, A.J., Kisida, B., and Winters, M.A. (2015). Representation in the classroom: The effect of own-race teachers on student achievement. Economics of Education Review, 45, 44–52.
Ferguson, H.B., Bovaird, S., and Mueller, M.P. (2007). The impact of poverty on educational outcomes for children. Paediatrics Child Health, 12(8), 701–706.
Fontenot, K., Semega, J., and Kollar, M. (2018). Income and Poverty in the United States: 2017. Washington, DC: U.S. Government Publishing Office.
Gershenson, S., Jacknowitz, A., and Brannegan, A. (2017). Are student absences worth the worry in U.S. primary schools? Education Finance and Policy, 12(2), 137–165.
Gershenson, S., Hart, C.M.D., Hyman, J., Lindsay, C., and Papageorge, N.W. (2018). The Long-Run Impacts of Same-Race Teachers. NBER Working Paper No. 25254. Available: https://www.nber.org/papers/w25254.pdf.
Goldhaber, D., and Hansen, M. (2010). Using performance on the job to inform teacher tenure decisions. American Economic Review, 100(2), 250–255.
Goldring, R., Taie, S., Rizzo, L., Colby, D., and Fraser, A. (2013). User’s Manual for the 2011–12 Schools and Staffing Survey Volumes 1–6. (NCES 2013-330 through 2013-335). U.S. Department of Education. Washington, DC: National Center for Education Statistics.
Ingersoll, R.M., Merrill, E., Stuckey, D., and Collins, G. (2018). Seven Trends: The Transformation of the Teacher Force—Updated October 2018. CPRE Research Reports. Available: https://repository.upenn.edu/cpre_researchreports/108.
Jiang, Y., and Koball, H. (2018). Basic Facts about Low-Income Children: Children under 18 Years, 2016. New York: National Center for Children in Poverty, Columbia University Mailman School of Public Health. Available: http://www.nccp.org/publications/pdf/text_1194.pdf.
Lindsay, C.A., and Hart, C.M. (2017). Teacher race and school discipline. Education Next, 17(1). Available: https://www.educationnext.org/teacher-race-and-school-discipline-suspensions-research.
Massell, D. (2008). The Current Status and Role of Standards-Based Reform in the United States. Paper prepared for the National Research Council Workshop on Assessing the Role of K–12 Academic Standards in States, January 17–18, Washington, DC.
McFarland, J., Hussar, B., Wang, X., Zhang, J., Wang, K., Rathbun, A., Barmer, A., Forrest Cataldi, E., and Bullock Mann, F. (2018). The Condition of Education 2018 (NCES 2018-144). U.S. Department of Education. Washington, DC: National Center for Education Statistics.
McFarland, J., Hussar, B., Zhang, J., Wang, X., Wang, K., Hein, S., Diliberti, M., Forrest Cataldi, E., Bullock Mann, F., and Barmer, A. (2019). The Condition of Education 2019 (NCES 2019-144). U.S. Department of Education. Washington, DC: National Center for Education Statistics.
Milner IV, H.R., and Williams, S.M. (2008). Analyzing education policy and reform with attention to race and socio-economic status. Journal of Public Management & Social Policy, 14(2).
National Academies of Sciences, Engineering, and Medicine (NASEM). (2018). English Learners in STEM Subjects: Transforming Classrooms, Schools, and Lives. Washington, DC: The National Academies Press.
———. (2019). Monitoring Educational Equity. Washington, DC: The National Academies Press.
National Governors Association Center for Best Practices and Council of Chief State School Officers. (2010). Common Core State Standards. Washington, DC: Author.
NGSS Lead States. (2013). Next Generation Science Standards: For States, By States. Washington, DC: The National Academies Press.
Oakley, D., Stowell, J., and Logan, J.R. (2009). The impact of desegregation on black teachers in the metropolis, 1970–2000. Ethnic and Racial Studies, 39(9), 1576–1598.
OECD. (2018). Equity in Education: Breaking Down Barriers to Social Mobility. Paris: OECD Publishing.
Office of Special Education and Rehabilitative Services. (2018). 40th Annual Report to Congress on the Implementation of the Individuals with Disabilities Education Act. Washington, DC: U.S. Department of Education. Available: https://www2.ed.gov/about/reports/annual/osep/2018/parts-b-c/40th-arc-for-idea.pdf.
Phillips, G.W. (2014). International Benchmarking: State and National Education Performance Standards. Available: https://www.air.org/sites/default/files/downloads/report/AIR_International%20Benchmarking-State%20and%20National%20Ed%20Performance%20Standards_Sept2014.pdf.
RAND Corporation. (2007). Evaluating Teacher Quality Under No Child Left Behind. Research Brief. Available: https://www.rand.org/pubs/research_briefs/RB9287/index1.html.
Singer, J.D., Braun, H.I., and Chudowsky, N. (2018). International Education Assessments: Cautions, Conundrums, and Common Sense. Washington, DC: National Academy of Education.
Taie, S., and Goldring, R. (2017). Characteristics of Public Elementary and Secondary School Principals in the United States: Results from the 2015–16 National Teacher and Principal Survey First Look (NCES 2017-070). U.S. Department of Education. Washington, DC: National Center for Education Statistics.
Thompson, O. (2019). School Desegregation and Black Teacher Employment. NBER Working Paper No. 25990. Available: https://www.nber.org/papers/w25990.pdf.
This page intentionally left blank.


