
Appendix C
Prevalence, Impact, and Costs of Treatment for Temporomandibular Disorders
By Gary Slade and Justin Durham*
ABSTRACT
In nationally representative surveys, 5 percent of U.S. adults report having experienced orofacial pain in the preceding 3 months, a prevalence rate that has persisted for three decades. The prevalence of orofacial pain symptoms varies substantially according to gender, age, and household income. There are smaller relative differences according to race, ethnicity, and geographic region, although in a large study focusing solely on Hispanics, prevalence varied from 4 percent among South American Hispanics to 7 percent among Puerto Ricans. Most people with orofacial pain report symptoms that “come and go,” their average rating of pain severity at its worst being 7 on a scale from 1 (mild) to 10 (severe), and one in six have chronic symptoms. Half of those with symptoms use over-the-counter analgesics and one-fifth use prescription medication to manage the symptoms. A minority report social impacts, including staying at home more than usual (8 percent), avoiding family or friends (6 percent), and taking time off work (5 percent).
Because they represent a “snapshot” of the population at a single point in time, these prevalence rates mask a high rate of intermittent symptoms in the population. In one longitudinal study, symptoms developed at a
___________________
* Suggested citation: Slade, G., and J. Durham. 2020. Prevalence, impact, and costs of treatment for temporomandibular disorders. Paper commissioned by the Committee on Temporomandibular Disorders (TMDs): From Research Discoveries to Clinical Treatment. In Temporomandibular disorders: Priorities for research and care (see Appendix C). Washington, DC: The National Academies Press.
rate of 18.8 percent per annum, many of which resolved, and when study participants were examined using validated criteria for clinical temporomandibular disorders (TMDs), the incidence rate was 3.9 percent per annum. Six months later, half of incident cases had persistent TMDs, and 7 years later, approximately half of incident cases again had a TMD (although many of them did not have a persistent TMD at 6 months). By implication, fluctuation and remission continue through life, such that prevalence in any single cross-sectional survey is a function of an individual’s history of TMD onset, remission, and persistence.
The factor most strongly associated with the prevalence of orofacial pain is the presence of pain elsewhere in the body: nationally, the prevalence is 32 percent among adults who have all four of headache, neck pain, back pain, and joint pain, whereas prevalence is only 1 percent among adults with none of those pain conditions. Many of those other pains themselves are chronic in nature, with the consequence that people with TMDs are more likely than not to have chronic pain from any anatomical location. Moreover, one-quarter of people with orofacial pain symptoms report high-impact chronic pain from any anatomical location, compared with only 7 percent for people without orofacial pain symptoms.
The cost burdens of TMDs have been investigated most thoroughly in a study of adults with persistent orofacial pain living in the northeast of England. Total costs per 6-month period varied from £321 to £519 per person during the 2-year period of the study, with the major driver being consultation costs and, especially, specialist consultation costs. Direct out-of-pocket costs averaged £334 per person per 6-month period. Indirect costs included employer-related costs due to work loss, which averaged £74 per person per 6-month period. However, the largest contribution to indirect costs was due to “presenteeism” (i.e., reduced productivity due to problems with concentration or decision making while at work), which averaged £905 per person. Overall, TMDs exerted a substantial impact on the individual and economy through lost productivity and on the health care system due to disorganized care pathways increasing the number of consultations required to achieve either diagnosis or care for the condition. Given that the data are from a national and linked health care service, which is free at the point of delivery, it is reasonable to assume that costs are not driven by profit. It is possible that costs differ in other systems of wholly privately delivered health care.
INTRODUCTION
This is a report commissioned by the National Academies of Sciences, Engineering, and Medicine’s Committee on Temporomandibular Disorders (TMDs): From Research Discoveries to Clinical Treatment. It uses data
from observational studies to describe the impact of TMDs in the population, with a focus on three topics: public health burden, burden on patients, and costs. The information comes primarily from published studies and from a new analysis of data from the U.S. National Health Interview Survey (NHIS) and two studies conducted by the authors:
- The U.S.-based OPPERA study1: Orofacial Pain: Prospective Evaluation and Risk Assessment
- The UK-based DEEP study2: Developing Effective and Efficient Care Pathways for Patients with Chronic Pain
The report is limited to studies of painful TMDs where the defining features are pain in the joints and/or muscles of the jaws; and limitation in jaw function due to the pain. In clinical studies, painful TMDs are classified as arthralgia (joint pain) and myalgia (muscle pain).
PUBLIC HEALTH BURDEN
Prevalence of TMDs
Prevalence of Orofacial Pain Symptoms in the U.S. National Health Interview Survey
Prevalence refers to the proportion of people in a defined population who have a health condition during a specified time period. The prevalence of pain conditions such as TMDs is usually measured in cross-sectional health surveys that ask respondents about pain symptoms that are characteristic of TMDs (hereafter labeled “orofacial pain”). In some instances a clinical examination is also conducted, with the goal to properly distinguish pain symptoms caused by TMDs from pain symptoms caused by other types of pathology. The primary requirements for a valid estimation of TMD prevalence are selection of a random sample of study participants from the target population of interest; valid and reliable questions or examination methods to classify the presence or absence of TMD pain in each study participant; and a sufficient number of study participants to estimate the prevalence with reasonable precision. “Reasonable precision” is signified by a relatively narrow 95 percent confidence limit (95% CL) around the estimate of prevalence. To make valid conclusions when comparing findings from different populations or different points in time, it is critical that the case classifications use consistent criteria, including the reference period used to specify the “time period” in which pain was experienced. In studies of TMD, it is common for the reference period to encompass the 3 or 6 months prior to the survey interview or examination.
In the U.S. adult population, the NHIS measures the prevalence of many health conditions, along with health-related behaviors and socio-demographics (see Boxes C-1 and C-2). The NHIS uses a rigorous sampling methodology to collect data annually from approximately 40,000 adults. For this report the data were downloaded from the NHIS website, and relevant data items from the “family” and “adult” were merged, along with survey design variables. The data were analyzed with survey estimation procedures in the SAS statistical analysis program, observing guidelines described by the National Center for Health Statistics.3
In most of the NHIS annual surveys conducted since 1989, orofacial pain symptoms have been assessed using a single-item question asked of all respondents aged 18 years or more:
The following questions are about pain you may have experienced in the PAST <REFERENCE PERIOD>. Please refer to pain that LASTED A WHOLE DAY OR MORE. Do not report aches and pains that are fleeting or minor. During the PAST <REFERENCE PERIOD>, did you have facial ache or pain in the jaw muscles or the joint in front of the ear.
In 1989, when the reference period was 6 months, the prevalence of orofacial pain symptoms in the U.S. adult population was 6.0 percent (see Table C-1). In subsequent years, when the reference period was 3 months, prevalence was somewhat lower, ranging from 4.3 percent to 5.2 percent. Statistically, the increase of nearly 1 percentage point between 1999 and 2018 years is not appreciably greater than 95 percent confidence intervals for single years, signifying no meaningful trend of increasing prevalence. Overall, the findings represent a fairly consistent prevalence rate, after allowing for an expected greater prevalence due to the longer reference period used in the 1989 survey.
This pattern of fairly consistent prevalence in the population at large does not refute other findings of statistically significant changes within specific demographic groups. For example, a study of non-Hispanic whites aged 45–54 years used two sets of three annual NHIS surveys to compare prevalence in 1997–1999 with prevalence in 2011 to 2013.4 During that period, the authors found a statistically significant increase in prevalence, from 5.5 percent to 6.8 percent. As noted below, age-related patterns also vary according to gender, and there is some suggestion of generational differences between females born before or after 1970.
Socio-Demographic Variation in Prevalence of Orofacial Pain Symptoms (NHIS 2017–2018)
The NHIS also collects extensive data about socio-demographic characteristics, other health conditions, and the study participants’ use of health care. It is therefore possible to examine cross-sectional variation in the
TABLE C-1 Prevalence of Orofacial Pain Symptoms in the U.S. Adult Population, 1989–2018
| Year | Reference Period* | % | Prevalence, 95% CL |
|---|---|---|---|
| 1989 | 6 months | 6.0 | 5.7, 6.3 |
| 1999 | 3 months | 4.3 | 4.0, 4.5 |
| 2009 | 3 months | 5.1 | 4.7, 5.4 |
| 2018 | 3 months | 5.2 | 4.8, 5.5 |
*Reference period used when subjects were asked about orofacial pain symptoms.
prevalence of orofacial pain symptoms according to those characteristics. However, it should be emphasized that any observed cross-sectional associations do not necessarily signify a causal relationship, in either direction, between those characteristics and orofacial pain symptoms. For example, as noted below, TMD prevalence is inversely associated with income, but that does not necessarily mean that low income contributes causally to the symptoms, nor that orofacial pain symptoms reduce people’s income, notwithstanding that both causal processes are plausible.
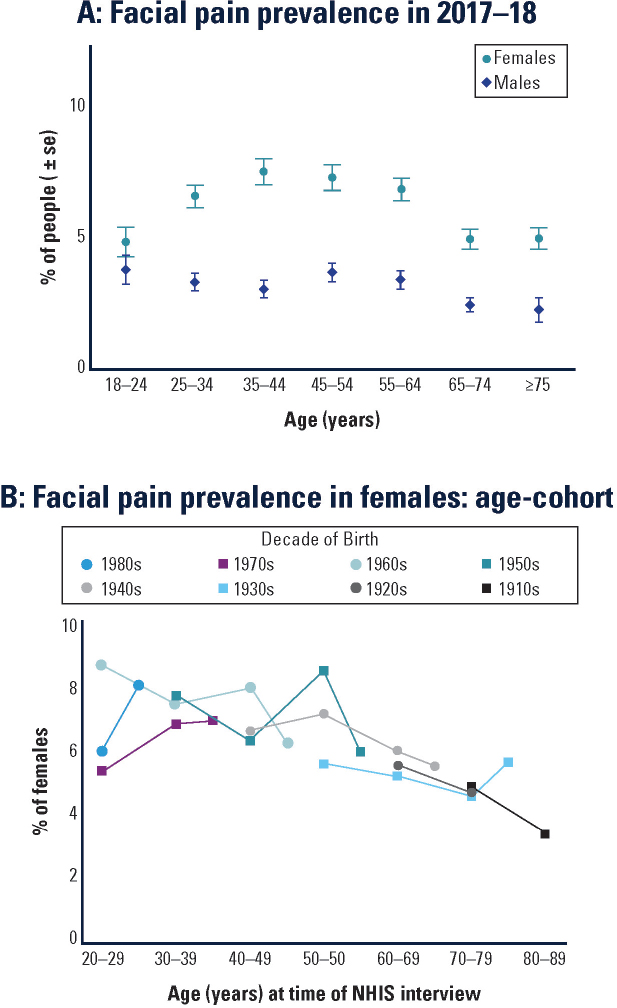
In 2017–2018, the prevalence of orofacial pain symptoms among U.S. adults was 4.8 percent (95% CL=4.5, 5.0; see Table C-2). When expressed as absolute numbers, orofacial pain symptoms were experienced by approximately 11.8 million U.S. adults (95% CL=11.2 million, 12.4 million). In other words, the absolute number was most likely between 11.2 million and 12.4 million, after considering survey sampling variability. The prevalence varied appreciably according to age, gender, race, and income. Specifically, the prevalence was elevated approximately two-fold in females compared with males, whites compared with Asian Americans, and low-income compared with high-income households. There was an apparent inverted-U relationship with age, such that the prevalence was greatest in 45- to 54-year-olds but lower in both the youngest (18–24 years) and oldest (≥75 years) age groups. In contrast, the prevalence did not vary appreciably according to ethnicity or geographic region.
Focus on Age and Gender with Orofacial Pain (NHIS Surveys)
Figure C-1 focuses on the variation in orofacial pain prevalence according to both gender and age because they are such fundamental demographic characteristics. The first noteworthy feature is that the inverted-U association between age and prevalence is seen only in females (see Figure C-1A). That is, among males the prevalence differences between age groups are inconsistent and small, whereas among females prevalence clearly peaks in middle age, whereas it is lower in the youngest age group and the two oldest age groups.
It is tempting to conclude that aging accounts for the differences seen among female age groups in Figure C-1A. However, the pattern might just as well be due to generational differences between women born in different historical periods. For example, women aged 55–64 in 2017 were born between 1953 and 1962, and hence entered their 20s in the early 1970s. It follows that they experienced vastly different social, economic, and health care circumstances than the women entering their 20s in 2017, who were born at the end of the 20th century. Comparisons of the two generations in a single 2017 survey could readily be influenced as much by those historical circumstances as any effects of aging. However, those effects can be
TABLE C-2 Socio-Demographic Characteristics Associated with Orofacial Pain Symptom Prevalence in U.S. Adults, 2017–2018
| Population Group | % of Population | TMD Prevalence* (%, 95% CL) |
|---|---|---|
| All adults | 100.0 | 4.8 (4.5, 5.0) |
| Age (years) | ||
| 18–24 | 11.8 | 4.2 (3.5, 5.0) |
| 25–34 | 17.8 | 4.9 (4.3, 5.4) |
| 35–44 | 16.4 | 5.2 (4.6, 5.8) |
| 45–54 | 16.7 | 5.4 (4.9, 6.0) |
| 55–64 | 16.8 | 5.1 (4.6, 5.7) |
| 65–74 | 12.1 | 3.7 (3.3, 4.2) |
| Sex | ||
| Female | 51.7 | 6.2 (5.9, 6.6) |
| Male | 48.3 | 3.2 (2.9, 3.5) |
| Region | ||
| Northeast | 17.8 | 4.4 (3.8, 4.9) |
| Midwest | 21.9 | 4.9 (4.3, 5.4) |
| South | 36.6 | 4.5 (4.1, 4.9) |
| West | 23.7 | 5.4 (4.9, 5.9) |
| Race | ||
| White | 77.7 | 5.0 (4.8, 5.3) |
| Black/African American | 12.4 | 3.6 (3.0, 4.2) |
| Native American | 1.2 | 4.1 (2.8, 5.5) |
| Asian | 6.4 | 3.0 (2.3, 3.7) |
| Other/multiple | 2.4 | 7.1 (5.4, 8.8) |
| Ethnicity | ||
| A: Hispanic | 16.2 | 4.4 (3.8, 5.0) |
| B: Not Hispanic | 83.8 | 4.8 (4.6, 5.1) |
| Income:Poverty ratio | ||
| <1.0 | 10.4 | 7.3 (6.5, 8.2) |
| 1.0–<2.0 | 16.1 | 5.9 (5.3, 6.5) |
| 2.0–<4.0 | 26.6 | 4.8 (4.4, 5.2) |
| ≥4.0 | 40.5 | 3.7 (3.3, 4.0) |
| Unknown | 6.4 | 4.5 (3.6, 5.4) |
*Jaw or face pain that lasted ≥1 day in the 3 months preceding the NHIS interview. From the authors’ analysis of data from n=52,159 participants in the 2017–2018 NHIS surveys.
SOURCES: From the authors’ analysis of NHIS: 1A is based on data from n=52,159 participants in the 2017–2018 NHIS surveys; 1B is based on data NHIS surveys conducted in 1989 (n=42,370 participants), 1999 (n=30,780 participants), 2009 (n=27,705 participants), and 2018 (n=25,397 participants).
disentangled only by using results from sequential cross-sectional studies conducted over decades.
Because the NHIS has been measuring prevalence for several decades, it is possible to analyze the data using age–cohort plots5 to disentangle generational and aging effects. Figure C-1B shows age–cohort plots for eight cohorts of females born in different decades. During four successive NHIS surveys conducted in 1989, 1999, 2009, and 2018, members of each cohort were sampled for at least three surveys. The results suggest that the age-related reductions in prevalence seen in Figure C-1A are associated more with aging than with generational differences between cohorts. Specifically, for females aged 50 years or more, there was a fairly consistent reduction in prevalence in older age groups, regardless of the decade in which they were born. The age-related pattern earlier in adulthood is more difficult to discern: for females born in the 1970s and 1980s, there is some indication that prevalence increased as they aged from around 20 to 40 years, whereas for their mothers, born in the 1950s and 1960s, there is some indication that prevalence decreased as they aged from 20 to 40 years.
Overall, this analysis of NHIS surveys spanning three decades shows how the prevalence of orofacial pain symptoms has been patterned by gender, aging, and generational influences:
- Among females born before 1970 the prevalence generally declined through adulthood;
- For females born since 1970, there was some evidence of an increase in prevalence from 20 to 40 years, followed by a decline through the remainder of adulthood; and
- In men, age-related differences in prevalence were small and inconsistent.
Prevalence of Orofacial Pain Symptoms According to Health Care Usage and Other Pain Conditions (NHIS 2017–2018)
In 2017–2018 the prevalence of orofacial pain symptoms tended to be greater among people who had used health care in the preceding year than among those who had not (see Table C-3). Specifically, there was an approximately two-fold difference in orofacial pain symptom prevalence associated with having seen a physical/occupational therapist, chiropractor, or medical specialist and a 1.5-fold difference associated with having seen a general doctor. In contrast, the prevalence of TMDs did not differ according to whether participants had seen a dentist within the preceding year. It must be emphasized that the 2017–2018 surveys did not inquire as to the reasons for health care visits or, in particular, whether people with orofacial pain symptoms sought health care because of those symptoms.
TABLE C-3 Orofacial Pain Symptom Prevalence According to Other Pain and Health Care Usage, NHIS 2017–2018
| Health Care Provider Seen in Past Year† | % of Population | TMD Prevalence* (%, 95% CL) |
|---|---|---|
| General doctor | ||
| No | 29.4 | 3.4 (3.0, 3.7) |
| Yes | 69.6 | 5.4 (5.1, 5.7) |
| Medical specialist | ||
| No | 70.7 | 3.7 (3.5, 4.0) |
| Yes | 28.2 | 7.5 (7.0, 8.0) |
| Mental health professional | ||
| No | 89.6 | 4.0 (3.8, 4.3) |
| Yes | 9.4 | 11.9 (10.8, 13.0) |
| Chiropractor | ||
| No | 88.5 | 4.4 (4.1, 4.6) |
| Yes | 10.5 | 8.4 (7.6, 9.3) |
| Therapist (PT/OT/etc.) | ||
| No | 88.2 | 4.3 (4.0, 4.5) |
| Yes | 10.8 | 8.9 (8.1, 9.7) |
| Dentist | ||
| No | 35.8 | 4.8 (4.4, 5.2) |
| Yes | 64.2 | 4.8 (4.5, 5.0) |
| Other Pain Symptom | ||
| Neck pain | ||
| No | 84.3 | 2.5 (2.3, 2.7) |
| Yes | 15.7 | 17.0 (16.0, 17.9) |
| Low back pain | ||
| No | 70.7 | 2.4 (2.2, 2.6) |
| Yes | 29.2 | 10.5 (9.9, 11.0) |
| Severe headache/migraine | ||
| No | 84.7 | 2.8 (2.6, 3.0) |
| Yes | 15.3 | 15.9 (14.9, 16.9) |
| Joint pain/aching/stiffness | ||
| No | 65.7 | 2.6 (2.4, 2.9) |
| Yes | 34.3 | 8.9 (8.4, 9.3) |
| # body pain symptoms | ||
| 0 | 46.8 | 1.1 (0.9, 1.3) |
| 1 | 26.9 | 3.0 (2.6, 3.3) |
| 2 | 14.7 | 7.4 (6.7, 8.1) |
| 3 | 8.3 | 15.7 (14.4, 17.0) |
| 4 | 3.3 | 32.4 (29.9, 34.9) |
*Jaw or face pain that lasted ≥1 day in the 3 months preceding the NHIS interview.
†Reasons for health care visits were not determined.
SOURCE: From the authors’ analysis of data from n=52,159 participants in the 2017–2018 NHIS surveys.
Larger differences in prevalence were seen in relation to the presence of other pain conditions (i.e., other than orofacial pain symptoms; see Table C-3). People reporting headache or pain symptoms in the neck, back, or joints had at least three times the prevalence of orofacial pain symptoms as people without those body pain symptoms (see Table C-3). Using a simple count of those four body pain symptoms, the prevalence of orofacial pain symptoms increased markedly from 1.1 percent among people with no body pain symptoms to 32.4 percent among people with all four body pain symptoms.
Prevalence of Orofacial Pain Symptoms Reported in Other U.S. Studies
The first population-based survey of orofacial pain symptoms in the United States was conducted in 1986 among adult enrollees in a health maintenance organization in Washington State.6 It used a single screening question to determine the presence of pain in the face or jaw for at least 1 day in the preceding 6 months, excluding minor or fleeting pain. Orofacial pain symptoms in the prior 6 months were reported by 12 percent of participants, approximately twice the prevalence reported in the 1989 NHIS. It is worth noting the sample studied in Washington also had nearly twice the prevalence of headache and back pain as reported in NHIS.7 A separate study of adolescents (i.e., aged 11–17 years) enrolled in the same health maintenance organization also investigated orofacial pain symptoms.8 The prevalence of orofacial pain symptoms increased from 4 percent in pre-pubertal children to 14 percent in adolescents who had completed pubertal development.
A study of adults of ages ≥45 years living in disadvantaged rural areas of Florida asked about several orofacial pain symptoms in the preceding 6 months. The prevalence of jaw joint pain was 8.3 percent, and the prevalence of face pain was 3.1 percent. Another study used similar questions in a telephone interview survey of people aged ≥65 years living in northern Florida.9 The prevalence of jaw joint pain was 7.7 percent, and the prevalence of face pain was 6.9 percent. A recent survey of adult dental patients found that prevalence of orofacial pain symptoms was 6.6 percent among those attending dental providers in the Northwest Practice-Based Research Collaborative in Evidence-Based Dentistry.10
Although NHIS surveys show small differences in orofacial pain symptom prevalence between Hispanic and non-Hispanic adults, the survey lacks the precision needed to evaluate heterogeneity within the Hispanic population. Instead, the Hispanic Community Health Study/Study of Latinos (HCHS/SoL) is a large, population-based survey of health status among Hispanics sampled at four U.S. study sites, which is intended to capture a diversity of Hispanic heritage. Between 2008 and 2011, interviewers queried
16,415 study participants aged 18–74 years about orofacial pain symptoms during the preceding 12 months. Questions were asked separately about pain in the face (with an estimated 9.5 percent of the population answering affirmatively) and pain in the jaw joint (14.6 percent), yielding an overall prevalence of 5.1 percent (95% CL=4.7, 5.5) responding positively to both questions.11 The prevalence varied from a low of 3.8 percent among South American Hispanics to 7.0 percent among Puerto Ricans. The patterns of socio-demographic variation were similar to those seen for the population at large: in the HCHS/SoL study, prevalence was greater in women (6.7 percent) than men (3.4 percent) and varied approximately two-fold between the lowest-income group (6.4 percent among people with annual income less than $15,000) and the highest-income group (3.5 percent among people with annual income of $40,000 or more).
Prevalence of Examiner-Classified TMDs and Concordance with Self-Reported Symptoms of TMD
The prevalence of examiner-classified TMDs has been reported in only one study of a random sample of U.S. adults.12 It was limited to women aged 18 years or more living in New York City, New York, or Newark, New Jersey. In 2000–2001 phone numbers were sampled at random, and eligible women completed a screening interview to determine presence of orofacial pain symptoms in the preceding 6 months. Specifically, respondents were asked, “Other than a toothache or sinus pain, did you have pain in your face, in the front of your ear or jaw, more than one time, in the last 6 months?” Respondents were also invited to a research dental clinic where examiners determined presence or absence of TMD using Research Diagnostic Criteria for Temporomandibular Disorders (RDC/TMD) criteria for myofascial subtype of TMDs (the most frequent subtype of TMD myalgia). The researchers also evaluated the screening validity of TMDs, as determined by self-reported symptoms, compared with the reference standard of examiner-determined TMDs.
The prevalence of orofacial pain symptoms in the population of women studied was 10.1 percent, which was very similar to the 10.5 percent of participants with examiner-classified TMDs (see Table C-4). This high degree of concordance in prevalence occurred despite the finding that orofacial pain symptom reporting had low sensitivity (0.427), meaning that more than half of the people with examiner-classified TMDs responded negatively to the screening question (i.e., they were false negatives). However, the specificity was 0.947, which meant that false positives occurred for only 1 in 20 of the people who did not have a TMD when examined. In the overall population of women, the number of false positives and false negatives mostly cancelled one another. The consequence
TABLE C-4 Orofacial Pain Symptoms and Examiner-Classified Temporomandibular Disorders Among Women in New York and New Jersey, 2000–2001
| Prevalence | |
| Facial pain symptoms in preceding 6 months | 10.1% |
| Examiner-classified myofascial TMD | 10.5% |
| Screening validity: facial pain symptoms compared with examination reference standard: | |
| Sensitivity | 0.427 |
| Specificity | 0.947 |
| Positive predictive validity | 0.486 |
| Negative predictive validity | 0.937 |
SOURCE: Janal et al., 2008.12
was that the prevalence was very similar whether based on interview or examination.
A similar degree of concordance between self-reported symptoms and examiner-classified TMDs was reported in the OPPERA study.13 Compared with the study of women in New York and New Jersey, the OPPERA study used fairly similar questions to screen for TMDs and a similar examination protocol to classify TMD. In the OPPERA study, the positive predictive value (0.492) and negative predictive value (0.926) were similar to values reported in Table C-4.
Summary of Results from Studies of Orofacial Pain Symptom Prevalence in U.S. Adults
The prevalence of orofacial pain symptoms in the U.S. population is consistent at 5 percent, although there are marked differences in prevalence according to age, gender, and income. The two-fold elevation of prevalence in females relative to males is consistent with systematic reviews from other populations.14 The prevalence also differs considerably according to presence of comorbid health conditions and the use of health care (see Table C-3). The higher prevalence of TMDs reported in selected U.S. populations (e.g., 12 percent prevalence in Washington and Newark) likely reflects underlying differences in characteristics of those populations, such as the presence of comorbid health conditions and the use of health care.
Incidence of Temporomandibular Disorders
Incidence refers to the rate at which a disease develops within a population during a specified time interval. Studies of incidence are more difficult to conduct than cross-sectional studies of prevalence because incidence has to be measured over time, using a prospective cohort study design. At baseline, it is also important to enroll study participants who do not have the disease. The goal during the follow-up period is to enumerate all new events of disease in the study cohort. In most studies of TMD, a follow-up interval of at least 2 years is required. The incidence rate is then calculated to represent the probability of developing disease during a specified time period. To make valid estimates of incidence, it is important to use valid and reliable methods to classify TMD. Furthermore, given that symptoms can come and go within a few months, it is important that study participants be re-assessed at sufficiently short intervals to enumerate all new events of TMD.
TMD Incidence in the OPPERA Study
In the OPPERA prospective cohort study, facial pain symptoms were assessed by questionnaire, once every quarter (3-month period) among 2,719 adults aged 18–44 years who had no history of a TMD when enrolled. During the median 2.3-year follow-up period, one-third of the cohort members developed ≥1 symptom episodes (i.e., facial pain for ≥5 days per month for ≥1 months during a 3-month reporting period).15 This represented an initial symptom episodes rate of 18.8 percent per annum. For those who developed one such episode, the rate of recurrence doubled, and it doubled again in follow-up of those with recurrent symptoms. For one-quarter of episodes, the symptom severity was rated as 7 or higher using a 0-to-10 rating scale, which is consistent with “severe” clinical pain.16
A large majority of symptom episodes were subclinical, in that subsequent examinations found that most episodes did not meet the criteria for clinical TMDs, as determined using the RDC/TMD protocol.17 As a consequence, the annual incidence rate of clinically classified TMDs was 3.9 percent per annum,18 which is one-fifth of the rate of symptom onset. This discrepancy in rates is one reason that the impact of TMD in the community at large represents a “symptom iceberg,”19 a term referring to symptoms that are not managed by health care professionals.
Stated another way, the 3.9 percent per annum rate of examiner-classified TMDs means that for every 100 TMD-free people enrolled, nearly four individuals per year developed the condition. The incidence was greater in older age groups, but it did not vary significantly by gender (see Table C-5). However, there was a two-fold difference in incidence between
TABLE C-5 First-Onset Temporomandibular Disorder (TMD) Incidence, OPPERA 2006–2011
| Group | Annual Incidence Rate of TMD | |
|---|---|---|
| Rate | 95% CL | |
| All | 3.9 | 3.5, 4.3 |
| Age at enrollment | ||
| 18–24 years | 2.6 | 3.3, 2.0 |
| 25–34 years | 3.6 | 4.7, 2.8 |
| 35–44 years | 3.9 | 5.1, 2.9 |
| Gender | ||
| Male | 2.6 | 3.3, 2.0 |
| Female | 3.4 | 4.2, 2.7 |
| Race/ethnicity | ||
| White | 2.6 | 3.3, 2.0 |
| Black | 3.4 | 4.5, 2.6 |
| Asian | 1.6 | 3.1, 0.9 |
| Hispanic | 3.0 | 5.1, 1.8 |
| Other | 2.5 | 4.7, 1.4 |
SOURCE: OPPERA prospective cohort study, 2006–2011.18
African Americans and Asians. Incident cases rated their average pain unpleasantness as “slightly annoying” and pain intensity as “very mild” or “mild” using verbal descriptor scales.20
From the original group of 260 people with a first-onset TMD, 147 were re-examined 6 months later, and 49 percent of them (n=72) had a TMD.20 In other words, about half of people who developed a first-onset TMD had a persistent TMD when re-examined, while the remainder had undergone remission of their TMD.
Persistence was more likely in the younger age groups, in females, and in whites (see Table C-6). Although not reported in Table C-6, several other characteristics were also predictive of persistence, including clinical pain and the extent of limitation in jaw opening. A simple checklist of general health conditions was also a strong predictor, although examiner-assessed joint sounds, jaw function or parafunction, and depression were not.21
Seven years later, 45 of the 147 subjects with a first-onset TMD were again re-examined to classify their clinical TMD status.22 Overall, 53 percent (24/45) were again found to have a clinical TMD (see Table C-7), representing a rate of persistence that was similar to that observed at
TABLE C-6 Persistence of Temporomandibular Disorders (TMDs) 6 Months After Development of First-Onset TMD, OPPERA 2006–2013
| Group | % Developing Persistent TMDs |
|---|---|
| All incident TMD cases | 49.0% |
| Age | |
| 18−24 years | 53.7% |
| 25−34 years | 55.6% |
| 35−44 years | 37.5% |
| Gender | |
| Male | 40.7% |
| Female | 53.8% |
| Race/ethnicity | |
| White | 61.4% |
| African American | 35.5% |
| Other | 46.7% |
NOTE: n=147 people with a first-onset TMD who were re-examined 6 months later in the OPPERA prospective cohort study, 2006–2013.21
TABLE C-7 Clinical Temporomandibular Disorder (TMD) Status 6 Months and 7 Years After Development of First-Onset TMD, OPPERA 2006–2016
| 6-Month Follow-Up Examination Status | Number of Study Participants: 7-Year Follow-Up Examination Status | ||
|---|---|---|---|
| Non-TMD | TMD | All Subjects | |
| Non-TMD | 14 | 5 | 19 |
| TMD | 7 | 19 | 26 |
| All subjects | 21 | 24 | 45 |
NOTE: n=45 people with a first-onset TMD who were re-examined 6 months and 7 years after onset in the OPPERA prospective cohort study, 2006–2016.22
the 6-month follow-up examination. However, that overall rate disguises the fact that 27 percent (7/23) of the subjects with persistent TMD at the 6-month follow-up were TMD free at the 7-year follow-up. Conversely, it disguises the fact that 26 percent (5/19) of subjects whose TMD condition had remitted at the 6-month follow-up were found to have a TMD at the 7-year follow-up.
Notwithstanding the imprecision inherent in these percentages based on a small cohort of 45 people, the results suggest that, for a sizable minority of people, fluctuation and remission of clinical TMD status occur for months or years after a TMD first develops. By implication, fluctuation and remission continue through life, such that prevalence in any single cross-sectional survey is a function of an individual’s history of TMD onset, remission, and persistence.
Other Studies of TMD Incidence
Prior to the OPPERA study, investigators at the North Carolina study site conducted a 3-year prospective cohort study of women aged 18–34 years at the time of enrollment.23 At enrollment, examiners verified that study participants did not have a TMD, and during the follow-up symptoms were monitored using quarterly questionnaires. Symptomatic subjects were re-examined to determine incidence of examiner-classified TMDs, which yielded an annual incidence rate of 3.5 percent.
In a prospective cohort study of 11-year-olds who were enrollees of the Group Health Cooperative in Washington State, 6.8 percent developed examiner-verified TMDs during the 3-year follow-up period (i.e., an annualized incidence rate of 2.3 percent).24 Study participants were monitored during the follow-up period using quarterly (3-monthly) questionnaires to screen for new symptoms of TMDs, similar to the methodology used in the OPPERA study. The incidence rate in adolescents was nearly twice as high in female as males, and it was greater in whites than in other racial groups. Among the strongest predictors of elevated incidence was the presence of other pain conditions at baseline (i.e., headache, back pain, and stomach pain).
Adult enrollees in the same health maintenance organization who were first enrolled in 1986 were also followed prospectively and re-interviewed after 3 years.25 However, there were no questionnaires administered during the intervening period within the 3 years of follow-up. Among subjects who had no history of a TMD when enrolled, 6.5 percent reported orofacial pain symptoms 3 years later. Although the rate did not differ to a statistically significant degree, it was inversely associated with age, and it was 7.7 percent in females compared to 4.8 percent in males.
PAIN IMPACT AND PAIN BURDEN ON PEOPLE WITH TMDs
Characteristics of Orofacial Pain and Responses to Orofacial Pain Symptoms in the U.S. Population—NHIS 1989
The 1989 NHIS included supplementary questions about orofacial pain that provide more detail about the impact of TMDs than subsequent NHIS
surveys. As noted above, the 1989 NHIS also differed from subsequent surveys in its use of a 6-month reference period to inquire about orofacial pain symptoms. In the adult population overall, prevalence was 6.0 percent and, as seen in other NHIS surveys, prevalence varied almost two-fold according to gender (7.7 percent in females; 4.1 percent in males).
For people who reported orofacial pain, the supplementary questions asked about characteristics of orofacial pain and behavioral response to the pain (see Table C-8). The most common pattern of occurrence was symptoms that “come and go,” and about two-thirds of people with symptoms had experienced them for 10 days or fewer within the preceding 6 months. However, a little more than half said that the symptoms occurred in at least 3 of the preceding 6 months. Those with pain were also asked to rate their pain based on this question: “On a scale of 1 to 10, where 1 is mild and 10 is severe, how would you rate this pain at its worst?” One-third of people with orofacial pain rated the severity as 7 or more (see Table C-8), a threshold found to be consistent with “severe” pain in studies that use the more conventional 0–10 rating scale.16
The most commonly reported behavioral response to orofacial pain symptoms was use of over-the-counter medication (50.7 percent) and/or prescription medication (22.9 percent). Social impacts were reported by fewer than 10 percent, and included staying at home more than usual (8.3 percent), avoiding family or friends (6.3 percent), and taking time off work (4.8 percent). Conversely, nearly one-quarter of subjects reported none of the behavioral responses listed in Table C-8. Meanwhile, nearly half of people with orofacial pain symptoms reported having seen a health care provider for those symptoms during the preceding 12 months. Dentists were somewhat more likely to be consulted (32.8 percent) then medical doctors (23.8 percent). (Note that, unlike subsequent NHIS surveys, the supplementary questions in the 1989 survey asked about visits to health care providers that were made specifically because of orofacial pain.)
Chronic TMD and High-Impact Chronic TMD (NHIS 1989)
The National Pain Strategy defines chronic pain as “pain that occurs on at least half the days for six months or more” and high-impact chronic pain as chronic pain that is “associated with substantial restriction of participation in work, social, and self-care activities for six months or more.”26 Data in Table C-8 provide some insight into duration and impact of TMD pain symptoms in the U.S. population. Specifically, 7.5 percent of people with orofacial pain symptoms reported pain for every day in the preceding 6 months, and a further 9.4 percent reported pain for at least 46 days (i.e., one-quarter of the days during the 6-month reference period). If the
TABLE C-8 Pain Characteristics and Response to Pain Among Adults Reporting Orofacial Pain Symptoms,* NHIS 1989
| Pain Characteristic | % of TMD Cases |
|---|---|
| Occurrence of TMD pain symptoms | |
| Come and go | 75.6 |
| Continuous/uninterrupted | 23.2 |
| Other | 1.1 |
| TMD pain: # days in past 6 months | |
| 1–3 days | 29.2 |
| 4–10 days | 32.2 |
| 11–45 days | 21.7 |
| ≥46 days but less than every day | 9.4 |
| Every day | 7.5 |
| Orofacial pain symptoms: # months in past 6 months | |
| 1–2 months | 46.3 |
| 3–4 months | 19.2 |
| 5–6 months | 34.6 |
| Rating of TMD pain symptoms (1–10 scale) | |
| 1–3 | 27.8 |
| 4–6 | 36.2 |
| 7–10 | 36.0 |
| Behavioral Responses to Facial Pain† | |
| Take over-the-counter medication | 50.7 |
| Take prescription medication(s) | 22.9 |
| Use a hot or cold compress | 17.0 |
| Stay at home more than usual | 8.3 |
| Avoid family or friends | 6.3 |
| Drink some liquor | 5.4 |
| Take time off work | 4.8 |
| Anything else | 13.8 |
| None of the above | 22.7 |
| Health care providers seen for TMD pain† | |
| Any health care provider | 48.4 |
| Dentist | 32.8 |
| Medical doctor | 23.8 |
| Other health care provider | 6.3 |
*Jaw or face pain that lasted ≥1 day in the 6 months preceding the NHIS interview. From the authors’ analysis of data from n=42,370 participants, 2,598 of whom were TMD cases (unweighted frequency counts).
†Categories are not mutually exclusive, and hence percentages sum to more than 100.
two criteria are combined to define chronic TMD pain as face or jaw pain symptoms experienced for at least one-quarter of the days in the preceding 6 months, prevalence of chronic TMD in the U.S. adult population in 1989 was 1.0 percent (95% CL=0.8, 1.1). Furthermore, if high-impact TMDs are classified as one or more of the three behavioral impacts due to TMDs reported in Table C-8 (i.e., staying at home more than usual, avoiding family or friends, or taking time off work), prevalence of high-impact chronic TMDs in 1989 was 0.2 percent (95% CL=0.1, 0.2).
Prevalence of Chronic Pain and High-Impact Pain from Any Anatomical Location in TMD Cases and Controls (NHIS 2016)
The NHIS 2016 survey provided the first opportunity to estimate the prevalence of chronic pain and high-impact chronic pain as defined by the National Pain Strategy.26 (Note that the NHIS asked about the duration and impact of pain experienced at any and all anatomical locations—it did not inquire about duration and impact of pain symptoms at specific locations, such as the face and jaw.) The National Pain Strategy’s definitions were operationalized by Dahlhamer et al.27 in their analysis of the 2016 NHIS survey. Specifically, they defined chronic pain from any and all anatomical locations as pain “that occurred on most days or every day in the past 6 months.” High-impact chronic pain was defined as chronic pain that furthermore “limited life or work activities on most days or every day during the past 6 months.” Applying those definitions to adults in the U.S. population, they found that the prevalence of chronic pain from any location was 20.4 percent, while the prevalence of high-impact chronic pain from any location was 8.0 percent.
The same 2016 NHIS data were analyzed for this report, focusing on the relationship between orofacial pain symptoms and chronic pain or high-impact chronic pain from any anatomical location. The prevalence of chronic pain at any anatomical location was elevated nearly three-fold in people with orofacial pain symptoms (52.7 percent) compared with people who did not have orofacial pain symptoms (18.8 percent) (see Table C-9). The prevalence of high-impact chronic pain was elevated nearly four-fold (26.9 percent versus 7.0 percent).
High-Impact TMD Pain and Effects of Pain on Quality of Life: OPPERA Study
Three decades ago, in what can be viewed as an early precedent of the National Pain Strategy’s focus on high-impact chronic pain, Von Korff et al. created the graded chronic pain scale (GCPS).28 It is a seven-item questionnaire that asks about pain intensity, pain interference in everyday activities,
TABLE C-9 Association of Orofacial Pain Symptoms with Any Chronic Pain and Any High-Impact Chronic Pain, NHIS 2016
| All Adults | Orofacial Pain Symptoms Reported† | ||
|---|---|---|---|
| No | Yes | ||
| Prevalence of any* chronic pain (%, 95% CL) | 20.4 (19.6, 21.1) | 18.8 (18.1, 19.5) | 52.7 (49.4, 55.9) |
| Prevalence of any* high-impact chronic pain (%, 95% CL) | 8.0 (7.6, 8.4) | 7.0 (6.7, 7.4) | 26.9 (24.2, 29.6) |
NOTE: From the authors’ analysis of NHIS 2016 (n=42,370 adult participants).
*Chronic pain or chronic high-impact pain regardless of anatomical location(s) as per Dahlhamer et al., 2018.27
†Jaw or face pain that lasted ≥1 day in the 3 months preceding the NHIS interview.
and the number of days in which pain had restricted work, school, or usual activities.
When applied to TMDs, the GCPS is used to define high-impact TMD pain based on two criteria:29
- A score of at least 50 on a pain intensity scale ranging from 0 for no pain to 100 for worst pain imaginable; and
- A score of at least 30 on a pain interference scale ranging from 0 for no interference to 100 for people who are unable to carry on doing any activities due to pain.
Among people with chronic TMDs who were enrolled as cases in the OPPERA case-control study, one-third had high-impact pain based on that definition (see Table C-10). Prevalence increased with age, although it did not vary by gender. The prevalence of high-impact pain in African Americans was twice that of whites.
Further insight into high-impact pain was gained in the 7-year followup of OPPERA study participants. In addition to a TMD examination, study participants were classified according to the presence or absence of four other idiopathic pain conditions (IPCs): headache, irritable bowel syndrome (IBS), low back pain, and fibromyalgia. Furthermore, the GCPS was modified by asking people with an index pain condition to rate intensity, interference, and days of activity restriction attributable specifically to that condition. People who were classified with more than one index pain condition were therefore asked about the impact attributable separately to each condition. Table C-11 presents mean values for component scales of
TABLE C-10 High-Impact Pain Among OPPERA Enrollees with Chronic TMD
| % with High-Impact TMD Pain | ||
|---|---|---|
| All TMD Cases | 33.5% | |
| Age (years) | 18−24 | 27.1% |
| 25−34 | 32.8% | |
| 35−44 | 43.2% | |
| Gender | Male | 35.1% |
| Female | 33.0% | |
| Race/ethnicity | White | 29.0% |
| Black/African American | 59.2% | |
| Asian | 23.7% | |
| Hispanic | 32.1% | |
| Other | 35.7% | |
NOTES: High-impact pain from orofacial pain symptoms was classified as grades 2b, 3, or 4 using the graded chronic pain scale.29 Data from n=846 OPPERA study participants with examiner-verified chronic TMD (i.e., TMD pain symptoms lasting ≥6 months) when enrolled in the OPPERA study.
SOURCE: Miller et al., 2019.30
the GCPS, along with the percentage of subjects with high-impact pain due to the index condition.
Overall, the pattern of impact attributed to TMD pain was similar to the impact attributed to headache: the mean pain intensity was almost 50, whereas the mean scores for interference were approximately 30, and there were fewer than 10 days kept from usual activity. The consequence was that about one-third of TMD cases had high-impact pain due to TMD pain, and one-third of headache cases had high-impact pain due to headache. Mean component scores were higher for both low back pain and for fibromyalgia, and more than half of subjects with each of those conditions had high-impact pain from the condition. In contrast, IBS had generally lower scale scores, and one in eight had high-impact pain due to IBS pain.
Overlap of TMDs with Other Pain Conditions
In people with examiner-classified TMDs at the follow-up examination, fewer than one-quarter had a TMD alone, as shown in the cut-out slice of the pie chart in Figure C-2. One-third had one other condition, one-quarter had two, 12 percent had three, and 5 percent had all four other conditions. For most of the 78 percent of TMD cases that had one or more other IPCs, the
TABLE C-11 Impacts of Pain Attributed to Five Idiopathic Pain Conditions: OPPERA-2 7-Year Follow-Up Study
| Index Pain Condition* (weighted number of cases with condition) | ||||||||||
|---|---|---|---|---|---|---|---|---|---|---|
| TMD (n=107) |
Headache (n=201) |
IBS (n=134) |
LBP (n=99) |
Fibromyalgia (n=24) |
||||||
| Impact Attributed to Index IPC | Mean | (s.e.) | Mean | (s.e.) | Mean | (s.e.) | Mean | (s.e.) | Mean | (s.e.) |
| Pain intensity (0–100 scale) | 45.8 | (1.4) | 46.4 | (1.1) | 32.2 | (1.2) | 52.0 | (1.6) | 58.1 | (2.0) |
| Pain interference (0–100 scale) | 27.6 | (1.9) | 32.9 | (1.6) | 18.8 | (2.0) | 49.0 | (2.3) | 38.0 | (3.8) |
| Number of days kept from usual activities due to pain in past 3 months | 8.8 | (1.6) | 4.1 | (0.6) | 4.4 | (1.1) | 20.5 | (2.6) | 12.5 | (3.2) |
| % with high-impact pain | 32.5 | (3.5) | 34.9 | (2.9) | 13.5 | (2.7) | 57.8 | (4.2) | 56.0 | (6.9) |
NOTES: Unpublished results from 384 subjects with one or more of five index pain conditions classified in the OPPERA-2 7-year follow-up study. IBS = irritable bowel syndrome; LBP = low back pain; TMD = temporomandibular disorder myalgia or arthralgia.
*Index pain conditions are not mutually exclusive.
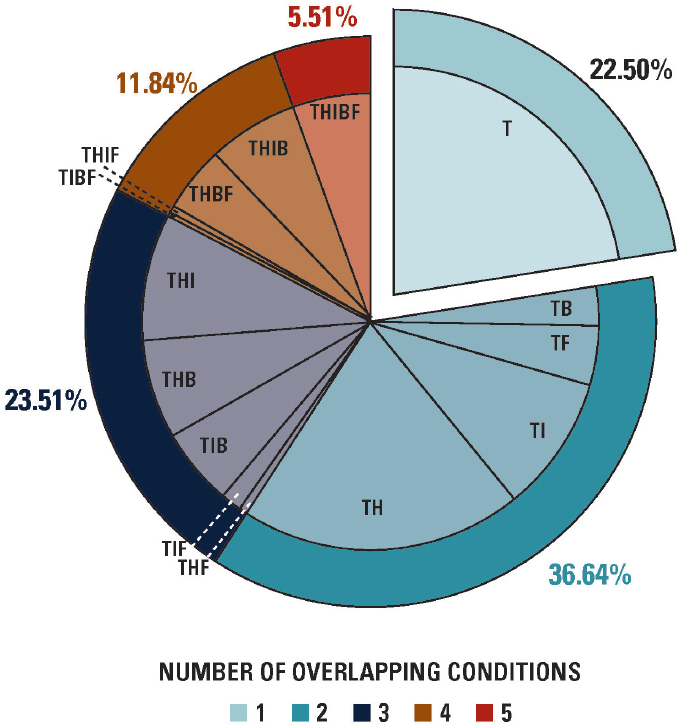
NOTES: Unpublished results from n=182 subjects (weighted n=107) with examiner-classified TMD in the OPPERA-2 7-year follow-up study. The five pain conditions are B = low back pain; F = fibromyalgia; H = headache; I = irritable bowel syndrome; and T = TMD.
extent of overlap was limited to one or two other IPCs. The permutations of overlapping IPCs tended be dominated by headache (see Figure C-2).
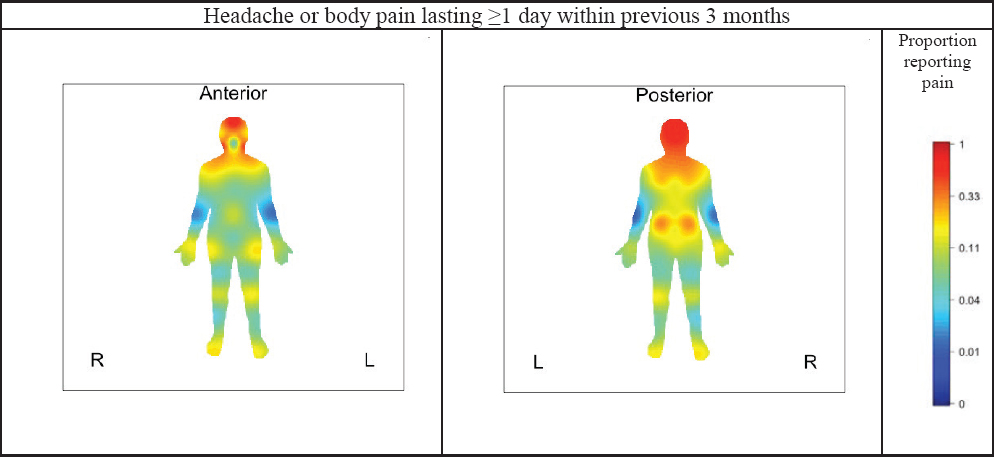
Subjects with TMDs in the 7-year OPPERA follow-up study were also asked about pain at other locations that lasted for ≥1 day within the previous 3 months. The location of such pain was recorded on a body mannequin image. High proportions of people with TMD reported pain in the neck and shoulders extending to the upper back, as shown in the red-shaded areas of Figure C-3. The hips, knees, feet, and wrists were endorsed
SOURCE: Unpublished results from n=182 subjects (weighted n=107) with examiner-classified TMDs in the OPPERA-2 7-year follow-up study.
by around 20 percent. This represents another type of symptom iceberg, in which people with TMDs often experience pain elsewhere in their body.
Summary: High-Impact Pain in People with TMD
Despite differences in study years, data sources, and the criteria used to define impact, there is a consistent message from these results from the NHIS and OPPERA:
- In the U.S. adult population in 1989, approximately 17 percent of people with orofacial pain symptoms reported having experienced the symptoms for more than 45 days in the preceding 6 months (i.e., at least one-quarter of days) (see Table C-8).
- Using that threshold to define chronic pain, the corresponding prevalence of chronic TMDs in the U.S. adult population is approximately 1 percent.
- Meanwhile, using the higher threshold of at least one-half of the days in the preceding 6 months to define chronic pain as per the National Pain Strategy, the prevalence of chronic pain from any anatomical location was 20 percent in 2016.27
- Of note, the prevalence of chronic pain, regardless of its anatomical location, was elevated nearly threefold, to 53 percent, among people with orofacial pain symptoms (see Table C-9).
- At first appearance, it might appear paradoxical that only 17 percent of TMD cases have chronic TMDs, whereas 53 percent of them have chronic pain.
- Specifically, people with TMDs are more likely than not to have chronic pain from any anatomical location, despite the fact that a minority (17 percent) experience chronic orofacial pain symptoms.
- The explanation lies in the considerable degree of overlap between TMDs and other commonly occurring chronic pain conditions (see Figures C-2 and C-3).
These observations are also salient when considering high-impact pain: in the U.S. population, one-quarter of people with TMDs experience high-impact chronic pain regardless of its anatomical location (see Table C-9). Yet, using a less stringent threshold to define impact, one-third of OPPERA study participants report high-impact pain. The explanation lies in the fact that only a minority of people with TMD experience symptoms during a sufficient number of days to qualify as chronic pain, based on the National Pain Strategy’s threshold.26 Nonetheless, when the impact is classified using the graded chronic pain scale, TMD pain causes levels of pain intensity, interference, and restriction that mimic the impact of headache.
HEALTH CARE COSTS, OTHER DIRECT COSTS, AND INDIRECT COSTS OF TMD IN THE DEEP STUDY
Overview of Study Design
The DEEP study was a prospective cohort and cost analysis study examining the direct, indirect, and out-of-pocket costs of those living with persistent orofacial pain across the northeast of England. Persistent orofacial pain was defined as pain lasting ≥3 months31 arising from a musculoskeletal, neuropathic, or neurovascular origin. The origin of the pain was identified using validated screening instruments32,33 and if odontogenic pain was identified, individuals were excluded from participating.
No changes to individuals’ care pathways were made, and they progressed within existing structures in both community (“primary”) care and hospital specialist–based (“secondary”) care within a state-funded health care system: the National Health Service (NHS) in the United Kingdom. Within the NHS individuals do not pay for any medical or surgical treatment, but, depending on their income, they may pay some of the costs for dental care and a standardized cost per prescription-only medicine (£8.80 per item of prescription-only medication in 2018). Individuals are also free to seek, without prejudice, private health care of any form outside of the NHS.
Individuals completed up to seven instruments every 6 months for a 24-month period, including a further census at 14 months to examine their time and travel costs related to health care. The instruments used were EQ-5D-5L for generic quality of life,34 GCPS,28 West Haven–Yale Multidimensional Pain Inventory (WHYMPI, version 335), Patient Health Questionnaire-4 (PHQ-436), Use of Services and Productivity Questionnaire,37 and Illness Perceptions Questionnaire–Revised Form.38 Descriptions of the instruments’ scoring and interpretation are freely available in the appendix to one of the published papers from the study.2 The T&T census included a validated measure of how the patients’ pain affected the quality and quantity of work they could complete while at their place of employment (“QQ method”39).
A priori, a sample size of 200 patients was determined to be the correct size to detect with 80 percent power, a moderate effect size of 0.4 between two groups;40 as it was envisaged there may be differences between primary and secondary care. This sample size also allowed for up to up to 30 predictors of costs with regression analyses,41 with the a priori predictor of interest being GCPS status as determined by the Graded Chronic Pain Scale due to its proven prognostic validity and ability to predict treatment need.29,42,43 GCPS provides an ordinal outcome of 0, I, IIa, IIb, III, IV. This range of ordinal outcomes begins at 0 (no pain-related disability), with IV (high pain-related disability) being the maximum. Grades IIb–IV have been
shown to have substantially more risk of chronification29,42,43 and therefore it is possible to collapse the five ordinal outcomes to “low” GCPS (0–IIa) and “high” GCPS (IIb–IV), which have been shown to predict treatment need and prognosis.29
The data provided in this report are a secondary analysis of those only screening positive for musculoskeletal/TMD diagnoses. Some analyses such as regression are therefore not possible because of the decrease in sample size. Unit costs, their sources, and their use are described in full in Durham et al.2 and Breckons et al.44 In brief the unit costs were determined and then multiplied against appropriate health care usage data from the U.S. Patients Quarterly or the data from the T&T census for, respectively, direct or indirect and out-of-pocket costs. Deterministic sensitivity analyses were conducted on variables whenever uncertainty existed concerning the unit cost. Costs collected over the 24-month study period were in 2012 prices (the year the study started) and adjusted using the Consumer Price Index for inflation (CPI; Breckons et al. gives a description of the method used44). The final costs were then all converted to the latest price year with the most recent CPI figure available and are therefore presented in 2018 pounds sterling throughout the report (average UK exchange rate for 2018: UK £1.00 = US $1.33).
Sample Characteristics—DEEP Study
Of the 279 individuals screened to enter the DEEP study, 268 met the inclusion criteria and 239 agreed to participate, with 198 returning data at M0. There were no significant differences in age, gender, or origin of pain between those who agreed to participate and those who did not. There was sequential dropout over the study at M0, M6, M12, M18, and M24, but significant differences in age, gender, ethnicity, duration of pain, and origin of pain were only identified between those remaining and those dropping out at M0, when a significantly younger cohort dropped out (p<0.01); at M12, when those with a significantly longer duration of pain were more likely to drop out (p<0.05); and at M18 and M24, when significantly more white British dropped out (p<0.01).
For the data presented within this report, the sample at M0 (n=198) was limited to those screening positive for painful TMDs and a musculoskeletal origin for their pain using the screening instruments,32,33 whose sensitivity and specificity were demonstrated at 63 percent and 86 percent respectively.2 Any of those screening positive for neuropathic/vascular or a combined origin for their pain were removed from the sample used for analyses for this report. This left 87 individuals in the sample at M0. The sample’s socio-demographic characteristics are given in Table C-12.
TABLE C-12 Socio-Demographic Characteristics of DEEP Study Participants
| Time Point | |||||
|---|---|---|---|---|---|
| M0 (n=87) | M6 (n=78) | M12 (n=73) | M18 (n=64) | M24 (n=60) | |
| Females, n (%) | 69 (79.3) | 62 (79.5) | 57 (78.1) | 48 (75) | 45 (75) |
| Age, mean years (SD) | 52.7 (16.7) | 53.8 (16.1) | 55.6 (14.8) | 56.3 (14.3) | 56.9 (14.0) |
| Ethnic origin, n (%) | |||||
| White, British | 78 (89.7) | 70 (89.7) | 65 (89.0) | 57 (89.1) | 53 (88.3) |
| Black, black British, or African | 1 (1.2) | 1 (1.3) | 1 (1.4) | 1 (1.6) | 1 (1.7) |
| Not provided | 1 (1.2) | 1 (1.3) | 1 (1.4) | 1 (1.6) | 1 (1.7) |
| Missing data | 7 (8.1) | 6 (7.7) | 6 (8.2) | 5 (7.8) | 5 (8.3) |
| Highest educational level n (%) | |||||
| Post-graduate degree/diploma | 8 (9.2) | 8 (10.3) | 8 (11.0) | 8 (12.5) | 7 (11.7) |
| Undergraduate degree/diploma | 24 (27.6) | 21 (26.9) | 19 (26.0) | 17 (26.6) | 17 (28.3) |
| Vocational qualifications | 19 (21.8) | 17 (21.8) | 17 (23.3) | 13 (20.3) | 13 (21.7) |
| Secondary school/public exam | 18 (20.7) | 16 (20.5) | 13 (17.8) | 12 (18.8) | 10 (16.7) |
| No public examination | 13 (14.9) | 11 (14.1) | 11 (15.1) | 10 (15.6) | 10 (16.7) |
| Missing data | 5 (5.8) | 5 (6.4) | 5 (6.9) | 2 (3.1) | 3 (5.0) |
| Time Point | |||||
|---|---|---|---|---|---|
| M0 (n=87) | M6 (n=78) | M12 (n=73) | M18 (n=64) | M24 (n=60) | |
| Socioeconomic rank of postcode | |||||
| 9 and 10 (least deprived) | 14 (16.1) | 11 (14.1) | 8 (11.0) | 7 (10.9) | 7 (11.7) |
| 7 and 8 | 16 (18.4) | 12 (15.38) | 12 (16.4) | 12 (18.8) | 11 (18.3) |
| 5 and 6 | 13 (14.9) | 13 (16.7) | 13 (17.8) | 11 (17.2) | 9 (15.0) |
| 3 and 4 | 20 (23.0) | 20 (25.6) | 19 (26.0) | 16 (25) | 16 (26.7) |
| 1 and 2 (most deprived) | 22 (25.3) | 21 (26.9) | 20 (27.4) | 17 (26.6) | 17 (28.3) |
| Missing data | 2 (2.3) | 1 (1.3) | 1 (1.4) | 1 (1.6) | 0 |
| Employment % | |||||
| Groups 1–3c | 23 (26.4) | 21 (26.9) | 20 (27.4) | 18 (28.1) | 17 (11.7) |
| Groups 4–6c | 20 (23.0) | 18 (23.1) | 15 (20.6) | 15 (23.4) | 15 (25.0) |
| Groups 7–9c | 11 (12.6) | 10 (12.8) | 10 (13.7) | 8 (12.5) | 7 (11.7) |
| Unemployed | 7 (8.1) | 7 (9.0) | 7 9.6) | 4 (6.25) | 3 (5.0) |
| Retired | 21 (24.1) | 18 (23.1) | 18 (24.7) | 17 (26.6) | 16 (26.7) |
| Student | 3 (3.5) | 2 (2.56) | 1 (1.4) | 1 (1.6) | 1 (1.7) |
| Missing data | 2 (2.3) | 2 (2.56) | 2 (2.7) | 1 (1.6) | 1 (1.7) |
Psychosocial Measures of TMD Impact—DEEP Study
Summary data for psychosocial characteristics at each time point in the DEEP study are shown in Table C-13. Quality of life, as demonstrated by the utility values in Table C-13, was consistent across the time points. When the results were pooled across all five time points (347 complete observations), the mean utility value was 0.68 (95% CL=0.66, 0.71). Compared to other datasets from the same country, this impact on quality of life is similar to that exerted by diabetes (0.72), arthritis (0.64), depression (0.64), and myocardial infarction (0.64); greater than that of stroke (0.80); and lower than that of back pain (0.47).45
There was also a degree of consistency across time points in the multidimensional nature of the pain as measured by the WHYMPI (see Table C-13). When the data were pooled across time points (358 complete observations), the mean scores per domain were pain severity 39.4 (95% CL=37.4, 41.2); interference 36.8 (95% CL=34.9, 38.6); life control 61.9 (95% CL=59.8, 64.1); affective distress 46.2 (95% CL=44.3, 48.0); and support 49.8 (95% CL=47.0, 52.7).
Table C-14 displays these values against normative vales for low back pain, burning mouth syndrome, and fibromyalgia, and it can be seen that there is a comparable pain intensity, affective distress, and level of support for the patient between burning mouth syndrome and painful TMD. TMD appears to cause less loss of control in life circumstances but exerts higher levels of interference in daily activities than burning mouth syndrome. In comparison to the more generalized persistent pains of low back pain and fibromyalgia, TMDs seem to exert less impact across most domains with the exception of affective distress, where it would appear it causes more affective distress.
Direct Costs
Table C-15 presents the direct costs over time for the sample. There was no significant difference between total cost of care over the five time points (p=0.727). The major and significant driver of total cost for all five time points was consultation costs and, especially, specialist consultation costs. Within a consultation a number of things could occur, such as investigations being ordered (e.g., imaging); treatment being started (e.g., splint manufactured) or medication prescribed; and surgery being scheduled.
There was insufficient sample size between those in a low (n=61; 71%) and those in a high GCPS state (n=25; 29%) to perform a regression analysis examining the predictive capacity of GCPS on health care costs in a painful TMD. As demonstrated in Table C-15 by the wide confidence intervals for each state, data were skewed in the high GCPS state. There were transitions
TABLE C-13 Psychosocial Characteristics at Each Study Time Point, DEEP Study
| Characteristic | Time Point | ||||
|---|---|---|---|---|---|
| M0 (n=87) | M6 (n=78) | M12 (n=73) | M18 (n=64) | M24 (n=60) | |
| Graded chronic pain scale: n (%) | |||||
| 0 | 0 | 3 (3.9) | 2 (2.8) | 3 (4.7) | 3 (5) |
| 1 | 35 (40.7) | 30 (39.5) | 40 (55.6) | 31 (48.4) | 35 (58.3) |
| 2a | 26 (30.2) | 17 (22.4) | 17 (23.6) | 12 (18.8) | 6 (10) |
| Cumulative low GCPS | 61 (70.9) | 50 (65.8) | 59 (82) | 46 (71.9) | 44 (73.3) |
| 2b | 12 (14.0) | 13 (17.1) | 5 (6.9) | 7 (10.9) | 7 (11.7) |
| 3 | 10 (11.6) | 9 (11.8) | 3 (4.2) | 7 (10.9) | 8 (13.3) |
| 4 | 3 (3.5) | 4 (5.3) | 5 (6.9) | 4 (6.2) | 1 (1.7) |
| Cumulative high GCPS | 25 (29.1) | 26 (34.2) | 13 (18) | 18 (28) | 16 (26.7) |
| Incomplete data | 1 | 2 | 1 | 0 | 0 |
| WHYMPI (mean ± s.d.) | |||||
| Pain severity | 42.4 (±18.7) | 42.4 (±18.7) | 38.1 (±18.3) | 40 (±17.6) | 33.8 (±17.8) |
| Interference | 38.9 (±16.3) | 38.9 (±16.3) | 35.9 (±16.9) | 35.7 (±20.1) | 33.7 (±18.9) |
| Life control | 63.5 (±19.9) | 63.5 (±19.9) | 61.9 (±23) | 63.2 (±19.8) | 59.3 (±23.1) |
| Affective distress | 47 (±16.1) | 47 (±16.1) | 45.6 (±15.8) | 46.7 (±17.5) | 44.3 (±20.4) |
| Support | 53.2 (±26.7) | 53.2 (±26.7) | 47.9 (±26.6) | 49.1 (±29.3) | 44.2 (±28.3) |
| PHQ-4 score (mean ± s.d.) | 3.7 (±3.5) | N/A | 3.0 (±3.3) | N/A | 3.3 (±3.7) |
| EQ-5D-5L utility value (mean ± s.d.) | 0.68 (±0.23) | 0.68 (±0.23) | 0.70 (±0.23) | 0.68 (±0.22) | 0.68 (±0.22) |
TABLE C-14 TMD Pain Impact in the DEEP Cohort Compared with Studies of Other Persistent Pain Conditions
| Pain Condition Studied (mean, s.d. domain value) | ||||
|---|---|---|---|---|
| WHYMPI (mean ± s.d.) | DEEP Study TMD | Burning Mouth Syndrome46 | Low Back Pain47 | Fibromyalgia48 |
| Pain severity | 39.4 (19.4) | 40.8 (12.8) | 49.5 (10.7) | 41.5 (10.6) |
| Interference | 36.8 (17.8) | 26.9 (14.0) | 45.6 (12.1) | 40.1 (12.4) |
| Life control | 61.9 (21.1) | 52.2 (8.3) | 38.5 (14.6) | 31.3 (13.7) |
| Affective distress | 46.2 (17.4) | 43.9 (11.2) | 40.5 (12.3) | 34.6 (11.8) |
| Support | 49.8 (27.5) | 42.7 (13.9) | 44.4 (16.3) | 41.1 (14.5) |
between GCPS states over time that included patients’ pain-related disability improving (e.g., moved from a high GCPS to a low GCPS), staying the same, or worsening (e.g., moved from a low GCPS to a high GCPS) during the time period studied. Pooling the sample’s transitions across all time points (n=358 observations) gave the following probabilities for transitions over a 6-month period within the current care pathway: among subjects experiencing low-impact pain (GCPS 0–IIa), 94 percent continued to have low-impact pain after 6 months, while the remaining 6 percent developed high-impact pain. Conversely, among the subjects with a high-impact pain (GCPS IIb–IV), 58 percent continued to experience high-impact pain after 6 months, while the remaining 42 percent improved to a state of low-impact pain.
Out-of-Pocket and Indirect Costs
Out-of-Pocket Costs
Within a 6-month period, the cohort reported a mean of 8.3 (standard deviation [SD] 9.0) health care appointments. Table C-16 demonstrates their total out-of-pocket costs per person per 6-month period for these visits as well as treatment and assessment costs incurred due to TMDs (mean £334 [95% CL=290, 378]). The out-of-pocket costs did not differ significantly between time points (P<0.07).
Indirect Costs
At each of the time points, between 38 percent and 46 percent of DEEP study participants reported being employed. Those who were employed reported missing a mean of 0.8 (SD=2.8) days over a 6-month period due to their persistent orofacial pain (POFP). This absenteeism equated to an
TABLE C-15 Direct Costs (UK£) Over Five Time Points, DEEP Study
| Time Point | |||||
|---|---|---|---|---|---|
| M0 | M6 | M12 | M18 | M24 | |
| Mean consultation costs | |||||
| Primary medical care | 165 | 127 | 161 | 149 | 146 |
| Primary dental care | 18 | 17 | 15 | 14 | 20 |
| Physiotherapy | 51 | 53 | 27 | 21 | 51 |
| Secondary specialist care | 351 | 314 | 256 | 262 | 445 |
| Total consultation costs (a) | |||||
| Mean of cohort | 534 | 458 | 433 | 426 | 612 |
| Bootstrapped CI for cohort | 419; 661 | 253; 661 | 256; 608 | 238; 613 | 89; 1,133 |
| Mean low GCPS | 408 | 235 | 235 | 227 | 238 |
| Mean high GCPS | 865 | 992 | 956 | 932 | 1,556 |
| Mean medication costs* | |||||
| Simple analgesia | 1 | 2 | 3 | 3 | 4 |
| Opioids | 3 | 3 | 7 | 7 | 12 |
| Antidepressants | 7 | 9 | 13 | 7 | 4 |
| Antiepileptics | 10 | 40 | 53 | 63 | 85 |
| Migraine therapy | 1 | 0 | 1 | 1 | 0 |
| Topical therapy | 1 | 1 | 1 | 1 | 0 |
| Total medication costs (b) | |||||
| Mean of cohort | 24 | 55 | 76 | 82 | 106 |
| Bootstrapped CI for cohort | 10; 38 | 24; 86 | 37; 116 | 33; 132 | 49; 163 |
| Mean low GCPS | 15 | 24 | 28 | 42 | 55 |
| Mean high GCPS | 44 | 128 | 207 | 186 | 237 |
| Primary dental care | 96 | 75 | 72 | 76 | 36 |
| Total treatment costs (c) | |||||
| Mean of cohort | 98 | 75 | 72 | 76 | 40 |
| Bootstrapped CI for cohort | 73; 125 | 50; 103 | 43; 100 | 43; 111 | 12; 66 |
| Mean low GCPS | 96 | 70 | 69 | 58 | 28 |
| Mean high GCPS | 106 | 91 | 79 | 125 | 69 |
| Time Point | |||||
|---|---|---|---|---|---|
| M0 | M6 | M12 | M18 | M24 | |
| Overall mean total cost | |||||
| Mean of cohort | 656 | 588 | 580 | 584 | 758 |
| Bootstrapped CI for cohort | 531; 795 | 363; 813 | 382; 778 | 360; 809 | 239; 1,275 |
| Overall mean total cost | |||||
| Mean low GCPS | 519 | 329 | 330 | 362 | 321 |
| Bootstrapped CI | (404; 634) | (235; 523) | (269; 640) | (221; 730) | (181; 580) |
| Mean high GCPS | 1,015 | 1,015 | 1,015 | 1,015 | 1,015 |
| Bootstrapped CI | (711; 1,320) | (448; 1,616) | (421; 1,832) | (431; 1,290) | (7; 3,579) |
NOTES: Simple analgesia: paracetamol, NSAIDs. Antidepressants: tricyclic antidepressants, SSRI, SNRI. Migraine therapy: abortives and prophylactics (excluding antiepileptics). Summary of statistical tests for differences in costs at each time point: M0 a>b, a>c. p<0.001; M6 a>b, a>c. p<0.001; M12 a>b, a>c. p<0.001; M18 a>b, a>c. p<0.01; M24 a>c. p<0.05.
*No participants had any costs for anxiolytics or antipsychotics.
employer cost of £74 (95% CL=27, 121) per person per 6-month period (see Table C-17). Those employed reported attending work with pain for a mean of 35.5 (SD=42.6) days per 6-month period. The QQ method suggested a mean decrease over the 24 months of observations of 12.7 percent (SD=16.7) in the quantity, and 12.3 percent (SD=14.1) in the quality, of work completed while in pain. These reported losses were used to estimate mean employer costs of £905 (95% CL=584, 1225) per person per 6-month period due to presenteeism. The most commonly reported problems facing individuals while at work were “problems concentrating” (65 percent) due to TMD followed by “decision making” (50 percent). Costs did not differ significantly between time points (p<0.65).
Summary of Findings from the DEEP Study
As this report is a secondary analysis of a pre-existing dataset, the results must be viewed with caution as there could be a number of biases introduced from reducing the dataset down to TMD/musculoskeletal only. It should also be emphasized that although sensitivity and specificity were acceptable for the screening instruments used to determine the origin of the pain in the DEEP study, there was no formal examination of the participants by the study team. It is therefore possible that there are either some
TABLE C-16 Mean Out-of-Pocket Costs per 6-Month Period in the DEEP Study
| Cost | Costs (UK£ and 95% CL) at Each Time Point | |||||
|---|---|---|---|---|---|---|
| M0 | M6 | M12 | M18 | M24 | Pooled | |
| Treatment and assessment | 230 (142; 319) | 143 (81; 206) | 118 (78; 157) | 135 (36; 234) | 126 (69; 183) | 155 (120; 189) |
| Time and travel costs | 218 (179; 258) | 165 (125; 204) | 176 (125; 227) | 141 (97; 185) | 184 (116; 253) | 179 (157; 201) |
| Total cost to individual | 449 (347; 550) | 308 (227; 389) | 294 (214; 373) | 276 (161; 392) | 310 (194; 426) | 334 (290; 378) |
TABLE C-17 Mean Indirect Costs per 6-Month Period in the DEEP Study
| Costs at Each Time Point | ||||||
|---|---|---|---|---|---|---|
| M0 (n=38) | M6 (n=34) | M12 (n=33) | M18 (n=24) | M24 (n=23) | Pooled (95% CL) | |
| Days absent due to POFP (SD) | 1.1 (2.7) | 0.9 (2.6) | 0.4 (1.3) | 0.5 (1.6) | 1.1 (5.2) | 0.8 (2.8) |
| Absenteeism cost in 2018 UK£ | 101 | 86 | 24 | 47 | 114 | 74 (27; 121) |
| Days present with POFP (SD) | 46.1 (53.8) | 35.0 (41.4) | 33.9 (39.6) | 25.8 (32.2) | 30.9 (36.7) | 35.5 (42.6) |
| Presenteeism cost in 2018 UK£ | 573 | 1286 | 736 | 797 | 754 | 831 (519; 1,143) |
| Total Employer cost in 2018 UK£ | 674 | 1372 | 760 | 844 | 867 | 905 (584; 1,225) |
comorbidities in addition to the TMD/musculoskeletal origin and or some false positives within the cohort used for the report.
Having outlined the limitations of the dataset, it is important to note, however, that the distribution of the low and high GCPS at M0 mirrors that in first incidence TMD.17 Given this and the fact that there are no other prospectively collected paired qualitative and quantitative datasets2,44,49 like the DEEP study, it is reasonable to use this secondary analysis as a starting point to begin to understand the impact of the care pathway on those living with TMDs.
It is clear from both the quantitative data presented in this report and the qualitative data available freely elsewhere49 that the journey to seek appropriate diagnosis and care is long and costly in terms of the impact both on the individual and on his or her personal finances. This is mirrored in the health care usage costs and the economic costs. The personal impact on an individual’s quality of life is consistent over the search for diagnosis and care and is similar to other more “well-known” conditions such as arthritis and depression. The health care usage costs remain consistent over time and are all dominated by the cost of multiple consultations with different specialties or providers. Despite the level of intervention received within this dataset it seems as though the probability of improvement from high-impact pain is low (48 percent probability of moving from a high GCPS to a low GCPS state over a 6-month period).
Those living with TMDs differ from those with other persistent pain conditions in that they have an exceedingly low absenteeism rate, but as a consequence they experience an impact on the quality and quantity of work (12 percent decrease for each respectively) that they can provide for their employer. This results in a considerable “hidden” cost to the employer of between £584 and £1,225 in lost productivity per 6-month period they are at work with TMD. In comparison to findings about migraine in the United States and the European Union (EU),50,51 those with TMD missed less than half the number of days of work that those with migraine missed over a 6-month period: U.S. data—1.9 days for males, 4.2 days for females; EU data—5.8 days for males, 6.8 days for females. Those with TMD spent on average 35 days at work with pain in a 6-month period, compared with U.S. data on migraine that found that approximately 7.5 days were spent at work with migraine in a 6-month period.50 Due to differences between studies in the method for calculating presenteeism burden, it is difficult to compare directly the data in this report (12 percent loss in quantity and quality of work respectively) and the U.S. and EU data: 34 percent female and 42 percent male “average effectiveness at work” and 38 percent “total work productivity impairment” respectively.50,52,53
In summary, therefore, in this dataset from the DEEP study, TMDs exerted a substantial impact on the individual and economy through lost
productivity and on the health care system due to disorganized care pathways increasing the number of consultations required to achieve either diagnosis or care for the condition. Given that the data are from a national and linked health care service, which is free at the point of delivery, it is reasonable to assume that costs are not driven by profit. It may, however, be that in wholly privately delivered health care differences exist. Further research using representative datasets or cohorts within the United States will be required in order to fully understand the care pathways for TMDs.
REFERENCES
1. Slade GD, Ohrbach R, Greenspan JD, Fillingim RB, Bair E, Sanders AE, Dubner R, et al. Painful temporomandibular disorder: Decade of discovery from OPPERA studies. J Dent Res. 2016;95(10):1084-92. PMCID: PMC5004239.
2. Durham J, Shen J, Breckons M, Steele JG, Araujo-Soares V, Exley C, Vale L. Healthcare cost and impact of persistent orofacial pain: The DEEP study cohort. J Dent Res. 2016;95(10):1147-54.
3. CDC/National Center for Health Statistics. Variance Estimation Guidance, NHIS 2016-2017. 2018. https://www.cdc.gov/nchs/data/nhis/2016var.pdf cited November 19, 2019.
4. Case A, Deaton A. Rising morbidity and mortality in midlife among white non-Hispanic Americans in the 21st century. Proc Natl Acad Sci USA. 2015;112(49):15078-83. PMCID: PMC4679063.
5. MacMahon B, Pugh TF, Ipsen J. Epidemiologic methods. Boston: Little, Brown and Company; 1960.
6. Von Korff M, Dworkin SF, Le Resche L, Kruger A. An epidemiologic comparison of pain complaints. Pain. 1988;32(2):173-83.
7. Maixner W, Fillingim RB, Williams DA, Smith SB, Slade GD. Overlapping chronic pain conditions: Implications for diagnosis and classification. J Pain. 2016;17(9 Suppl):T93-T107. PMCID: PMC6193199.
8. LeResche L, Mancl LA, Drangsholt MT, Saunders K, Von Korff M. Relationship of pain and symptoms to pubertal development in adolescents. Pain. 2005;118(1-2):201-9.
9. Riley JL, 3rd, Gilbert GH, Heft MW. Orofacial pain symptom prevalence: Selective sex differences in the elderly? Pain. 1998;76(1-2):97-104.
10. Horst OV, Cunha-Cruz J, Zhou L, Manning W, Mancl L, DeRouen TA. Prevalence of pain in the orofacial regions in patients visiting general dentists in the Northwest Practice-based REsearch Collaborative in Evidence-based DENTistry research network. J Am Dent Assoc. 2015;146(10):721-83.
11. Sanders AE, Jain D, Sofer T, Kerr KF, Laurie CC, Shaffer JR, Marazita ML, et al. GWAS identifies new loci for painful temporomandibular disorder: Hispanic community health study/study of Latinos. J Dent Res. 2017;96(3):277-84. PMCID: PMC5298397.
12. Janal MN, Raphael KG, Nayak S, Klausner J. Prevalence of myofascial temporomandibular disorder in US community women. J Oral Rehabil. 2008;35(11):801-9.
13. Bair E, Brownstein NC, Ohrbach R, Greenspan JD, Dubner R, Fillingim RB, Maixner W, et al. Study protocol, sample characteristics, and loss to follow-up: The OPPERA prospective cohort study. J Pain. 2013;14(12 Suppl):T2-T19. PMCID: PMC3855654.
14. Bueno CH, Pereira DD, Pattussi MP, Grossi PK, Grossi ML. Gender differences in temporomandibular disorders in adult populational studies: A systematic review and meta-analysis. J Oral Rehabil. 2018;45(9):720-9.
15. Slade GD, Sanders AE, Bair E, Brownstein N, Dampier D, Knott C, Fillingim R, et al. Preclinical episodes of orofacial pain symptoms and their association with health care behaviors in the OPPERA prospective cohort study. Pain. 2013;154(5):750-60. PMCID: NIHMS445953.
16. Collins SL, Moore RA, McQuay HJ. The visual analogue pain intensity scale: What is moderate pain in millimetres? Pain. 1997;72(1-2):95-7.
17. Dworkin SF, LeResche L. Research diagnostic criteria for temporomandibular disorders: Review, criteria, examinations and specifications, critique. J Craniomandib Disord. 1992;6(4):301-55.
18. Slade G, Bair E, Greenspan J, Dubner R, Fillingim R, Diatchenko L, Maixner W, et al. Signs and symptoms of first-onset TMD and sociodemographic predictors of its development: The OPPERA prospective cohort study. J Pain. 2013;14(12 Suppl):T20-T32.
19. Hannay DR. The “iceberg” of illness and “trivial” consultations. J R Coll Gen Pract. 1980;30(218):551-4. PMCID: PMC2159711.
20. Gracely RH, McGrath F, Dubner R. Ratio scales of sensory and affective verbal pain descriptors. Pain. 1978;5(1):5-18.
21. Meloto CB, Slade GD, Lichtenwalter RN, Bair E, Rathnayaka N, Diatchenko L, Greenspan JD, et al. Clinical predictors of persistent temporomandibular disorder in people with first-onset temporomandibular disorder: A prospective case-control study. J Am Dent Assoc. 2019;150(7):572-81.
22. Fillingim RB, Slade GD, Greenspan JD, Dubner R, Maixner W, Bair E, Ohrbach R. Long-term changes in biopsychosocial characteristics related to temporomandibular disorder: Findings from the OPPERA study. Pain. 2018;159(11):2403-13. PMCID: PMC6193833.
23. Diatchenko L, Slade GD, Nackley AG, Bhalang K, Sigurdsson A, Belfer I, Goldman D, et al. Genetic basis for individual variations in pain perception and the development of a chronic pain condition. Hum Mol Genet. 2005;14(1):135-43.
24. LeResche L, Mancl LA, Drangsholt MT, Huang G, Von Korff M. Predictors of onset of facial pain and temporomandibular disorders in early adolescence. Pain. 2007;129(3):269-78. PMCID: 1979093.
25. Von Korff M, Le Resche L, Dworkin SF. First onset of common pain symptoms: A prospective study of depression as a risk factor. Pain. 1993;55(2):251-8.
26. Interagency Pain Research Coordinating Committee. National pain strategy: A comprehensive population health-level strategy for pain. In: U.S. Department of Health and Human Services NIoH, editor. Washington, DC; 2016.
27. Dahlhamer J, Lucas J, Zelaya C, Nahin R, Mackey S, DeBar L, Kerns R, et al. Prevalence of chronic pain and high-impact chronic pain among adults—United States, 2016. Morb Mortal Wkly Rep. 2018;67(36):1001-6. PMCID: PMC6146950.
28. Von Korff M, Ormel J, Keefe FJ, Dworkin SF. Grading the severity of chronic pain. Pain. 1992;50(2):133-49.
29. Dworkin SF, Huggins KH, Wilson L, Mancl L, Turner J, Massoth D, LeResche L, et al. A randomized clinical trial using research diagnostic criteria for temporomandibular disorders-axis II to target clinic cases for a tailored self-care TMD treatment program. J Orofac Pain. 2002;16(1):48-63.
30. Miller VE, Poole C, Golightly Y, Barrett D, Chen DG, Ohrbach R, Greenspan JD, et al. Characteristics associated with high-impact pain in people with temporomandibular disorder: A cross-sectional study. J Pain. 2019;20(3):288-300. PMCID: PMC6424335.
31. IASP. International Association for the Study of Pain - Pain Terminology 2007 cited October 30, 2007; February 22, 2007: Available from: http://www.iasp-pain.org/AM/Template.cfm?Section=Pain_Definitions&Template=/CM/HTMLDisplay.cfm&ContentID=1728#Pain.
32. Gonzalez Y, Schiffman E, Gordon S, Seago B, Truelove E, Slade G, Ohrbach R. Development of a brief and effective temporomandibular disorder pain screening questionnaire: Reliability and validity. J Am Dent Assoc. 2011;142(10):1183-91.
33. Hapak L, Gordon A, Locker D, Shandling M, Mock D, Tenenbaum H. Differentiation between musculoligamentous, dentoalveolar, and neurologically based craniofacial pain with a diagnostic questionnaire. J Orofac Pain. 1994;8(4):357-68.
34. Herdman M, Gudex C, Lloyd A, Janssen M, Kind P, Parkin D, Bonsel G, et al. Development and preliminary testing of the new five-level version of EQ-5D (EQ-5D-5L). Qual Life Res. 2011;20(10):1727-36.
35. Kerns R, Turk D, Rudy T. The West Haven-Yale Multidimensional Pain Inventory (WHYMPI). Pain. 1985;23(4):345-56.
36. Kroenke K, Spitzer R, Williams J, Lowe B. An ultra-brief screening scale for anxiety and depression: The PHQ-4. Psychosomatics. 2009;50(6):613-21.
37. Wordsworth S, Thompson S. An annotated cost questionnaire for patients: Results of piloting. HERU Dicussion Paper 2001;03/01.
38. Moss-Morris R, Weinman J, Petrie KJ, Horne R, Cameron LD, Buick D. The revised illness perception questionnaire (IPQ-R). Psychol Health. 2002;17(1):1-16.
39. Brouwer W, Koopmanschap M, Rutten F. Productivity losses without absence: Measurement validation and empirical evidence. Health Policy. 1999;48(1):13-27.
40. Cohen J. Statistical power analysis for the behavioral sciences (2nd ed.) New Jersey: Lawrence Erlbaum; 1988.
41. Green SB. How many subjects does it take to do a regression analysis. Multivariate Behav Res. 1991;26(3):499-510.
42. Epker J, Gatchel R, Ellis Er. A model for predicting chronic TMD: Practical application in clinical settings. J Am Dent Assoc. 1999;130(10):1470-5.
43. Garofalo JP, Gatchel RJ, Wesley AL, Ellis E, 3rd. Predicting chronicity in acute temporomandibular joint disorders using the research diagnostic criteria. J Am Dent Assoc. 1998;129(4):438-47. PMCID: 9573694.
44. Breckons M, Shen J, Bunga J, Vale L, Durham J. DEEP study: Indirect and out-of-pocket costs of persistent orofacial pain. J Dent Res. 2018;97(11):1200-6.
45. van Hout B, Janssen M, Feng Y, Kohlmann T, Busschbach J, Golicki D, Lloyd A, et al. Interim scoring for the EQ-5D-5L: Mapping the EQ-5D-5L to EQ-5D-3L value sets. Value Health. 2012;15(5):708-15.
46. Carlson C, Miller C, Reid K. Psychosocial profiles of patients with burning mouth syndrome. J Orofac Pain. 2000;14(1):59-64.
47. Bernstein I, Jaremko M, Hinkley B. On the utility of the West Haven-Yale Multidimensional Pain Inventory. Spine (Phila Pa 1976). 1995;20(8):956-63.
48. Turk D, Okifuji A, Sinclair J, Starz T. Pain, disability, and physical functioning in subgroups of patients with fibromyalgia. J Rheumatol. 1996;23(7):1255-62.
49. Breckons M, Bissett S, Exley C, Araujo-Soares V, Durham J. Care pathways in persistent orofacial pain: Qualitative evidence from the DEEP study. JDR Clin Trans Res. 2017;2(1):48-57.
50. Hu X, Markson L, Lipton R, Stewart W, Berger M. Burden of migraine in the United States: Disability and economic costs. Arch Intern Med. 1999;159(8):813-8.
51. Steiner T, Stovner L, Katsarava Z, Lainez J, Lampl C, Lantéri-Minet M, Rastenyte D, et al. The impact of headache in Europe: Principal results of the Eurolight project. J Headache Pain. 2014;15:31.
52. Stewart W, Lipton R, Simon D. Work-related disability: Results from the American migraine study. Cephalalgia. 1996;16(4):231-8; discussion 15.
53. Vo P, Fang J, Bilitou A, Laflamme A, Gupta S. Patients’ perspective on the burden of migraine in Europe: A cross-sectional analysis of survey data in France, Germany, Italy, Spain, and the United Kingdom. J Headache Pain. 2018;19(1):82.
___________________
Potential conflicts of interest: Robert Kerns reports receiving honoraria for serving as a member of a research grant review board for the American Pain Society and as senior editor for the journal Pain Medicine. Michael Von Korff reports receipt of grants from Pfizer Inc. as an investigator of use and misuse of opioids at Kaiser Permanente Washington Health Research Institute and from inVentive as co-investigator for Food and Drug Administration–mandated postmarketing surveillance studies of extended release opioids. No other conflicts of interest were reported.
This page intentionally left blank.


