
Proceedings of a Workshop
| IN BRIEF | |
|
January 2020 |
Informing the Selection of Leading Health Indicators for Healthy People 2030
Proceedings of a Workshop—in Brief
Experts from the health measurement and population health fields gathered on May 28, 2019, in Washington, DC, at a workshop organized by the National Academies of Sciences, Engineering, and Medicine for the Committee on Informing the Selection of Leading Health Indicators for Healthy People 2030 (hereafter, “the committee”). The workshop presentations and discussion aimed to help inform the committee’s task, which is to (1) advise on the criteria for selecting Healthy People 2030’s Leading Health Indicators (LHIs), and (2) to propose a slate of LHIs for the Healthy People Federal Interagency Workgroup (FIW) to consider in finalizing the Healthy People 2030 (HP2030) plan.1
Committee chair George Isham of HealthPartners Institute welcomed guests and attendees and described the committee’s process before introducing Don Wright, Deputy Assistant Secretary for Health, to give prefatory remarks. Wright described the history of the Healthy People program in the U.S. Department of Health and Human Services (HHS) as a decadal initiative to measure and track the nation’s disease prevention and health promotion efforts, and the purpose of the LHIs as distilling what is most important to the nation in the health domain.
Wright noted that the Healthy People LHIs are intended to be supported by available and quality data; describe the state of population health and galvanize efforts to improve it; and facilitate collaboration at all levels of government and across sectors. After giving an overview of the committee’s tasks and the HHS timeline for finalizing the HP2030 plan, Wright concluded by taking questions from the committee. Paula Lantz of the University of Michigan asked Wright about the key benefits of the Healthy People process. Wright pointed to Healthy People’s ability to facilitate shared priority setting and mobilization of resources among the many stakeholders invested in the nation’s health. Marthe Gold of The New York Academy of Medicine asked Wright about HHS’s efforts to engage non-traditional health sectors (e.g., transportation) in the HP2030 process.
Wright mentioned several efforts to involve other sectors of the federal government in the HP2030 process, in and beyond the work of the FIW. Isham asked Wright to address the apparent tension between long-standing Healthy People objectives emphasizing disease prevention and the newer emphasis on the upstream factors that influence health in HP2030’s framework. Wright explained Healthy People’s evolving emphasis on well-being in parallel to an increased appreciation in public health of the social determinants of health (SDOHs), and he stated that HHS plans to build on this thinking in HP2030 priorities over the coming year. Lastly, following a question by Gold about the origin of data sources used for HP2030, Wright confirmed that Healthy People relies on non-federal in addition to federal data.
___________
1 More information about the study Informing the Selection of Leading Health Indicators for Healthy People 2030, including the two consensus study reports, one released on August 6, 2019, and the other anticipated in early 2020, is available at http://nationalacademies.org/hmd/Activities/PublicHealth/LeadingHealthIndicatorsForHealthyPeople2030.aspx (accessed September 5, 2019).
![]()
The remainder of the meeting focused on four main sessions on the topics of:
- Perspectives on the purpose and use of the LHIs (or a small, high-level set of indicators for the nation more broadly) with consideration for both national and community needs;
- Data sources for objectives and the LHIs;
- Harmonizing with other national metrics sets; and
- Measuring health equity—insights for the LHIs
A moderator, each a member or chair of the Secretary’s Advisory Committee on National Health Promotion and Disease Prevention Objectives for 2030 (SAC)—which was established by the Secretary of HHS to provide advice on the HP2030 effort—provided remarks for context at the start of each session. Following each panel’s presentations, a moderated question and answer session followed. The structure of the workshop has been used to organize this Proceedings of a Workshop—in Brief.
PANEL 1: PERSPECTIVES ON THE PURPOSE AND USE OF LHIs
Therese Richmond from the University of Pennsylvania and chair of the SAC’s Subcommittee on LHIs, Subcommittee on Approaches, and Subcommittee on Objectives Review, opened the panel by reflecting on lessons gleaned from the previous decade’s effort, Healthy People 2020, and their significance to the HP2030 process. Richmond observed the mixed outcomes of Healthy People 2020 and its particular shortcomings in reaching stated goals for all population subgroups. Looking ahead, Richmond acknowledged both opportunities and key challenges inherent in the HP2030 framework’s emphases on well-being, eliminating—not merely reducing—health disparities, and targeting upstream SDOHs more robustly.2 Richmond reiterated a recommendation of the SAC that HP2030 objectives include 10 cross-cutting core objectives that explicitly target SDOHs and well-being and “directly address structural and systematic prejudices and discrimination through law, policy, and practices.”
Richmond then introduced Anita Chandra of RAND Corporation, who described her research to integrate the science of well-being with government operations and measurement efforts at both the local level (with the city government of Santa Monica, California) and the national level (with the Robert Wood Johnson Foundation’s Culture of Health Action Framework). In both cases, Chandra highlighted the usefulness of civic well-being frameworks to engage stakeholders in communities’ well-being efforts, as such frameworks point the way for needed changes and promote cross-sector solutions to make health a shared value. Chandra closed with several proposals for the HP2030 LHIs selection process, namely including measures of subjective well-being to broaden monitoring frameworks’ sensitivity; thinking beyond “clinical social factors” to identify and explicitly measure what drives health at a structural level; and insisting on community and civic measures of well-being to capture what policies and environments support thriving communities and people (see Box 1).
___________________
2 The HP2030 framework describes the initiative’s vision, mission, foundational principles, and overarching goals, and its development included a round of public comments responding to a draft version. See https://www.healthypeople.gov/2020/About-Healthy-People/Development-Healthy-People-2030/Framework (accessed September 9, 2019).
Next, Bobby Milstein of ReThink Health reminded the audience of the 1988 Institute of Medicine report that found that public health was in disarray, and he cautioned against perpetuating that organizational disarray by defining problems and addressing solutions in a fragmented and disconnected way. He offered five design principles to consider when crafting indicators based on a broad, multi-sector understanding of the system that produces health and well-being in regions across the United States. The principles are:
- Counter disarray in the system with a big picture view that shows broad patterns and relationships;
- Differentiate personal health and well-being from vital conditions (e.g., humane housing, lifelong learning) and urgent services (e.g., homeless services, unemployment and food services);
- Use data to tell a larger story (e.g., local successes despite worrying national trends);
- Inspire effort to fulfill widely-shared norms; and
- Celebrate success and confront unfinished work.
Milstein summarized a framework, already endorsed by the SAC for HP2030, featuring a portfolio of “urgent services” that anyone under adversity might need temporarily to regain their best possible health and well-being, as well as the “vital conditions” that all people depend on all of the time to reach their full potential (see Figure 1).
With this practical, systems-level framework, Milstein argued, it becomes considerably easier to select, monitor, and interpret indicators of overall system performance (e.g., self-rated health) in the context of major assets (e.g., high school graduation) and prevailing threats (e.g., household poverty), both of which affect demand and supply dynamics across the entire portfolio. Milstein added that this portfolio—and the indicators associated with it—provides a portrait of current investments that would help to anticipate the future trajectory of population health and well-being.
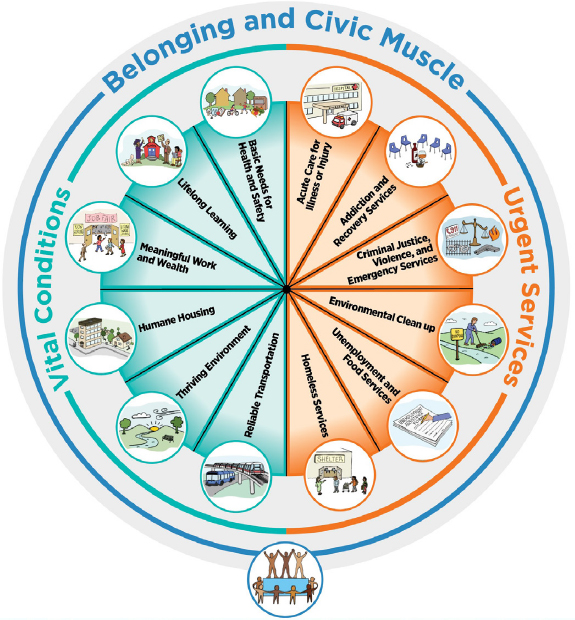
SOURCES: Presentation of B. Milstein on May 28, 2019, and ReThink Health, 2018 (https://www.rethinkhealth.org/wpcontent/uploads/2018/10/RTH-WellBeingPortfolio_InstructionsSummary_10222018.pdf accessed November 4, 2019).
Soma Saha (Stout) of the Institute for Healthcare Improvement and Carley Riley of the Cincinnati Children’s Hospital Medical Center, both also representing the 100 Million Healthier Lives initiative, presented the Well-being in the Nation (WIN) report (developed by a public–private partnership to inform the National Committee on Vital and Health Statistics). Saha and Riley shared the goal of and lessons learned from WIN’s health metrics design process. The process was intended to develop a measurement ecosystem (a parsimonious set of core measures and an expandable menu) through a Delphi process with 100 organizations. The resulting ecosystem includes “core measures with well-being of people, well-being of places, and equity” along with “a set of leading indicators with 12 domains and associated domains related to determinants of health with all upstream, midstream, and downstream considered.” The process also involved co-designing metrics with community stakeholders, (e.g., people with lived experience); harvesting and testing measures with communities during the process; and “road-testing” to ensure resonance and usefulness of a “living library” of measures. The core measures are organized by measures of the well-being of people, measures of the well-being of places, and measures of equity.
Saha and Riley underscored the need for a measurement system that can accommodate rapidly proliferating data streams, and equip action-ready stakeholders across multiple sectors with the data they need to act; working backward from key health outcomes with a conceptual model of change that can help decision makers identify upstream drivers of health and well-being, and the leading indicators needed to capture them. Saha and Riley suggested that in addition to implementing such leading indicators, monitoring frameworks could be strengthened by incorporating metrics that have not previously been included in national frameworks in the United States, such as Cantril’s Ladder (the Cantril Self-Anchoring Striving Scale). The Cantril scale asks the respondent to rank personal well-being on a ladder with rungs from 0 to 10, with 0 being “the worst possible life for you,” and 10 being “the best possible life for you,”3 to efficiently capture individuals’ objective and subjective well-being.
Following these presentations, Isham moderated a question and answer session with the panel. Jonathan Skinner of Dartmouth College asked Milstein how and why to practically measure and interpret the utilization of urgent services, as opposed to measuring other upstream drivers whose increase or decrease is more clearly desirable or not. Milstein replied that metrics ought to assess a health system’s popular basic services by tracking both access and utilization and the upstream factors that drive their demand. Longitudinal trends in utilization and a theoretical model including upstream factors can be used to interpret a change in urgent services utilization as good or bad. Next, Ebony Boulware of Duke University asked where the biggest concentrations and gaps of well-being data may be found. Chandra responded that most well-being data are local and that expanding national well-being datasets—particularly to include data on subjective life self-evaluation and civic involvement—is a key monitoring priority. Riley reminded that local uptake of well-being initiatives is nonetheless still vital, and that signaling engagement to community partners and disseminating data to them are critical components of national–local programming coordination. Darcy Phelan-Emrick of the Baltimore City Health Department followed up by asking about the extent to which Cantril’s Ladder is used in national health metrics instruments in the United States or abroad. Riley noted that Cantril’s Ladder has not been used formally in public U.S. surveys; however, it has been extensively validated by Gallup for use in the United States and has been integrated into other countries’ well-being metrics activities. Milstein and Richmond both endorsed the idea of U.S. measurement instruments adopting Cantril’s Ladder, which, Chandra added, is already used by the Organisation for Economic Co-operation and Development and as part of monitoring efforts in several states.
Sheri Johnson of the University of Wisconsin asked whether subjective well-being measures might inspire complacency if they exceed objective measures of well-being. Chandra acknowledged this possibility while highlighting it as a reason to measure surroundings and socio-environmental context as well as individual well-being. Saha also suggested such discrepancies ought to provoke more objective analysis; however, she asserted, and Riley and Milstein agreed, that such discrepancies may be a source of resiliency and even a normative good, rather than a mere discrepancy in data to be resolved. Next, Gold asked what constitutes an effective evidence base for the HP2030 objectives. Milstein mentioned practice-based knowledge about what it takes to assure the conditions people need to thrive, noting conventional intervention research has its inherent biases and limitations. Saha advised the committee to consider deviating from "tried-and-true" indicators when a new or non-health sector indicator might better inform HP2030 progress. Chandra emphasized that identifying effective evidence requires identifying and tracking the upstream drivers behind health indicators of interest. Lastly, Isham asked what opportunities exist to track disparities by non-geographical subgroups. Saha noted health care delivery systems could see intervention opportunities when stratifying by administrative factors like Medicaid enrollment. Riley suggested that differences in metrics among socio-demographic groups could become standalone metrics, while Chandra disagreed. She noted that the structural issues behind inequities such as chronic violence distinguish them
___________________
3 See, for example, https://news.gallup.com/poll/122453/understanding-gallup-uses-cantril-scale.aspx (accessed November 4, 2019).
from mere differences between two subgroups’ outcomes. Rather, measuring such disparities according to the upstream drivers that engender them is more accurate and effective than simply analyzing data by race/ethnicity, sex, and so forth alone. Riley agreed with Chandra’s comment and advocated for the inclusion of both outcome measures and upstream driver measures.
PANEL 2: DATA SOURCES FOR OBJECTIVES AND LHIS
Edward Sondik, former director of the National Center for Health Statistics (NCHS) and chair of the Data Subcommittee of the SAC moderated the meeting’s second panel, opening with introductory remarks on considerations of data to be used for LHIs in HP2030. Acknowledging HP2030’s challenge in integrating national, state, and local efforts, Sondik asked the committee to consider how data from these different levels relate to each other, and to consider how aggregated local data relate to national data. Sondik underscored that local processes are unique and often defined by practice and monitoring gaps. If data gaps are addressed with non-traditional data sources, strategic data partnerships could potentially help evaluate data quality, accommodate new data streams, and unleash the full potential of data, he added.
Following these remarks, Sondik introduced Ali Mokdad of the Institute for Health Metrics and Evaluation (IHME) at the University of Washington. Mokdad explained IHME’s role coordinating the Global Burden of Disease (GBD) effort, which is the work of an international consortium that measures “epidemiological levels and trends worldwide.”4 GBD reports several usual metrics, including mortality, prevalence, and incidence, as well as disability measures—what is killing and ailing a population. To support this work, IHME utilizes data from many sources while evaluating them for quality and moving away from subjective measures (e.g., Grading of Recommendations, Assessment, Development, and Evaluations, GRADE, or the World Cancer Research Fund criteria) to a transparent evidence score for association and rating by p-value. Mokdad shared how the GBD platform can be used for different use cases and clients across sectors, and also highlighted GBD’s hierarchy of mutually exclusive and exhaustive causes of disease and injury, which together describe the state of global health at a granular level. One example illustrated IHME’s capabilities and emphasis on tracking progress in nations’ health improvements through its Sustainable Development Goals (SDGs) and Healthcare Access and Quality (HAQ) indices. Notably, IHME offers both national and subnational HAQ profiles for all countries, highlighting the profound variation in health outcomes below the national level for some countries. Mokdad demonstrated IHME’s work to model key developments based on GBD data, including changes in disease expenditure for various health services, nations’ future health scenarios, leading causes of DALYs (disability-adjusted life years) over time and their relative change in prevalence, and life expectancy estimates at census-tract levels. In his closing remarks, Mokdad offered several key IHME findings about U.S. health outcomes, including the United States' poor outcomes—especially for women—compared to other high-income countries. Mokdad suggested the committee consider prioritizing metrics that are easily communicated and compatible with dynamic health scenarios, as these will illustrate where the country’s health is headed to a broad array of stakeholders. He called for tracking disparities in health and risk factors at the local level, as key disparities emerge and are addressed at that level.
Sondik next introduced Amy O’Hara of the Massive Data Institute at Georgetown University. O’Hara’s presentation focused on data access and governance, challenging the committee to consider where data are coming from and how they might be accessed, prepared, and analyzed to support HP2030’s monitoring activities. From where and how such data are collected, O’Hara noted, are vital to understanding the source’s validity, consistency, and reliability over time, and susceptibility to distortion by inequities in Internet access or other access issues. Similarly, when or how often data are collected shape the nature of comparisons for which data are used (e.g., comparing outcomes in two different counties at a fixed point in time, in contrast with a comparison over several years). O’Hara also provided a brief overview of considerations involved in integrating data from different sources or from different communities, states, or other levels of population. She emphasized the need for a common schema and a clear and well-documented process that can be replicated.
O’Hara focused the next portion of her remarks on reviewing several kinds of data sources. She noted the wealth of public-sector surveys from HHS, NCHS, and the Census Bureau while recognizing the bureaucratic barriers that often exist to accessing such data if no operational precedent exists for doing so. Although O’Hara observed that public data sources are typically more transparent, she urged the committee to consider the utility of private-sector surveys and especially administrative data (e.g., from state Supplemental Nutrition Assistance Program or Temporary Assistance for Needy Families agency datasets) for substantiating HP2030 objectives and informing LHI selection. O’Hara also pointed to place-based, community-generated, and potential future (e.g., Internet of Things) data as sources to be considered for possible relevance to HP2030 or future health monitoring efforts. More broadly, accessing these overlooked datasets calls for a broader effort to set norms, and to develop standards and practices to facilitate massive data collection across
___________________
4 See http://www.healthdata.org/gbd/about (accessed November 4, 2019).
all health-related sectors. To conclude, O’Hara challenged the committee to emphasize less what data sources are immediately available, but rather to focus on what needs measuring and what data sources could yield effective indicators to accomplish that task.
Following O’Hara’s presentation, Isham moderated a question-and-answer session with the committee. Skinner opened by asking Mokdad how IHME handles small area estimates with an appropriate amount of data imputation. Mokdad replied that data from other data sources such as the Census or neighboring counties or past years are used to establish covariates for small areas, and small area methodology is subsequently validated by sampling from large counties (e.g., Los Angeles). The GBD methodology uses imputation when linking data between national health surveys for poorly established indicators.
Next, Gold asked how the committee should address feasibility when considering whether a proposed LHI could be supported by interventions. Sondik highlighted this as an important and difficult question, because of over-reliance on significance testing to evaluate intervention effectiveness. He urged caution when predicting whether interventions will be successful when brought to new contexts. Isham asked about the ultimate aim of HP2030’s core objectives, and whether the reduction in core objectives (from roughly 1,200 to some 350 in the draft form, and ultimately up to approximately 600) still allows sufficient scope to adequately inform and drive change in America’s health system, per HP2030’s ambitions. Given the decision to reduce the number of core objectives has already been made, Sondik advised identifying the top priorities the select group of indicators should address. This is inherently a value judgment, Sondik noted, and would need to focus on the key questions about the quality and effectiveness of the U.S. health system and the key opportunities to intervene (e.g., on the high maternal mortality rates). O’Hara echoed that the list of core objectives should provide information critical to decision making and managing quality, not merely adding data. Any monitoring effort, O’Hara added, must be understood by how the data at hand are generated, not merely how they are managed and analyzed. Mokdad noted that objectives must be specifically defined to enable good indicators, but added that some objectives backed by poor measures may merit inclusion because they stimulate a demand for better data.
PANEL 3: HARMONIZING WITH OTHER NATIONAL METRICS SETS
Dushanka Kleinman of the University of Maryland and a co-chair of the SAC introduced the panel with brief remarks. Kleinman acknowledged the importance of harmonization across multiple federal efforts, denoting especially “aligning ways in which to assess and monitor clinical research” and other activities. She also noted that not only must the LHIs be understandable and actionable to a broad set of stakeholders, but the HP2030 effort must actively engage these stakeholders in new ways. This active stakeholder engagement includes identifying and incorporating stakeholders from non-health sectors that can support health and well-being. Kleinman also echoed earlier speakers’ emphasis on the importance and need for community-level data, and linkages between that community data and national datasets. Lastly, Kleinman encouraged the committee to consider the data partnership infrastructure—how could HP2030 harness new data in innovative, broad ways with other government, business, and nonprofit entities?
Kleinman introduced Tom Eckstein of Arundel Metrics, which oversees the annual America’s Health Rankings (AHR) study. AHR quantifies and ranks population health metrics for states and specific population subgroups, with the aim of providing sound science and longitudinal comparisons to inform cross-sector dialogue about population health. Eckstein explained that the model AHR uses compiles data on health behaviors, community and environmental conditions, policy, and clinical care to create aggregate, rankable health outcomes. In doing so, AHR prioritizes indicators that effectively enable communicating, comparing, and acting on data with a solid evidence base. He also mentioned the premium AHR places on indicators that are compatible with combined measures. Eckstein closed by describing some of the key challenges that AHR faces. These include how to maintain an indicator list that is both parsimonious and adequately comprehensive; how to categorize and communicate measures in accurate and user-friendly ways; and how to manage changes over time in data streams’ availability, variability and soundness, and terminology.
Following Eckstein’s remarks, Kleinman introduced Kristen Lewis of the Social Science Research Council’s Measure of America (MOA) initiative. MOA aims to provide sound, user-friendly tools for understanding well-being and inequity in America. MOA’s conceptual framework centers on the Human Development Index (HDI), which is intended to capture the well-being of people better than traditional economic measures. HDI emphasizes a limited set of indicators—namely, life expectancy at birth, educational attainment and school enrollment, and median earnings—to allow comparability, granularity, and effective advocacy and communication. To further support communication with stakeholders, MOA also emphasizes conveying its data in ways that make them accessible and understandable to a range of readers, highlighting take-home messages, key differences between subgroups, and the upstream drivers of health (i.e., high-level, such as public policies and societal investments). MOA works closely with community partners to disseminate these findings and to help communities apply the HDI framework for setting new well-being goals and designing programs to reach them.
Lewis underscored that adopting this active dissemination and community partnership role is key for a metrics set, such as HP2030, to catalyze real change. Lewis concluded with several other lessons learned from MOA. She observed that combining distinct datasets can reinforce key messages for stakeholders, who are more likely to act when presented with local health disparities data. Lewis also counseled that sharing data with both policy makers and community partners requires an explicit surfacing of the structural causes of health inequities behind those findings for the sake of fairness.
Marjory Givens, a scientist at the University of Wisconsin and the County Health Rankings and Roadmaps (CHR) program was the third and final presenter on the panel. Givens presented on CHR’s work and lessons learned. CHR collects and ranks health outcomes data from state and local sources to provide informative, actionable comparisons of health and well-being across America’s counties through 35 ranked measures, and more than 37 additional measures (see Figure 2 for the CHR framework). In doing so, CHR supports population health by engaging communities in population health initiatives, identifying root causes of health and illness, supporting new policy and decision making, and offering monitoring and evaluation capabilities. Givens describes how CHR selects its measures according to stated program goals and community needs—for example, whether the measures correspond to feasible and equitable health interventions, or whether they are easily communicated in conjunction with other metrics initiatives. CHR also considers technical feasibility issues: Are potential measures validated and reliable? Are these measures regularly collected at the county level, for nearly all counties, with minimal lag period? Are these measures rankable? Givens closed with several questions challenging the committee to think similarly critically about the LHIs. Should LHIs be scaled by geography and/or disaggregated—and if so, how? Should data sources be uniform across geographic scale, or should they be adjusted for factors like rurality? How can we measure equity and include it as an explicit norm in metrics approaches? Most of all, what is progress in shaping the health of the nation?
Following the panel presentations, Isham moderated discussion between the committee members and the speakers. Johnson started by asking which audiences are most critical to engage with HP2030’s LHIs. Lewis responded that the target audience depends on the level/sector that the LHI is meant to motivate, but it may be worthwhile to organize sets of indicators—or even distinct products—for specific target audiences. Gold next asked how important it is to have data at state and local levels amid the struggle to keep a parsimonious set of objectives that link national and subnational data. All three panelists affirmed the imperative for local-level data, suggesting that tracking equity is most effective at the local level. Skinner asked next how conflicts between different, combined datasets’ reported measures, whether directly measured or estimated, for a given population should be resolved. The panelists remarked that while combining datasets require clear transparency in reporting when conflicts occur, these instances are a much smaller issue compared to media and end-users’ lack of data literacy. Addressing this question of the public’s data literacy, Lantz asked Lewis whether the public
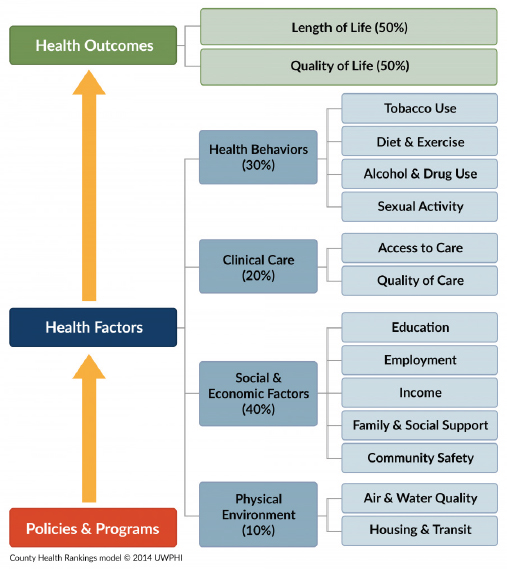
SOURCES: Presentation of M. Givens on May 28, 2019; University of Wisconsin Population Health Institute, County Health Rankings & Roadmaps 2017. www.countyhealthrankings.org.
accurately understands life expectancy as MOA reports it. Lewis stated that public understanding of life expectancy reporting relates to the extent to which the public could understand take-home messages and intervene accordingly. Lantz also asked whether fertility statistics are included in these metrics for demography purposes. Both Eckstein and Lewis responded that AHR and MOA, respectively, do not include fertility statistics because they are not strictly rankable from best rate to worst; however, both measure sets include data on access to family planning services, and AHR tracks the proportion of intended pregnancy by state. MOA also includes additional data on the use of reproductive services and rates of intimate partner violence. After that exchange, Isham closed by asking what non-geographic disparities may be overlooked and would need to be considered for parceling population data to inform equity in HP2030’s objectives. Lewis noted that MOA explored non-geographical subgrouping, namely, by race and ethnicity, exercise amount, diet, and insurance status, when consulting with Santa Barbara’s Cottage Health. Givens noted that focusing on administrative factors such as insurance status is worthwhile, especially given their relevance to policy design, but focusing there might encourage over-reliance on traditional health care–based solutions.
PANEL 4: MEASURING HEALTH EQUITY
Moderator Nico Pronk, president of HealthPartners Institute and co-chair of the SAC, opened the last panel of the meeting with several comments. He reminded the committee that health equity is a central and cross-cutting piece of the HP2030 framework, and so is the emphasis on overall well-being. Considering that the LHIs derived from core objectives will only guide HP2030 in so much as they reflect the vision the HP2030 framework provides, Pronk highlighted the SAC’s findings, found in its seventh report, that many of the FIW-proposed objectives did not align with this larger vision. However, this provides an opportunity to think more broadly about the approach for LHI selection, Pronk noted. He proposed that in addition to adequately reflecting the HP2030 framework, the LHIs should allow disaggregation and clearly spotlight vulnerable populations’ health needs. Moreover, the LHIs must provide a balanced focus between disease prevention and disease prevalence and allow meaningful health comparisons with other countries. Pronk noted that this may require loosening the restrictions on deriving the LHIs from the FIW-proposed list of core objectives so that the LHIs may adequately capture the vision of HP2030.
Pronk introduced Brian Smedley of the National Collaborative for Health Equity. Smedley presented on the Health Opportunity and Equity (HOPE) initiative, which tracks health equity through a set of focused data and tools in an opportunity-focused narrative well suited for communicating in a changing political landscape. Smedley differentiated HOPE from other equity measurement tools because of its capacity for disaggregating data—by race and ethnicity, income, education at both national and state levels—and its benchmarking approach. In contrast to the traditional, white-normative method for benchmarking that compares other subgroups’ health outcomes to typically better-off white outcomes, HOPE creates benchmarks using the average outcomes of the top five-performing states’ high-earning and college-educated population. Utilizing both current performance and goals for a given subpopulation, HOPE also reports a distance-to-goal measure (i.e., the number and share of people who would need their health status or conditions for health to improve for the subpopulation to meet the HOPE goal). Smedley concluded by demonstrating several HOPE state profile tools to visualize ranked health outcomes and distance-to-goal measures by race/ethnicity for a given state. These visualizations and Smedley’s key findings underscored the profound health improvements states and the nation would experience if all people enjoyed the same advantages as high-earning college graduates. Smedley also presented slides from co-presenter Steven Woolf, who was unable to attend the meeting. Woolf’s slides examined the body of research on population attributable risk (i.e., the proportion of cases that would be averted if a risk factor, such as systemic inequities, were eliminated). Smedley briefly touched on the statistical calculations used to compute such risk before describing several landmark examples of these estimates in the literature, meant to illustrate attributable risk as an alternate way of conceptualizing and measuring health equity. Examples included McGinnis and Foege’s work on the so-called “actual causes of death,” attributing 400,000 deaths per year to tobacco use and another 300,000 annual deaths to poor diet and inactivity.5 Elsewhere, Smedley cited work from Woolf and colleagues that nearly 900,000 excess African American deaths occurred between 1991 and 2000 because of racial inequities.6 Smedley closed by highlighting the comparative value of such estimates, noting that between 1991 and 2000 closing inequities in educational attainment could have averted nearly 10 times as many excess deaths as making technological advances.7
Sarah Treuhaft of PolicyLink next presented the National Equity Atlas (NEA), which PolicyLink develops in
___________________
5 McGinnis, J., and W. Foege. 1993. Actual causes of death in the United States. Journal of the American Medical Association 270(18): 2207–2212. https://www.ncbi.nlm.nih.gov/pubmed/8411605 (accessed September 25, 2019).
6 Woolf, S. H., R. E. Johnson, G. E. Fryer, Jr., G. Rust, and D. Satcher. 2004. The health impact of resolving racial disparities: An analysis of US mortality data. American Journal of Public Health 94(12): 2078–2081. https://www.ncbi.nlm.nih.gov/pmc/articles/PMC1448594 (accessed September 5, 2019).
7 Ibid.
SOURCE: Presentation of S. Treuhaft, May 28. 2019. Reprinted with permission from PolicyLink. Copyright 2018.
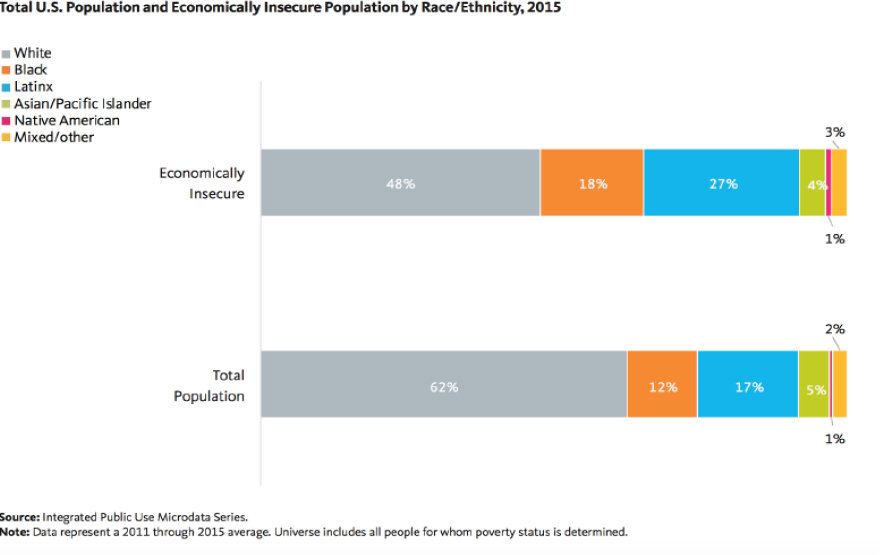
collaboration with the University of Southern California’s Program for Environmental and Regional Equity. Treuhaft explained that NEA provides data on measures of population health, well-being, and inclusion at the national level, for all 50 states, and for the 150 largest metropolises and 100 largest cities in the United States. NEA disaggregates these data by race/ethnicity, gender, nativity, and income to inform community action. NEA specializes in disaggregating data at the local level; monitoring with unique indicators such as working poverty and the economic benefits of racial equity in income; implementing a community-tested and -approved equity framework; and disseminating data to shape the policy-making process. To this last point, Treuhaft cited NEA’s success in encouraging the advent of a One Fairfax Equity Policy in Fairfax County, Virginia, and the Office of Equity, Diversity, and Inclusion in Rhode Island. In closing, Treuhaft underscored the need to disaggregate indicators to highlight inequities. Specifically, she told the committee that examining race alongside other inequities requires both a holistic, SDOH-informed framework and data disaggregation to see which races are over- or under-represented. Additionally, she encouraged choosing pertinent and comparative metrics to illustrate key and overlooked/poorly measured inequities. These could include measuring the racial wealth gap as a standalone indicator, or using more accurate measures of economic insecurity than the federal poverty level (such as 200 percent of the federal poverty level) (see Figure 3 for the distribution of economic insecurity by race and ethnicity, 2015).
Isham moderated the question-and-answer session. Gilbert Gee of the University of California, Los Angeles, asked how to capture so many inequities with the most parsimonious set of indicators and objectives. Both Smedley and Treuhaft both remarked that racial inequity and its enduring impacts on a changing population must be prioritized first when monitoring inequities. Smedley further recommended that HP2030 set as a data infrastructure goal developing a nuanced system for disaggregating data on multiple inequities simultaneously. Afterward, several questions arose about HOPE’s benchmarking methods. Johnson asked whether benchmarking against high-earning, college-educated subpopulations’ outcomes may effectively lend itself to victim-blaming critiques and/or the health comparisons to wealthy Whites that HOPE purportedly aims to avoid. Smedley acknowledged this possibility and pointed to the need for effective messaging that dissuades victim blaming while objectively indicating this high-earning, college-educated group tends to enjoy the excellent health outcomes that should be attainable by everyone. Skinner also asked what benchmarking strategies might avoid artifactual spikes in equity when benchmark groups start experiencing declining outcomes. Treuhaft advised simply disaggregating outcomes over time by race/ethnicity to examine subgroups’ trends independent of any benchmark group. Smedley noted that HOPE uses both count data and distance-to-goal measures—that is, both absolute and relative measures—in these instances to limit such artifactual changes. Isham followed up on Smedley’s comment by asking whether HOPE’s distance-to-goal measures
are standalone indicators. Smedley clarified that distance-to-goal measures are a communications-oriented detail, not themselves part of HOPE’s set of metrics. Lastly, Gold asked how to operationalize objectives that track policies (e.g., related to housing) so that HP2030 can address place-related structural inequities. Smedley highlighted the poignancy and flexibility that a measure examining the proportion of families in low-poverty neighborhoods (i.e., where fewer than 20 percent of the population at the census tract level is below poverty) could provide here. Treuhaft suggested that embedding policy frameworks, such as PolicyLink’s All-In Cities or others, might support operationalizing the measurement of inequities at the local level.
Isham opened the floor for public comment and final questions from the committee members. Kleinman observed that the Panel 4 question-and-answer session underscored why ongoing learning and the development of equity measurements are vital. Better surveillance and data collection are needed to address critical inequities—especially the least studied, such as lesbian, gay, bisexual, and transgender populations' health outcomes. Phelan-Emrick shared an anecdote regarding how community members think about health measures. During her tenure with the Baltimore City Health Department, Phelan-Emrick noted, she learned that residents may come to mistrust the Health Department’s messaging about improvements in life expectancy—for example, when the agency’s communication about improvements to life expectancy contrasts with some residents’ lived experience of illness and death in their social circle. Saha commented on the last panel’s discussion. She learned from her experience with 100 Million Healthier Lives that if data are disaggregated by race it multiplies other inequities. Instead of disaggregation, then, one feasible alternative measure could be the "opportunity for years of potential life gained," per Woolf’s and Treuhaft’s presentations. Such an indicator allows measuring individual and additive improvements without onerous additional data collection, and it avoids the "zero-sum thinking" of benchmarking against a better-off subgroup. Wayne Jonas of the Samueli Foundation made a final comment, challenging attendees to think of ways to link the aims of achieving health and well-being outcomes with day-to-day health care delivery goals. Once the public comment session concluded, Isham thanked the presenters, committee members, and attendees for their time, described the next steps for the committee, and adjourned the meeting.♦♦♦
DISCLAIMER: This Proceedings of a Workshop—in Brief was prepared by Andrew Koltun as a factual summary of what occurred at the meeting. The statements made are those of the rapporteur or individual workshop participants and do not necessarily represent the views of all workshop participants; the planning committee; or the National Academies of Sciences, Engineering, and Medicine.
*The National Academies of Sciences, Engineering, and Medicine’s planning committees are solely responsible for organizing the workshop, identifying topics, and choosing speakers. The responsibility for the published Proceedings of a Workshop—in Brief rests with the rapporteur and the institution.
REVIEWERS: To ensure that it meets institutional standards for quality and objectivity, this Proceedings of a Workshop—in Brief was reviewed by Erica Russell, United Way of the National Capital Area, and Wayne Jonas, Samueli Foundation. Lauren Shern, National Academies of Sciences, Engineering, and Medicine, served as the review coordinator.
SPONSORS: This workshop was supported by the U.S. Department of Health and Human Services' Program Support Center.
For additional information regarding the workshop, visit http://nationalacademies.org/hmd/Activities/PublicHealth/LeadingHealthIndicatorsForHealthyPeople2030.aspx.
Suggested citation: National Academies of Sciences, Engineering, and Medicine. 2020. Informing the selection of Leading Health Indicators for Healthy People 2030: Proceedings of a workshop—in brief. Washington, DC: The National Academies Press. https://doi.org/10.17226/25654.
Health and Medicine Division
![]()
Copyright 2020 by the National Academy of Sciences. All rights reserved.


