
5
The Impact of the DOE SBIR/STTR Programs: Innovation, Commercialization, and Employment
The previous chapter provided descriptive evidence around the landscape of SBIR/STTR winners. This report now turns to the observable impact of the DOE SBIR/STTR programs on key dimensions of performance: innovation, commercialization, and employment. To examine the impact of the SBIR/STTR programs, the committee designed and implemented an assessment approach that was rigorous and systematic while recognizing the unique nature and objectives of the SBIR/STTR programs. The committee aimed as much as possible to analyze the programs on a system-wide basis, focusing on the outputs associated with the DOE SBIR/STTR programs as a whole rather than on isolated examples of success (or failure).
In designing this approach, the committee faced several interrelated challenges. First, the DOE SBIR/STTR programs have several competing objectives, and different objectives compete with each other for priority in the design and implementation of the programs. For example, the enabling legislation for the SBIR program states that the program should advance federal agency research and development (R&D) needs and also increase private-sector commercialization of innovation derived from federal funding.1 These two objectives are likely in competition, particularly in a program aimed at small firms in the context of an agency such as DOE that hosts a large intramural research program. Second, even if one focuses on a particular metric for success, there are no systematic measurement systems in place to track success on an ongoing basis. For example, as documented below, there is evidence for the commercial development of new products and processes from exemplar firms, but there is no systematic project management database that can be used to assess the
___________________
1 As described in Chapters 1 and 2, SBIR and STTR have different, but similar, goals. Increasing private-sector commercialization of innovation derived from federal funding is a goal of both programs, although the share of work done by the research institution is larger for STTR. The Department of Energy administers the programs together.
commercial impact of SBIR/STTR on a grant-by-grant basis. As such, for each assessment metric, the committee had to develop an approach that involved developing (and judging the credibility of) several new datasets, each of which attempts to capture a particular vector of outcomes associated with SBIR/STTR funding. Third, even if an assessment were conditioned on a particular program objective and a particular outcome metric, any evaluation seeking to make causal claims about programs’ impacts must strive to approximate the counterfactual outcome of what the program’s beneficiaries would have looked like had they not participated in the program. For example, in the case of the SBIR/STTR programs, Lerner’s (2000) pioneering study documented that SBIR recipients were linked to higher levels of firm growth, with the effect concentrated in regions with higher levels of venture capital financing. However, as emphasized by Wallsten (2000), such an analysis cannot prove that the program was not simply identifying firms with the highest potential (the so-called “picking winners” challenge). The committee’s analysis employed a suite of methodologies that address this challenge in order to provide evidence for program impacts that are “additional,” in the sense that they would not have occurred in the absence of the program. Finally, while the bulk of assessments of the SBIR/STTR programs tends to focus on the impact of the programs on recipient firms, the rationale for the programs is in part justified by the potential for spillovers across firms or through the development of a cumulative and inclusive research community. The full benefits of the SBIR/STTR programs involves activities and outcomes that go beyond the outcomes associated with individual firms.
To address these questions and challenges, this chapter presents an integrated analysis featuring three key features. First, the committee undertook as much as possible a “systemwide” perspective on the impact of the programs. This approach prompted the committee to assess multiple potential dimensions of performance, including innovation outcomes, the commercialization of new products or technologies or tools, and firm-level growth outcomes. However, even this integrated analysis is likely an underestimate of the impact of the programs, as the committee did not examine, for example, the impact of experience with the programs on overall career outcomes of program recipients or directly measure of the programs’ impact on addressing critical needs for DOE technical priorities. Second, the committee undertook both systematic empirical analyses in which there is a clear line of causality (i.e., what is the impact of receiving an SBIR/STTR award relative to not receiving one?) as well as more descriptive analyses highlighting some program outcomes that, on the one hand, cannot be causally attributed to the programs but, on the other, are consistent with the impact of the programs as part of the broader energy innovation system. Finally, while the bulk of the assessment focuses on firm-level outcomes, the analysis of the innovation outcomes goes beyond that by examining the regional spillovers from SBIR/STTR awards on complementary and follow-on innovation potentially induced by the SBIR/STTR award.
This chapter follows the three parts of the committee’s analysis—innovation outcomes, commercialization outcomes, and employment growth—
and ends by summarizing the main findings of the outcome analyses and the committee’s related recommendations.
INNOVATION OUTCOMES
Two of the central objectives of the SBIR program as promulgated in its authorizing legislation are (a) the stimulation of technological innovation, and (b) contributing to the mission-oriented needs of federal agencies. Accordingly, one of the central areas for assessment according to our Statement of Task was to evaluate SBIR/STTR’s role in “stimulating technological innovation and contributing to DOE’s R&D needs” (Box 1-1).
To accomplish this objective, it is useful to consider what observable outcomes would provide evidence in support of this assessment task. On the one hand, one element of evidence would be to observe the direct production of observable innovations by SBIR/STTR recipient firms subsequent to the receipt of an SBIR/STTR award. For example, one could examine whether SBIR/STTR recipients engaged in patenting (or scientific publications), or one could examine whether recipient firms were involved in or led the commercialization of particular technologies, tools, or products.
A recent set of studies has examined the causal impact of the DOE SBIR/STTR programs on innovation. Most notably, Howell (2017) offers an analysis designed to overcome these concerns. Specifically, Howell gained access to a subset of the DOE SBIR/STTR grant applications (those for the Office of Energy Efficiency and Renewable Energy and Office of Fossil Energy) and was able to observe the applications by firms that received an award and those that did not in those offices. In addition, she observed a merit-based ranking of projects which closely corresponded to the decision by program managers to grant an award. By then examining the innovation behavior of firms that received awards on the margin versus those that were just below the cut-off for receiving an award, she was able to approximate the marginal impact of the award on subsequent innovation behavior.
Howell (2017) found striking evidence for the innovation benefits of the programs. For example, receipt of a Phase I award increased a firm’s citation-weighted patents by at least 30 percent. Her study also found strong evidence of follow-on financing effects, estimating a nine-percentage-point increase in the likelihood of venture capital funding for Phase I winners relative to non-winners. In terms of revenue, her analysis showed that Phase I receipt led to a doubling of the likelihood of positive revenue and, for firms achieving positive revenue, a 30 percent increase in revenue relative to non-winners. Her results suggest less encouraging results for Phase II awards, with no effects found on revenue but positive impacts on citation-weighted patents, though smaller than for Phase I. Howell was able to also assess the cost-effectiveness of awards, estimating a cost-per-patent of as little as $150,000 and at most $1.5 million (Howell, 2017).
Lanahan and Armanios (2019) dug deeper into the patent outcomes, interpreting these measures not simply as a metric for innovation, but also firm
strategy. They argued that patents may indicate commercialization potential for firms early in the innovation process. However, those patents may be of little commercial value if they make few citations to prior art, thus indicating an orientation toward more basic science. Their analysis showed that firms with more Phase I awards produced more patents but that these patents tended to be more focused on upstream research contributions that may have more limited commercialization potential.
While this prior work provides a foundation for efforts to measure the innovation impact of the SBIR/STTR programs, two important concerns had not been addressed. First, even if innovation is directly attributable to SBIR/STTR funding, that does not by itself show whether the funding is meeting DOE’s R&D needs. Beyond simply assessing whether awardees achieved any innovation at all, a narrower focus on innovation is required. Second, any analysis that exclusively focuses on innovation by the SBIR/STTR recipient neglects the potential for the SBIR/STTR award to stimulate research for additional firms and institutions through knowledge spillovers and potential collaborations, and ultimately through commercialization.
As part of its deliberations, the committee invited a presentation with Professor Adam Jaffe, chair of the National Academies Board on Science, Technology, and Economic Policy and one of the leading researchers in innovation policy evaluation. Professor Jaffe discussed at some length the gap between the economic rationale for programs such as the SBIR/STTR programs (which depend on some form of market failure) and the focus of most prior empirical evaluations, which focus primarily on firm-level outcomes. To the extent that the benefit of the SBIR/STTR programs is through spillovers onto other innovators, this would likely be overlooked in the context of a firm-level analysis but would be a primary rationale for the programs themselves.
To overcome these potential challenges, a member of the committee along with a committee consultant undertook an analysis that offers an integrated analysis of the innovation impact of the SBIR/STTR programs. Specifically, Myers and Lanahan (2020) undertook a detailed analysis that allowed them to assess the impact of the DOE SBIR/STTR programs on patenting output.2 Their analysis involved three critical steps. First, rather than assess the SBIR/STTR programs as a funder of firms, they focused on the programs as a funder of technologies. Specifically, they took advantage of the fact that DOE crafts funding opportunities based on feedback from DOE national labs and program offices about their R&D needs (the funding opportunity announcement (FOA) process). Myers and Lanahan were able to examine the linkage between the specific areas identified in FOAs as priority areas, subsequent investment in those areas, and follow-on patenting output in those areas. This allowed them to create a mapping between SBIR/STTR investments in particular technology areas and anticipated impacts in particular patent classes. Second, because these authors were considering the impact of the programs at the level of technological rather than
___________________
2 See Appendix C for a detailed explanation of Myers and Lanahan’s (2020) methodology and data.
firm-level output, the analysis was able to be disaggregated across two dimensions: how closely subsequent patenting output follows DOE areas of technological priority, and whether such patenting output is directly connected to SBIR/STTR recipient firms or other firms within their region or state (as would be expected if spillovers were important). This step also allows for even sharper identity of causality by taking advantage of the fact that some states, but not all, offer matching grants based on the receipt of SBIR/STTR funds, making it possible to examine the impact of “marginal” funding of particular technological areas on subsequent technological outputs by both recipient firms and other firms in the region. Finally, Myers and Lanahan brought these elements of evidence together to undertake a cost-effectiveness analysis that considered the amount of technological innovation induced by the SBIR/STTR programs, both at the level of specific technologies and also by whether that innovation is directly associated with an SBIR/STTR recipient or the result of spillovers from the SBIR/STTR programs onto the broader innovation system. Specifically, they addressed three key questions that directly related to the committee’s Statement of Task:
- What is the total innovation impact of SBIR/STTR awards in terms of observable innovation output, relative to what might be expected in the absence of an SBIR/STTR award?
- What types of innovation are induced by SBIR/STTR awards? Is it simply “more innovation” or are the innovations targeted in areas that serve the stated mission-driven needs of DOE (which is itself changing over time)?
- What are the ultimate sources of innovation from SBIR/STTR awards? Is the main effect simply the innovation produced by the firm receiving the award, or are there ecosystem effects which encourage (or discourage) innovation by other firms in the area in which you are trying to encourage innovation? What is the geographic scope of such spillovers?
This chapter now reviews their analysis in further detail, and refers readers to Myers and Lanahan (2020) for a complete discussion of their approach, data, methods, and individual interpretation of their results.
Linking SBIR/STTR Investments and Subsequent Patenting Output
The first step of Myers and Lanahan’s (2020) analysis involved creating a systematic linkage between SBIR/STTR investments and subsequent patenting output. As mentioned above, the first key step took advantage of the process by which DOE SBIR/STTR topics in the FOAs are developed. For each funding round, the DOE SBIR/STTR Programs Office solicits proposals for priority areas from individual DOE offices and institutes, and so the DOE SBIR/STTR FOA topics reflect, at any moment in time, a statement of the technological priority
areas of DOE. Myers and Lanahan created a mapping between these statements of technical priority and patent classifications by taking advantage of textual similarity analysis. Specifically, their approach allowed them to create a mapping between any given patent (and its associated cooperative patent classification (CPC)) and the technical areas identified in earlier FOAs.
Myers and Lanahan implemented this approach by assembling a novel dataset linking DOE SBIR/STTR awards between 2006 and 2017 and U.S. patents at the level of CPC technology classes. Since 2000, the DOE SBIR/STTR programs have awarded roughly $2.45 billion to 2,064 firms, including approximately 5,600 Phase I awards ($580 million) and 2,400 Phase II awards ($1.87 billion). Recipients received an average of 2.7 Phase I awards and 1.2 Phase II awards.
Table 5-1 summarizes the FOA and award data. Each year, DOE announces about 60 unique topics and awards four to five new Phase I awards per topic. When connected to any follow-on Phase II awards (given in future years), an average of over $2.5 million is invested in each topic. To give a sense of the types of technologies that the DOE SBIR/STTR awards target, Table 5-2 identifies the top 15 CPC classes (aggregated to the three-digit code) per total investments in the sample. The top classes revolve around measurement tools, generating and transmitting electricity, computers, fuels, and engines.
Estimating the Relationship Between SBIR/STTR Investments and Patenting
The second step of Myers and Lanahan’s (2020) analysis involved estimating the empirical relationship between SBIR/STTR funding and subsequent innovation output. This step drew on traditional “patent production
TABLE 5-1 DOE SBIR/STTR Funding Opportunity Announcements and Grant Awards Data, FY 2006-2017
| Category of Data | Per Year | Per FOA Topic |
|---|---|---|
| Phase I grants (Millions of Dollars) | 39.4 (15.1) | 0.66 (0.63) |
| Phase II grants (Millions of Dollars) | 111 (60.0) | 1.86 (2.54) |
| Number of Phase I grants | 276 (126) | 4.61 (4.11) |
| Number of Phase II grants | 117 (60.7) | 1.95 (2.50) |
| Number of unique firms receiving grants | 232 (52.8) | 5.59 (4.22) |
| Number of unique states with firms receiving grants | 39.3 (3.39) | 4.25 (2.90) |
| Number of FOA topics | 60 (7.95) | n/a |
NOTE: This table reports mean values with standard deviations in parentheses.
SOURCE: Appendix C.
TABLE 5-2 Top Technology Classes Invested in by DOE SBIR/STTR Programs, FY 2006-2017
| Rank | CPC Technology Class |
|---|---|
| 1 | G01: Measuring; testing (e.g., scales, mass spectrometers, seismometers) |
| 2 | H01: Basic electric elements (e.g., cables, resistors, magnets, capacitors) |
| 3 | H02: Generation; conversion or distribution of electric power |
| 4 | H03: Basic electronic circuitry (e.g., modulators, amplifiers, resonators) |
| 5 | H04: Electric communication technique (e.g., telecommunications) |
| 6 | G06: Computing; calculating; counting |
| 7 | C10: Petroleum, gas, or coke industries |
| 8 | F16: Engineering elements & units (e.g., couplings, springs, insulation, belts, gears) |
| 9 | C12: Biochemistry; microbiology; enzymology |
| 10 | B60: Vehicles in general |
| 11 | F02: Combustion engines |
| 12 | B01: Physical or chemical processes or apparatus (e.g., laboratory tools) |
| 13 | C08: Organic macromolecular compounds |
| 14 | F23: Combustion apparatus or processes |
| 15 | F24: Heating; ranges; ventilation |
NOTE: These are aggregated to the CPC subsection level, indicated by the 3-digit code. Rankings are based on total investments over this period, counting only “strict” matches between the FOA topic of each award and the CPC class.
SOURCE: Appendix C.
function” estimation approaches (following Griliches (1998)) and employed a Poisson regression model relating investments in a given patent class to the change in the stock of patents in that class (that is, the incremental innovation output resulting from incremental innovation funding). A key advantage of the Myers and Lanahan approach is that there was no assumed connection between innovative investment and outputs at the level of an individual firm. Rather than focusing narrowly on the question of whether the SBIR/STTR recipient was linked to a particular patent (which can also be examined separately), this analysis examined whether there was observable (subsequent) innovation in a particular patent class where the SBIR/STTR programs had made incremental investments. As such, it is possible to consider the direct impact of an award not only on recipient firms but also on other firms’ innovative output (such as those that are geographically near the recipient and therefore might benefit from knowledge spillovers).
A key element of this “production function” approach is that it provides a systematic association between incremental investment by the SBIR/STTR
programs and subsequent innovation output. However, it is possible that such an analysis could be biased by the fact that the areas identified through the FOAs are not simply a reflection of DOE priorities but are also emerging areas of technological opportunity. Therefore, it is possible that rather than estimating the causal impact of the award on subsequent innovation output, the analysis might be confounded by a common factor that drives both SBIR/STTR interest in a topic area as well as subsequent innovation output (that would have occurred even in the absence of the award).
Myers and Lanahan overcame this challenge by building on Lanahan and Feldman (2018), who took advantage of the fact that a number of states match federal SBIR/STTR awards with additional non-competitive funds. Importantly, these states provided the matching funds largely for reasons unrelated to the quality or nature of the projects that won the federal SBIR/STTR awards. Myers and Lanahan used this situation to create a new measure that allowed them to not simply compare outcomes for two technology classes that received differing levels of federal DOE SBIR/STTR awards, but instead compare outcomes for two technology classes receiving the same amount of federal investments with one receiving additional investments from a state program. These state-based SBIR/STTR “windfalls” serve as an “instrumental variable” that allows researchers to trace the causal impact of marginal funding in particular technology areas on subsequent technological output.3
Table 5-3 details patenting rates and investments, where both have been converted into stocks. The table presents statistics for the key variables when using “Strict” and “Loose” specifications for determining which CPC classes correspond to which FOA topics and grants. By construction, as the relevance threshold is loosened, more CPC classes receive smaller investments.
TABLE 5-3 DOE SBIR/STTR Funding Opportunity Announcements and Grant Awards Based on Stringency of FOA-CPC Match, FY 2006-2017
| Strict Match | Loose Match | Match N/A | |
|---|---|---|---|
| Any investment, {0,1} | 0.138 (0.345) | 0.482 (0.500) | |
| DOE investment if greater than 0 (Dollars) | 50,087 (80,989) | 14,317 (22,000) | |
| Patent rate for grant recipients | 0.0116 (0.222) | 0.0546 (0.647) | |
| + Firms in the same city | 0.491 (8.601) | 1.820 (22.47) | |
| + Firms in the same state | 3.317 (45.73) | 5.709 (51.16) | |
| + Firms in the rest of the United States | 7.682 (54.82) |
NOTE: This table reports means, with standard deviations in parentheses. It is based on FY 2006-2017 data for all 10,378 CPC classes. Total number of observations was 133,705.
SOURCE: Appendix C.
___________________
3 See Appendix C and Myers and Lanahan (2020) for a more detailed discussion.
Anywhere from 14 to 48 percent of the full set of CPC classes explored received DOE investments at some point in time. Patenting rates were highly skewed, with standard deviations often an order of magnitude larger than means. Unlike the patenting rates for geographic regions within the United States (which are based on where funding is directed, which itself is based on the stringency of the match), the U.S.-wide patenting rate is independent of the FOA-CPC match stringency because all SBIR/STTR awards go to U.S. firms.
Estimating the Cost-Effectiveness and Spillovers Associated with DOE SBIR/STTR Funding4
Moreover, as emphasized earlier, any assessment of the impact of the SBIR/STTR programs that simply focuses on the innovation directly resulting from program participants understates the value and cost-effectiveness of the programs insofar as there may be knowledge spillovers or local inducement effects by other firms that enhance the impact of individual grants. The key results concerning cost-effectiveness of the DOE SBIR/STTR programs are in Table 5-4. The columns of the table accord with the degree of similarity between a particular grant and the patents that are produced (i.e., whether there are high-match patents on the left versus few patents at all on the right). Analogously, the rows of the table report cost estimates where patents from concentric sets of firms are included in the analysis (firms, city, state, and United States overall). The second through fourth rows of each panels in the table account for the broader innovation ecosystem effects. For each row, the calculation reflects the outputs at the level of a geographic unit (city, state, United States overall) relative to the location of each SBIR/STTR awardee (see Myers and Lanahan (2020) for further details). By examining each of these additional margins in detail, it is possible to examine the full cost-effectiveness of the programs on a system-wide basis.
For each calculation, the overall relationship between SBIR/STTR investment and patenting output (the top panel) was examined, followed by an instrumental variables approach that exclusively uses funding variation arising from state-level matching “windfalls” (the bottom panel). By and large, the estimates are quite similar across the two specifications (and across a range of alternatives described in Myers and Lanahan), with some evidence that the results that rely on state matching funds are more cost-effective for the strictest specification but a bit higher for more aggregate specifications.
The results are striking. First, consistent with the estimates in Howell (2017), the cost per patent produced by SBIR/STTR recipients in response to an SBIR/STTR award is approximately $1 million. This is an important benchmark, as it is arguably the most straightforward estimate of the innovation output of the program. Given that recent estimates from Kogan et al. (2017) associate a single U.S. patent (for a U.S. public company) with approximately $7-8 million
___________________
4 See Appendix C or Myers and Lanahan (2020) for a more detailed discussion.
TABLE 5-4 Total Cost of Research per Patent Received
| Patent Group | Strict Match (millions of dollars) | Medium Match (millions of dollars) | Loose Match (millions of dollars) |
|---|---|---|---|
| For Endogenous Investments | |||
| Firm | 4.01 [2.34 – 17.1] |
1.25 [1.04 – 1.55] |
1.04 [0.905 – 1.23] |
| +City | 5.60 [4.72 – 6.91] |
1.06 [0.972 – 1.17] |
0.685 [0.616 – 0.774] |
| +State | 1.77 [1.25 – 3.14] |
0.356 [0.286 – 0.367] |
0.215 [0.188 – 0.251] |
| +US | 2.64 [1.84 – 4.66] |
0.401 [0.331 – 0.510] |
0.248 [0.210 – 0.301] |
| For State-match Windfall | |||
| Firm | 3.52 [2.50 – 5.98] |
1.27 [1.08 – 1.55] |
1.05 [0.915 – 1.23] |
| +City | 5.18 [3.99 – 7.40] |
1.11 [1.01 – 1.25] |
0.710 [0.619 – 0.833] |
| +State | 1.91 [1.47 – 2.73] |
0.356 [0.308 – 0.424] |
0.244 [0.203 – 0.308] |
| +US | 2.31 [1.43 – 6.28] |
0.451 [0.365 – 0.590] |
0.298 [0.234 – 0.412] |
NOTE: The main estimate is reported with bounds based on 95 percent confidence intervals of the estimates, reported in brackets. Geographic levels include all concentric regions; e.g., “+City” includes all firms in any city where a SBIR/STTR grant is awarded for a particular class.
SOURCE: Appendix C.
of private value, this suggests that the SBIR/STTR programs are stimulating technological innovation in a cost-efficient manner.
However, this calculation accounts neither for the degree to which the innovation is directed toward meeting DOE R&D needs nor for spillovers to others firms that might be induced to also pursue innovation along this trajectory. These effects operate in opposite directions. On the one hand, at the level of firm, moving from a “loose” to “medium” match in terms of topic fit for the innovation increases the cost per patent only modestly (from 1.05 to 1.27 in the estimates associated with the state-match instrumental variable strategy). However, there is a sizeable increase to between $3.5 and $4 million in the cost per patent for the most restrictive matching procedure (where there has to be an essentially one-to-one match between the patent classes covered by the patent and the topics listed in the FOA). But even this upper estimate suggests that the DOE SBIR/STTR programs offer a meaningful and reasonably cost-effective mechanism for
stimulating technological innovation and doing so in a way that helps small businesses contribute to the R&D needs of DOE.
Overall, there seems to be an important “ecosystem” impact of the programs. SBIR/STTR awards seem to stimulate technological innovation not only by recipient firms but by other firms in the state where that firm is located (and in particular in technology areas particularly relevant for DOE according to the FOA record). Accounting for these effects significantly enhances the cost-effectiveness of the programs. For example, the cost per “medium” match patent ranges between $350,000 and $450,000 depending on whether you consider the spillovers to operate at the state or national level (and depending on whether you focus on the direct effect or the effect that exclusively arises from variation arising in state matching funds).
Beyond their direct relevance for assessing the Statement of Task, these findings provide a new perspective on the nature of geographic knowledge spillovers and their importance for evaluating innovation policy initiatives such as the SBIR/STTR programs. In particular, building on Jaffe, Trajtenberg, and Henderson (1993) and a long line of research focusing on the nature of innovation systems, it is useful to consider the degree to which the value of the SBIR/STTR programs are grounded in the direct impact on the companies funded versus the spillover benefit to other firms in the region. To that end, in Table 5-5 the committee calculated a “spillover ratio” defined as the additional expected patent output generated within particular regional bands per the expected patent output produced by the firms that receive the SBIR/STTR awards:

TABLE 5-5 Spillover Ratios
| Patent Group | Strict Match | Medium Match | Loose Match |
|---|---|---|---|
| City, excluding firms | -0.35 | 0.14 | 0.47 |
| State, excluding cities | 1.21 | 2.43 | 2.82 |
| United States, excluding states | -0.57 | -0.75 | -0.77 |
| Net | 0.51 | 1.82 | 2.53 |
NOTE: The firms or regions excluded refer to the regions where firms receiving SBIR/STTR awards were located. For example, if only a single firm in Durham, NC, received an SBIR/STTR award, then “City excluding firms” would include outputs for all other firms in Durham; “State, excluding cities” would include all cities in North Carolina except Durham, and “United States, excluding states” would include all states except North Carolina. All estimates are based on the state-match windfall results.
SOURCE: Appendix C.
This metric is a multiplier that describes the additional innovation outcomes of SBIR/STTR funding generated via spillovers. A spillover ratio of 1 for the geographical band of “state, excluding cities” would indicate that, for each additional patent that the awardees produce, one can expect that non-SBIR/STTR firms in that same state, but not in the same city, will also produce one additional patent. Thus, it can be interpreted as a multiplier that describes the additional output generated via spillovers. The table also reports “net” spillover ratio which has U.S. wide output (minus SBIR/STTR recipients) in the numerator. It is useful to note that a negative value for this ratio is possible if firms and inventors in particular regions decrease their R&D in response to the output of other firms, in which case the numerators would be negative, as might occur through strategic interactions of competing firms.
Table 5-5 presents these spillover ratios for three non-concentric regional bands that uncovers how spillovers propagate across geography, as well as the net effect.
Overall, the primary finding is that there is a large positive impact of spillovers above and beyond the direct impact of the SBIR/STTR programs. For example, even at the level of the narrow technology classes related to an individual FOA, 50 percent of the innovation impact of the award seems to arise from follow-on research by other firms rather than the SBIR/STTR awardee. Interestingly, this effect seems to be most meaningful at the level of spillovers at the state level. After accounting for potential impacts across all technology classes and the full United States, the impact of a single SBIR/STTR award is estimated to be amplified by more than 2.5 times through knowledge spillovers over time.
Together these findings provide compelling and systematic evidence for two key elements of the committee’s Statement of Task. First, regardless of the particular specification or assumptions used, the DOE SBIR/STTR programs do seem to stimulate technological innovation (on the margin), and the committee’s estimates of these effects are both consistent with prior estimates in the research literature and show that patent costs are cost-effective relative to the estimated private value of the intellectual property produced. Second, above and beyond the impact on technological innovation overall, there is significant evidence that the DOE SBIR/STTR programs are helping small businesses develop innovations that meet the R&D needs of DOE itself. Specifically, the patenting induced by SBIR/STTR grants (and even state-level incremental funding for such grants) seems to stimulate innovation in precisely those patent classes that are connected to the technical needs identified through the DOE SBIR/STTR FOA process. Finally, the cost-effectiveness of the programs is enhanced by accounting for the spillovers that result from these award programs insofar as there seems to be a positive stimulative effect on innovation by companies in the same state where SBIR/STTR awards are made. In the most generous specification (the “loose match”) the committee estimated that for every $300,000 the government invests in a technology—roughly the size of two Phase I SBIR awards—one additional patent’s worth of technology will be created. And roughly three-quarters of this new output is due not to the firm that receives these funds but to other firms in the
same state. For every patent one would expect from an awardee, one also expects to see another 0.5 to 2.5 additional patents from spillovers. The net effect of these spillover calculations suggests that the “cost per patent” may be more than two-thirds lower than the cost that would be estimated by examining only the impact on the awardees themselves.
Geographic Distribution of Patent Outcomes
The committee also looked at the geographic distribution of SBIR/STTR firms that subsequently issue a patent, since patent issuance can be an intermediate step in the commercialization process. The committee matched SBIR/STTR awardee firm names to the U.S. Patent and Trademark Office’s patent database. A total of 166 patents were issued to SBIR/STTR recipient firms between 2007 and 2017. Figure 5-1 shows the geographic location of firms that issue patents frequently, with the size of the circle indicating the number of patents for awarded firms. It is important to note that large numbers of patents may not be the best indicator innovative quality. An established literature shows that forward citation frequency, or the number of citations a patent receives from subsequent patents, is a useful but noisy indicator of patent value. For instance, X-Ray Optical Systems, Inc. in New York has only three patents over the study period, but those patents have generated 34 forward citations. By contrast, Advanced Magnet Lab, Inc.’s 10 patents have generated only three forward citations. Awardees with the highest patent volume and quality tend to be located near large universities (Ann
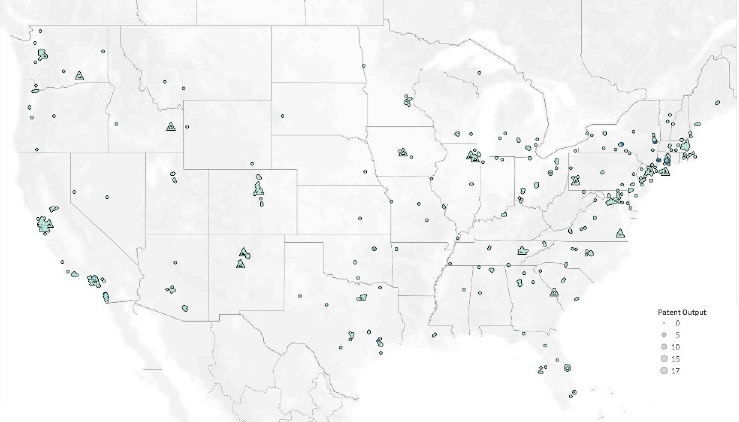
NOTE: Locations of DOE national labs are indicated by triangles.
SOURCE: Committee calculations based on data obtained from the Small Business Administration and from the U.S. Patent and Trademark Office.
Arbor, Michigan; Austin, Texas; and Boulder, CO, for example). Figure 5-1 also shows the familiar concentrations of patenting activity along the east coast corridor from Boston to Washington, DC, and on the west coast. Between the coasts, Colorado stands out with many high-quality patents produced by SBIR/STTR awardees.
COMMERCIALIZATION OUTCOMES
One of the challenges of assessing commercialization, and not just with regard to the SBIR/STTR or DOE SBIR/STTR programs, is that it is difficult to systematically observe the linkage between an R&D grant and commercialization outcomes. On the one hand, there are of course cases where there is a near-term translation of a technical breakthrough into a specific product sold on commercial markets; for example, Silicon Audio is a DOE SBIR awardee where the outcome included the development of a seismic sensor (fulfilling DOE mission needs) and the translation of that innovation into a successful business selling seismic sensors within the oil and gas industry (see Box 5-1). However, these fairly linear lab-to-market innovations are more the exception than the rule. For most innovations, the receipt of a SBIR/STTR award is likely to be but one element of a broader commercialization process that both will involve the need for additional private sector capital and will ultimately be reflected in firm sales and growth only over a long period of time. Of course, some of this commercialization process is captured within the application and grant of formal intellectual property such as patents over time, as discussed above.
Because DOE and the SBIR/STTR programs more generally collect little independent data about commercialization, the task of assessing the SBIR/STTR DOE programs on this dimension is challenging. This is, of course, a perennial challenge that transcends any one federal government agency. The committee is also mindful that certainly at the DOE SBIR/STTR Programs Office, and likely at other agency administrative offices, staff resources are already stretched, and adding a large data collection effort is likely not feasible. Despite these challenges, the committee sought to complement the patent-oriented analysis by considering a broader range of potential commercialization outcomes.
This section focuses in on three interrelated aspects of the commercialization process. First, it considers the relationship between the SBIR/STTR programs and follow-on private funding, specifically, venture capital, and examines evidence relating to the scaling of SBIR/STTR firms in terms of sales growth as well as the evolution of firm structure. Second, the section considers some exemplars of DOE SBIR/STTR commercialization outcomes by examining specific products and services achieved by awardees in areas related to their SBIR/STTR award. Finally, the section examines the impact associated with DOE SBIR/STTR awardees that were subsequently either designated as Tibbetts Award Winners (a premier retrospective designation of firms and projects that made extraordinary contributions through the SBIR/STTR programs across all agencies) or inducted, since 2011, into the SBIR Hall of Fame (an even more selective set of one or two individuals or companies each year that have made extraordinary contributions through the SBIR/STTR programs).
To understand the challenge of tracing out the commercialization impact of the DOE SBIR/STTR programs, it is useful to compare the differences between SBIR/STTR funding and private venture capital. As emphasized by Gans and Stern (2003), the SBIR/STTR programs tend to distribute R&D resources across a much wider range of industries and technologies than venture capital, and this focus on underserved technology areas (which help to address DOE mission objectives) may nonetheless be distant from large commercial markets with a high level of appropriability. Moreover, even in a strong commercialization environment, one anticipates that only a very small fraction of awardees will realize meaningful commercial success; innovation is an uncertain process with a highly skewed distribution of outcomes.
Despite this appropriability challenge, Lerner (2000) found evidence that SBIR awardees experienced more rapid sales growth than comparable firms, but only in zip codes and regions with a high level of venture capital. In other words, Lerner suggested that one of the key elements of translating an SBIR/STTR award into more traditional commercialization outcomes (i.e., sales) is through follow-on private capital financing. Howell (2017) examined this hypothesis directly in her study of DOE SBIR/STTR awardees compared to applicants who only narrowly missed receiving a grant. Howell documented that a DOE SBIR/STTR awardee between 1983 and 2013 had nearly twice the likelihood of receiving venture capital (going from 10 percent in the non-awardees to 19 percent in the awardees). Moreover, Howell (2017) provided evidence that revenue growth of
SBIR/STTR awardees that produced revenue tended to be higher than for firms that applied for program funds but did not receive an award. Specifically, among those firms that produced revenue, a DOE SBIR/STTR award was associated with a 30 percent increase in revenue.
Building on these careful empirical studies, the committee sought to examine the incidence rate of follow-on venture capital financing. Specifically, the committee examined the incidence rate of the receipt of venture capital by DOE SBIR/STTR awardees from 2005 to 2014. By focusing on this time period, the committee was able to gain a timely assessment of the incidence of private financing while still allowing for time to elapse from the time of an SBIR/STTR award for follow-on financing to be realized. The financing data were drawn from Crunchbase, a leading (though imperfect) data source for venture capital and private financing for start-ups more generally. For the purposes of the current analysis, Crunchbase likely is biased toward a significant underestimate of the incidence of follow-on financing. While the incidence rates of false positives are likely to be quite low (since a firm would not be observed raising private sector financing in Crunchbase unless a financing event had indeed occurred), Crunchbase reports will show a significant rate of false negatives. Also, although the primary financing event observed in Crunchbase is the receipt of venture capital, the committee examined any source of private-sector financing measured in Crunchbase, including angel funding and crowdfunding. Specifically, the committee calculated the fraction of firms that received a DOE SBIR/STTR award after 2004 and before 2015 and also received follow-on private financing (i.e., the financing occurs after the SBIR/STTR award), and arrived at an incidence rate of 6.5 percent. While this is significantly lower than the value reported in Howell (2017), we believe it provides evidence that a meaningful (though small) fraction of SBIR/STTR awardees ultimately receive follow-on private sector financing, which presumably is aimed at developing a concrete commercialization outcome associated with the firm’s innovation trajectory. Still, the low follow-on funding rate warrants further study, beyond the scope of this committee. Gaddy, Sivaram, and O’Sullivan (2016) found that venture capital did not invest in clean energy start-ups, because of the large upfront investment and the long time horizons for the returns. While the SBIR/STTR programs appear to be working, there is a need to understand the overall function of the U.S. energy innovation system.
The committee also used the Crunchbase database to undertake a more careful analysis attempting to identify key organizational differences between those companies that received SBIR/STTR funding but not venture capital, venture capital but not SBIR or STTR awards, and both SBIR/STTR awards and venture capital financing. Crunchbase provides key pieces of information about the top management team of each venture in its database, including the identity and role of the founders and the degree to which the firm features a “complete” management team (that is, with a wide range of functional positions, such as sales or marketing in addition to R&D). A few key statistics stand out from that analysis. First, relative to only-venture-backed firms, DOE SBIR/STTR-awarded firms were much more likely to have founder chief technology officers (38
percent) relative to non-SBIR/STTR Crunchbase-listed firms (23 percent). Second, over time, those firms that received venture capital were more likely to add structure and cohesion to their management team relative to SBIR/STTR awardees that did not receive venture capital. Research shows that firms founded by technologists without a fully defined and experienced management team have trouble attracting more broadly experienced executives for their management teams (Beckman and Burton, 2008). Moreover, these firms are slower to become public firms and have more trouble attracting venture capital than firms that are founded with a management team with broader experience (Beckman and Burton, 2008; Beckman, Burton, and O’Reilly, 2007). The committee undertook a simple hazard rate analysis of the degree to which functional roles in the management team are filled over time, and found a significant enhancement for the venture capital-backed firms relative to the SBIR/STTR-alone firms.
The committee then examined the range of products and services offered by DOE SBIR/STTR awardees. To do so, the committee took advantage of the existence of Phase III SBIR/STTR designees, which are a list of SBIR/STTR awardees who report work derived from SBIR/STTR grants but funded outside of the SBIR/STTR programs. Specifically, the DOE SBIR/STTR Programs Office has designated a set of firms to be in the category of SBIR/STTR Phase III “success stories,” which is reproduced in a summary form in Table 5-6.5 As of November 2019, 32 Phase III success stories are featured by DOE, ranging from solid oxide fuel cells (Precision Combustion) to lighter and stronger steel (Flash Steelworks). While the total number of such success stories is still small, this is not at all surprising since the SBIR/STTR programs provide funds at a very early stage of the innovation process, and only a very small fraction of innovation projects materialize into a product or service that can be concretely tied to the early-stage research funding. In other words, given that innovation commercialization process is skewed, it should not be surprising that there are only a small number of outlier successes from the programs.
To gain insight into the type of products and services commercialized by SBIR/STTR awardees, the committee examined several of these exemplar successes, including Silicon Audio (Box 5-1) and Kitware (Box 5-2). In each of these cases, the committee observed the significant gap between the innovation conducted within the SBIR/STTR programs and the ultimate technology that was ultimately included in the product or service developed. Even within the set of Phase III awardees, there was a significant range of “success” seen in the outcomes. While some firms serve a small number of customers and maintain a very small employment base, others have scaled their Phase III success: Kitware now has more than 100 employees, and Atlantia Offshore Limited links its SBIR research to a product line that has registered more than $700 million in sales.
___________________
5 Additional data on firms identified as success stories by DOE program managers are included in Table 4-7.
TABLE 5-6 DOE SBIR/STTR Phase III Success Stories
| Firm Name | Commercialized Product | Award Years | Total Number of DOE SBIR/STTR Awards | Total DOE SBIR/STTR Award Amount (Dollars) | Current Number of Employees | Location |
|---|---|---|---|---|---|---|
| Adelphi Technology Inc. | Neutron generators | 1984-2017 | 32 | 8,428,307 | 14 | Redwood City, CA |
| Advanced Conductor Technologies | Magnets for next generation fusion reactors and particle accelerators | 2012-2017 | 11 | 5,049,915 | 3 | Boulder, CO |
| Anasys Instruments | Measurement instrument for materials chemistry and topography | 2008-2018 | 15 | 7,134,747 | 34 | Santa Barbara, CA |
| Applied Nanotech, Inc. | Nanoparticle ink technology for solar cell wafers | 2000-2017 | 16 | 4,475,266 | 6 | Austin, TX |
| Clinical Micro Sensors | Molecular diagnostic systems | 1994-1995 | 2 | 825,000 | 0 | Pasadena, CA |
| Daylight Solutions, Inc. | Sensors and imaging for industrial applications | 2006-2012 | 3 | 949,916 | 17 | Poway, CA |
| Dirac Solutions, Inc. | Battery-free RFIDs for secure communications | 2011-2017 | 5 | 2,438,116 | 8 | Pleasanton, CA |
| Euclid Techlabs | Particle accelerators for high energy and nuclear physics applications | 2002-2017 | 69 | 25,800,000 | 17 | Solon, OH |
| Faraday Technology, Inc | Electro-polishing technology for use in high-performance particle accelerators | 2001-2019 | 38 | 13,431,231 | 175 | Englewood, OH |
| Flash Steelworks, Inc. | sSeel conversion process | 2014-2019 | 4 | 2,100,000 | 3 | Washington, MI |
| Giner, Inc. | On-site hydrogen refueling stations | 1983-2017 | 55 | 17,900,000 | 60 | Newton, MA |
| Ion Engineering LLC | 3D printing for carbon capture | 2012-2015 | 4 | 1,375,408 | 9 | Boulder, CO |
| Innosense LLC | Cybersecurity for high speed computing networks | 2004-2017 | 40 | 17,352,927 | 20 | Torrance, CA |
| Kitware | Open source software for HPC modeling and simulation for SME | 1998-2017 | 32 | 15,000,000 | 132 | Clifton Park, NY |
| KMLabs | Nanofabrication tools | 2002-2017 | 22 | 8,932,096 | 35 | Boulder, CO |
| Lucent Optics, Inc. | Lighting conversion technology to improve efficiency in buildings | 2016-2019 | 2 | N/A | N/A | Sacramento, CA |
| Natel Energy, Inc. | Turbine technology for hydropower | 2010-2010 | 2 | 1,062,461 | 5 | Alameda, CA |
| Optimal Solutions Inc. | Software for managing supply chains | 2012-2017 | 4 | 1,529,999 | 6 | Bridgewater, NJ |
| Phosphortech | High light extraction photonic materials and color conversion film nanostructures | 2003-2018 | 11 | 3,748,327 | 10 | Kennesaw, GA |
| Precision Combustion, Inc. | Nanowire chemical sensing technology | 1992-2017 | 36 | 13,340,053 | 44 | North Haven, CT |
| Radiation Monitoring Devices, Inc. | Monitoring unauthorized nuclear materials | 1983-2017 | 260 | 92,000,000 | 86 | Watertown, MA |
| Reservoir Labs, Inc. | Cybersecurity for high speed computing networks | 2004-2017 | 20 | 9,886,880 | 31 | New York, NY |
| Resolute Marine Energy | Desalination technology | 2009-2017 | 4 | 1,399,843 | 5 | Boston, MA |
| Silicon Audio LLC | Seismic sensors for seismic events or nuclear explosion | 2008-2016 | 4 | 1,987,066 | 10 | Austin, TX |
| Firm Name | Commercialized Product | Award Years | Total Number of DOE SBIR/STTR Awards | Total DOE SBIR/STTR Award Amount (Dollars) | Current Number of Employees | Location |
|---|---|---|---|---|---|---|
| Sinode Systems, Inc. | Faster and longer charges for lithium-ion batteries | 2013-2014 | 2 | 1,150,000 | 10 | Chicago, IL |
| Skutek Instrumentation | Multichannel digitizer for experiments in nuclear physics | 2003-2017 | 7 | 3,530,953 | 3 | West Henrietta, NY |
| Subsurface Insights | Cloud-based cyberinfrastructure for optimal use of subsurface resources | 2013-2017 | 13 | 5,574,989 | 8 | Hanover, NH |
| Tech-X Corporation | High performance computational software | 1994-2017 | 216 | 71,900,000 | 35 | Boulder, CO |
| Telescent, Inc. | Robotic fiber optic cross-connect | 2009-2017 | 7 | 4,364,459 | 11 | Santa Monica, CA |
| Tetramer Technologies | Polymer-based security tag technology | 2011-2019 | 16 | 8,429,197 | 34 | Pendleton, SC |
| United Silicon Carbide, Inc. | Power conversion circuits | 1999-2017 | 9 | 4,724,864 | 26 | Monmouth Junction, NJ |
| Xia LLC | Radiation digitizers for spectroscopy | 1990-2017 | 42 | 14,300,000 | 18 | Hayward, CA |
SOURCE: Department of Energy, “SBIR/STTR Phase III Success Stories,” https://science.osti.gov/sbir/SBIR-STTR-Success-Stories.
Finally, the committee undertook an examination of those SBIR/STTR firms that were designated as either Tibbetts Award or Hall of Fame awardees by the Small Business Administration. The aim of the Tibbetts Awards are to “recognize . . . firms or projects that made a visible technological impact on the socio-economic front and exemplify the very best in SBIR achievements” (SBA, n.d.e). We identified 22 Tibbetts Awards among DOE awardees (a rate of 0.9 percent), as well as one Hall of Fame awardee (Atlantia Offshore Limited). All DOE Tibbetts Award winners are listed with short descriptors in Table 5-7.
Analysis of the Tibbetts Award winners highlights the striking gap between what might be considered a “success” within the objectives and priorities of the SBIR/STTR programs and according to more traditional metrics of venture success (such as medium-term equity growth as realized by an initial public offering (IPO) or significant acquisition). The committee examined whether SBIR/STTR awardees that received a patent (a traditional measure of innovation potential and prospects for commercialization) were more or less likely to receive a Tibbetts Award. As background, prior findings in the entrepreneurship literature suggested that the receipt of formal intellectual property in the form of a patent is closely associated with both the probability of venture capital financing and subsequent firm growth (Hsu and Ziedonis, 2008; Farre-Mensa, Hegde, and Ljungqvist, 2019; Catalini, Guzman, and Stern, 2019). However, an examination of the groups of firms that the Small Business Administration identified as most contributive to the DOE SBIR/STTR programs through the Tibbetts designation shows a negative correlation between Tibbetts Award designation and patenting.
TABLE 5-7 Tibbetts Award Winners among DOE SBIR/STTR Awardees
| Company | Year of Tibbetts Award | Number of SBIR/STTR Awards Received | Number of DOE SBIR/STTR Awards Received |
|---|---|---|---|
| Applied Science and Technology | 1996 | 21 | 5 |
| TPL, Inc. | 1996 | 225 | 27 |
| National Recovery Technologies, LLC | 1996 | 55 | 8 |
| Atlantia Offshore Limited | 1997 | 2 | 2 |
| Redzone Robotics Inc. | 1998 | 14 | 2 |
| CHA, Corp. | 1998 | 16 | 2 |
| Droplet Measurement Technologies, Inc. | 1999 | 1 | 1 |
| Fuelcell Energy, Inc. | 2000 | 54 | 34 |
| Stirling Technologies Inc. | 2001 | 2 | 2 |
| Integrated Sensors, LLC | 2001 | 10 | 8 |
| Creare, LLC | 2002 | 1080 | 62 |
| UES, Inc. | 2002 | 269 | 38 |
| Square One Systems Design | 2006 | 20 | 8 |
| Jentek Sensors, Inc. | 2006 | 100 | 10 |
| Aspen Systems, Inc. | 2006 | 124 | 22 |
| Alchem Field Services, Inc. | 2006 | 2 | 2 |
| A123 Systems | 2011 | 2 | 2 |
| Ocean Renewable Power Company, LLC | 2013 | 3 | 3 |
| Protochips, Inc. | 2013 | 4 | 2 |
| SFP Works | 2016 | 3 | 3 |
| Niowave, Inc. | 2016 | 49 | 46 |
| Exelus, Inc. | 2016 | 39 | 25 |
| Mikro Systems, Inc. | 2016 | 45 | 7 |
SOURCE: Small Business Administration.
Specifically, the committee undertook a series of analyses that used a logit regression procedure to assess the relationship between the cumulative number of patents (and publications) and the likelihood of receiving a Tibbetts Award (controlling for various other observable factors); by and large, there was a negative and significant impact of patenting on that likelihood. Instead, many of these exemplar companies seem to be focused on relatively narrow technical
markets, and may achieve their success through close collaboration with industrial customers as well as government labs.
Consider the firm Niowave, which is a 2016 Small Business Administration Tibbetts Award winner which received 46 DOE SBIR/STTR awards between 2007 and 2017. Located in Lansing, MI, the company was named the 2010 SBIR/STTR Small Business of the Year for DOE. While it is not listed in the Crunchbase database, the committee conducted research on the company on the open web. It was founded in 2005 by former National Superconducting Cyclotron Laboratory researcher, Terry Grimm, and its products span the domains of materials, superconducting magnets, testing equipment, and other equipment for an application in cryogenics, but the primary activity of the company is building and supplying electron accelerators. This company’s top management is dominated by PhDs in nuclear engineering and nuclear physics (four out of six listed key personnel, with the remaining two individuals possessing bachelor’s degrees in engineering). According to the data provider Pitchbook, Niowave has raised $5 million in angel financing (and we were unable to garner any information about the possible valuation of the company). It appears that Niowave has been a product-oriented company which has been recognized as an exemplar of the SBIR/STTR programs, but which is not in the “unicorn” valuation domain.6
To summarize these results, the committee built on an accumulative body of evidence to find evidence for the association between participation in the DOE SBIR/STTR programs and subsequent commercialization outcomes. On the one hand, only a small number of SBIR/STTR awardees receive venture capital, but the probability of receiving venture capital is higher after an SBIR/STTR award (Howell, 2017). Moreover, this relatively low incidence rate of venture capital financing may reflect differences between the objectives and structure of SBIR/STTR awardee companies. For example, SBIR/STTR awardee companies are much more likely to maintain a smaller and more technical executive management team, with less emphasis on expanding the management structure to be more similar to the traditional venture-backed firm. A significant number of SBIR/STTR awardees are linked to meaningful commercial products and services, only a subset of which are captured through a designation as a Phase III awardee. Beyond simply documenting that commercial products and services are one output of the programs, the analysis highlights the highly skewed nature of the commercialization outcomes, with only a very small number of successes likely accounting for the bulk of the commercial (as opposed to mission-oriented) impact of the programs. These results are further reinforced by the analysis of the Tibbetts Award winners, where a negative relationship between patenting and being designated as among the most impactful firms in the DOE SBIR/STTR programs is documented.
___________________
6 In business, a unicorn often refers to a start-up with a $1 billion valuation.
FIRM DEMOGRAPHICS AND EMPLOYMENT GROWTH
As a third element of the analysis, the committee examined firm employment outcomes for DOE SBIR/STTR award winners. As emphasized in earlier chapters, the SBIR/STTR programs are not designed by statute to be direct jobs programs. While commercialization activities such as those described above likely result in increased firm-level employment (at least in many cases), in other cases the employment impact of the SBIR/STTR programs might be quite modest. For example, it is possible that commercialization may be achieved through a partnership with an established player; while this may have a significant impact on introducing a new innovation to the marketplace, it might have zero (or even a negative) impact on the head count of the SBIR/STTR awardee. Despite these caveats, the committee sought to assess the employment impact of the programs to the extent possible in line with the Statement of Task (Box 1-1).
Two members of the committee along with a committee consultant undertook a detailed analysis of the employment outcomes associated with SBIR/STTR grants (Lanahan, Joshi, and Johnson, 2019). These authors combined data from several sources in order to (a) identify the set of firms receiving SBIR/STTR awards across the top five federal agencies providing SBIR/STTR support, (b) identify a set of similar firms that expressed an interest in interacting with the federal government as indicated by their inclusion in the System for Award Management (SAM) database, and (c) track employment and other firm outcomes for all these firms over time using information available through the National Establishment Time-Series database.7 Importantly, the use of a set of “control” firms that also expressed interest in contracting with the federal government provided a useful benchmark from which to evaluate the growth of firms receiving an SBIR/STTR award. Of course, not all of the firms in the control group were interested specifically in the SBIR/STTR programs, but they nonetheless offer a constructive group from which baseline comparisons can be made. The authors were judicious in the use of the National Establishment Time-Series database insofar as the coverage in that database for small and young firms may be less complete than for larger or more established entries. Therefore, the authors focused on those employment outcomes that were directly verified (rather than imputed), raising confidence in the comparisons being calculated. Although Lanahan, Joshi, and Johnson (2019) offered an integrated assessment of SBIR/STTR programs across five federal agencies, this section discusses only their conclusions regarding DOE’s programs. (Summary statistics are shown in Table 5-8.)
The first set of findings concerns a set of firm demographics. While the DOE SBIR/STTR programs do not use firm age as a criterion for allocating awards, Lanahan, Joshi, and Johnson’s analysis showed that more than half of the recipients were less than five years old when they received their first
___________________
7 See Lanahan, Joshi, and Johnson (2019) for more details.
TABLE 5-8 DOE SBIR/STTR Awardee Characteristics, from FY 1989 to FY 2014
| Count | mean | sd | min | max | |
|---|---|---|---|---|---|
| Year the the firm won its first award | 1,310 | 2,002.14 | 7.43 | 1,989 | 2,014 |
| Minority- or woman-owned (%) | 1,310 | 0.22 | 0.42 | 0 | 1 |
| EPSCoR state (%) | 1,310 | 0.12 | 0.33 | 0 | 1 |
| Northeast (%) | 1,310 | 0.21 | 0.41 | 0 | 1 |
| Midwest (%) | 1,310 | 0.16 | 0.36 | 0 | 1 |
| South (%) | 1,310 | 0.26 | 0.44 | 0 | 1 |
| West (%) | 1,310 | 0.37 | 0.48 | 0 | 1 |
| NAICS 3-digit, 541 (%) | 1,310 | 0.51 | 0.5 | 0 | 1 |
| NAICS 3-digit, 334 (%) | 1,310 | 0.11 | 0.32 | 0 | 1 |
| NAICS 3-digit, 561 (%) | 1,310 | 0.06 | 0.23 | 0 | 1 |
| NAICS 3-digit, 339 (%) | 1,310 | 0.01 | 0.1 | 0 | 1 |
| NAICS 3-digit, 325 (%) | 1,310 | 0.04 | 0.2 | 0 | 1 |
| NAICS 3-digit, 711 (%) | 1,310 | 0.02 | 0.14 | 0 | 1 |
| NAICS 3-digit, 423 (%) | 1,310 | 0.03 | 0.17 | 0 | 1 |
| Exit by age 5 (%) | 1,310 | 0.04 | 0.2 | 0 | 1 |
| Exit by 2015 (%) | 1,310 | 0.11 | 0.31 | 0 | 1 |
| Number of employees by age 2 | 1,310 | 7.02 | 19.42 | 1 | 300 |
| Number of employees by age 5 | 1,162 | 9.37 | 21.72 | 1 | 300 |
| Number of employees by age 10 | 826 | 15.24 | 27.16 | 1 | 325 |
| Number of employees by age 15 | 525 | 25.72 | 92.72 | 1 | 1,983 |
| Number of employees by first SBIR/STTR award | 1,116 | 10.5 | 22.58 | 1 | 205 |
| Total number of federal contracts by age 2 | 1,310 | 0.03 | 0.17 | 0 | 3.62 |
| Total number of federal contracts by age 5 | 1,162 | 0.41 | 1.33 | 0 | 21.65 |
| Total number of federal grants by age 2 | 1,310 | 0.04 | 0.21 | 0 | 3 |
| Total number of federal grants by age 5 | 1,162 | 0.37 | 2.79 | 0 | 91.28 |
| Total number of federal loans by age 2 | 1,310 | 0 | 0.05 | 0 | 1 |
| Total number of federal loans by age 5 | 1,162 | 0.01 | 0.09 | 0 | 2 |
| Number of observations | 1,310 |
NOTES: Age refers to number of years since a firm was founded. EPSCoR = Established Program to Stimulate Competitive Research.
SOURCE: Committee calculations based on Lanahan, Joshi, and Johnson (2019).
SBIR/STTR award (and less than 10 percent of the awardees were more than 15 years old). Figures 5-2 and 5-3 present the distribution of award winners from FY 2001 to 2015.
Second, without reference to a control group, employment for DOE SBIR/STTR awardees grows over time, and younger firms are more likely to generate employment growth following receipt of an SBIR/STTR award. This chapter examines employment change taking into account the year the firm receives its first SBIR/STTR award. Moreover, the analysis is bifurcated to Younger Firms and Older Firms based on the age of the firm when it received its first SBIR/STTR award. Among firms that receive their first SBIR/STTR award at a young age (by age 2) the average firm has 2.5 employees (standard deviation (sd.) 1.81). Tracing these firms following SBIR/STTR receipt to age 5 (corresponding to three years post award), the average firm has 4.4 employees (sd. 6.49). Among firms that receive their first SBIR/STTR award at an older age (after age 3), the average firm has 4 employees the year prior to receiving the award (standard deviation 5.87). Tracing these firms three years following SBIR/STTR receipt, the average firm had six employees (standard deviation 8.36).
Simply looking at employment changes in the SBIR/STTR recipients, however, does not represent a causal picture of job creation associated with SBIR/STTR. Instead, one needs to compare SBIR/STTR firms to firms that did not get these awards to see the difference in employment growth. This is a difficult task given the obvious differences between firms that select in to SBIR/STTR and those that do not. Lanahan, Joshi, and Johnson (2019) constructed a “control” group to represent the counterfactual scenario of what awardees’ employment growth would have looked like had they not received an SBIR/STTR grant. This is a group of similarly sized firms that have also expressed interest in receiving grants, contracts, or loans with the federal government but have not received SBIR/STTR grants. Prior to assessing employment differences between the set of firms that received the DOE SBIR/STTR award and the control group of comparable firms that never received an SBIR/STTR award, Lanahan, Joshi, and Johnson matched the firms in the two groups along observable features. This included the following measures: founding year, three-digit NAICS code (North American Industry Classification System) (analogous to industrial classification), proximate economic activity at the county level, state-level EPSCoR (Established Program to Stimulate Competitive Research) status, prior federal transaction activity (including contracts, grants, and loans), and sales (where data are available). Based on these matching specifications, compared to the control group, the committee did not find evidence that DOE SBIR/STTR recipient firms grew at a differential rate. In other words, we were unable to confirm that the firm growth observed between the pre- and post- treatment period can be attributed to the SBIR/STTR award.
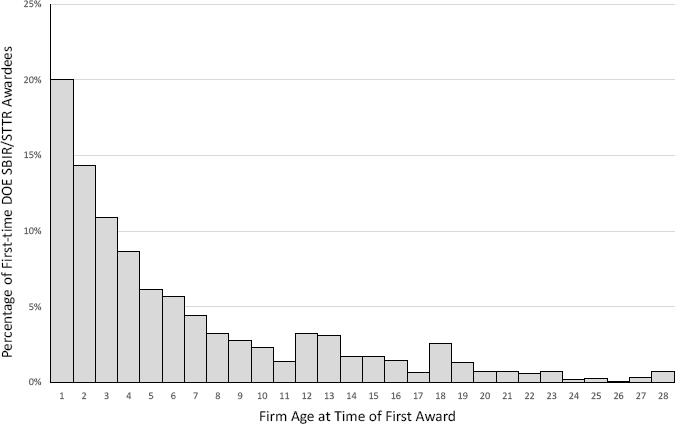
NOTE:Age indicates number of years since founding.
SOURCE: Committee calculations based on data obtained from the Small Business Administration.
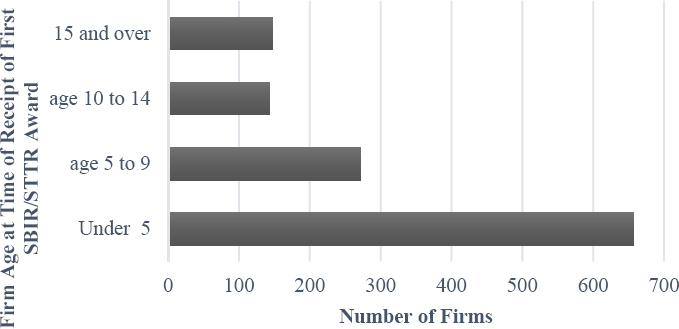
SOURCE: Committee calculations based on data obtained from the Small Business Administration.
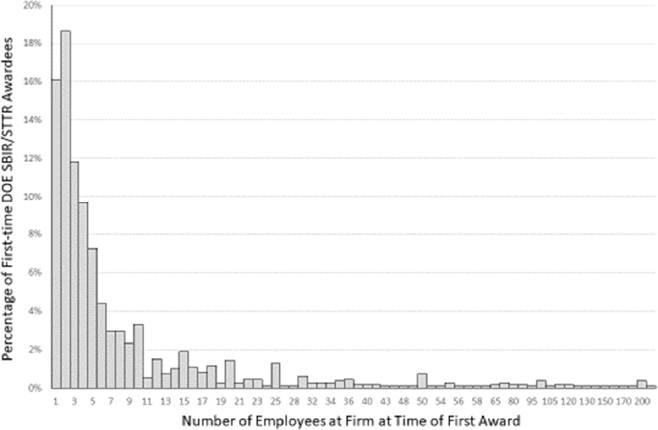
SOURCE: Committee calculations based on Lanahan, Joshi, and Johnson (2019).
However, given that our sample was restricted to DOE awardees with suitable matched control firms, and since the rich set of matching variables used to create the control group meant that many potential control group firms could not be included (in part) because data points were lacking, this analysis lacked sufficient statistical power to determine broader trends. Moreover, consistent with the committee’s findings related to commercialization, it is possible that a very small number of outlier firms account for disproportionate employment growth outcomes, which might be difficult to capture in an assessment of the average impact of the programs on the average firm. Table 5-9 displays DOE SBIR/STTR award recipients with the highest employment levels as of 2018. This illustrates that a small number of firms may generate enough jobs impact to completely wash out a small negative average effect, particularly if the rates of growth for such firms are much higher than the average.
Though the committee identified neither a negative nor positive employment effect for DOE SBIR/STTR grantees, the broader results obtained by Lanahan, Joshi, and Johnson (2019) are instructive. Specifically, looking across five mission agencies (including DOE), they found that the SBIR/STTR programs corresponded to an average decrease in direct employment relative to observationally equivalent firms that did not avail themselves of the programs. However, considering economic factors beyond direct measures of employment—by directing attention to the research orientation of the firm and
TABLE 5-9 Employment Skew: DOE SBIR/STTR Award Recipients with Highest Employment
| Number of Employees at Firm’s Age 10 | Company Name | City | State |
|---|---|---|---|
| 60 | Gevo Inc. | Englewood | CO |
| 66 | Xradia | Concord | CA |
| 69 | Plextronics | Pittsburgh | PA |
| 74 | Specialty Materials, Inc. | Lowell | MA |
| 76 | Daylight Solutions | Poway | CA |
| 80 | Agiltron, Inc. | Winchester | MA |
| 98 | Heliovolt Corp. | Austin | TX |
| 115 | Masstech, Inc. | Columbia | MD |
| 115 | Harmonia Holdings Group, LLC | Blacksburg | VA |
| 120 | Luminus Devices, Inc. | Billerica | MA |
| 140 | Aspen Aerogels, Inc. | Marlborough | MA |
| 180 | nLight Photonics | Vancouver | WA |
| 192 | Nanosolar, Inc. | Palo Alto | CA |
SOURCE: Committee calculations based on Lanahan, Joshi, and Johnson (2019).
examining the role of partnership and agglomeration economies—they found that the programs may produce economic growth by other means, including federal procurement.
Finally, it is useful to offer some important caveats to the committee’s analysis, due to data limitations and the nature of the problem being studied. First, the committee was unable to gain access to data that allowed for comparison of employment outcomes for those firms that received grants versus those that applied to DOE SBIR/STTR specifically but did not receive an award. Second, the fact that DOE SBIR/STTR firms start small and by and large remain small is consistent with the analysis in Chapters 2 and 3 identifying the important role of SBIR/STTR awardees in serving DOE’s R&D needs, rather than focusing specifically on firm-level employment growth. Indeed, the qualitative evidence in Chapter 3 suggests that the bulk of employment in SBIR/STTR firms are “good jobs,” with firms having a strong focus on R&D and a reliance on highly skilled individuals with specialization knowledge and education, and it is likely that these firms are associated with higher wages than those in the control sample in Lanahan, Joshi, and Johnson (2019). Finally, this analysis does not directly capture any indirect employment effects of the programs, for example, through partnerships with universities. Notably, STTR requires at least 30 percent of total
funding to be allocated in this way. For a Phase II award, this amounts to roughly $300,000 per company for hiring consultants, contractors, and others at a partnering institution. It is reasonable to assume that this large amount of incentivized (SBIR) or required (STTR) contracting is displacing direct expenditures on internal employees, which would explain a lower rate of job growth for awardees versus otherwise similar non-awardees. This is an important caveat in any assessment of direct employment outcomes for SBIR/STTR. The programs’ structure necessitates a shift away from direct hiring and toward indirect job creation through partnerships.
Taken together, these results provide evidence consistent with one of the overall findings of this study: most DOE SBIR/STTR awardees are small and young firms that by and large remain small, and most program awardees are consistently relatively young (i.e., there seems to be significant turnover over time in which firms receive awards). While the average DOE SBIR/STTR firm does grow modestly after the time of its award, that growth is similar to that observed by other firms with similar characteristics that also express interest in contracting with the federal government. Finally, consistent with the evidence from the committee’s innovation and commercialization analyses discussed earlier in this chapter, there is a small number of larger outlier firms that are associated with significant increases in employment. While, because of their small numbers, these outlier firms are difficult to capture in a traditional impact analysis, tracking the skewed nature of outcomes over time is an important priority for future study.
FINDINGS
Finding 5.1: The DOE SBIR/STTR programs stimulate technological innovation and contribute to DOE R&D needs.
Finding 5.2: SBIR/STTR awardees perform technical research that is usually distant from commercialization but closely connected to DOE R&D needs. The management teams of SBIR/STTR awardees tend to have technical rather than commercial backgrounds.
Finding 5.3: DOE’s SBIR/STTR programs enable a measurable level of innovation that creates formal intellectual property by private-sector innovators. This occurs through a direct impact on awardees and indirectly through the stimulation of complementary innovation.
Finding 5.4: A small number of SBIR/STTR awardees ultimately achieve significant employment growth. There was no evidence of a statistically significant difference in employment growth between DOE SBIR/STTR-awarded firms and non-awarded firms.
Finding 5.5: DOE’s SBIR and STTR programs are effective at funding small businesses that provide research and innovation in the energy sector.
RECOMMENDATIONS
Recommendation 5.1: Congress should consider allowing firms to use commercialization assistance funds to hire in-house marketing and business expertise. Moreover, Congress should consider increasing the amount of funding available for commercialization assistance provided in conjunction with Phase I awards.
Recommendation 5.2: The DOE SBIR/STTR Programs Office should develop better metrics of potential commercialization by applicants and commercialization outcomes by awardees.
This page intentionally left blank.


