
4
The Landscape of DOE SBIR/STTR Awardees
This chapter focuses on the geographic landscape of DOE’s SBIR/STTR-winning firms, especially for woman-owned firms, firms owned by persons from socially and economically disadvantaged groups, first-time SBIR/STTR winners, and multiple-award recipients (MARs).1 The aim is to provide descriptive data about the location of these firms, especially compared to the location of the DOE national laboratories and other research institutions. Many young and small companies form around ideas that originated in university labs and research institutes, federal government labs, and the research and development (R&D) labs of larger companies. Rather than being spread across the United States, these institutions and their related expertise are geographically concentrated in a few locations. This chapter, in addition to providing descriptive statistics on location, examines collaborations between firms that receive SBIR/STTR awards and research institutions.
The results show little evidence of clustering of award activity around DOE national labs, which is corroborated by descriptive evidence from STTR collaborations showing that firms appear to be willing to partner with research institutions that are geographically distant. However, a small number of U.S. states still win the vast majority of awards, and there has been little change in this trend over time. Moreover, the share of awards going to woman-owned firms has not increased since fiscal year (FY) 2005, and the share of awards going to firms owned by persons from socially and economically disadvantaged groups has declined.
The committee also investigated the role of MARs. A sizeable fraction of funding goes to small firms that receive multiple awards over time, although the number has declined since the programmatic change in 2012. The committee
___________________
1 While the committee used the Small Business Administration’s “socially and economically disadvantaged” designation selected by firms when completing their SBIR/STTR applications, the committee finds this designation to be problematic and unhelpful and recommends the use of “underrepresented minority” in future data collection efforts.
found evidence that these firms may play an important role in achieving the agency’s missions.
TRENDS IN DISTRIBUTION OF AWARDS ACROSS STATES
DOE awarded 11,999 SBIR or STTR projects since the program’s inception in 1983, of which 29.4 percent were Phase II awards.2 This chapter focuses on awards in the FY 2005-2017 timeframe, for several reasons. First, this is a more recent period of activity, and previous DOE SBIR/STTR reports have examined prior trends. Second, program operations changed with the 2012 reauthorization, roughly midway through the timeframe considered here. Finally, data on demographic characteristics were reliably collected after 2004, making consideration of trends for underrepresented groups available only after 2005.
DOE awarded funding to 6,040 SBIR or STTR projects from FY 2005 through FY 2017. SBIR/STTR award data were geocoded for the address of each recipient firm. Figure 4-1 depicts the geographic distribution of these 6,040 DOE SBIR/STTR awards.
Figure 4-1 shows a fairly wide spatial distribution of firms, with all of the lower 48 states represented. Firms located in three states—California, Massachusetts, and Colorado—received 44 percent of DOE’s SBIR/STTR awards. These states are also the location of DOE national labs and prominent
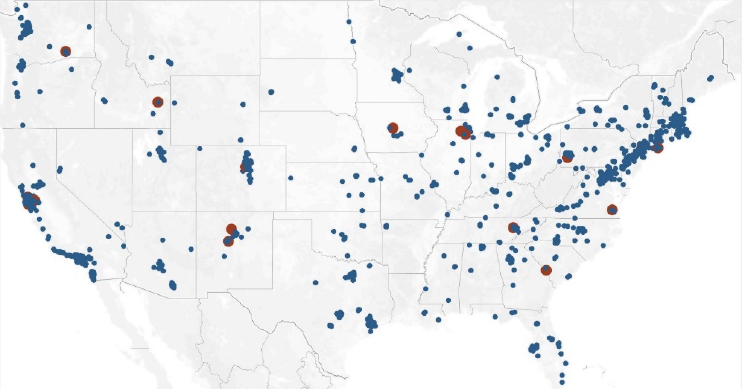
NOTE: Red dots indicate the locations of DOE national laboratories.
SOURCE: Committee calculations based on data obtained from the Small Business Administration.
___________________
2 According to the committee’s calculation in April 2018.
universities with substantial investments in energy research. Less than 1 percent of awards went to firms located in the bottom 10 states, and DOE has consistently awarded about half of its total awards to five states. Figures 4-2 and 4-3 show the distribution of awards across states that earned at least 1.5 percent of total award volume within a given year. The distribution is broken into two distinct time periods to illustrate that there is little variation in the trend of heavy concentration of award volume among a small number of states.
The distribution of first-time award recipients also varies across states. Awardee firms in from the highest awardee states tend to be previous award winners, not new SBIR/STTR recipients. Very few awards granted in SBIR/STTR-heavy states are first-timers. The opposite trend holds for the states winning the lowest numbers of awards. For example, since FY 2005 South Carolina, South Dakota, and Rhode Island have been among the bottom 10 states by total award volume. However, DOE has awarded more than 40 percent of total awards in those states to first-time winners. In the top three states (California, Colorado, and Massachusetts) that proportion is typically between five and 10 percent.
Locations of the Small Business Administration’s SBIR/STTR informational roadshows were analyzed to see whether there was an increase in the diversity of the awardee firms. The committee’s analysis did not reveal any
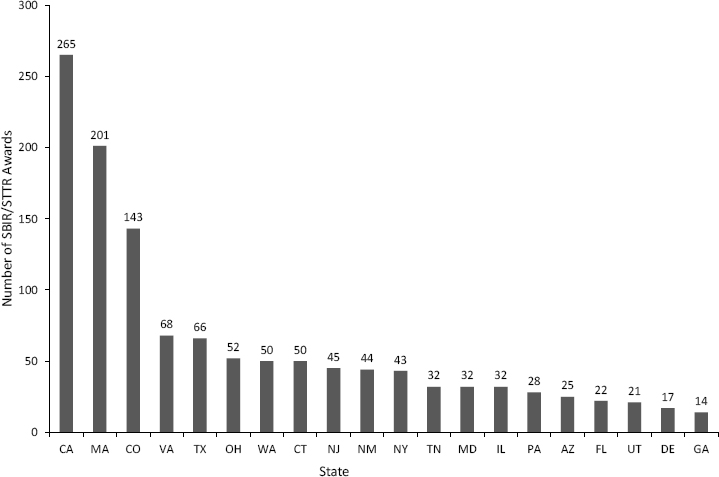
SOURCE: Committee calculations based on data obtained from the Small Business Administration.
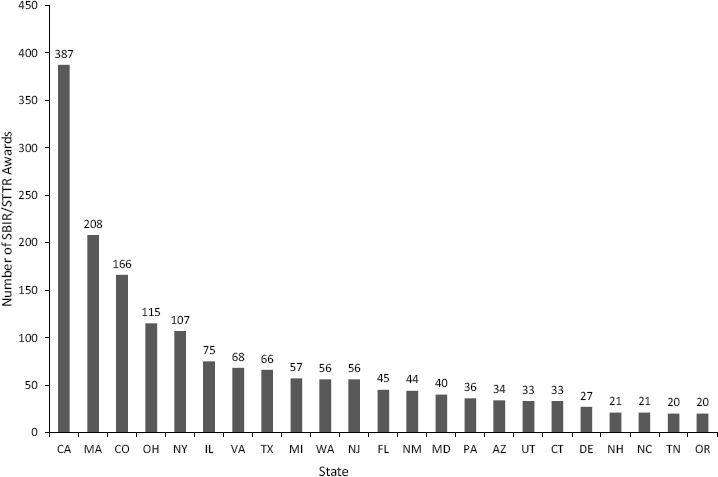
SOURCE: Committee calculations based on data obtained from the Small Business Administration.
evidence that these events generate more awards to underrepresented groups.3 The committee cannot comment on whether these events increased the diversity of the applicant pool because it did not have information on unsuccessful applications.
The committee also examined the locations of woman-owned and minority-owned firms that received SBIR/STTR awards. As discussed in Chapter 3, the share of total DOE SBIR/STTR awards granted to woman-owned firms has remained below 12 percent since FY 2005.4 Awards to underrepresented minority groups have dropped significantly over the same period, hovering near 5 percent since FY 2008. Numbers of awards to woman- or underrepresented minority-owned firms by region are very small, and there are no statistically significant differences in the location of awardee firms owned by women or underrepresented minorities and others.
The committee also looked at differences in the distribution of awards across DOE’s program offices. Table 4-1 displays the number of SBIR/STTR
___________________
3Chapter 3 provides an overview of efforts by DOE to increase the number of awards to firms owned by women or underrepresented minorities. See the section “Diversity and Inclusion.”
4 Data were drawn from self-reported documentation from awardees provided at SBA.gov. The committee wishes to note that it is highly unlikely that reporting for woman-ownership is accurate given the dramatically low numbers of awards to women in certain years. For example, DOE appears to have awarded just two awards to woman-owned companies in 2008 and five in 2009.
awards to woman-owned firms by program office from FY 2005 to FY 2017.5Table 4-2 shows program office–specific awards to businesses owned by persons from socially and economically disadvantaged groups. Both tables illustrate the pronounced concentration of awards among men and applicants not from socially and economically disadvantaged groups. While there is some variation in office-level allocations of awards to these underrepresented groups, all offices awarded at least 80 percent of total award volume (most are over 90 percent) to firms owned by white men.
TABLE 4-1 DOE SBIR/STTR Awards to Woman-owned Firms by Program Office, FY 2005-2017
| Program Office | Total Number of Awards | Awards to Woman-owned Firms | |
|---|---|---|---|
| Number | Percentage | ||
| Office of Basic Energy Sciences | 1,056 | 39 | 3.69 |
| Office of Energy Efficiency and Renewable Energy | 721 | 38 | 5.27 |
| Office of High Energy Physics | 583 | 17 | 2.92 |
| Office of Biological and Environmental Research | 445 | 32 | 7.19 |
| Office of Fossil Energy | 348 | 36 | 10.34 |
| Office of Nuclear Physics | 347 | 13 | 3.75 |
| Office of Advanced Scientific Computing Research | 330 | 23 | 6.97 |
| Office of Fusion Energy Sciences | 217 | 17 | 7.83 |
| Office of Defense Nuclear Nonproliferation | 192 | 8 | 4.17 |
| Office of Nuclear Energy, Science and Technology | 181 | 5 | 2.76 |
| Office of Electricity Delivery and Energy Reliability | 85 | 11 | 12.94 |
| Office of Environmental Management | 28 | 0 | 0.00 |
| Total | 4,533 | 239 | |
SOURCE: Committee calculations based on data obtained from the Small Business Administration.
___________________
5 Data limitations reduce the count of awards available for complete case analysis. These limitations arise from two sources: (1) we were unable to obtain program office data for 681 out of 6138 awards; and (2) 1562 awards from the same period went to firms that did not report DUNS (Data Universal Numbering System) numbers in their applications. Since we used the DUNS number as a key link to additional databases, we excluded firms with missing DUNS from our assessment of program office award densities.
TABLE 4-2 DOE SBIR/STTR Awards to Firms Owned by Persons from Socially and Economically Disadvantaged Groups, by Program Office, FY 2005-2017
| Program Office | Total Number of Awards | Awards to SED-owned Firms | |
|---|---|---|---|
| Number | Percent | ||
| Office of Basic Energy Sciences | 1,056 | 51 | 4.83 |
| Office of Energy Efficiency and Renewable Energy | 721 | 42 | 5.83 |
| Office of High Energy Physics | 583 | 44 | 7.55 |
| Office of Biological and Environmental Research | 445 | 18 | 4.04 |
| Office of Fossil Energy | 348 | 31 | 8.91 |
| Office of Nuclear Physics | 347 | 29 | 8.36 |
| Office of Advanced Scientific Computing Research | 330 | 18 | 5.45 |
| Office of Fusion Energy Sciences | 217 | 11 | 5.07 |
| Office of Defense Nuclear Nonproliferation | 192 | 4 | 2.08 |
| Office of Nuclear Energy, Science and Technology | 181 | 7 | 3.87 |
| Office of Electricity Delivery and Energy Reliability | 85 | 7 | 8.24 |
| Office of Environmental Management | 28 | 0 | 0.00 |
| Total | 4,533 | 262 | |
NOTE: SED = socially and economically disadvantaged.
SOURCE: Committee calculations based on data obtained from the Small Business Administration.
Figure 4-1 indicates spatial concentrations of SBIR/STTR awardees in certain locations in the United States. These spatial concentrations might occur as the result of proximity to research universities or other research hubs; partnerships that form in response to an awardee’s relationship with a program office or national lab; or state and local policies such as SBIR/STTR matching programs that encourage SBIR/STTR participation. The DOE national laboratories and technology centers are a system of 17 facilities and laboratories overseen by DOE for the purpose of advancing science and technology to fulfill the DOE mission; 16 of them are federally funded research and development centers administered, managed, operated, and staffed by private-sector organizations under management and operating contract with DOE. The National Energy Technology Laboratory, located in Pittsburgh, PA; Morgantown, WV; and Albany, OR; are
government operated. The DOE national labs conduct wide-ranging R&D on clean energy, national security, supercomputing, nanotechnology, materials, and other scientific and engineering research (Palmintera and Porter, 2016).
The committee conducted a nearest-neighbor analysis to compare the location of DOE SBIR/STTR awardees relative to the closest national lab and explore variation in clustering for each laboratory. These descriptive data show little statistically significant evidence that the SBIR/STTR firms cluster around the DOE national labs. One exception was the National Renewable Energy Laboratory in Colorado, which is associated with a cluster of SBIR/STTR-awarded firms. However, some DOE national labs (such Los Alamos or Oakridge), specifically placed far from population centers for strategic reasons, have, unsurprisingly, little to no cluster of SBIR/STTR activity nearby.
COLLABORATION PATTERNS FOR AWARDEES
Collaborations between firms and research institutions are an important component of innovation. This section provides some descriptive statistics regarding geographic patterns of collaboration between firms and research partners. The committee was limited to analyzing collaborations between STTR firms and their research partners because data on collaboration between SBIR firms and their collaborators were not provided by DOE.
Previous National Academies reports have relied on survey data to understand patterns of collaboration between SBIR firms and research institutions (NASEM, 2016; NRC, 2008); however, these surveys had relatively low response rates and provided limited ability to provide inferences.6
As shown in Table 4-3, these previous surveys found that the share of SBIR firms with involvement of faculty (26 to 28 percent) and graduate students (20 to 21 percent) in universities was steady over the periods studied. At the same time, the percentage of projects linked to institutional partners increased from 34 to 43 percent between the two surveys, and the percentage of projects subcontracting R&D to these partners increased from 18 to 29 percent. A subsequent internal DOE study corroborated the growing importance of research institution partnership for SBIR firms, finding that by FY 2014 about 55 percent of SBIR Phase II awards included funding for an institutional R&D partner (DOE, 2015). The internal DOE study also found that STTR Phase II firms allocated an average of 44 percent of all STTR Phase II funds to institutional R&D partners, well above the statutory requirement of at least 30 percent (DOE, 2015).
___________________
6 The 2016 report is based on a 2014 National Academies survey of principal investigators from DOE SBIR and STTR Phase II awards granted from FY 2001 through FY 2010 (269 respondents, 25 percent response rate). The 2008 report is based on a 2005 National Research Council survey of award recipients of DOE SBIR Phase II grants awarded from FY 1992 through FY 2001 (157 respondents, 36 percent response rate).
TABLE 4-3 R&D Collaboration Reported by DOE SBIR Awardees Responding to National Academies Surveys
| Metric | 2008 NAS Report (2005 NRC Survey) | 2016 NAS Report (2014 NAS Survey) |
|---|---|---|
| Percentage of projects involving faculty | 26 | 28 |
| Percentage of projects involving graduate students | 20 | 21 |
| Percentage of projects linked to institutional partners | 34 | 43 |
| Percentage of projects subcontracting R&D to institutional partners | 18 | 29 |
| Time period | FY1992-2001 | FY2001-2010 |
| Overall survey response rate | 36% (157 respondents) |
25% (269 respondents) |
SOURCE: NRC, 2008; and NASEM, 2016.
In general, these previous findings indicate that firms that receive SBIR/STTR awards frequently participate in collaboration activities with universities. However, universities are only one of the three main types of nonprofit institutional R&D partner that SBIR/STTR awardees may choose. According to SBIR/STTR guidelines (SBA, n.d.d), FFRDCs, including the national laboratories sponsored by DOE,7 and domestic non-profit R&D organizations such as Battelle Memorial Institute are also eligible institutional R&D partners for awardee firms.
To explore the pool of potential collaboration partners for STTR firms, including national labs, universities, and non-profit R&D organizations, the committee mapped the geographic distribution of the pool of prospective R&D partners for awardees and the location of awardees. Looking at these distances helps identify possible barriers to collaborations associated with different types of eligible nonprofit R&D institutions and different types of firms. Prior research did not examine the partner selection preferences of woman-owned firms or firms owned by underrepresented minorities; hence, there is little available published research about the barriers that minority-owned and woman-owned SBIR/STTR awardee firms may encounter in selecting R&D partners.
The committee incorporated data from the Small Business Administration, the Federal Procurement Data System, and DOE that precisely identify the formal R&D partnerships associated with 948 STTR Phase I and Phase II awards from 1998 to 2017 in order to highlight critical differences in the
___________________
7 For a master list of all federally funded research and development centers, see https://www.nsf.gov/statistics/ffrdclist/.
partner selection preferences of minority-owned, woman-owned, and HUBZone-located small businesses.8
To compare the possible differences in partner preferences across firms with different types of owners, the present study introduced a new metric called average distance ratio, which is the dollar amount of the collaboration relative to the distance between the SBIR/STTR awardee and each collaborator. Average distance ratio is measured in dollars per mile ($/mi). This metric represents the average dollar amount of grant funding associated with an award, divided by the distance between the awardee firm and its R&D partner. From a coordination and efficiency standpoint, in an ideal case, an awardee would seek to maximize the amount of the grant and minimize the distance between its location and its partner’s location. As shown in Table 4-4, there are meaningful differences in the average distance ratio for different types of firm owners.
Data for Phase I awards show that minority-owned (6.6 percent) and HUBZone-located (4.6 percent) firms tend to select partners that are 213 to 259 miles closer than for non-minority-owned or non-HUBZone-located firms. However, woman-owned firms (6.8 percent) tend to select partners that are about 132 miles farther away than for non-woman-owned firms. In terms of average distance ratio for Phase II grants, for minority-owned firms, this ratio is $1,189/mi, while for woman-owned firms, this ratio is $896/mi. In comparison, for HUBZone-located firms, this ratio is $2,557/mi. The differences in these metrics suggest that woman-owned firms, in particular, seem to face greater difficulty in finding nearby R&D partners. For STTR Phase II grants, the average partner distance for HUBZone-located firms of 361 miles is less than half of the average partner distance for minority-owned firms or woman-owned firms.
As shown in Table 4-4, the average distance between an STTR Phase I awardee and its DOE national lab collaborator is 864 miles. At the same time, the average distance between an SBIR/STTR-awarded firm and the nearest DOE national lab is only 168 miles. This implies that DOE national labs, which tend to have broader and deeper expertise, may be much more difficult to reach and interact with on a regular, ongoing basis. Although DOE’s extramural R&D funding is highly concentrated in the national labs (67 percent) and universities (14 percent), the funding is widely dispersed across 1,287 units in these 630 institutions. Given the sheer number of institutions involved, finding the right R&D partner may be rather difficult, especially for first-time applicants to the SBIR/STTR programs. Given the geographic distances separating potential SBIR/STTR applicants from the pool of prospective R&D partners, providing applicants with historical data on the specific partners would be especially helpful
___________________
8 HUBZones as defined in the Code of Federal Regulations are historically underutilized business zones, which is an area located within one or more: (1) Qualified census tracts; (2) Qualified non-metropolitan counties; (3) Lands within the external boundaries of an Indian reservation; (4) Redesignated areas; (5) Qualified base closure areas; (6) Qualified disaster areas; or (7) Governor-designated covered areas. (U.S. Code, 2020.)
TABLE 4-4 Partner Distance Analysis of DOE STTR Phase I and Phase II Awardees, FY1998-2017
| Number of Observations | Percentage of Sample | Phase I | Phase II | |||||||
|---|---|---|---|---|---|---|---|---|---|---|
| Number of Phase I Grants | Average Award Amount (dollars) | Average Partner Distance (miles) | Ration of Amount to Distance (dollars/mile) | Number of Phase II Grants | Average Award Amount (dollars) | Average Partner Distance (miles) | Ratio of Amount to Distance (dollars/mile) | |||
| Partner Type | ||||||||||
| Nonprofit | 60 | 6.3 | 50 | 107,543 | 708 | 152 | 10 | 687,537 | 414 | 1,659 |
| University | 618 | 65.2 | 443 | 120,790 | 615 | 196 | 175 | 841,375 | 698 | 1,205 |
| National lab | 270 | 28.5 | 185 | 112,572 | 864 | 130 | 85 | 791,640 | 1,007 | 786 |
| Overall sample | 948 | 100.0 | 678 | 117,571 | 690 | 170 | 270 | 821,499 | 785 | 1,047 |
| Ownership | ||||||||||
| Minority-owned | 63 | 6.6 | 43 | 123,170 | 491 | 251 | 20 | 959,868 | 807 | 1,189 |
| Not minority-owned | 885 | 93.4 | 635 | 117,192 | 704 | 167 | 250 | 810,518 | 783 | 1,035 |
| Woman-owned | 64 | 6.8 | 46 | 131,439 | 813 | 162 | 18 | 814,129 | 909 | 896 |
| Not woman-owned | 884 | 93.2 | 632 | 116,562 | 681 | 171 | 252 | 822,022 | 776 | 1,059 |
| HUBZone | 44 | 4.6 | 28 | 139,718 | 442 | 316 | 16 | 922,775 | 361 | 2,557 |
| Non-HUBZone | 904 | 95.4 | 650 | 116,617 | 701 | 166 | 254 | 815,170 | 811 | 1,005 |
SOURCE: Committee calculations based on data obtained from the Small Business Administration.
to new applicants. Currently, information on research partners is available only for STTR awards, even though SBIR awards vastly outnumber them. New applicants may be unaware of or unfamiliar with nearby research institutions that possess the relevant expertise and capabilities for commercializing energy-related technologies. Ideally this information would be made publicly available as additional searchable fields linked to the Small Business Administration’s existing SBIR/STTR award and company listing databases. DOE provides a link on its SBIR/STTR website to the Lab Partnering Service, an online tool designed to link investors with experts and resources at DOE labs but which can also be valuable resource for SBIR/STTR applicants.9 The Lab Partnering Service tool may provide a template upon which to build a resource for helping firms identify research partners beyond the national labs.
By making it easy for applicants to find and connect to eligible research partners, DOE may be able to substantially improve the breadth and depth of its applicant pool. Virtual mentoring programs may also help connect national labs with SBIR/STTR applicants. Geographic distance may be a substantial barrier for many awardee firms, and online technologies may offer a cost-effective way to bridge the distances between awardees and suitable research partners. Given the potential budget, personnel, and time resource constraints, the SBIR/STTR Programs Office could build upon existing capabilities for supporting procurement from small, minority-owned businesses, such as the Mentor-Protégé Program.
DOE has very recently introduced the National Lab Strategic Partnership Project SBIR/STTR Agreement template to assist firms in entering into partnership agreements with national labs. Finalizing such agreements can be difficult and time-consuming, so the introduction of this template should benefit awardees substantially. Currently, Brookhaven National Laboratory, Ames Laboratory, and Argonne National Laboratory have adopted the template, and others are expected to follow.
ROLE OF MULTIPLE AWARD RECIPIENTS
MARs have been a source of controversy in evaluating SBIR/STTR since at least the 1992 reauthorization (Public Law 102-564) (GAO, 1992). Lerner’s (2000) use of the pejorative label, “mills,” reflected concern that agency awards to repeat winners may hinder SBIR program’s ability to meet its objectives. As discussed in Chapter 1, this view of MARs reflects a narrow view of the program—that the program is primarily a signaling mechanism to help address financing constraints facing small businesses. This perspective does not take into account other programmatic goals such as using small businesses to meet the agency’s mission needs. A debate among scholars and administrators has emerged as to the role played by MARs in meeting SBIR/STTR objectives. The remainder of this chapter provides some descriptive statistics around MARs and
___________________
9 See www.labpartnering.org.
discusses the role that MARs may be playing. Although a large share of DOE SBIR/STTR funding goes to repeat award winners, the committee did not find this necessarily to be a problem. To the contrary, as discussed in Chapter 2, MARs may be providing high levels of value in the innovation outcomes and in their role as partners for DOE in meeting critical agency mission needs.
To date, there are few empirical studies in the literature that explicitly examine MARs. There are two likely explanations for this. First, evaluating the commercial and other economic outcomes of MARs is very difficult, especially given that those outcomes may span a range of activities from repeat transactions that reflect agency procurement of specialized equipment to investments in solving fundamental research problems. Second, there is no consensus in the literature regarding how many awards constitute a MAR, much less any understanding of how to analyze them beyond eliminating these firms from the sample or separating them with a dummy variable. Table 4-5 presents some of the current definitions of MARs in the literature, along with the committee’s proposed definition.
One of the primary concerns expressed in the literature about MARs is that they may depend on the SBIR/STTR programs for a disproportionate share of their revenue and do not seek other forms of revenue outside of the program (Howell, 2015). For the Department of Defense, recent work has shown that 78 percent of MARs receive over half of their federal contracting revenue through SBIR (Tingle, 2016). Tingle suggests that this reliance dims commercialization prospects for the MARs. His work builds on Lerner (2000) who found that, while SBIR winners received higher levels of venture capital than non-winners, those effects diminished with additional awards. Lerner’s work brought into question a 1998 finding by the Government Accountability Office that MARs and non-MARs commercialized at identical rates.
More recent studies of MAR commercialization present conflicting evidence. A previous National Academies study found that, at least among
TABLE 4-5 Definitions of Multiple Award Recipients (“Mills/MARs”) in the Literature
| Study | Definition |
|---|---|
| GAO (1998) | 1 Phase I award + 15 or more Phase IIs in the preceding 5 years |
| Lanahan and Armanios (2018) | 1.5 total awards per year |
| Howell (2015) | 50 or more awards across all agencies |
| NRC (2008) | 15 or more awards and more than 1 per year |
| Committee Proposal | 1 Phase I award + 15 or more of any SBIR/STTR awards in the preceding 5 years |
NOTE: GAO = Government Accountability Office; NRC = National Research Council.
Department of Defense SBIR firms, MARs had higher average commercialization records than non-MARs (NRC, 2008). Meanwhile, Link and Scott (2009) found the opposite result. Both evaluations relied on survey data (NRC, 2008) and binary indicators of commercialization as a measure of economic outcomes (Link and Scott, 2009). Howell (2015) corroborated the negative findings for MARs with more rigorous data and methodology. She used administrative data on SBIR awards and applications within DOE to demonstrate that first-time winners were much more likely to commercialize and to receive venture capital than those with multiple awards. While the direct economic impacts of investment in DOE SBIR/STTR MARs are difficult to measure, there may be other benefits. For example, there is anecdotal evidence that SBIR/STTR MARs license inventions to former employees who spin out firms, but it is difficult to secure reliable licensing data. To the committee’s knowledge, only Lanahan and Armanios (2018) attempted to measure MAR impacts outside of the narrow view of commercial performance, showing that winning SBIR/STTR awards from multiple agencies (“certification broadening”) generally increased a firm’s ability to acquire private follow-on funding.
Missing from these analyses is an assessment of MARs performance on important non-commercial outcomes, such as meeting procurement needs and providing specialized research. As discussed in Chapter 1, there are multiple and conflicting objectives for the SBIR program as defined in the legislation and in the Small Business Administration’s stated goals, which identify research and development needs of a federal agency as a key objective of the program. While the literature has viewed SBIR as a small business finance program aimed at new firms with high growth potential, it is clear from the legislation authorizing SBIR and the stated goals of the program that the program was intended to have a broader impact.
Concentrations of MARs vary depending on awarding agency and definition of MAR (see Table 4-5). Reich (2013) reported that 1 percent of SBIR award winners accounted for 13 percent of total funding across all mission agencies. For DOE specifically, Howell (2015) reported 59 total DOE MARs based on the fairly restrictive definition of 50 or more total SBIR awards across all agencies. The most important distinction in these studies’ definitions hinges on whether definitions are based on award density or award count. Raw counts of awards such as Howell’s (2015) may not be appropriate: some firms may earn a large number of awards in a short time period and then outgrow the program. Using award densities to determine a MAR alleviates this issue; however, award densities may over-identify younger firms as MARs (since a three-year old firm that wins six awards in three years gets the same MAR status as a 30-year-old firm with 60 awards). GAO (1998) defines a MAR as a Phase I SBIR/STTR winner that has received 15 or more Phase II awards in the preceding five years.
Given the relatively small size of DOE compared to the Department of Defense or the Department of Health and Human Services, the committee broadened the Government Accountability Office’s MAR definition to be a Phase I SBIR/STTR winner that has received 15 or more awards of either type (Phase I
or II) from any agency in the preceding five years. With this definition, although MARs represent a small share of DOE award winners, their impact on the distribution of total funding is substantial.
Of all SBIR/STTR awards granted from 1983 through March 2018, 13 federal agencies granted 166,431 awards to 24,974 firms. DOE granted 11,999 of these awards to 2,563 unique firms during that same period. As shown in Table 4-6, very few DOE awardees qualify as MARs. The vast majority of DOE SBIR/STTR Phase I firms have earned fewer than 10 awards and only 1.2 percent have earned 50 or more. At the same time, the share of funding going to MARs is disproportionately large, although it has declined since 2012. The total share of DOE SBIR/STTR funding to MARs peaked at about 45 percent in 2011, declining to about 30 percent after the 2012 programmatic change limiting applicants to submitting 10 or fewer applications for each funding opportunity announcement.
The committee noted two concerns regarding MARs. First, very few MARs are owned by women or underrepresented minorities. Only three firms owned by persons from socially and economically disadvantaged groups and three woman-owned firms have received more than 10 DOE awards. A second concern is that MARs may be crowding out funding to first-time SBIR/STTR award winners, which are likely to be young firms. The share of first-time winners for DOE SBIR/STTR Phase I and Phase II awards has hovered around 10 percent (sometimes dropping to about 5 percent) since FY 2005. A larger proportion of firms was first-time applicants at the start of the SBIR program, and the share of awards to first-timers has not reached 20 percent since 1990. Figure 4-4 shows the number of first-time and overall DOE Phase I SBIR/STTR awards. DOE has consistently awarded between 10 to 20 percent of its Phase I awards to first-time recipients from FY 2005 to FY 2017.
Additionally, the committee distinguished between firms that specialize in winning awards from one agency and firms that receive awards from multiple
TABLE 4-6 Number of DOE SBIR/STTR Awardee Firms, by Award Count, 1983 to March 2018
| Number of Awards Received | Number of Awardee Firms in this Range | Awardee Firms in this Range, as a Percentage of All Awardee Firms |
|---|---|---|
| <3 | 1,630 | 63.6 |
| 3-9 | 706 | 27.6 |
| 10-19 | 130 | 5.1 |
| 20-29 | 65 | 2.5 |
| 50-99 | 24 | 0.9 |
| 99+ | 8 | 0.3 |
| Total | 2,563 | 100.0 |
SOURCE: Committee calculations based on data obtained from the Small Business Administration.
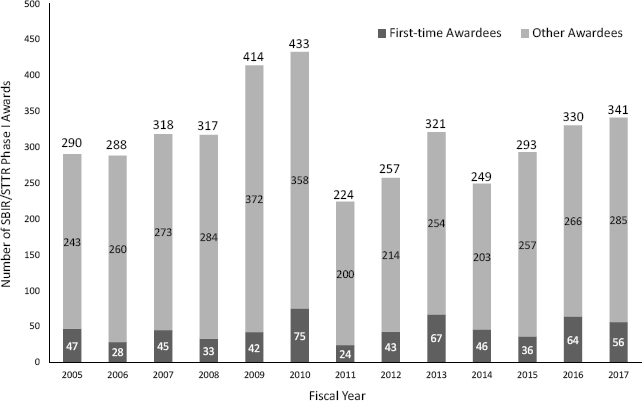
SOURCE: Committee calculations based on data obtained from the Small Business Administration.
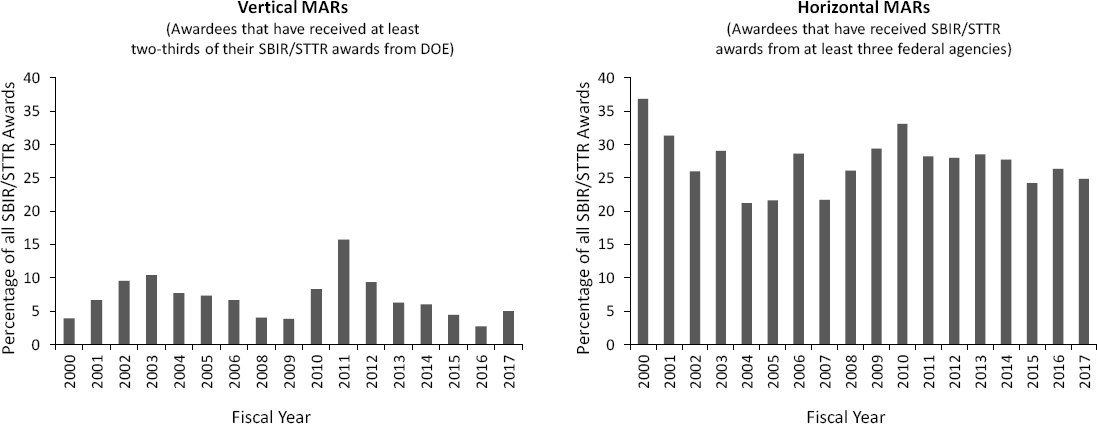
agencies. The committee termed firms specializing and receiving most of their multiple awards from a single agency “vertical MARs,” compared to “horizontal MARs” which receive awards from many agencies. Specifically, the committee stratified awards to MARs into two types: “vertical” MARs that win at least two-thirds of their awards from DOE and “horizontal” MARs that earn awards from at least three different federal agencies. Chapter 3 provides qualitative evidence suggesting that vertical MARs may be working to expand agency research capacities beyond what a typical SBIR/STTR awardee can accomplish or may have an established familiarity with the needs of a particular program office. On the other hand, more horizontally oriented firms may be searching for awards across multiple agencies to leverage their existing technologies into new fields or may be taking advantage of their familiarity and skill with the application process.
As shown in Figure 4-5, the bulk of DOE MARs go to those who accumulate awards horizontally across at least three different awarding agencies. MARs that leverage multiple agencies have accounted for 25 to 35 percent of total DOE awards since 2000. The share of awards to vertical DOE MARs is much smaller, although most awardees have won awards from more than one agency—only 880 out of the 2,563 DOE awardees (34 percent) have won awards from DOE alone.
This difference in concentrations of MARs between the two categories (vertical and horizontal) represents a new framework for analyzing the
SOURCE: Committee calculations based on data obtained from the Small Business Administration.
contributions of multiple recipients. Many program offices at DOE rely on repeat SBIR/STTR winners to help them function in specific ways that lead toward meeting agency mission needs. As shown in Table 4-7, a number of repeat winners were identified by DOE program managers as successes, often because they supplied specialized equipment and instrumentation for national labs. Discussions with high-volume award winners also indicate that certain firms acquire expertise, and even hire specialists, in SBIR/STTR application writing.10 This latter form of MAR may be responsible for some of the negative attention MARs receive for adopting a “shoot anything that flies” model.
FINDINGS
Finding 4.1: The SBIR/STTR programs help to diversify the geographic reach of DOE research activities.
Finding 4.2: The DOE SBIR/STTR programs attract only a small number of successful applications from businesses that are (a) woman-owned, (b) minority-owned, or (c) from underrepresented states. Moreover, neither the DOE SBIR/STTR programs nor the review and solicitation processes have made a measurable impact in increasing the incidence of successful applicants from these groups since 2012.
Finding 4.3: The DOE SBIR/STTR programs attract only a small fraction of successful applications from businesses that are new to the program. After programmatic changes in 2012, there was an uptick in the number of new awardees. Thirty percent of funding still goes to multiple award recipients.
Finding 4.4: Finding the right research partner may be difficult, especially for first-time applicants.
Finding 4.5: Woman-owned STTR-awarded firms have a research partner that is, on average, substantially farther away than overall STTR awardees.
RECOMMENDATIONS
Recommendation 4.1: The DOE SBIR/STTR Programs Office should provide additional information to prospective applicants regarding the pool of prospective R&D partners.
Recommendation 4.2: The Secretary of Energy and the SBIR/STTR Programs Office should collaborate on deploying virtual mentoring programs to connect the national labs with SBIR/STTR applicants.
___________________
10 See Appendix A for committee meeting agendas.
TABLE 4-7 DOE SBIR/STTR Success Stories Identified by DOE Program Managers
| Firm | Commercialized Product | Award Years | Total DOE Award Count | DOE Award Amount (Dollars) | Additional Information |
|---|---|---|---|---|---|
| Burge Environmental | MiProbe environmental sensor | 2006-2019 | 15 | 6,455,168 | Collaborates with CEC Inc. on the development and deployment of the MiProbe environmental sensor |
| CTI Molecular Imaging | Gene expression scanners | 1985-1997 | 8 | 2,024,723 | Acquired by Siemens 2005 |
| Dirac Solutions, Inc. | Battery-free RFIDs for secure communications | 2011-2017 | 5 | 2,438,116 | |
| Euclid Techlabs | Particle accelerators for high-energy and nuclear physics applications | 2002-2017 | 69 | 25,800,000 | |
| Heliotrope | Nano-structured window coatings | 2013-2014 | 2 | 1,150,000 | |
| Kitware | Custom software and R&D | 2010-2019 | 43 | 19,522,830 | |
| Mikro Systems, Inc. | TOMO Technology | 2009-2016 | 7 | 4,398,865 | Signed collaborative technology licensing agreement with Siemens |
| Nanograf (Sinode Systems, Inc.) | Faster and longer charges for lithium-ion batteries | 2013-2014 | 2 | 1,150,000 | Received $17.3 million in follow-on funding |
| Niowave | Battery technologies | 2007-2019 | 53 | 26,274,617 | Received $3 million in follow-on funding |
| Optimal Solutions Inc. | Software for managing supply chains | 2012-2017 | 4 | 1,529,999 | |
| Radiabeam Technologies | IOTA quadruples and steering magnets | 2004-2019 | 94 | 40,435,749 | Has received multiple Phase III contracts from DOE labs |
| Reservoir Labs, Inc. | Cybersecurity for high-speed computing networks | 2004-2017 | 20 | 9,886,880 | |
| Silicon Audio LLC | Seismic sensors for seismic events or nuclear explosion | 2008-2016 | 4 | 1,987,066 | |
| Skutek Instrumentation | Multichannel digitizer for experiments in nuclear physics | 2003-2017 | 7 | 3,530,953 | |
| Tetramer Technologies | Membrane technologies | 2003-2018 | 16 | 8,429,197 | |
| Xia LLC | Radiation digitizers for spectroscopy | 1990-2017 | 42 | 14,300,000 |
SOURCE: Small Business Administration, Department of Energy, and Crunchbase.
This page intentionally left blank.


